Article

Horizontal Distribution of Cadmium in Urban Constructed Wetlands: A Case Study

College of Environment and Resources, Southwest University of Science and Technology, Mianyang 621010, China
*
Author to whom correspondence should be addressed.
Sustainability 2021, 13(10), 5381; https://doi.org/10.3390/su13105381
Submission received: 24 March 2021 / Revised: 3 May 2021 / Accepted: 10 May 2021 / Published: 11 May 2021

Abstract

:
Here, we used a radioactive distribution approach for water samples from the Liu Shao Yan constructed wetland to investigate the horizontal advection of cadmium (Cd) in this urban constructed wetland. The objective of this study was to assess the effectiveness of Cd removal in constructed wetlands. Additionally, this study examined the factors affecting the horizontal distribution of Cd. Sediment samples were collected from an enclosed wet area. A predictive advection model was executed using a combination of observed Cd concentrations and predicted Cd concentrations from a genetic algorithm–backpropagation artificial neural network (GA–BPANN). A coefficient of variation was used to assess differences in Cd distribution due to flow rate, precipitation, and water plants. Scanning electronic microscopy–energy dispersive spectrometry (SEM–EDS) results suggested that the plant species Pontederia cordata could absorb Cd, but the influence was negligible. All plants investigated in our experiment were unsuitable for Cd removal. However, predictions from the GA–BPANN algorithm indicated that 13–25% of Cd loading was efficiently removed by constructed wetland, which mainly resulted from sediment sorption, bacterial uptake, and the dilution caused by water advection. Consequently, we conclude that the constructed wetlands are an environmentally friendly and cost-effective technology that can remove Cd to a certain extent.

1. Introduction

Water pollution has become an increasingly severe problem due to accelerated urbanization [1,2,3,4,5]. Water shortage has always been a tremendous obstacle to development in southwest China [6,7,8]. Urban constructed wetlands play a vital role in planning water utilization and water consumption control for southwestern Chinese cities [9,10].
Constructed wetlands are a well-established technology applied in many areas [11] for processing water used in urban landscapes and are flourishing in various Chinese cities [12,13]. Constructed wetlands are characterized by the following:
  • High efficiency and low costs: High-efficiency removal of nitrogen and phosphorus [14,15] with low costs due to maintenance and degradation of hydrocarbons [16];
  • Reclamation of wastes: Permits wastewater to be used as a water source in wetland ecosystems [17];
  • Economic output: Serves as a production base for economic crops and medicinal plants [18];
  • Landscape value: Landscaping designed for environmental purposes;
  • Extensive applications: Applicable for urban development zones, rural farms [19], and pollutant discharge areas.
Wetland substrates and plants greatly influence the efficiency of pollutant purification. According to a study by Yao et al. (2009), the phosphorus removal efficiency in a wetland can be increased by 81.5% if ceramsite is used as the substrate instead of gravel [20]. Brooks et al. (2000) found that 80% to 96% of the phosphorus load can be removed using paved wollastonite as the wetland substrate [21]. Singh et al. (2020) discovered that the treatment effect of acid mine drainage could be improved using organic matter as a substrate [22]. According to our previous study [23], the heavy metals cadmium, mercury, and lead were found upstream of the constructed wetlands investigated in this paper. However, a preliminary test showed that only cadmium levels exceeded the national standard in the constructed wetland. Therefore, cadmium was the focus of the present analysis. Cheng et al. (2002) found that vertical flow constructed wetlands can reduce water cadmium content by 94% [24]. Sardar et al. (2009) found that the use of constructed wetlands combined with plants for cadmium from industrial wastewater could reduce water cadmium concentration by 91.9% [25]. Liu et al. (2007) found some plants could accumulate 19.85% of the cadmium from water with 0.5 mg L−1 cadmium [26]. Leung et al. (2017) also found that after treated by a constructed wetland, the concentration of Cd—containing wastewater is quite different [27]. However, Laurence et al. (2017) implied that plant accumulation of heavy metals in constructed wetlands is almost negligible. In their study, plant accumulation and sediment adsorption combined removed only 9% of cadmium [28]. Tehreem et al. (2020) compared four plants that adsorbed different heavy metals and found cadmium was the most difficult to adsorb by plants, and the removal efficacy of cadmium is 60–96% [29]. Given the high toxicity of cadmium, it is necessary to evaluate the cadmium removal efficiency of the Liu Shao Yan wetland parks.
Using plants to treat sewage is an environmentally friendly technology. Plants in constructed wetlands can increase the dissolved oxygen content of the water due to the radial oxygen loss [30,31], preventing the production of oxygen-depleted malodorous black water and maintaining hydraulic conductivity [32]. They also provide attachment sites for microbial biofilms. Constructed wetlands cause high carbon emissions in the form of methane and carbon dioxide [33,34], as well as low nitrous oxide emissions [35]. These observations are worth considering when developing future constructed wetlands.
An artificial neural network (ANN) algorithm is a modeling method that uses the principle of bionics to simulate the information transfer process of the human brain [36,37,38]. Currently, there are more than 40 neural network models based on ANN algorithms, including BP–ANN, multilayer perceptron (MLP), self-organizing mapping (SOM), Hopfield network (HN), Boltzmann machine (BM), and adaptive resonance theory (ART). MLP and SOM are ANNs that can convert data from any dimension into a one-dimensional or two-dimensional discrete map. These types of algorithms allow data to be used for classifying the perception of a multilayer image. HN is a recurrent neural network (RNN) that is suitable for natural language processing. BM and ART are professional neural networks that are specially designed for energy calculations and autonomous environment interactions. Moreover, RNN and convolutional neural networks (CNNs) are employed in deep learning algorithms and have also been implemented in parallel with ANN. RNN and CNN usually are employed for programming fundamentals [39,40,41]. In contrast, ANN is simpler and used in the majority of application problems, including water quality evaluations [42,43], water quality predictions [23], and water quantity estimations [44,45]. Based on typical applications of ANN models, BP–ANN was selected as the most adequate prediction model for the present study.
The initial weight value and threshold of a BP neural network are generated randomly. Thus, predicted results might be significantly affected by the initial weight and threshold values. In general, a BP neural network outputs a local minimum instead of the global minimum [46]. A genetic algorithm-backpropagation ANN (GA–BPANN) is implemented to avoid this problem. GA–BPANN improves the calculation accuracy by optimizing the BP algorithm. The GA algorithm encrypts the randomly generated initial weight and threshold values from the BP algorithm with real numbers to form a set of ordered chromosomes. Based on this set of ordered chromosomes, an iterative solution is obtained through chromosome exchange, mutation, and inheritance [47,48]. The GA algorithm uses a unique fuzzy logic algorithm to encrypt the population that is established between the initial weight value and the threshold from the BP network into a chromosome population. The GA algorithm iterates by evolving the BP network to reproduce the next generation of the coding population with a changing element. The coding population with the least number of errors is selected and reassigned to the BP network for the next round of population iteration. By iterating in a systematic order, the outcome from a defined number of iterations is obtained. In this paper, GA–BPANN is adopted to predict Cd contents in the horizontal direction.
This paper aims to assess the effective rate of Cd removal in an urban constructed wetland. The estimated horizontal Cd migration in the Liu Shao Yan constructed wetland by combining ANN predictions with the observed horizontal Cd distribution in the constructed wetland. Additionally, potential determinants of the effective rate of Cd removal are assessed by analyzing factors such as plant type and self-purification of the water body. Moreover, factors that lead to differences in the horizontal Cd distribution are discussed. We found that the adsorption of cadmium by the main plants in the constructed wetland was negligible, and the Cd content was mainly diluted and advected by water flow, and the concentration decreased by 13–25%.

2. Materials and Methods

2.1. Data Acquisition

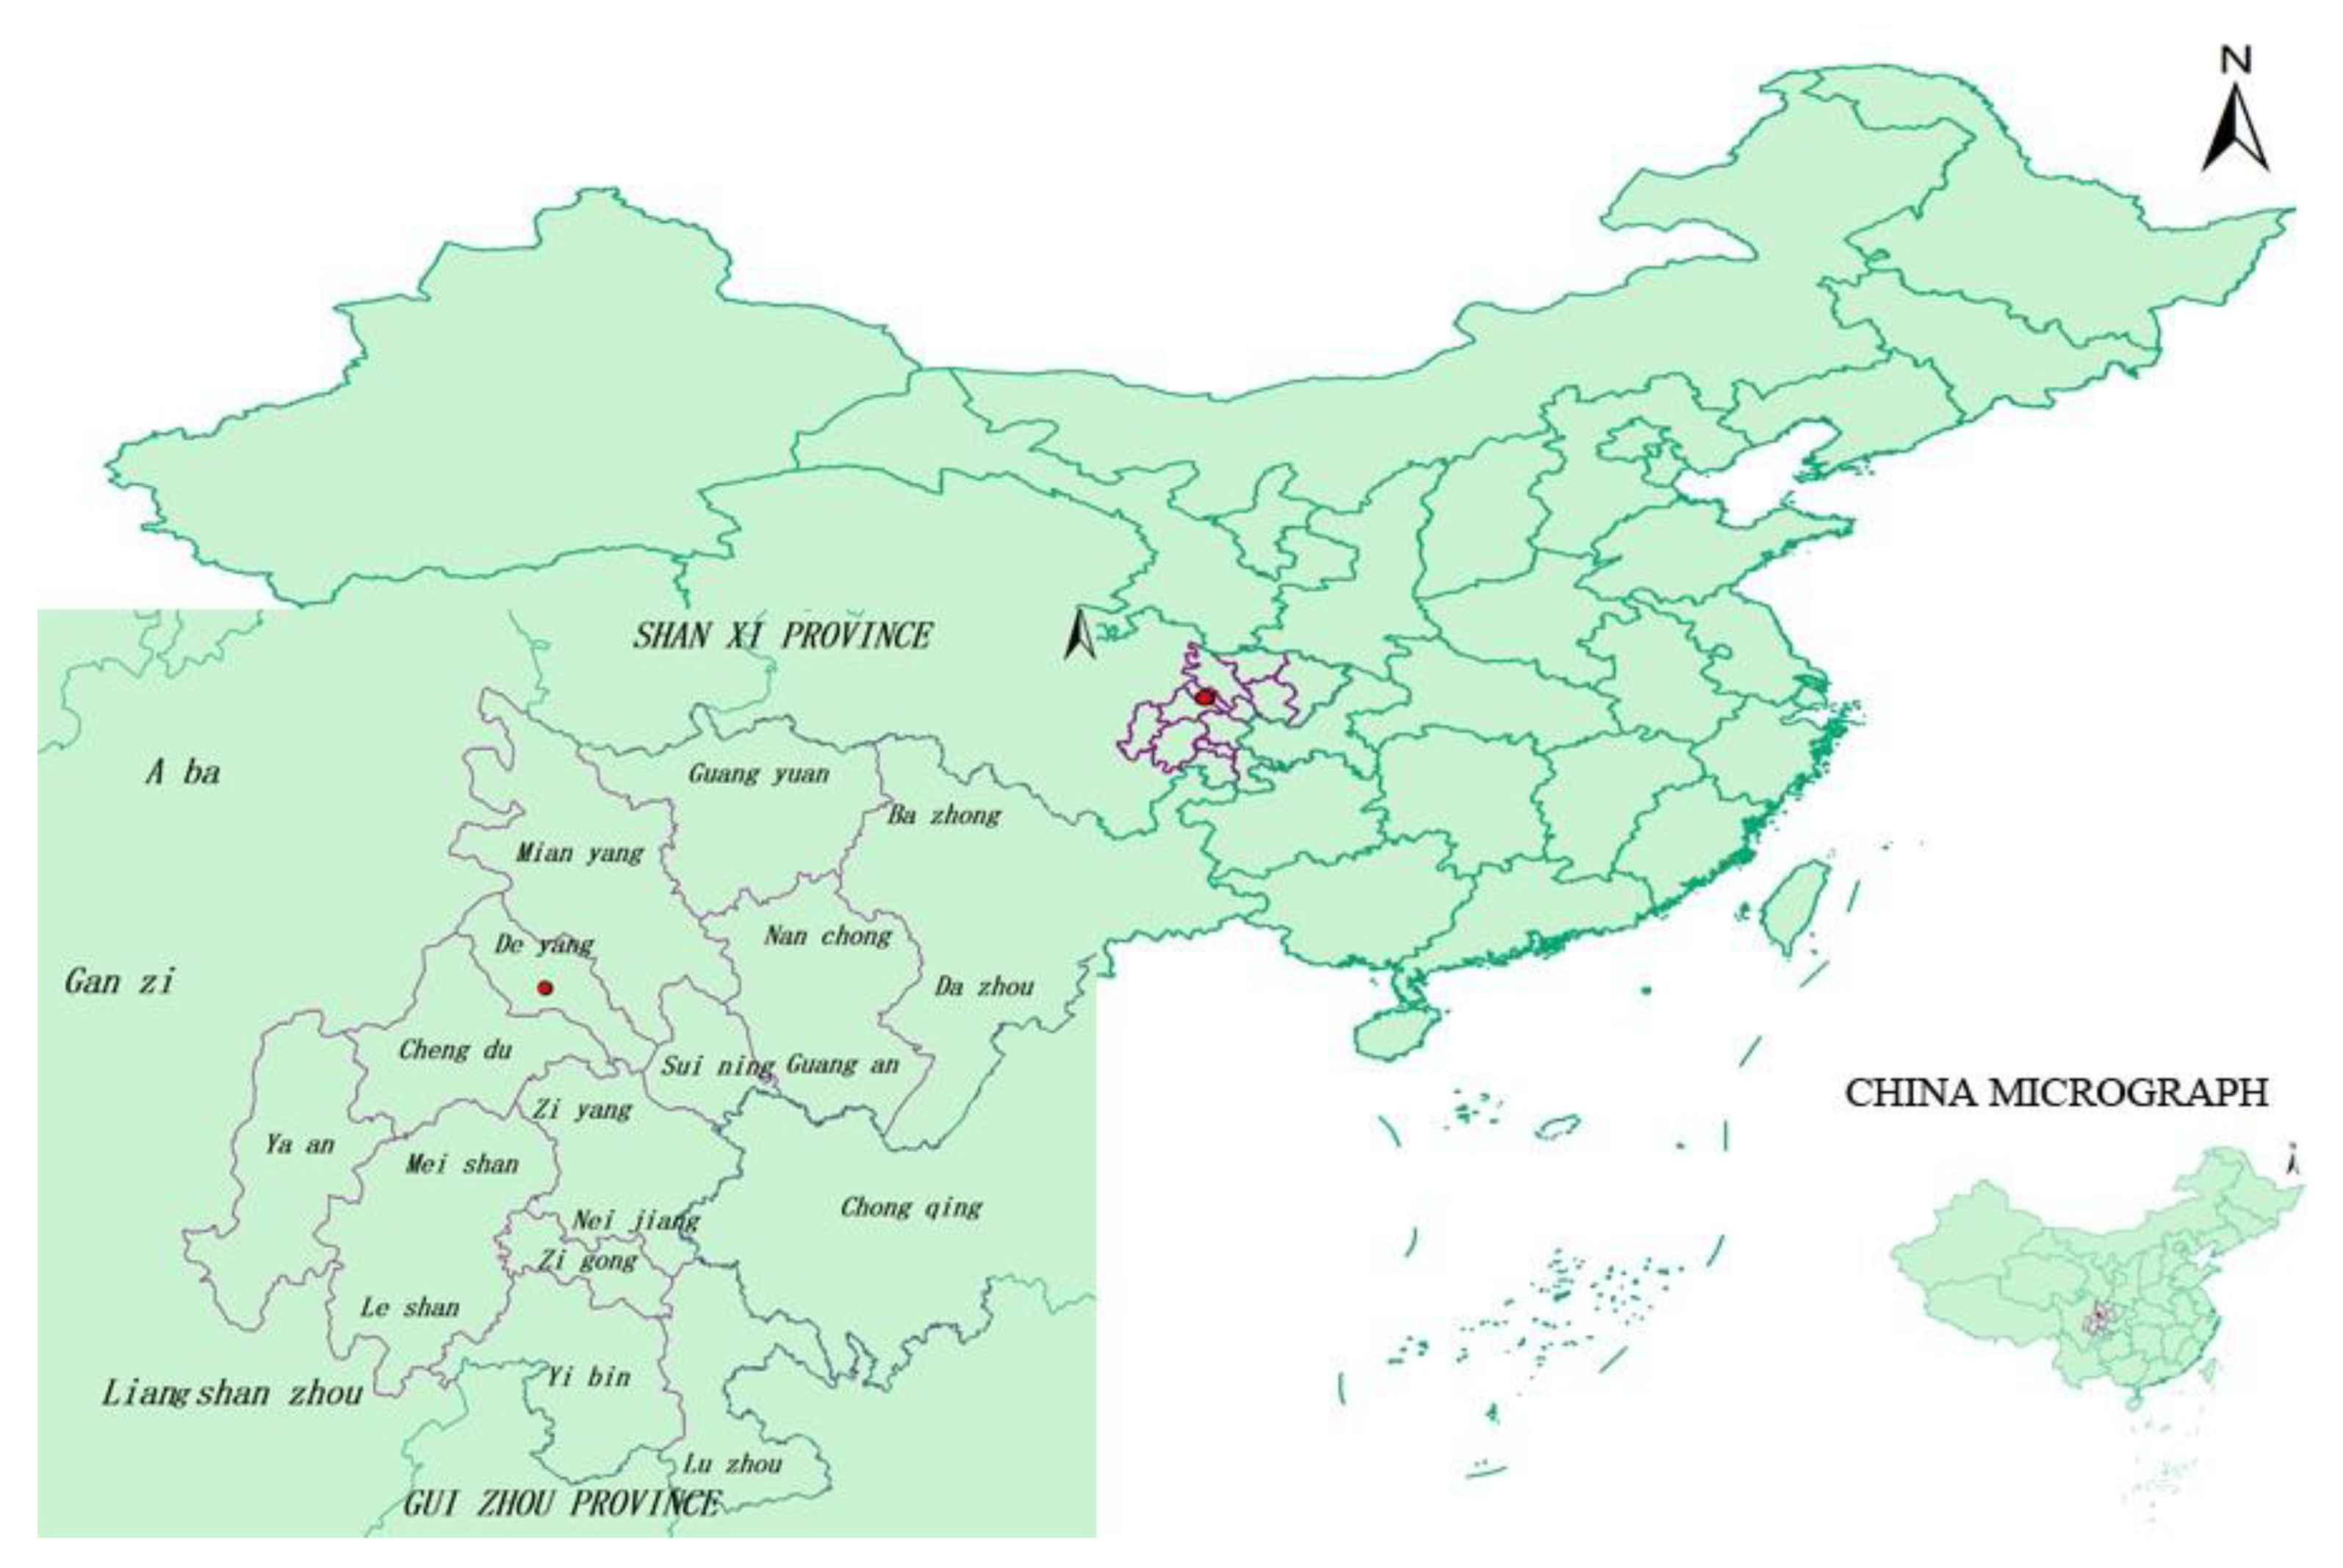
Located in Deyang, Sichuan, southwest China, the Liu Shao Yan constructed wetland (Figure 1 and Figure 2) has a projected water surface area of 70,000 m2 and a water storage capacity of 730,000 m3. It has an approximate maximum depth of 4 m and a maximum width of 150 m. This wetland is a vital water base for cultivating algivorous insects and planting emergent aquatic plants in Deyang. Cd pollution was caused by the phosphorus industry upstream of the wetland [23]. Sampling points were established in a radial mesh network with the Liu Shao Yan wetland inlet as a data point. The Liu Shao Yan Lake is composed of Zone A and B (Figure 1). The water inlet and outlet are in Zone A, while Zone B is a side basin. Zone A covers an area about three times the area of Zone B, and Zone B is mainly stagnant and poorly mixed. Therefore, sampling points were sparsely distributed in Zone A and densely distributed in Zone B. The sampling points were successively numbered from LS-1 to LS-21. A plant sample was collected at LS-P, LS-10 was the water inlet, and LS-19 the water outlet. Sediment samples were collected at the water inlet, water outlet, and sampling points LS-1 to LS-7 in Zone B because of the slow water motion in Zone B. The wetland is located in southwest China, the upper reachers of the yangtze river (Figure 2).
Cd was the only pollutant tested in the present study. The sampling process was performed in strict accordance with the relevant monitoring technical specifications and national standard methods concerning surface water [49]. The water flow was obtained using a River flow meter (SL-50B, Sheng Rong Instrument, Nanjing, Jiangsu, China). Water samples were delivered to the laboratory directly after sampling and analyzed within 24 h using inductively coupled plasma optical emission spectroscopy (ICP-OES, Thermo iCAP6500, Thermo Fisher, Waltham, Massachusetts, America). Plant samples were analyzed using a scanning electron microscope–energy dispersive spectrometer (SEM–EDS, TM4000, Hitachi, Tokyo, Japan).

2.2. Establishment of the Artificial Neural Network

The GA–BPANN algorithm predicts the horizontal distribution of Cd in the Liu Shao Yan wetland. The Cd concentrations of our water samples were used as model training concentrations. GA–BPANN was implemented using the software MATLAB (version 2016a) and had one input node, 12 hidden layers, and one output node. Additionally, mapminmax (X) was selected as the normalized function of data. The network self-learning time was set to 100 times (iterations), and the error limit was set to 10−3.

3. Results and Discussion

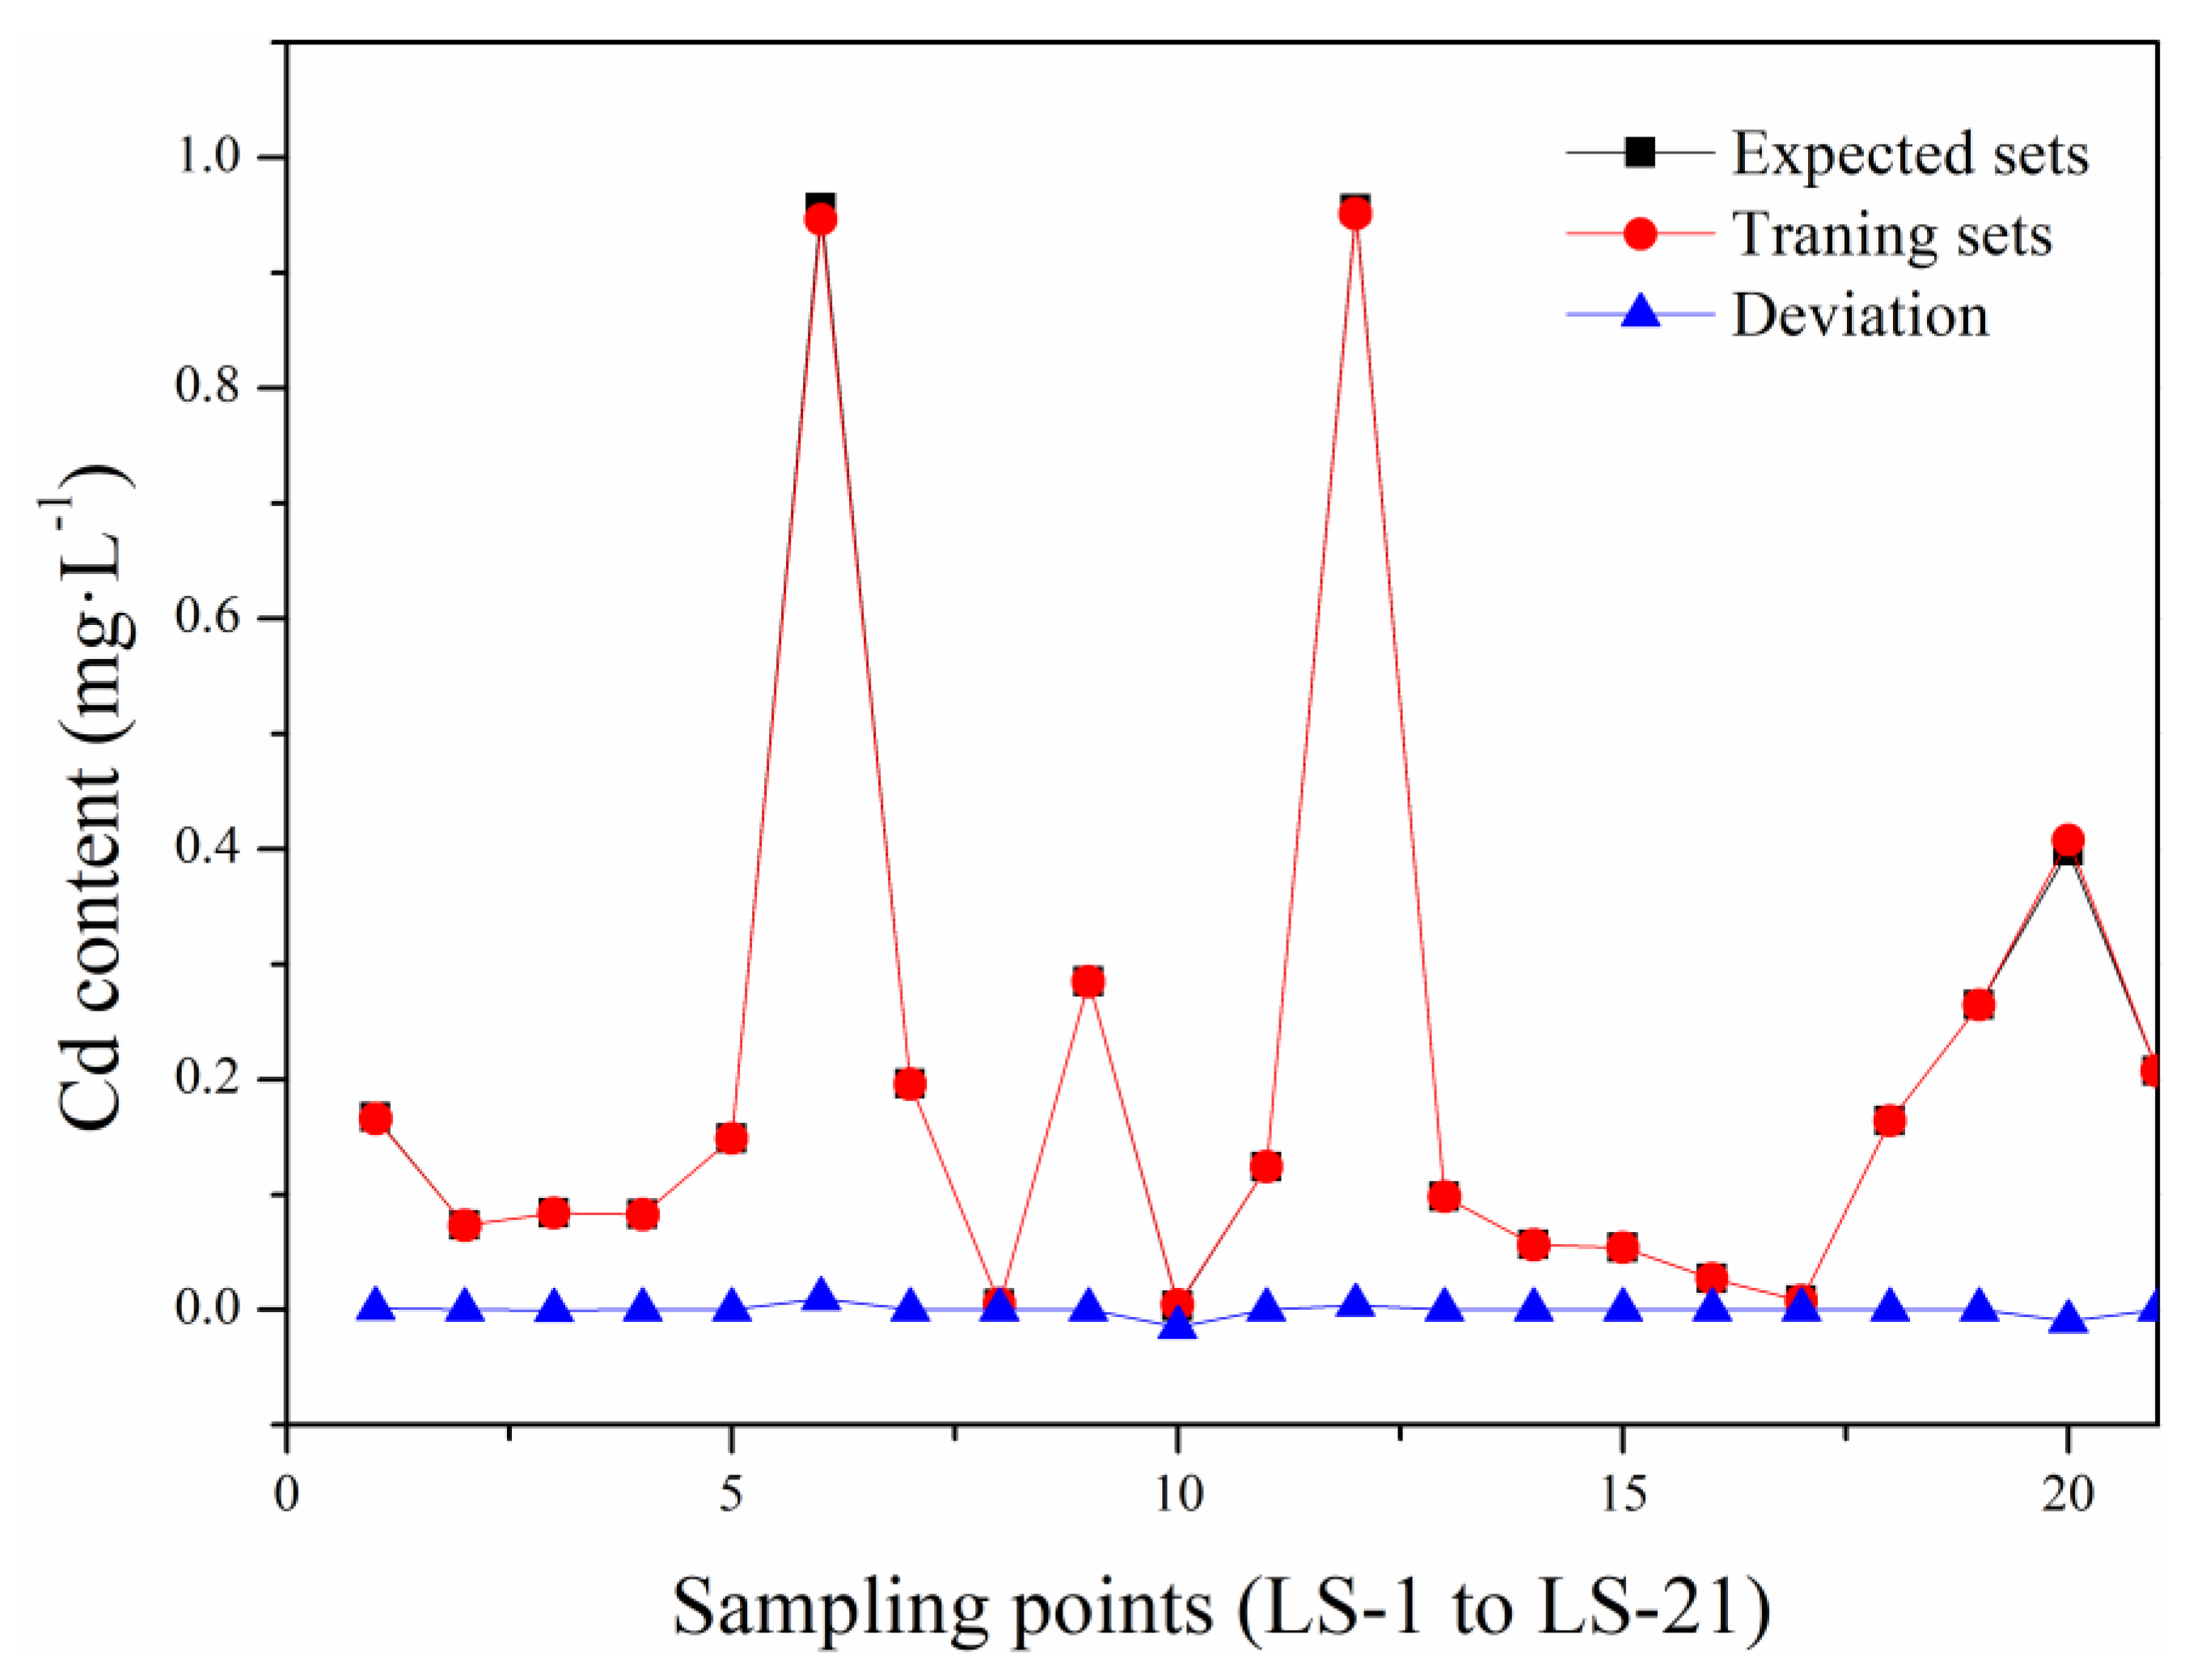
The Cd contents in the constructed wetland, analyzed by ICP–OES, are shown in Table 1. There are two different batches of samples that were collected at the same sampling point. Since we only had two groups of measured values, we considered data Ⅰ as the training sets and data Ⅱ as the expected sets (also called test sets) to compare with the training results to verify the model’s accuracy. Further, we considered data Ⅱ as the input data to forecast the output results. The training results and prediction results are shown in Table 2. Examination of Table 2 and Figure 3 indicates a good fit between the observed Cd concentrations and those predicted by the GA–BPANN algorithm.
Examination of Figure 4 indicated a low concentration of Cd in the middle of the Yan Shao Yan wetland and higher Cd concentrations on both sides. The maximum observed Cd concentrations were at LS-12 and LS-6, reaching 0.9565 mg·L−1 and 0.9555 mg·L−1, respectively. The minimum observed Cd concentration was 0.008 mg·L−1 at LS-17, which is a station far away from the water inlet on the opposite side of the wetland. According to the horizontal concentration advection (Figure 4.), three concentration advection paths could be found. These were the following:
  • Flow into Zone B: LS-10⟶LS-9⟶LS-8 and LS-14⟶B;
  • Flow to the lake center: LS-10⟶LS-15⟶LS-16⟶LS-17;
  • Flow to the outlet in Zone A: LS-10⟶LS-11⟶LS-12⟶LS-13⟶LS-20⟶LS-19.
These flow directions resulted from a bridge spanning LS-10⟶LS-15⟶LS-16 over the Liu Shao Yan wetland, with high terrain in the middle and low terrain at the north and south ends. The pH and water flow velocity were shown in Table 3. Moreover, the flow velocity was high along the northeast–southwest line of LS-8⟶LS-14 (i.e., 17 cm·s−1 at LS-8 and 10 cm·s−1 at LS-14) due to the narrowed lake surface, which caused Cd to accumulate in the isolated Zone B. A sharp decline in flow rate (7 cm·s−1) was measured at LS-6, located at the back of a prominent river bank. The overall flow rate dropped upon entering the enclosed Zone B. The high Cd concentration may be due to backflow at LS-6. Cd was advected slowly in the isolated Zone B, which experienced reduced flow. Point LS-1 in the lake’s center had the maximum water depth of about 4 m in Zone B. The maximum sediment Cd content was 0.4917 mg·L−1 at LS-1. No Cd was detected in sediment at the LS-6 sampling point, which had the highest water Cd concentration. However, Cd deposition was detected at the adjacent points LS-7 (0.0633 mg·L−1) and LS-1. We infer that sediments are transported down to the deeper LS-1 and LS-7 sampling points from the gentler slope at LS-6 with an inclined substrate that approaches the shore. The water flows slowly to LS-17 because the low terrains on both sides divert the flow. Consequently, the lowest Cd concentration was detected at LS-17, which was in a relatively stable water environment due to its closed feature and farthest distance from the outlet. Moreover, the flow rate of water along the river bank to the outlet slowed down (14 cm·s−1 at LS-11, 7 cm·s−1 at LS-12, and 4 cm·s−1 at LS-13) due to the great friction of the substrate close to the lakeside, although the terrain at the river bank was lower than that in the lake center. When reaching LS-13, the water flow was diverted into two channels. One flowed to the wetland outlet (LS-19), while the other reached LS-20 following the wind direction and resulted in an extremely high Cd concentration (0.3980 mg·L−1) before flowing to the outlet. According to sediment initiation theory [50,51], the experiment conducted by Lu et al. (2016) [52] showed that Cd concentration is uniform in the vertical direction due to the slow flow rate in the Liusaoyan wetland. Maximum flow rates were 17 cm·s−1, which was less than 25 cm·s−1. The distribution of Cd concentration in the horizontal direction is believed to be closely associated with water velocity and terrain that affects the velocity.
The pH value at the inlet was 8.19. All sampling points had water pH values between 7.8 and 8.6 (Table 3). Increases in pH may occur due to photosynthesis [53] and microbial metabolism [54]. The maximum pH value was observed at LS-2 (pH 8.64). Compared to LS-17 (pH 8.26), which was also in a stable Zone, LS-2 in Zone B provided water quality conditions that are more suitable for microbial growth and microbial photosynthesis, apart from its stabilization of water quality. Thus, pollutants could reach Zone B along a shorter path in a shorter time frame. Since Zone B was an isolated zone with a slower water flow velocity than Zone A, the decreasing Cd content of Zone B in our prediction (Figure 5) seems difficult to understand. However, the increasing pH of Zone B implied that microbes are active in this area, namely, some microorganisms in water can directly adsorb and indirectly stabilize Cd by affecting pH [55,56]. This finding indirectly indicated that the biological system in the wetland contributed to the degradation and deposition of pollutants.
Spatial analysis (Figure 5) was conducted using both the measured data and the predicted data by the GA–BPANN algorithm. This spatial analysis indicated that the Cd horizontal distribution in the Liu Shan Yan wetland achieved a balance. The pattern of the measured Cd concentrations was consistent with the predicted concentration patterns in the horizontal direction. However, the predicted Cd concentration range was 0.03 to 0.26 mg·L−1, which was 13% to 25% lower than the observed Cd concentration range (0.04 to 0.3 mg·L−1).
The deviation (Figure 3) of learning by the GA–BPANN algorithm met the expected deviation. We assume that the advection of water and the self-purification led to a diminishing trend in Cd concentrations in the analysis of practical situations. The faster the water flow rate, the more obvious the dilution effect of water; on the contrary, the slower the water flow, the more significant the microbial adsorption and sediment deposition in the place. In other words, water flow can dilute the Cd content and promote water self-purification to reduce Cd content. However, the GA–BPANN algorithm cannot adequately simulate the steady flow of wastewater at the LS-10 sampling point. Therefore, the results predicted by GA–BPANN are satisfactory for describing an enclosed wetland environment or for situations that do not include inputs of external pollutants. The GA–BPANN modeling in this paper demonstrated that the Cd transport variability was constant in the horizontal direction (i.e., transport followed three flow paths).
The coefficient of variation was used to compare Cd advection with other lakes in China. The coefficient of variation is expressed as follows:
C V = s x ¯ × 100
where
  • CV represents the coefficient of variation (%);
  • s represents the sample standard deviation;
    x ¯ represents the sample mean.
In general, the greater the coefficient of variation, the greater the degree of data advection. For the Cd concentrations in the Liu Shao Yan Lake, the standard deviation was 0.2551 mg·L−1, with a mean of 0.1909 mg·L−1, and the coefficient of variation was 133.63%. For comparison, the coefficient of Cd variation of the Dongting Lake was 159.91% [57]. The large coefficient of variation indicated that Cd content was susceptible to effects of plants and water quality, which were unevenly distributed in the lake. This finding suggested a huge degree of advection.
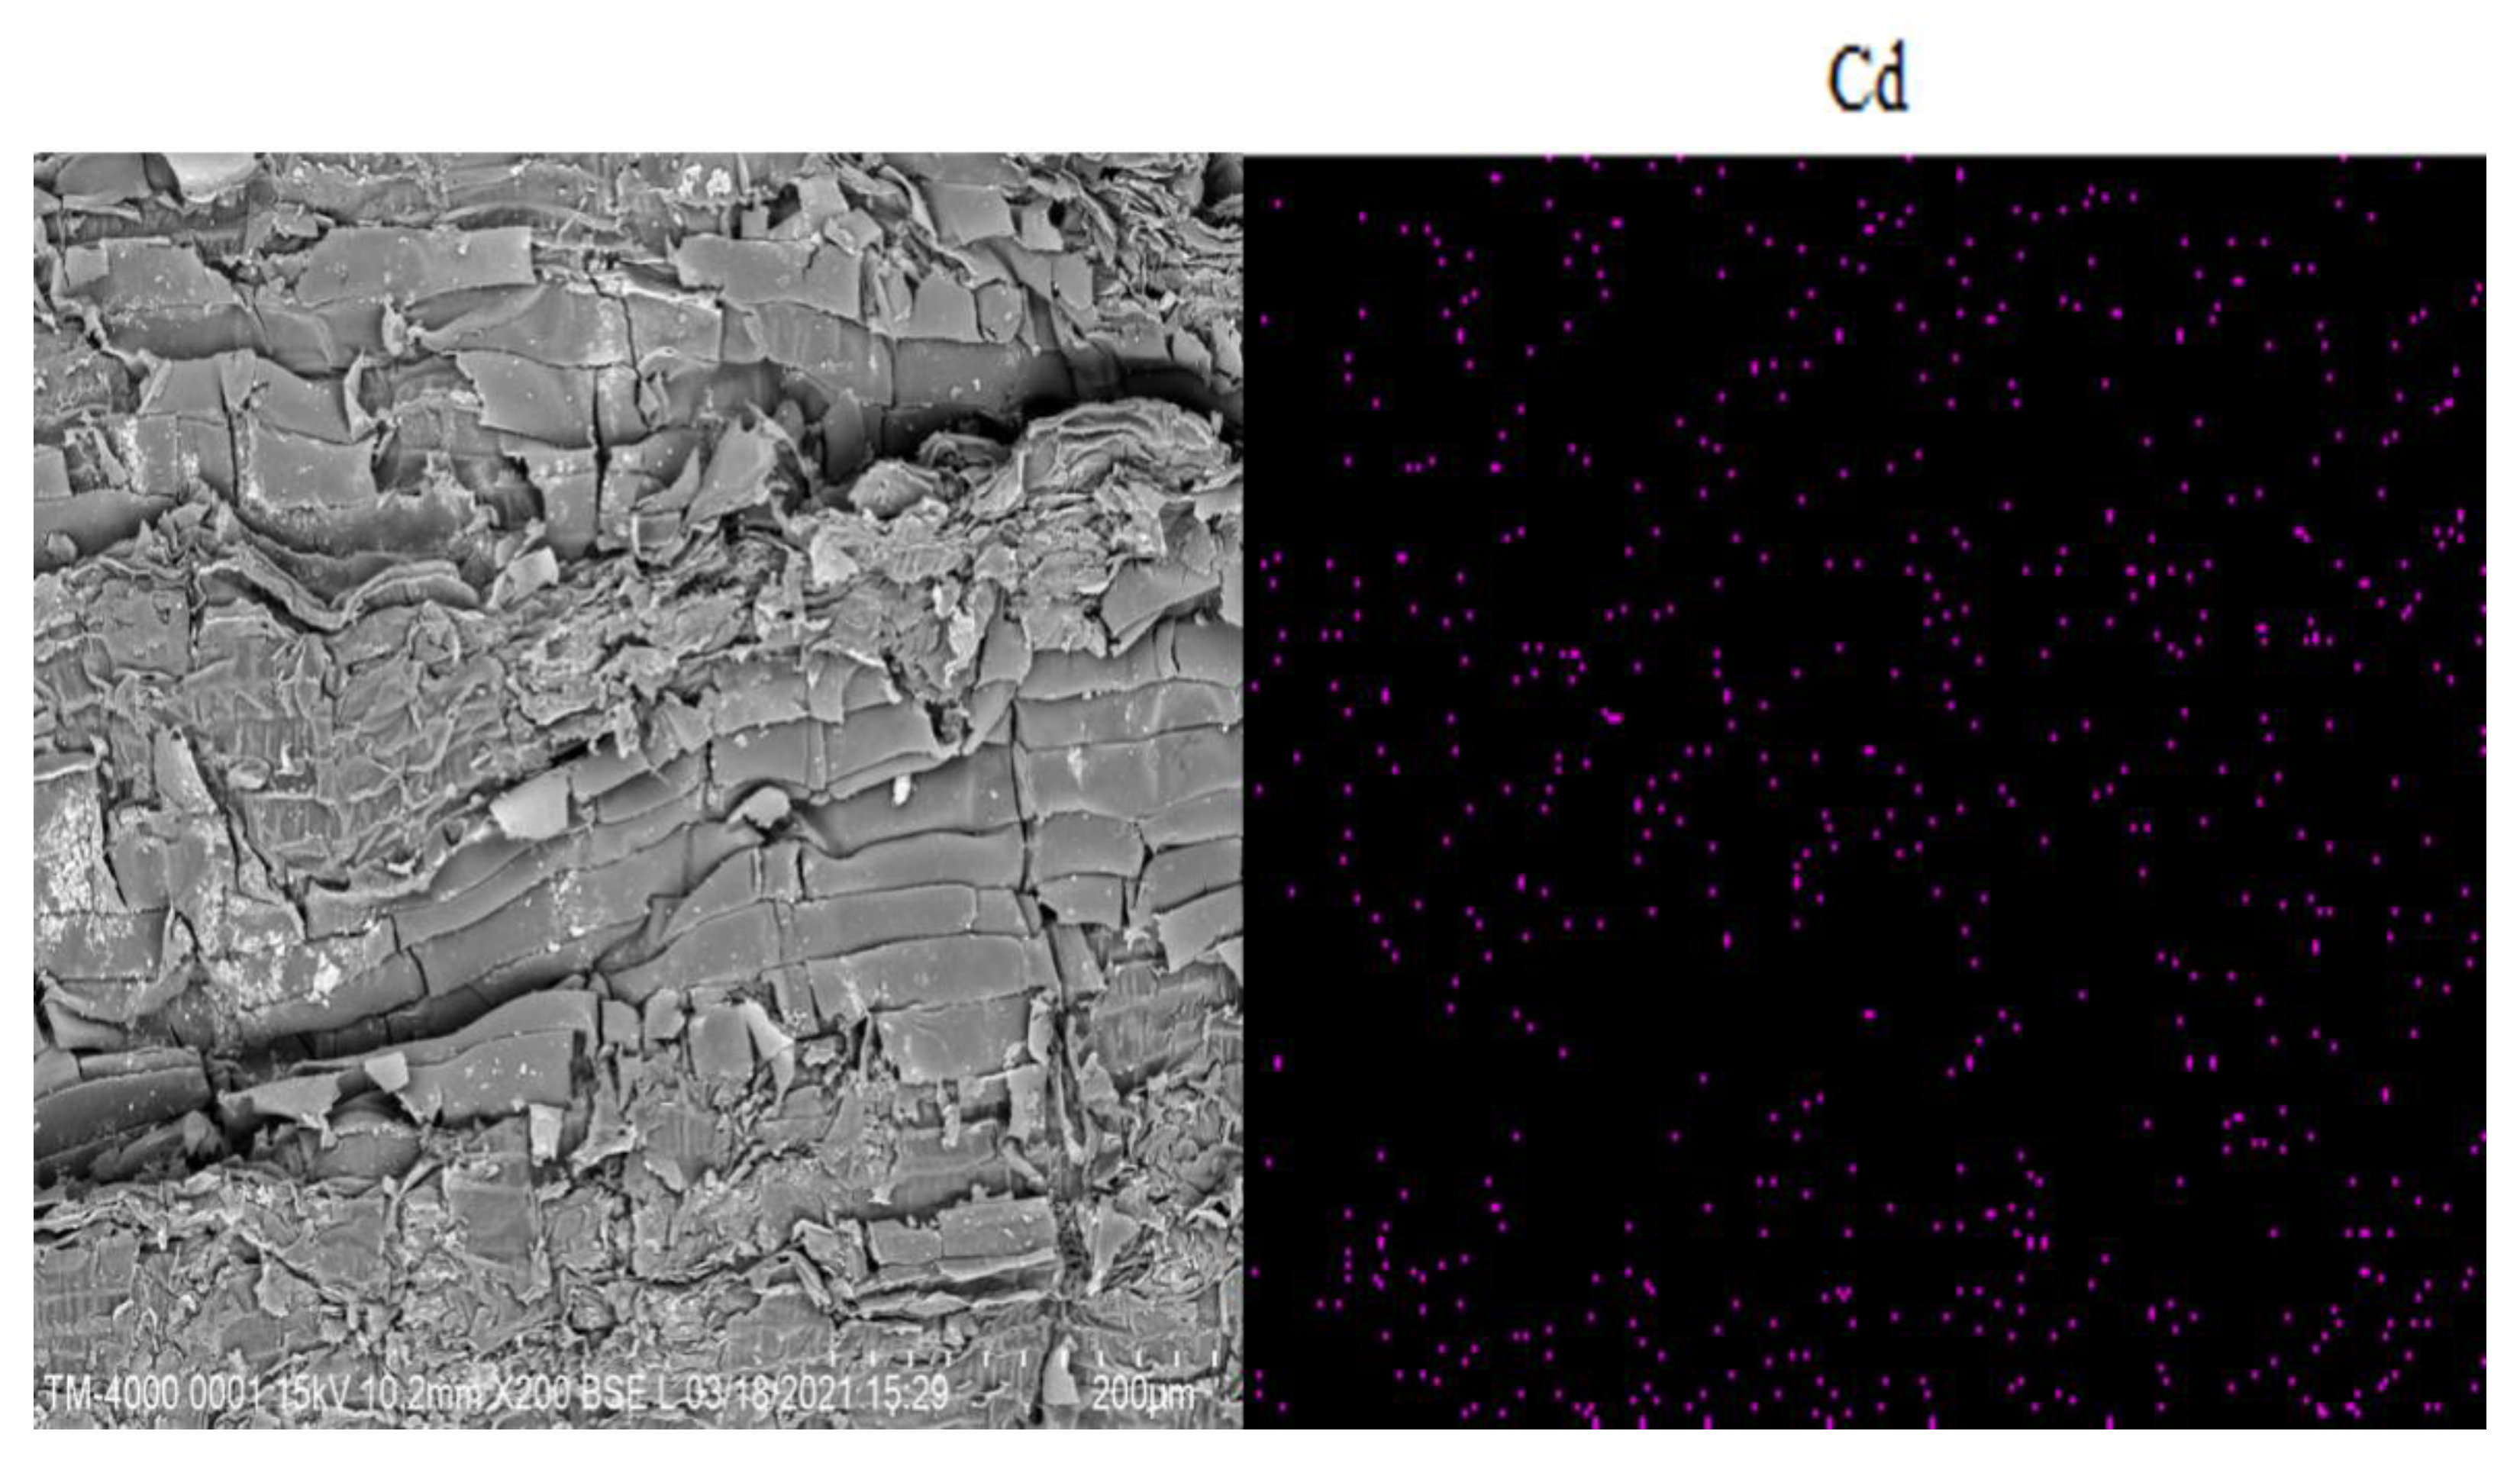
Previous research has identified at least 400 plants that significantly absorb heavy metals [58], and more than 20 plants that have shown a significant uptake of Cd [59]. Typically, the uptake of Cd in plants ranges from 100 to 500 mg·kg−1 [60,61]. However, uptake of Cd can reach up to 3000 mg·kg−1 in some plants, such as Cymbidium acuminata [62]. Typically, Cd uptake is higher in herbaceous plants than in shrubs and trees [63]. In addition, Pb is absorbed in landscaping plants such as Ligustrum lucidum [64], and Hg is absorbed in a multitude of usable plants such as lettuce, cucumber, pepper, cowpea, and string beans [65]. Pontederia cordata is a perennial emergent plant and is primarily cultivated in the Liu Shao Yan wetland. Recent research indicates that P. cordata can absorb 76.90% Cd in its root system as a landscape plant and shows great Cd removal potential [66]. However, in this study, Pontederia cordata in the Liu Shao Yan wetland exerted no significant effect on the uptake of Cd. This conclusion was based on the Cd data (0.1486 mg·L−1, 0.0080 mg·L−1, 0.2647 mg·L−1) acquired from the LS-5, LS-17, and LS-19 sampling points, which had Pontederia cordata stands. There was no significant difference in the observed Cd concentrations between these three sampling points and their surroundings, indicating no significant Cd uptake by the P. cordata. Another evidence was that we found Cd in the SEM–EDS of our sample plants collected at LS-P3 (Figure 6). According to EDS results, plants could adsorb Cd, and the mass fraction of Cd was only 0.282 wt.% (Figure 7). In Figure 7, the peaks in the left picture represented the number of elements, corresponding to the mass percentage analysis in the right picture. Figure 7 was obtained via surface scanning of the microstructure in Figure 6. It is concluded that Pontederia cordata can adsorb Cd, but the amount is negligibly small.

4. Conclusions

This study investigated the horizontal Cd distribution patterns by sampling the water surface in the Liu Shao Yan constructed wetland. Comparison of observed Cd concentrations and predicted Cd concentrations by the GA–BPANN algorithm indicated that the Cd distribution of the constructed wetland had reached a stable state with three clear horizontal transport paths, i.e., (1) flow to the lake center, (2) flow to the southern lake basin, and (3) flow to the outlet of the northern lake. This study found that Cd was easily accumulated in the more isolated and stable southern basin, and the flow rate was greatly affected by the terrain. The prediction of the GA–BPANN showed a degradation rate of Cd in the constructed wetland between 13% and 25% in the absence of external pollutant input. Following this conclusion, the real Cd degradation efficiency should be lower than we predicted. While the Liu Shao Yan constructed wetland had an impact on Cd degradation, the plant species composition of the wetland could be modified to improve Cd degradation efficiency. We conclude that constructed wetlands are environmentally friendly, cost-effective technology for the effective removal of Cd that could spur green finance and green investment and strengthen environmental management for pollutant removal [67,68].
By comparing the coefficient of variation of Cd of the wetland with literature data, a large variation in Cd concentrations was observed in the constructed wetland. However, only a minor variation in the Cd concentration was observed between the area planted with Pontederia cordata and surrounding waters in the constructed wetland. EDS results showed a low content of Cd in plant tissue (0.282 wt.%). We conclude that variation in water flow velocity resulted from the concave–convex substrate of the constructed wetland and is, rather than stands of Pontederia cordata, the dominant factor affecting the distribution of Cd in water.
Although this study could not provide accurate measurements of flow rate in the constructed wetland, its assessment of the Cd horizontal transport variability and predictions of lakewater Cd concentration patterns in an urban constructed wetland could provide valuable data and prediction methodology. Data from this study could be used to evaluate the degradation of Cd in other constructed wetlands. Additionally, the GA–BPANN algorithm provides an additional tool for investigating the transport variability of Cd and other heavy metals.

Author Contributions

Conceptualization, Z.Z.; funding acquisition, Z.Z.; investigation, Z.Z., W.-G.L., F.-Y.H., C.-X.W., Y.-P.Z., Q.-Q.C. and Z.W.; methodology, W.-G.L.; software, W.-G.L.; supervision, F.-C.Y.; writing—original draft preparation, W.-G.L. All authors have read and agreed to the published version of the manuscript.

Funding

This study was supported by the National Key Research and Development Program of China (No. 2019YFC1803500); National Key Research and Development Program of China (No. 2019YFC1803504); Key Research Project of Science and Technology Department of Sichuan Province, “Development of Passivating Agent for Heavy Metal Compound Pollution of Farmland Soil Based on Solid Waste Resource Utilization, Passivation Remediation Mechanism, and Effect Demonstration Research” (No. 2018SZ0298); Key Laboratory of Higher Education of Sichuan Province, Development of Special Biological Resources of Dry-hot Valley, Open Fund, “Evaluation of Heavy Metal Pollution in Mango Soil in Panzhihua Dry-Hot Valley and In Situ Passivation Remediation” (No.: GR-2020-E-02); Science and Technology Program of Panzhihua City, “Evaluation and Dynamic Monitoring System of Soil Heavy Metal Pollution in Main Mango Production Area of Panzhihua City’ (No. 2017CY-N-8); and Longshan Talent Research Program of Southwest University of Science and Technology, Longshan, China.18LZX638).

Institutional Review Board Statement

Not applicable.

Informed Consent Statement

Not applicable.

Data Availability Statements

Not applicable.

Conflicts of Interest

The authors declare no conflict of interest.

References

  1. Otero, I.; Kallis, G.; Aguilar, R.; Ruiz, V. Water scarcity, social power and the production of an elite suburb: The political ecology of water in Matadepera, Catalonia. Ecol. Econ. 2011, 70, 1297–1308. [Google Scholar] [CrossRef]
  2. Bogardi, J.J.; Dudgeon, D.; Lawford, R.; Flinkerbusch, E.; Meyn, A.; Pahl-Wostl, C.; Viehlhauer, K.; Vörösmarty, C. Water security for a planet under pressure: Interconnected challenges of a changing world call for sustainable solutions. Curr. Opin. Environ. Sustain. 2012, 4, 35–43. [Google Scholar] [CrossRef]
  3. Trenberth, K.E.; Dai, A.; Van Der Schrier, G.; Jones, P.D.; Barichivich, J.; Briffa, K.R.; Sheffield, J. Global warming and changes in drought. Nat. Clim. Chang. 2014, 4, 17–22. [Google Scholar] [CrossRef]
  4. UNESCO. The United Nations World Water Development Report 3: Water in a Changing World; UNESCO: Paris, France; Berghahn Books: New York, NY, USA, 2009. [Google Scholar]
  5. Schwarzenbach, R.P.; Escher, B.I.; Fenner, K.; Hofstetter, T.B.; Johnson, C.A.; Von Gunten, U.; Wehrli, B. The challenge of micropollutants in aquatic systems. Science 2006, 313, 1072–1077. [Google Scholar] [CrossRef]
  6. Peng, T.; Deng, H. Comprehensive evaluation on water resource carrying capacity based on DPESBR framework: A case study in Guiyang, southwest China. J. Clean. Prod. 2020, 268, 122235. [Google Scholar] [CrossRef]
  7. Zhao, J.; Xu, T.; Xiao, J.; Liu, S.; Mao, K.; Song, L.; Yao, Y.; He, X.; Feng, H. Responses of water use efficiency to drought in southwest China. Remote Sens. 2020, 12, 199. [Google Scholar] [CrossRef] [Green Version]
  8. Zang, W.; Lin, J.; Wang, Y.; Tao, H. Investigating small-scale water pollution with UAV remote sensing technology. In Proceedings of the World Automation Congress 2012, Puerto Vallarta, Mexico, 24–28 June 2012; IEEE: Beijing, China, 2012; pp. 1–4. [Google Scholar]
  9. Cheng, S.; Wu, Z.; Kuang, Q. Macrophytes in Artificial Wetland. J. Lake Sci. 2002, 14, 179–184. [Google Scholar]
  10. Gerba, C.P.; Thurston, J.A.; Falabi, J.A.; Watt, P.M.; Karpiscak, M.M. Optimization of artificial wetland design for removal of indicator microorganisms and pathogenic protozoa. Water Sci. Technol. 1999, 40, 363–368. [Google Scholar] [CrossRef]
  11. Miklas, S. Chapter 20—Constructed Wetlands. In Wetlands for Water Pollution Control, 2nd ed.; Miklas, S., Ed.; Elsevier: Amsterdam, The Netherlands, 2016; pp. 137–155. [Google Scholar]
  12. Bai, X.; Wang, B.; Yu, M.; Nie, M. Development of constructed wetland wastewater treatment technology and its application in China. J. Harbin Univ. Civ. Eng. Archit. 1999, 32, 88–92. [Google Scholar]
  13. Xianguo, L.; Ming, J. Progress and prospect of wetland research in China. J. Geogr. Sci. 2004, 14, 45–51. [Google Scholar] [CrossRef]
  14. Lee, C.; Fletcher, T.D.; Sun, G. Nitrogen removal in constructed wetland systems. Eng. Life Sci. 2009, 9, 11–22. [Google Scholar] [CrossRef]
  15. Drizo, A.; Frost, C.A.; Grace, J.; Smith, K.A. Physico-chemical screening of phosphate-removing substrates for use in constructed wetland systems. Water Res. 1999, 33, 3595–3602. [Google Scholar] [CrossRef]
  16. Salmon, C.; Crabos, J.L.; Sambuco, J.P.; Bessiere, J.M.; Basseres, A.; Caumette, P.; Baccou, J.C. Artificial wetland performances in the purification efficiency of hydrocarbon wastewater. Water Air Soil Pollut. 1998, 104, 313–329. [Google Scholar] [CrossRef]
  17. Vrhovšek, D.; Kukanja, V.; Bulc, T. Constructed wetland (CW) for industrial waste water treatment. Water Res. 1996, 30, 2287–2292. [Google Scholar] [CrossRef]
  18. Shelef, O.; Gross, A.; Rachmilevitch, S. Role of plants in a constructed wetland: Current and new perspectives. Water 2013, 5, 405–419. [Google Scholar] [CrossRef]
  19. Jucherski, A.; Nastawny, M.; Walczowski, A.; Jóźwiakowski, K.; Gajewska, M. Assessment of the technological reliability of a hybrid constructed wetland for wastewater treatment in a mountain eco-tourist farm in Poland. Water Sci. Technol. 2017, 75, 2649–2658. [Google Scholar] [CrossRef] [PubMed]
  20. Yao, Q.; Yu, J.; Lei, J. A decentralized wastewater treatment project for a “new rural” community in Wuhan. China Water Wastewater 2009, 25, 37–39. (In Chinese) [Google Scholar]
  21. Brooks, A.S.; Rozenwald, M.N.; Geohring, L.D.; Lion, L.W.; Steenhuis, T.S. Phosphorus removal by wollastonite: A constructed wetland substrate. Ecol. Eng. 2000, 15, 121–132. [Google Scholar] [CrossRef] [Green Version]
  22. Singh, S.; Chakraborty, S. Performance of organic substrate amended constructed wetland treating acid mine drainage (AMD) of North-Eastern India. J. Hazard. Mater. 2020, 397, 122719. [Google Scholar] [CrossRef]
  23. Zeng, Z.; Luo, W.-G.; Wang, Z.; Yi, F.-C. Water pollution and its causes in the Tuojiang River Basin, China: An artificial neural network analysis. Sustainability 2021, 13, 792. [Google Scholar] [CrossRef]
  24. Cheng, S.; Grosse, W.; Karrenbrock, F.; Thoennessen, M. Efficiency of constructed wetlands in decontamination of water polluted by heavy metals. Ecol. Eng. 2002, 18, 317–325. [Google Scholar] [CrossRef]
  25. Khan, S.; Ahmad, I.; Shah, M.T.; Rehman, S.; Khaliq, A. Use of constructed wetland for the removal of heavy metals from industrial wastewater. J. Environ. Manag. 2009, 90, 3451–3457. [Google Scholar] [CrossRef]
  26. Liu, J.; Dong, Y.; Xu, H.; Wang, D.; Xu, J. Accumulation of Cd, Pb and Zn by 19 wetland plant species in constructed wetland. J. Hazard. Mater. 2007, 147, 947–953. [Google Scholar] [CrossRef]
  27. Leung, H.M.; Duzgoren-Aydin, N.S.; Au, C.K.; Krupanidhi, S.; Fung, K.Y.; Cheung, K.C.; Wong, Y.K.; Peng, X.L.; Ye, Z.H.; Yung, K.K.L.; et al. Monitoring and assessment of heavy metal contamination in a constructed wetland in Shaoguan (Guangdong Province, China): Bioaccumulation of Pb, Zn, Cu and Cd in aquatic and terrestrial components. Environ. Sci. Pollut. Res. 2017, 24, 9079–9088. [Google Scholar] [CrossRef] [PubMed]
  28. Gill, L.W.; Ring, P.; Casey, B.; Higgins, N.M.P.; Johnston, P.M. Long term heavy metal removal by a constructed wetland treating rainfall runoff from a motorway. Sci. Total Environ. 2017, 601–602, 32–44. [Google Scholar] [CrossRef] [PubMed]
  29. Ayaz, T.; Khan, S.; Khan, A.Z.; Lei, M.; Alam, M. Remediation of industrial wastewater using four hydrophyte species: A comparison of individual (pot experiments) and mix plants (constructed wetland). J. Environ. Manag. 2020, 255, 109833. [Google Scholar] [CrossRef]
  30. Bezbaruah, A.N.; Zhang, T.C. PH, redox, and oxygen microprofiles in rhizosphere of bulrush (Scirpus validus) in a constructed wetland treating municipal wastewater. Biotechnol. Bioeng. 2004, 88, 60–70. [Google Scholar] [CrossRef]
  31. Camacho, J.V.; Martínez, A.D.L.; Gómez, R.G.; Sanz, J.M. A comparative study of five horizontal subsurface flow constructed wetlands using different plant species for domestic wastewater treatment. Environ. Technol. 2007, 28, 1333–1343. [Google Scholar] [CrossRef]
  32. Cooper, P. What can we learn from old wetlands? Lessons that have been learned and some that may have been forgotten over the past 20 years. Desalination 2009, 246, 11–26. [Google Scholar] [CrossRef]
  33. Picek, T.; Čížková, H.; Dušek, J. Greenhouse gas emissions from a constructed wetland—Plants as important sources of carbon. Ecol. Eng. 2007, 31, 98–106. [Google Scholar] [CrossRef]
  34. Ström, L.; Lamppa, A.; Christensen, T.R. Greenhouse gas emissions from a constructed wetland in southern Sweden. Wetl. Ecol. Manag. 2007, 15, 43–50. [Google Scholar] [CrossRef]
  35. Zhuang, L.-L.; Yang, T.; Zhang, J.; Li, X. The configuration, purification effect and mechanism of intensified constructed wetland for wastewater treatment from the aspect of nitrogen removal: A review. Bioresour. Technol. 2019, 293, 122086. [Google Scholar] [CrossRef] [PubMed]
  36. Dixit, G.; Roy, D.; Uppal, N. Predicting India volatility index: An application of artificial neural network. Int. J. Comput. Appl. 2013, 70. [Google Scholar] [CrossRef]
  37. Lei, W.; Ruliang, W.; Hongfeng, Q.; Yang, X. Improved BP neural network algorithm and its application. Softw. Guide 2016, 15, 38–40. (In Chinese) [Google Scholar]
  38. Wang, R. Prediction of Wastewater Treatment Based on Geneticalgorithm Optimization BP Artificial Neural Network. Ph.D. Thesis, South China University of Technology, Guangzhou, China, 2012. (In Chinese). [Google Scholar]
  39. Cho, K.; Van Merriënboer, B.; Gulcehre, C.; Bahdanau, D.; Bougares, F.; Schwenk, H.; Bengio, Y. Learning phrase representations using RNN encoder-decoder for statistical machine translation. arXiv 2014, arXiv:1406.1078. [Google Scholar]
  40. Yin, W.; Kann, K.; Yu, M.; Schütze, H. Comparative study of CNN and RNN for natural language processing. arXiv 2017, arXiv:1702.01923. [Google Scholar]
  41. Sherstinsky, A. Fundamentals of recurrent neural network (RNN) and long short-term memory (LSTM) network. Phys. D Nonlinear Phenom. 2020, 404, 132306. [Google Scholar] [CrossRef] [Green Version]
  42. Wang, F.; Tang, Y. Application of artificial neural network in water quality evaluation of Daqing River. Northeast. Water Conserv. Hydropower. 2019, 37, 25–35. (In Chinese) [Google Scholar]
  43. Jun, Z.; Zhen, Z.; Zhe, Z.; Jin, H.; Zu, H. Water quality modeling for water works in the Minjiang River estuary based on BP neural network model. Environ. Sci. Technol. 2020, 43, 198–203. (In Chinese) [Google Scholar]
  44. Ghiassi, M.; Zimbra, D.K.; Saidane, H. Urban water demand forecasting with a dynamic artificial neural network model. J. Water Resour. Plan. Manag. 2008, 2, 134. [Google Scholar] [CrossRef]
  45. Firat, M.; Yurdusev, M.A.; Turan, M.E. Evaluation of artificial neural network techniques for municipal water consumption modeling. Water Resour. Manag. 2009, 23, 617–632. [Google Scholar] [CrossRef]
  46. Li, X.; Zheng, D.; Yang, J.; Cai, H.; Zeng, W.; Yue, R. Research on prediction and early warning model of water quality in construction area based on GA-BP neural network. J. Chongqing Jiaotong Univ. Nat. Sci. Ed. 2020, 39, 106–110. (In Chinese) [Google Scholar]
  47. Wang, G.; Xie, J.; Zhang, J. Application of GA-BP combination forecasting method into the annual run-off prediction of Beiluo River. Agric. Res. Arid. Areas 2014, 32, 203–207. (In Chinese) [Google Scholar]
  48. Yan, X.K.; Wang, J.Y. Research of construction subcontracting enterprise competence based on GA-BP neural network. Adv. Mater. Res. 2014, 1030–1032, 2664–2667. [Google Scholar] [CrossRef]
  49. GB 12998-1991. Water Quality-Guidance on Sampling Techniques; Chinese Standards Press: Beijing, China, 1991. [Google Scholar]
  50. Zhuang, P.; McBride, M.B.; Xia, H.; Li, N.; Li, Z. Health risk from heavy metals via consumption of food crops in the vicinity of Dabaoshan mine, South China. Sci. Total Environ. 2009, 407, 1551–1561. [Google Scholar] [CrossRef] [PubMed]
  51. Bing, H.; Wu, Y.; Liu, E.; Yang, X. Assessment of heavy metal enrichment and its human impact in lacustrine sediments from four lakes in the mid-low reaches of the Yangtze River, China. J. Environ. Sci. 2013, 25, 1300–1309. [Google Scholar] [CrossRef]
  52. Lu, J.; Zhong, X.; Wu, H.; Wang, H. Vertical distribution characteristics of heavy metals in lake water at different flow rates. Trans. Chin. Soc. Agric. Mach. 2016, 47, 179–184. (In Chinese) [Google Scholar]
  53. Semesi, I.S.; Beer, S.; Björk, M. Seagrass photosynthesis controls rates of calcification and photosynthesis of calcareous macroalgae in a tropical seagrass meadow. Mar. Ecol. Prog. Ser. 2009, 382, 41–47. [Google Scholar] [CrossRef]
  54. Dang, F.; Wu, Q.; Ke, L. Study on the relationship between cyanobacteria bloom and pH value in Chaohu Lake. Chem. Eng. Des. Commun. 2018, 44, 202–203. [Google Scholar]
  55. Zhou, Q.; Liu, Y.; Li, T.; Zhao, H.; Alessi, D.S.; Liu, W.; Konhauser, K.O. Cadmium adsorption to clay-microbe aggregates: Implications for marine heavy metals cycling. Geochim. Cosmochim. Acta 2020, 290, 124–136. [Google Scholar] [CrossRef]
  56. Zhu, Z.; Yang, X.; Wang, K.; Huang, H.; Zhang, X.; Fang, H.; Li, T.; Alva, A.K.; He, Z. Bioremediation of Cd-DDT co-contaminated soil using the Cd-hyperaccumulator Sedum alfredii and DDT-degrading microbes. J. Hazard. Mater. 2012, 235–236, 144–151. [Google Scholar] [CrossRef] [PubMed]
  57. Meng, W.; Liu, Y.; Zhu, S.; Wang, Z.; Wang, F. Dongting lake basin sediment distribution characteristics of heavy metals and their ecological risk. South North Water Divers. Water Conserv. Sci. Technol. 2021, 1–12, (Both in English and Chinese). Available online: http://kns.cnki.net/kcms/detail/13.1430.tv.20210118.1733.002.html (accessed on 5 September 2011).
  58. Luo, Y.M. Phytoremediation of metal-contaminated soil. Soil 1999, 31, 261–265, 280. (In Chinese) [Google Scholar]
  59. He, Q. Progress in screening cadmium superenriched plants. Environ. Prot. Circ. Econ. 2013, 33, 46–49. (In Chinese) [Google Scholar]
  60. Sun, T.; Zhang, Y.; Cai, T. Research progress on heavy metal tolerance mechanism of Brassica juncea, L. Chin. J. Ecol. Agric. 2011, 19, 226–234. (In Chinese) [Google Scholar]
  61. Fang, M. Enrichment Characteristics of Cd and Plant Remediation of Cd Contaminated Soil by Averrhoa Carambola. Ph.D. Thesis, Sun Yat-sen University, Guangzhou, China, 2008. (In Chinese). [Google Scholar]
  62. Saoussen, B.; Helmi, H.; Shino, M.; Yoshiro, O. Hyperaccumulator Thlaspi caerulescens (Ganges ecotype) response to increasing levels of dissolved cadmium and zinc. Chem. Ecol. 2012, 28, 561–573. [Google Scholar] [CrossRef]
  63. Hou, W.; Chen, X.; Song, G.; Wang, Q.; Chang, C.C. Effects of copper and cadmium on heavy metal polluted waterbody restoration by duckweed (Lemna minor). Plant Physiol. Biochem. 2007, 45, 62–69. [Google Scholar] [CrossRef]
  64. Patra, M.; Bhowmik, N.; Bandopadhyay, B.; Sharma, A. Comparison of mercury, lead and arsenic with respect to genotoxic effects on plant systems and the development of genetic tolerance. Environ. Exp. Bot. 2004, 52, 199–223. [Google Scholar] [CrossRef]
  65. Shen, Z.-G.; Li, X.-D.; Wang, C.-C.; Chen, H.-M.; Chua, H. Lead phytoextraction from contaminated soil with high-biomass plant species. J. Environ. Qual. 2002, 31, 1893–1900. [Google Scholar] [CrossRef]
  66. Xin, J.; Ma, S.; Li, Y.; Zhao, C.; Tian, R. Pontederia cordata, an ornamental aquatic macrophyte with great potential in phytoremediation of heavy-metal-contaminated wetlands. Ecotoxicol. Environ. Saf. 2020, 203, 111024. [Google Scholar] [CrossRef] [PubMed]
  67. Brooks, C.; Schopohl, L. Green accounting and finance: Advancing research on environmental disclosure, value impacts and management control systems. Br. Account. Rev. 2021, 53, 100973. [Google Scholar] [CrossRef]
  68. Falcone, P.M. Environmental regulation and green investments: The role of green finance. Int. J. Green Econ. 2020, 14, 159. [Google Scholar] [CrossRef]
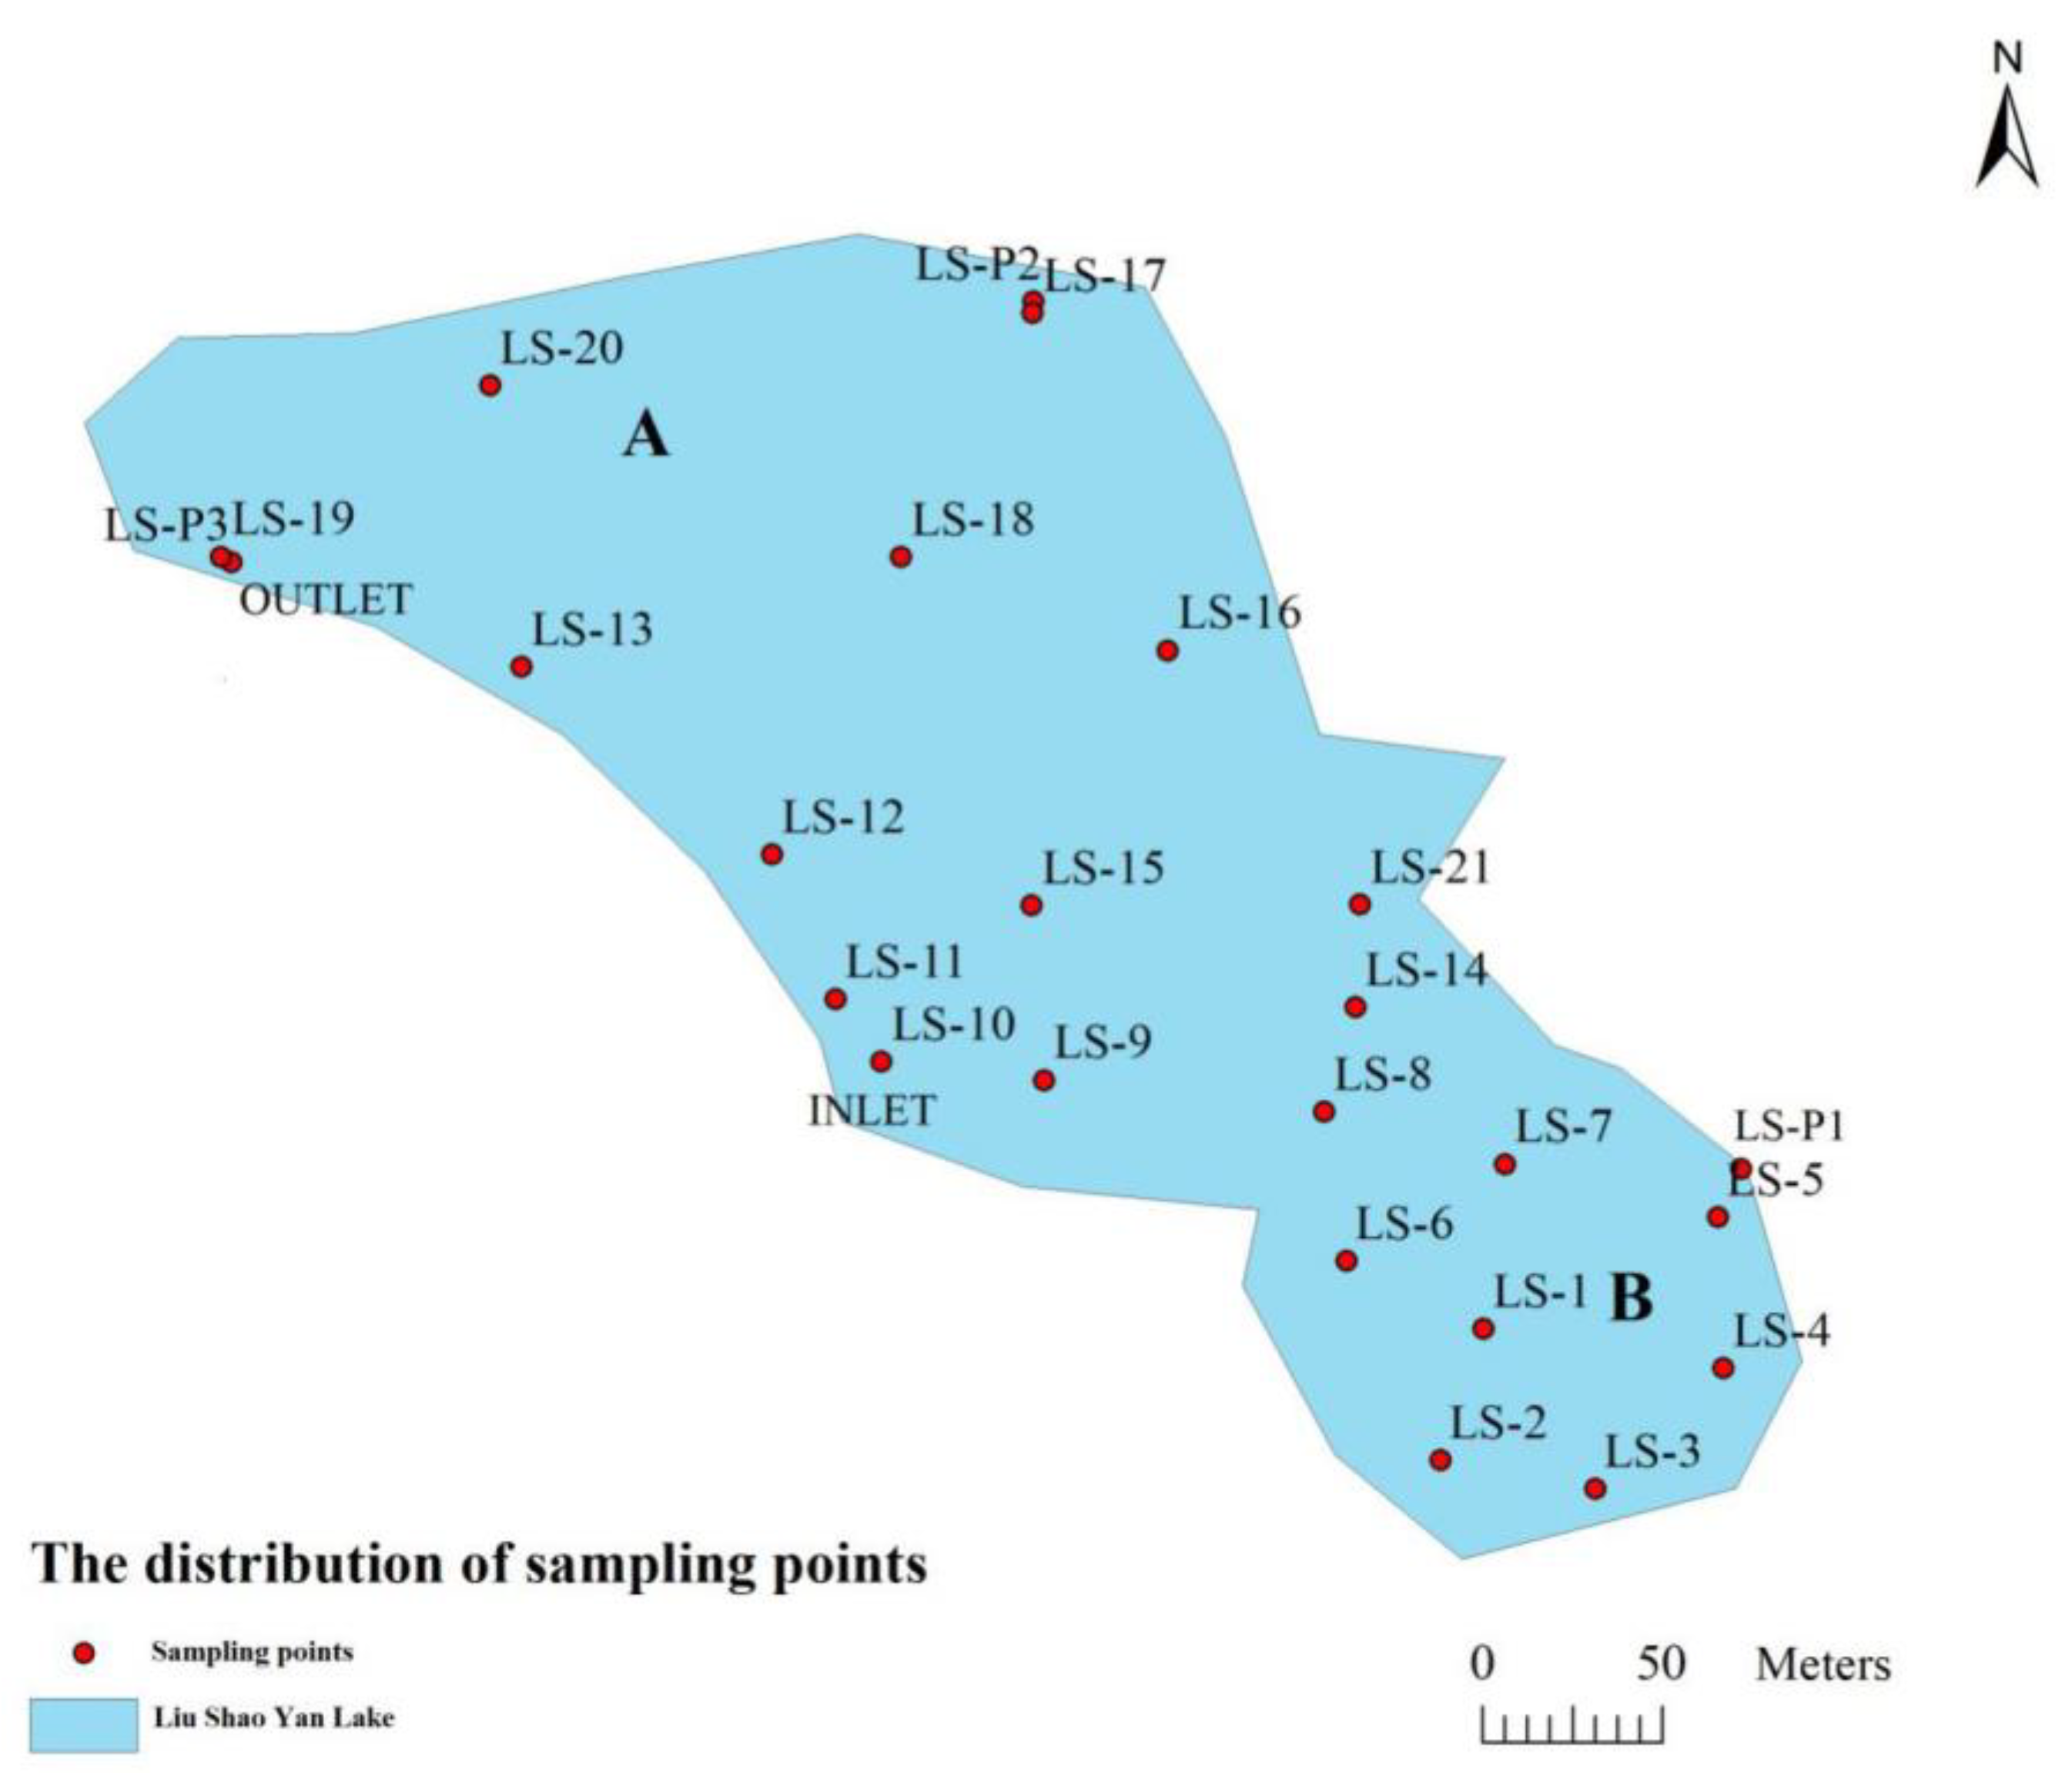
Figure 1. Sampling points in the Liu Shao Yan wetland.
Sustainability 13 05381 g001
Figure 2. Location of Liu Shao Yan Lake in China.
Sustainability 13 05381 g002
Figure 3. Comparison of expected and predicted Cd concentrations (mg/L) in surface water.
Sustainability 13 05381 g003
Figure 4. Horizontal distribution of observed Cd concentrations.
Sustainability 13 05381 g004
Figure 5. Horizontal distribution of predicted Cd concentrations.
Sustainability 13 05381 g005
Figure 6. SEM–EDS proving that Pontederia cordata contained Cd. The pink points on the right-hand side represented the corresponding Cd distribution in the left picture.
Sustainability 13 05381 g006
Figure 7. EDS analysis results.
Sustainability 13 05381 g007
Table 1. Cd concentrations in the surface water and sediment of Liu Shao Yan Lake.
Sampling PointsCd Content in Water Body
Ⅰ (mg/L)
Cd Content in Water Body
Ⅱ (mg/L)
Cd Content in Sediment
(mg/L)
LS-10.15200.16700.4917
LS-20.08730.0732ND
LS-30.08670.0840ND
LS-40.09980.0826ND
LS-50.86490.1486ND
LS-60.21320.9565ND
LS-70.00330.19600.0633
LS-80.38560.0050\
LS-90.00420.2850\
LS-10 (INLET)0.11380.0030ND
LS-110.11110.1240\
LS-120.89990.9555\
LS-130.08990.0980\
LS-140.06120.0562\
LS-150.05550.0540\
LS-160.02120.0270\
LS-170.00710.0080\
LS-180.16330.1640\
LS-19 (OUTLET)0.25470.2647ND
LS-200.39890.3980\
LS-210.20740.2073\
Note: ‘ND’ indicates not detected.
Table 2. Training, expected, and predicted sets from GA–BPANN algorithm.
Sampling PointsTraining Sets
(mg/L)
Expected Sets
(mg/L)
Training Results Sets
(mg/L)
DeviationPredicted Results Sets
(mg/L)
LS-10.15200.16700.1661 × 10−30.142
LS-20.08730.07320.07311 × 10−40.0637
LS-30.08670.08400.0841−1 × 10−40.0731
LS-40.09980.08260.08263−3 × 10−50.0719
LS-50.86490.14860.148600.0129
LS-60.21320.95650.94651 × 10−20.8322
LS-70.00330.19600.19600.1725
LS-80.38560.00500.00500.0042
LS-90.00420.28500.28500.2280
LS-10 (INLET)0.11380.00300.0045−1.5 × 10−30.0025
LS-110.11110.12400.12400.0955
LS-120.89990.95550.95154 × 10−30.7357
LS-130.08990.09800.09800.0794
LS-140.06120.05620.0562−3 × 10−100.0472
LS-150.05550.05400.05400.0410
LS-160.02120.02700.0269996 × 10−70.0213
LS-170.00710.00800.008002−2 × 10−60.007
LS-180.16330.16400.16400.1345
LS-19 (OUTLET)0.25470.26470.264700.1985
LS-200.39890.39800.408−1 × 10−20.3423
LS-210.20740.20730.207300.1721
Table 3. pH values and flow velocities at the sampling points.
Sampling PointspHFlow Velocity
(cm·s−1)
LS-18.426
LS-28.643
LS-38.283
LS-48.214
LS-58.272
LS-68.277
LS-78.029
LS-88.1317
LS-98.2114
LS-10 (INLET)8.1915
LS-117.8014
LS-128.477
LS-138.414
LS-148.0610
LS-158.1012
LS-168.221
LS-178.261
LS-188.176
LS-19 (OUTLET)7.966
LS-208.074
LS-218.054
Publisher’s Note: MDPI stays neutral with regard to jurisdictional claims in published maps and institutional affiliations.