Article

Profitability Assessment of Residential Photovoltaic Battery Systems in Japan Using Electric Power Big Data

Global Zero Emission Research Center, Environmental and Social Impact Assessment Team, National Institute of Advanced Industrial Science and Technology, Tokyo 135-0064, Japan
*
Author to whom correspondence should be addressed.
Sustainability 2021, 13(10), 5370; https://doi.org/10.3390/su13105370
Submission received: 23 March 2021 / Revised: 24 April 2021 / Accepted: 5 May 2021 / Published: 11 May 2021

Abstract

:
Residential photovoltaic (PV) battery systems are key technology in the design of low-carbon and resilient energy systems; however, limited research has assessed their profitability. This study aims to evaluate the economic performance of PV battery systems for end-users. The evaluation takes geological, technological, and socio-economic factors into consideration, thereby making the evaluation more comprehensive. We used PV power generation data and power consumption data of more than 40,000 all-electric houses in Japan. We performed scenario analyses with a sensitivity analysis. The results showed that residential PV battery systems were highly profitable when their storage battery operation modes were appropriately utilized at the end of the purchase period for solar power generation in Japan’s feed-in-tariff (FIT) scheme. The profitability, however, varied across regions. The results also indicated that the PV self-consumption rate was more than 50% when charging the battery with surplus power. The results of the sensitivity analysis suggested that the unit prices of grid electricity and the purchasing price of surplus power after the FIT scheme had a significant effect on the profitability of residential PV battery systems.

1. Introduction

In recent years, electricity storage batteries have gained attention as one of the technologies that can close the gap between unsteady solar power generation and demand for shifting peak solar generation, which contributes to decarbonizing energy and improving the resilience and stability of electric power systems. The International Renewable Energy Agency’s analysis predicts that the equipment costs of stationary storage batteries will decline to between 50% and 60% of the current costs by 2030. It also anticipates the number of stationary storage batteries currently installed in the world to increase from 2 GW to more than 200 GW by 2030 [1] (p. 132). The growing interest in PV battery systems has encouraged the examination of their economic performance, and research into the factors to influence the performance has been conducted. As to residential PV battery systems, in particular, several evaluation studies considering the situation in Germany, for instance, have been conducted [2,3,4,5].
The Japanese government has encouraged the use of renewable energy, including residential solar power generation systems, and more so since the Great East Japan Earthquake in 2011 with the Fukushima Daiichi Nuclear Power Plant accident. The introduction of stationary storage batteries—which was triggered by the government’s subsidized projects—has progressed and the cumulative amount of installed storage batteries has steadily increased to 1754 MWh [6] (p. 40). In recent years, residential photovoltaic (PV) battery systems, which combine residential solar power generation and storage batteries, have gained prominence. The configuration of a residential PV battery system assumed for the purposes of this study is shown in Figure 1. In this system, both PV power generation and storage batteries are connected to a hybrid power conditioner. The direct current is transmitted from these batteries to the conditioner. The output power of the power conditioner is then converted to alternating current, which is consumed in the home.
Residential PV battery systems offer the advantages of high charging efficiency, the ability to charge PV output during output control, and storage battery operation modes that can be changed by users. These advantages enable many manufacturers to develop and market their residential PV battery systems [7,8,9,10,11,12]. Some manufacturers also provide services that allow potential residential PV battery system users to test the profitability of the systems by running simulations [13,14]. However, the validity of the results of these simulations is hard to assess due to the lack of disclosed assumptions used in the simulation models.
In Japan, there are some existing case studies which address the effects of residential PV battery systems by using measured data on power consumption and solar power generation. Omine et al. (2013) evaluated the economic performance of the systems considering different power demands and the storage battery life of the systems in the Kansai region in Japan [15]. Yabe and Hayashi (2018, 2019) examine the unit price of rechargeable batteries and the optimum rechargeable battery capacity using data from Ota City, Gunma Prefecture in Japan [16,17]. The findings of these studies are difficult to be generalized to the whole country, however, because the data are limited to the geographical areas that they covered. It seems that there is a need to evaluate these systems’ profitability, and develop the required methods for the evaluation, in order to promote the wider use of residential PV battery systems.
The profitability of residential PV battery systems depends on geographical factors that influence power consumption and solar power generation as well as technical and socio-economic factors, as listed in Table 1.
Analyzing the effects of these factors quantitatively is crucial for developing this technology. The present study aims to evaluate the profitability of residential PV battery systems while considering factors that have not been sufficiently examined to date. It makes full use of a large dataset—measured data on power consumption and solar power generation from about 40,000 houses in Japan—to examine the use of residential PV battery systems. Geographically speaking, our data cover most regions of Japan. The assumptions made for the scenario analyses in our study reflect social circumstances in Japan today. To address uncertainty factors, we also performed a sensitivity analysis to evaluate the profitability of residential PV battery systems and examine the impact on self-consumption rates of solar power generation under various conditions. Based on the outcomes of the analyses, we present factors that may determine the profitability of residential PV battery systems.

2. Materials and Methods

2.1. The Period for Scenario Analyses

The operation period for residential PV battery systems in our analysis was set to 25 years, from 1 January 2020 to 31 December 2044. The period, 25 years, was chosen because the warranty periods of residential PV battery systems on the market range from up to 20 to 25 years, as noted by the Power Generation Cost Verification Working Group of the Agency for Natural Resources and Energy, the Ministry of Economy, Trade and Industry (METI) [18].

2.2. Electricity Consumption and Solar Power Generation

The dataset for the analysis contains power consumption (kWh) data and power generation (kWh/kW) per PV power generation data measured in all-electric houses, provided by a housing manufacture. These data were gathered from approximately 40,000 all-electric houses, from 2012 to 2017, evenly distributed throughout the whole country, except Okinawa. The time resolution of the data was one hour. The following procedures were performed, and we obtained 97 samples of all-electric houses to be used for the analysis:
  • Houses that had joined renewed rate plans for all-electric houses offered by major electric power companies in 2017 were extracted from the all-electric houses. This allowed us to predict the electricity consumption pattern of the households closer to the pattern found after the deregulation of electricity rates;
  • We identified houses that had a one-year period without data loss (i.e., 8760 h), and extracted the data of the houses for this period;
  • The houses included in the extracted data were classified according to where they were located. Then, a maximum of 10 houses from each of the nine power jurisdiction districts (all districts except Okinawa) were chosen. These houses were randomly selected on the condition that their average annual power consumption and that of standard deviation were the same as those of each region. The data obtained from these houses were used for the analysis.
Figure 2 shows the average annual power consumption and solar power generation of the sample houses by regional jurisdiction. The reference values of the annual power consumption by regional jurisdiction, shown in the figure, were drawn from the typical amounts of power consumption on the new electricity rate plans for all-electric houses offered by major electric power companies [19,20,21,22,23,24,25,26,27]. The reference values of annual PV power generation in the figure were taken from the Japan Photovoltaic Energy Association [28].
Figure 3 shows the 24 h change in the amount of power consumption of the reference value and that of sampled data, arranged by month. A peak of power consumption was recorded at midnight in every month. This is because houses that provided data were all-electric homes with the installation of an anticlogging method of natural coolant heat pump type water heater, which boils water for hot water supply at midnight when the unit price of electricity is low.
The relative error of the annual power consumption sample average was less than 5%, excluding Kyushu Electric Power Company (which had a small number of samples), and the relative error of the annual PV power generation sample average was less than 10%. This suggests that the sample average value and the reference value were not far different from each other. The sampled data were expanded to cover 25 years and analyses were conducted.

2.3. Electricity Rates

The analysis used the new rate plans for all-electric houses that were launched by major electric power companies after electricity deregulation. In these rate plans, one day is divided into either two time zones (daytime and nighttime hours) or three time zones (daytime morning, daytime evening, and nighttime hours), for which different unit prices are set. The unit price is set high during the daytime hours when the demand for electricity is at its highest, while the unit price is set low during the nighttime hours when the demand is low. The unit prices and time zones may vary depending on holidays and the season.
Table 2 shows the price plan of each power company with power unit prices (per 1 kWh, including tax) and time zones. Five companies—Tokyo Electric Power Company (TEPCO), Hokuriku Electric Power Company, Chugoku Electric Power Company, Shikoku Electric Power Company, and Kyushu Electric Power Company—adopt two time zones, while four companies—Hokkaido Electric Power Company, Tohoku Electric Power Company, Chubu Electric Power Company, and Kansai Electric Power Company—use three time zones. The basic charge of electricity was not considered in the analysis, as it is fixed the same, regardless of the presence or absence of solar power generation and storage batteries and is not related to the amount of power consumption.
The average unit price for household electricity—excluding renewable energy surcharges—has increased at an average rate of 0.22 JPY/kWh/year from 2010 to 2018. The average unit price is expected to increase further due to rising fuel prices, more stringent environmental regulations, and price revisions reflecting an increase in consumption tax [29] (p. 38). Therefore, we set three patterns for future electricity unit price increases: 0.00 JPY/kWh/year for a small increase, 0.22 JPY/kWh/year for medium, and 0.44 JPY/kWh/year for a large increase.
A renewable energy power generation promotion levy is levied on the cost of purchasing renewable energy electricity through the feed-in tariff (FIT) system. The amount collected is obtained by multiplying the amount of electricity used by the unit charge. The levy unit price is revised in May of every year. For the 2019 fiscal year (May 2019 to April 2020), it was 2.95 JPY/kWh.
In our analysis, we set three future unit price levy cases, as shown in Figure 4. As renewable energy is introduced more and more and becomes more common under the FIT system, the levy unit price will increase until the 2030 fiscal year. In the first case, the measures for mitigating the burden on the people was assumed to be effective and a low levy unit price was set, at 3.50 JPY/kWh in the 2030 fiscal year [29]. In the second case, a high unit price was set at 4.66 JPY/kWh in 2030, assuming that the increase in the levy unit price from 2017 to 2019 (0.16 JPY/kWh/year) would continue until 2030. The third was an intermediate case between the first one and the second one; a levy unit price in 2030 was set at 4.08 JPY/kWh. As the FIT system is expected to become more independent from 2030 onwards, the levy unit price will then start to decrease.

2.4. Sale of Surplus Solar Power

In our scenarios, the purchase price and the period of surplus electricity in the FIT system for residential solar power (less than 10 kW) were set at 21 JPY/kWh and 10 years, respectively [30]. Until now, the purchase price of residential solar power has been different in areas where there is no obligation to install output control equipment (e.g., in the jurisdiction of TEPCO, Chubu Electric Power, and Kansai Electric Power) than in areas where it is obligatory (other than the above). However, from fiscal year 2020, a nationwide uniform purchase price will be adopted.
Regarding electricity sales prices after the end of the purchase period, three cases—7.3 JPY/kWh as a low price, 9.3 JPY/kWh as a medium price, and 11.3 JPY/kWh as a high price—were set with reference to the suggested purchasing prices provided by retail electric power companies [30].

2.5. Residential PV Battery Systems

A system consisting of a single-crystal solar panel and a lithium-ion iron phosphate battery was used in the analysis. The values shown in Table 3 were set based upon the specifications provided by both the Power Generation Cost Verification Working Group [18] and by commercial products [7,8,9,10,11,12] to be used for the initial performance of the system.
Concerning performance deterioration of the system over time, we set three cases, as shown in Table 4. Assuming that the solar power generation output decreases linearly, the output reduction rate was set based on existing experimental results by Choi et al. of the outdoor exposure of solar modules [31]. Performance of the storage battery was set based on the assumption that the effective capacity and its charging/discharging efficiency decay exponentially. We set the low performance case of the storage battery as 60% of the initial performance, the middle performance as 70%, and the high performance as 80%, based on the capacity retention rate of some commercial products [7,8,9,10,11,12]. The operation mode was assumed as one cycle per day in this study, and 12,000 cycles is equivalent to 30 years.
We also assumed three types of storage battery operation modes, as shown in Figure 5. Storage battery operation mode 1 includes a “boosting mode” to increase the sale of solar power by charging with grid power at night and discharging during the day. In non-boosting mode, however, the purchase of grid power during the day is reduced by consuming solar power in-house and compensating for the shortage by discharging the storage battery. Storage battery operation mode 2 refers to “non-boosting (night charging) mode” with the system’s power being charged during nighttime hours. Storage battery operation mode 3 refers to a “non-boosting (PV charging) mode”, a mode where the surplus from PV power generation was used for charging.

2.6. An Energy Supply–Demand Simulation

We simulated hourly residential energy supply and demand based on the data and assumptions described in Section 2.2, Section 2.3, Section 2.4 and Section 2.5. The simulation was performed using IBM SPSS modeler 18.2.
Energy supply–demand balance in PV power generation was calculated using Equation (1), that of storage batteries was calculated with Equation (2), that of grid power with Equation (3), and that of power consumption was calculated with Equation (4). For the energy supply–demand balance in storage batteries, a loss during charging and discharging from the grid was considered. A loss due to direct current transmission between solar power generation and the storage battery was not considered.
E p v y , t = E p v d m y , t + E p v b t y , t + E p v g r y , t
E b t y , t = E b t y , t 1 + E p v b t y , t + E g r b t y , t · η b t y , t E b t d m y , t / η b t y , t
E d m y , t = E p v d m y , t + E b t d m y , t + E g r d m y , t
E g r y , t = E g r d m y , t + E g r b t y , t
In the equations above, y = {1, …, 25}: years, t = {1, …, 8760}: hours, Epv: PV power generation (kWh), Epv dm: PV power self-consumption amount (kWh), Epv bt: photovoltaic power charge (kWh), Epv gr: photovoltaic power sales (kWh), Ebt: electricity storage (kWh), Egr bt: system power charge (kWh), Ebt dm: discharge (kWh), η_bt: battery charge/discharge efficiency, Edm: power consumption (kWh), E(grdm): system Electricity consumption (kWh), and Egr: power purchase amount (kWh).
As shown in Equation (5) below, the storage battery operates so as to store less than the effective capacity.
E b t y , t C A P b t y , t
CAPbt: Storage battery effective capacity (kWh)
The profit P (JPY) from the purchase of system power and the sale of solar power was calculated using Equation (6). The total profit NetP (JPY) was calculated as the discounted present value using Equation (7). The discount rate r was set to 1.5% with reference to the fixed-rate mortgage “Flat 35” [32].
P y , t = U n i t P s e l l y , t · E p v g r y , t U n i t P b u y y , t · E g r y , t
N e t P = y t P y , t 1 + r y
UnitPsell: Power purchase unit price of grid power (JPY/kWh), UnitPbuy: photovoltaic power sale unit price (JPY/kWh).

2.7. Scenarios and Assessments

In our analysis, we assumed seven scenarios for residential energy supply and demand simulation, as shown in Table 5. Scenario Ref was a reference scenario where neither solar power generation nor a storage battery was introduced. Scenario PV introduced only solar power generation, while Scenario PV + BT is an umbrella term in which both a PV power generation and a storage battery were introduced. In this scenario (PV + BT), there were five different storage battery operation modes. Of these, three scenarios (a, b, and c) adopted only a specific battery operation mode, while two scenarios (a–c and b–c) switched the battery operation mode at the time when the FIT purchase contract period was over.
The profitability of Scenario X, ECON (JPY), was calculated using Equation (8) as a difference between Scenario Ref and the total profit. In addition, the self-consumption electricity rate of PV power generation under Scenario X, i.e., SELF, was calculated by Equation (9).
E C O N x = N e t P x N e t P R e f
S E L F x = 1 y , t E p v g r x , y , t y , t E p v x , y , t

2.8. Factor Analysis Using Multiple Regression Analysis

Power consumption, solar power generation, and electricity rate plans differ across households and regions. This difference can affect economic efficiency. To quantitatively clarify the degree of influence, factor analysis using a multiple regression model was performed using “IBM SPSS Statistics 25”. The dependent variable of the multiple regression model was the economic efficiency ECON (JPY) in each household. The independent variables were the following four: the annual power consumption (kWh/year) in each household, the annual solar power generation amount per 1 kW of capacity (kWh/kW/year), the daily average of the power unit price (JPY/kWh), and the price difference between daytime/morning/evening time and nighttime (JPY/kWh) (hereinafter referred to as day/night price difference). The latter two variables are shown in Table 6.
Table 7 shows the correlation coefficient between the independent variables. When the correlation between the explanatory variables is large, i.e., ±0.7 to ±1.0, it is necessary to pay attention to multicollinearity, in which the estimator cannot be obtained correctly. This analysis, however, does not have explanatory variables with a large correlation. To select explanatory variables, the stepwise method was used, and the optimum combination of explanatory variables was searched for by adding and deleting four explanatory variables one by one.

2.9. Sensitivity Analysis

2.9.1. Uncertainty Analysis of Parameters

As described in Section 2.3, Section 2.4 and Section 2.5, there is uncertainty in some parameters, and these may change depending on future trends. Therefore, one of the six parameters shown in Table 8 was set to change from low to high, while the remaining five parameters were set to be in the middle level in the analyses. We also evaluated the effect of self-consumption. In all the analyses, except for the sensitivity analysis, all parameters in Table 8 were set to the middle level.

2.9.2. Impact Analysis of Aging Deterioration in Effective Capacity of Storage Batteries

There are two types of factors to explain deterioration of the capacity of storage batteries. One is cycle deterioration influenced by the number of charge/discharge cycles. The other is calendar deterioration which is subject to the influence of the time elapsed. The effective capacity of the storage battery shown in Table 8 mainly considers the effect of cycle deterioration. However, the effects of calendar deterioration have not been fully considered for the fact that no data available for analysis were available. Therefore, to evaluate the effect of the performance deterioration of the storage battery in consideration of the calendar deterioration, the effect analysis of the effective capacity of the storage battery due to the aging was performed. We therefor evaluated the effect of a decrease in effective capacity on economic efficiency by performing simulations by altering the capacity retention rate of the storage battery after 30 years between 10% and 80%. The effective storage battery capacity shown in Table 8 corresponds to a retention rate of 60% for the low level, 70% for the medium level, and 80% for the high level.

3. Results

3.1. Profitability

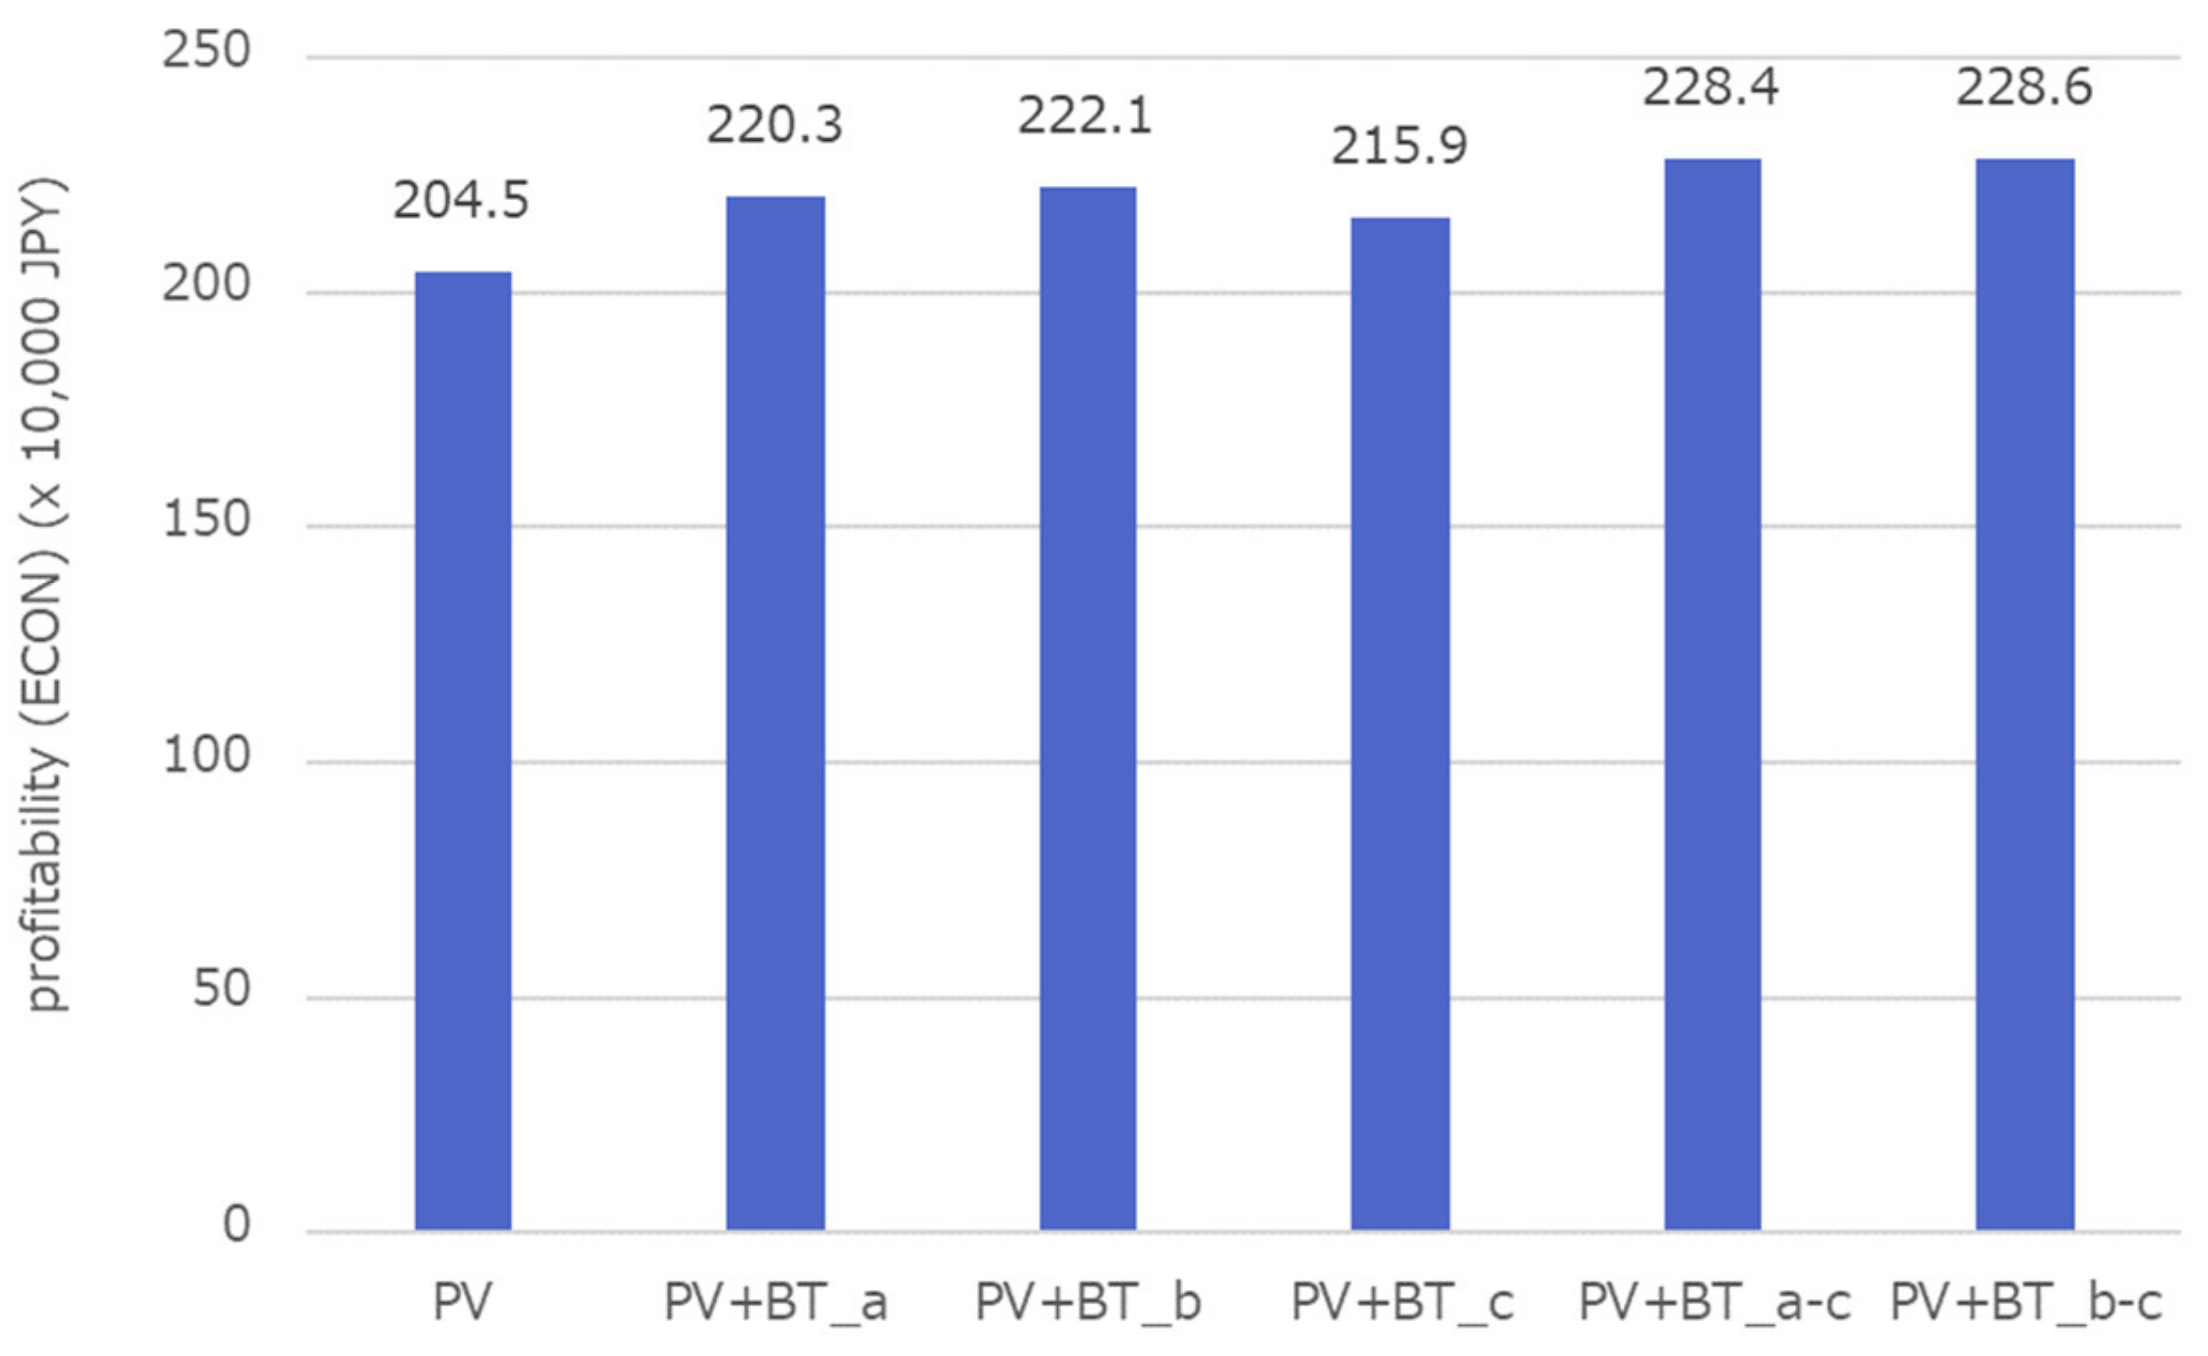
3.1.1. Comparing Scenarios

Figure 6 shows the profitability of each scenario. In all scenarios, the profitability has a positive value, demonstrating that the use of solar power generation and storage batteries increases profit. The highest economic performance among the PV+BT scenarios were Scenario PV+BT_a-c and Scenario PV+BT_b-c, in which the battery operation modes were switched after the FIT expires. As the unit sales price of solar power generation drops to less than half its original value, the economic performance was higher when the no-boosting (PV charging) mode was selected after the expiration of the FIT scheme. The profitability of Scenario PV+BT_a, in which boosting mode continued to operate, was low. In this mode, the amount of surplus electricity sold was large; therefore, the purchase price was high, and it was profitable at the beginning of FIT. However, as the purchase price has fallen sharply, the merits of boosting became limited. This means that Scenario PV+BT_b without boosting became more profitable.

3.1.2. Comparison among Regional Areas

Figure 7 shows the profitability of three scenarios that yielded high economic performance, i.e., Scenario PV+BT_b, Scenario PV+BT_a-c, and Scenario PV+BT_b-c. It is shown by region.
Profitability is the highest in Chubu, ranging from 266.9 to 2.754 million JPY. Hokuriku, on the other hand, has the lowest profitability with 201.0 to 2.026 million JPY. The regional difference in profitability is large, marking a difference of 600,000 JPY or more. In Chubu, the annual amount of solar power generation is large, and the unit price of electricity during the daytime is high. On the contrary, in Hokuriku, the annual amount of solar power generation is small, and the unit price of electricity during the daytime is low. As can be seen from the results of the multiple regression analysis described below, the difference between the day and night price of annual photovoltaic power generation and the unit price of electricity has a positive effect on economic efficiency. The economic efficiency is large in Chubu and small in Hokuriku.
In addition, the optimal scenario differs depending on the region. PV+BT_b is the most economical in Hokkaido and Tohoku, and the difference from PV+BT_a-c and PV+BT_b-c is 34,000 to 48,000 JPY. The economic efficiency of PV+BT_a-c and PV+BT_b-c is large in other areas, and the difference from PV+BT_b is 12,000 to 190,000 JPY.
The economic performance is high in Hokkaido, which consumes a large amount of electricity, and in Chubu and Shikoku, which consume large amounts of solar power. The economic performance is low in Hokuriku. It can therefore be said that the results show that the optimal scenario differs depending on the region. The rate plans for Hokkaido and Tohoku have a three-level rate system, and the unit price of daytime electricity is high, more than 40 JPY/kWh. Therefore, Scenario PV+BT_b is the most economical because it boosts generation to reduce the purchase of grid power during daytime. In other areas, Scenario PV+BT_a-c and Scenario PV+BT_b-c are more economical. Overall, Scenario PV+BT_b-c tends to be the most economical.

3.1.3. Results of Multiple Regression Analysis

A multiple regression analysis was conducted to evaluate the effects of differences in power consumption, solar power generation, and electricity rate plans in households and regions on economic efficiency. Table 9, Table 10 and Table 11 show the results of regression analysis on the economic efficiency of PV+BT_b, PV+BT_a-c, and PV+BT_b-c.
The adjusted coefficient of determination (adjusted R2) was 0.617 to 0.705, and the results of analysis of variance indicated that all regression models were significant at the 0.1% level. In addition, all four explanatory variables were adopted in all regression models, which were significant at the 5% level. Next, comparing the standard partial regression coefficients of each explanatory variable, the annual amount of photovoltaic power generation was the largest and the degree of influence on economic efficiency was the largest in all regression models. From the value of the partial regression coefficient, the economic efficiency increases by 1926 to 1970 JPY by increasing the annual amount of solar power generation (per 1 kW of capacity) by 1 kWh. The explanatory variables that had the second largest impact after the annual solar power generation amount differed depending on the scenario. In PV+BT_b, the day/night price difference of the electric energy charge unit price was the explanatory variable that had the second largest impact. In PV+BT_a-c and PV+BT_b-c, the daily average of electricity charge unit price was the second most influential explanatory variable. With PV+BT_b, which charges grid power during the nighttime, the greater the day/night price difference between the electricity charge unit prices, the higher the profitability. When the day/night price difference increased by 1 JPY/kWh, the profitability of PV+BT_b increased by 25,369 JPY. This explains the fact that PV+BT_b had the highest profitability in Hokkaido and Tohoku, where the price difference between day and night is large. After the FIT purchase periods, PV+BT_a-c and PV+BT_b-c, which were charged with surplus electricity generated by solar power generation, were easily affected by the daily average of electricity charge unit price. When the daily average of the electricity charge unit price increased by 1 JPY/kWh, the economic efficiency of PV+BT_a-c increased by 45,196 JPY, and the economic efficiency of PV+BT_b-c increased by 46,176 JPY.

3.1.4. Analyzing the Unit Price of PV Power Generation and Storage Batteries in View of Investment Recoverability

Figure 8 shows the relationship between PV power unit price (JPY/kW) and storage battery unit price (JPY/kWh (rated capacity)) (both including tax) in Scenario PV+BT_b-c. Due to space limitations, only the results for Chubu and Hokuriku are shown. Regarding the power conditioner, the price and lifespan were assumed to be 2,205,000 JPY and 12.5 years respectively, based on data from the Procurement Price Calculation Committee (2020) [30].
The results of our analysis indicate that the conditions for investment recovery differ depending on the region. In Chubu, solar power generation and storage systems were shown to have the highest profitability, meaning that it was easy to realize investment recovery. At the current market price, solar power generation costs 200,000–300,000 JPY/kW, and storage battery power 150,000–300,000 JPY/kWh. It is possible to recover the investment within 20 years by selecting the appropriate equipment. Conversely, Hokuriku is the region with the lowest profitability and the conditions for return on investment were more severe. If the unit price of solar power generation is 200,000 JPY/kW, investment recovery within 20 years cannot be realized unless the storage battery achieves the target price of 90,000 JPY/kWh in 2020 [33].

3.2. Self-Consumption Rates of Solar Power Generation

3.2.1. Comparing Scenarios

Figure 9 shows the self-consumption rate of each scenario. Among the PV+BT scenarios, Scenario PV+BT_c, Scenario PV+BT_a-c, and Scenario PV+BT_b-c have high self-consumption rates, and more than half of the generated power was privately consumed. As these scenarios use no-boosting (PV charging) mode, which charged the surplus power of PV power generation, the self-consumption rate increased. On the contrary, the self-consumption rates of Scenario PV+BT_a and Scenario PV+BT_b, both of which do not adopt the no-boosting (PV charging) mode, were the same as or lower than that of PV alone. Therefore, it is important to not only introduce self-consumption of PV power generation but also to select an appropriate battery operation mode.

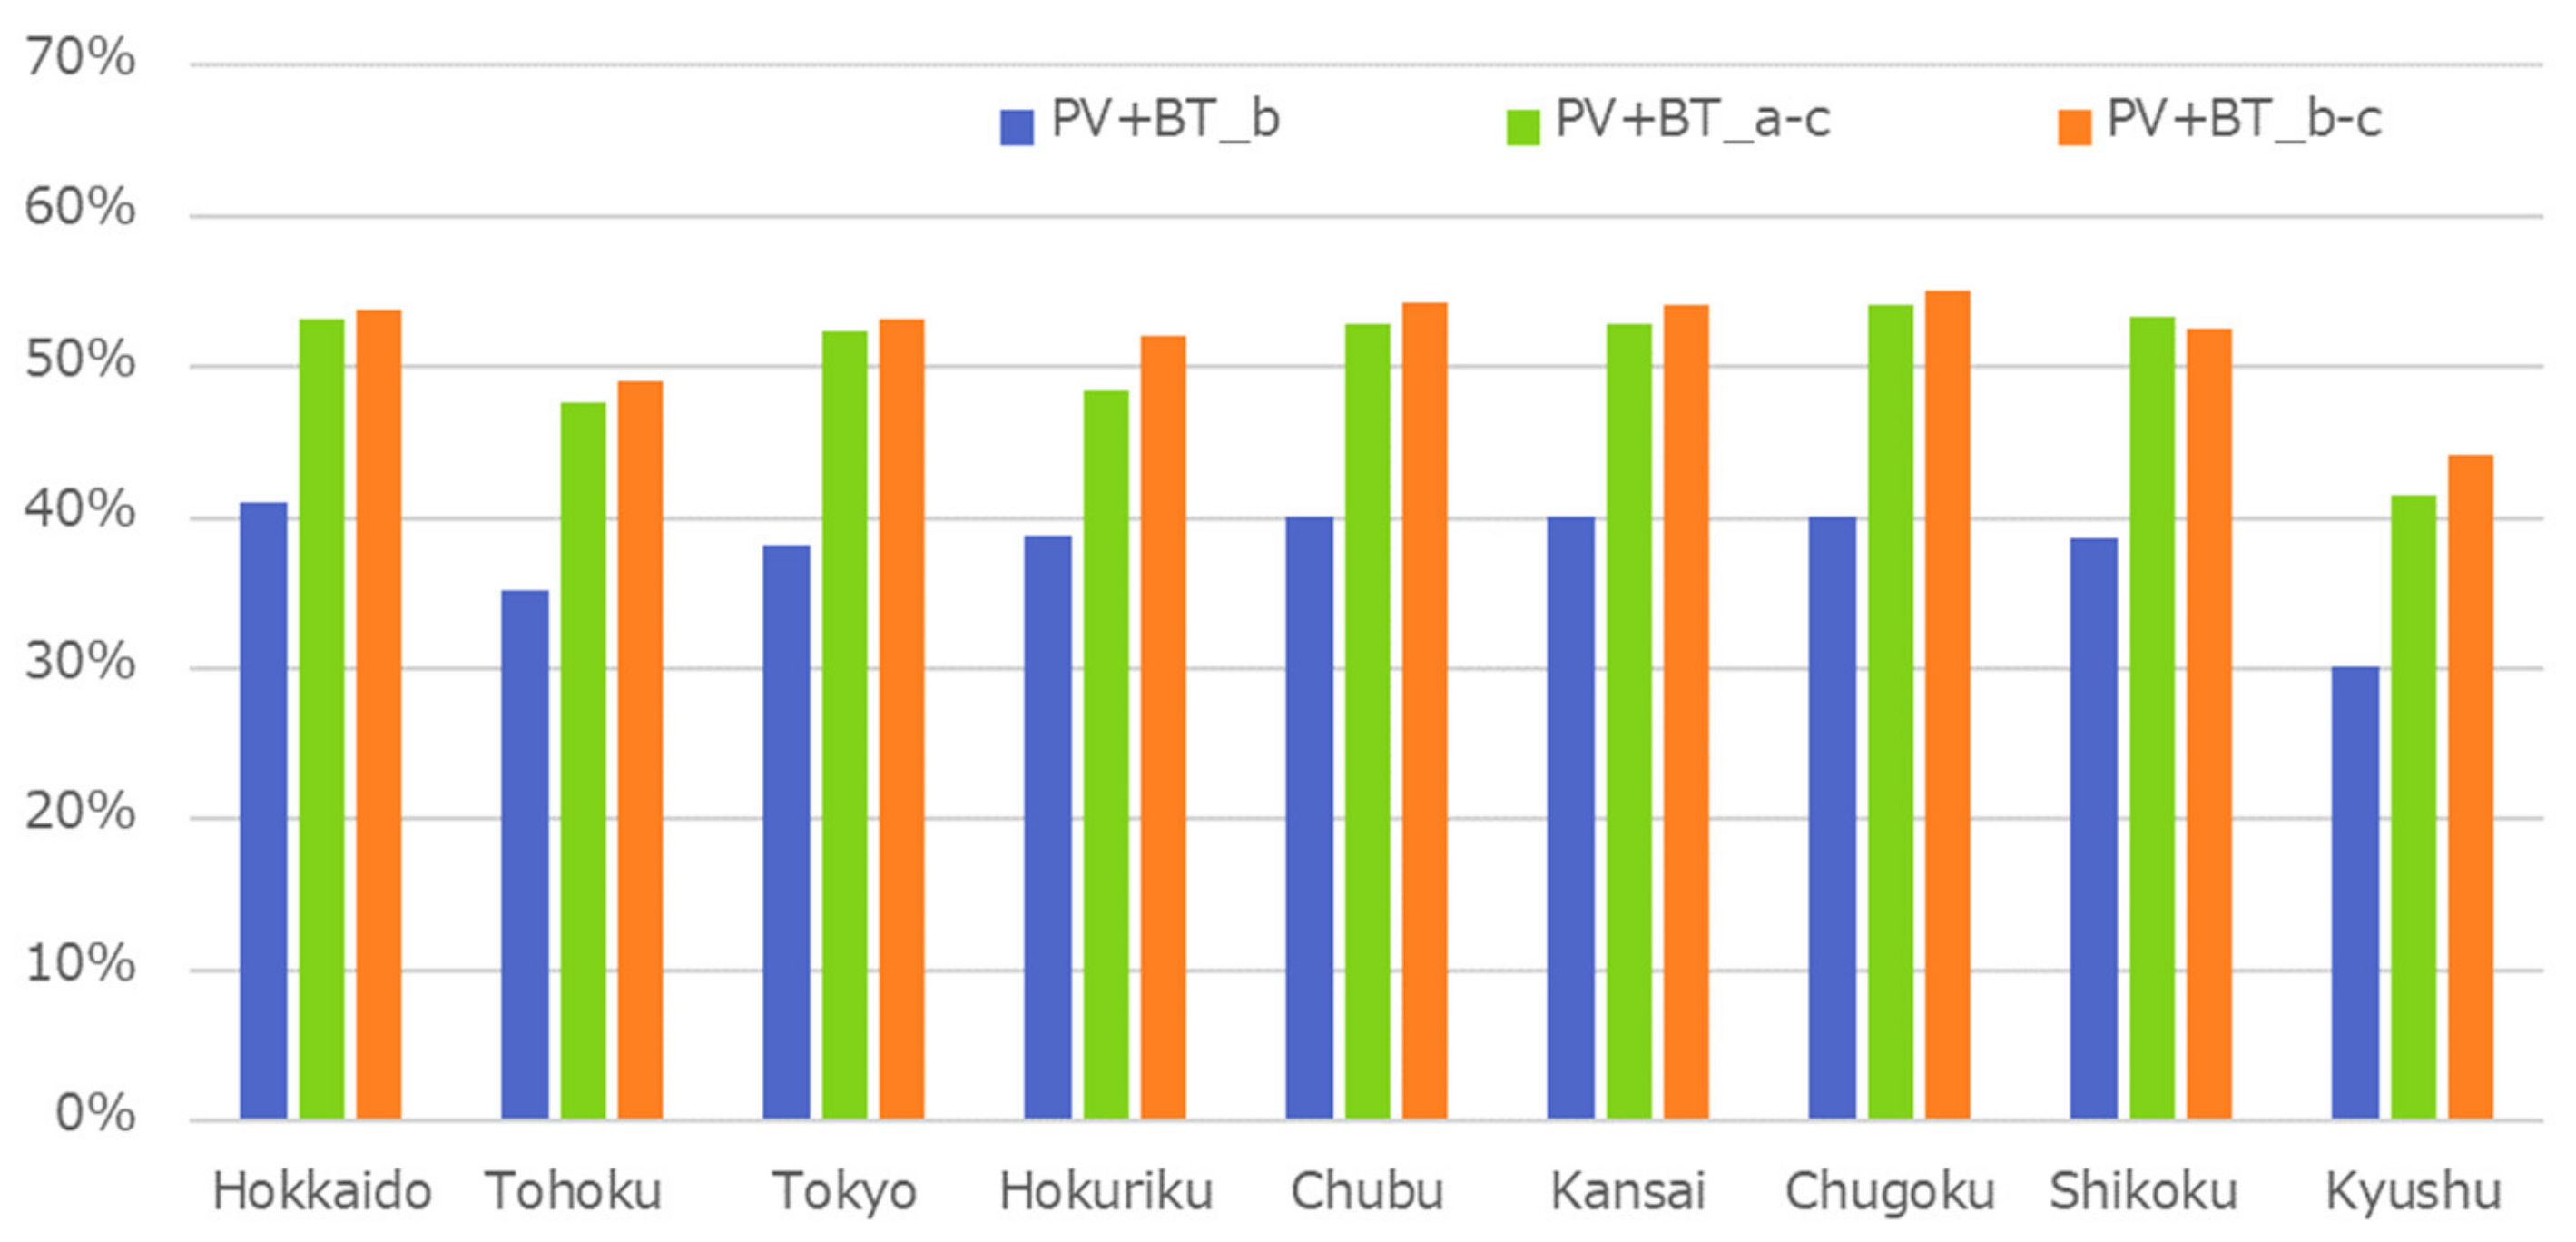
3.2.2. Comparing Regions

Figure 10 shows the changes in the self-consumption rate at five-year intervals for Scenario PV+BT_b, Scenario PV+BT_a-c, and Scenario PV+BT_b-c, all of which showed high economic performance, as described in 3.1. For Scenario PV+BT_a-c and Scenario PV+BT_b-c, in which a switch to the no-boosting (PV charging) mode when the purchase contract period of FIT was over, the self-consumption rates increased significantly when the switch happened. The private consumption rate of Scenario PV+BT_b, however, gradually increased. This is because power generation output decreases due to the age deterioration of PV power generation, leading to the decline in the amount of surplus power sold.
Figure 11 shows the economic performance of Scenario PV+BT_b, Scenario PV+BT_a-c, and Scenario PV+BT_b-c by region. In Kyushu, where power consumption was low and solar power generation was high, the self-consumption rate was small. Comparing the self-consumption rates of each scenario in the same region, the self-consumption rate of Scenario PV+BT_b-c was the highest in all regions, except for Shikoku. We can therefore assert that the regional difference in the magnitude relationship of each scenario is small.

3.3. A Sensitivity Analysis

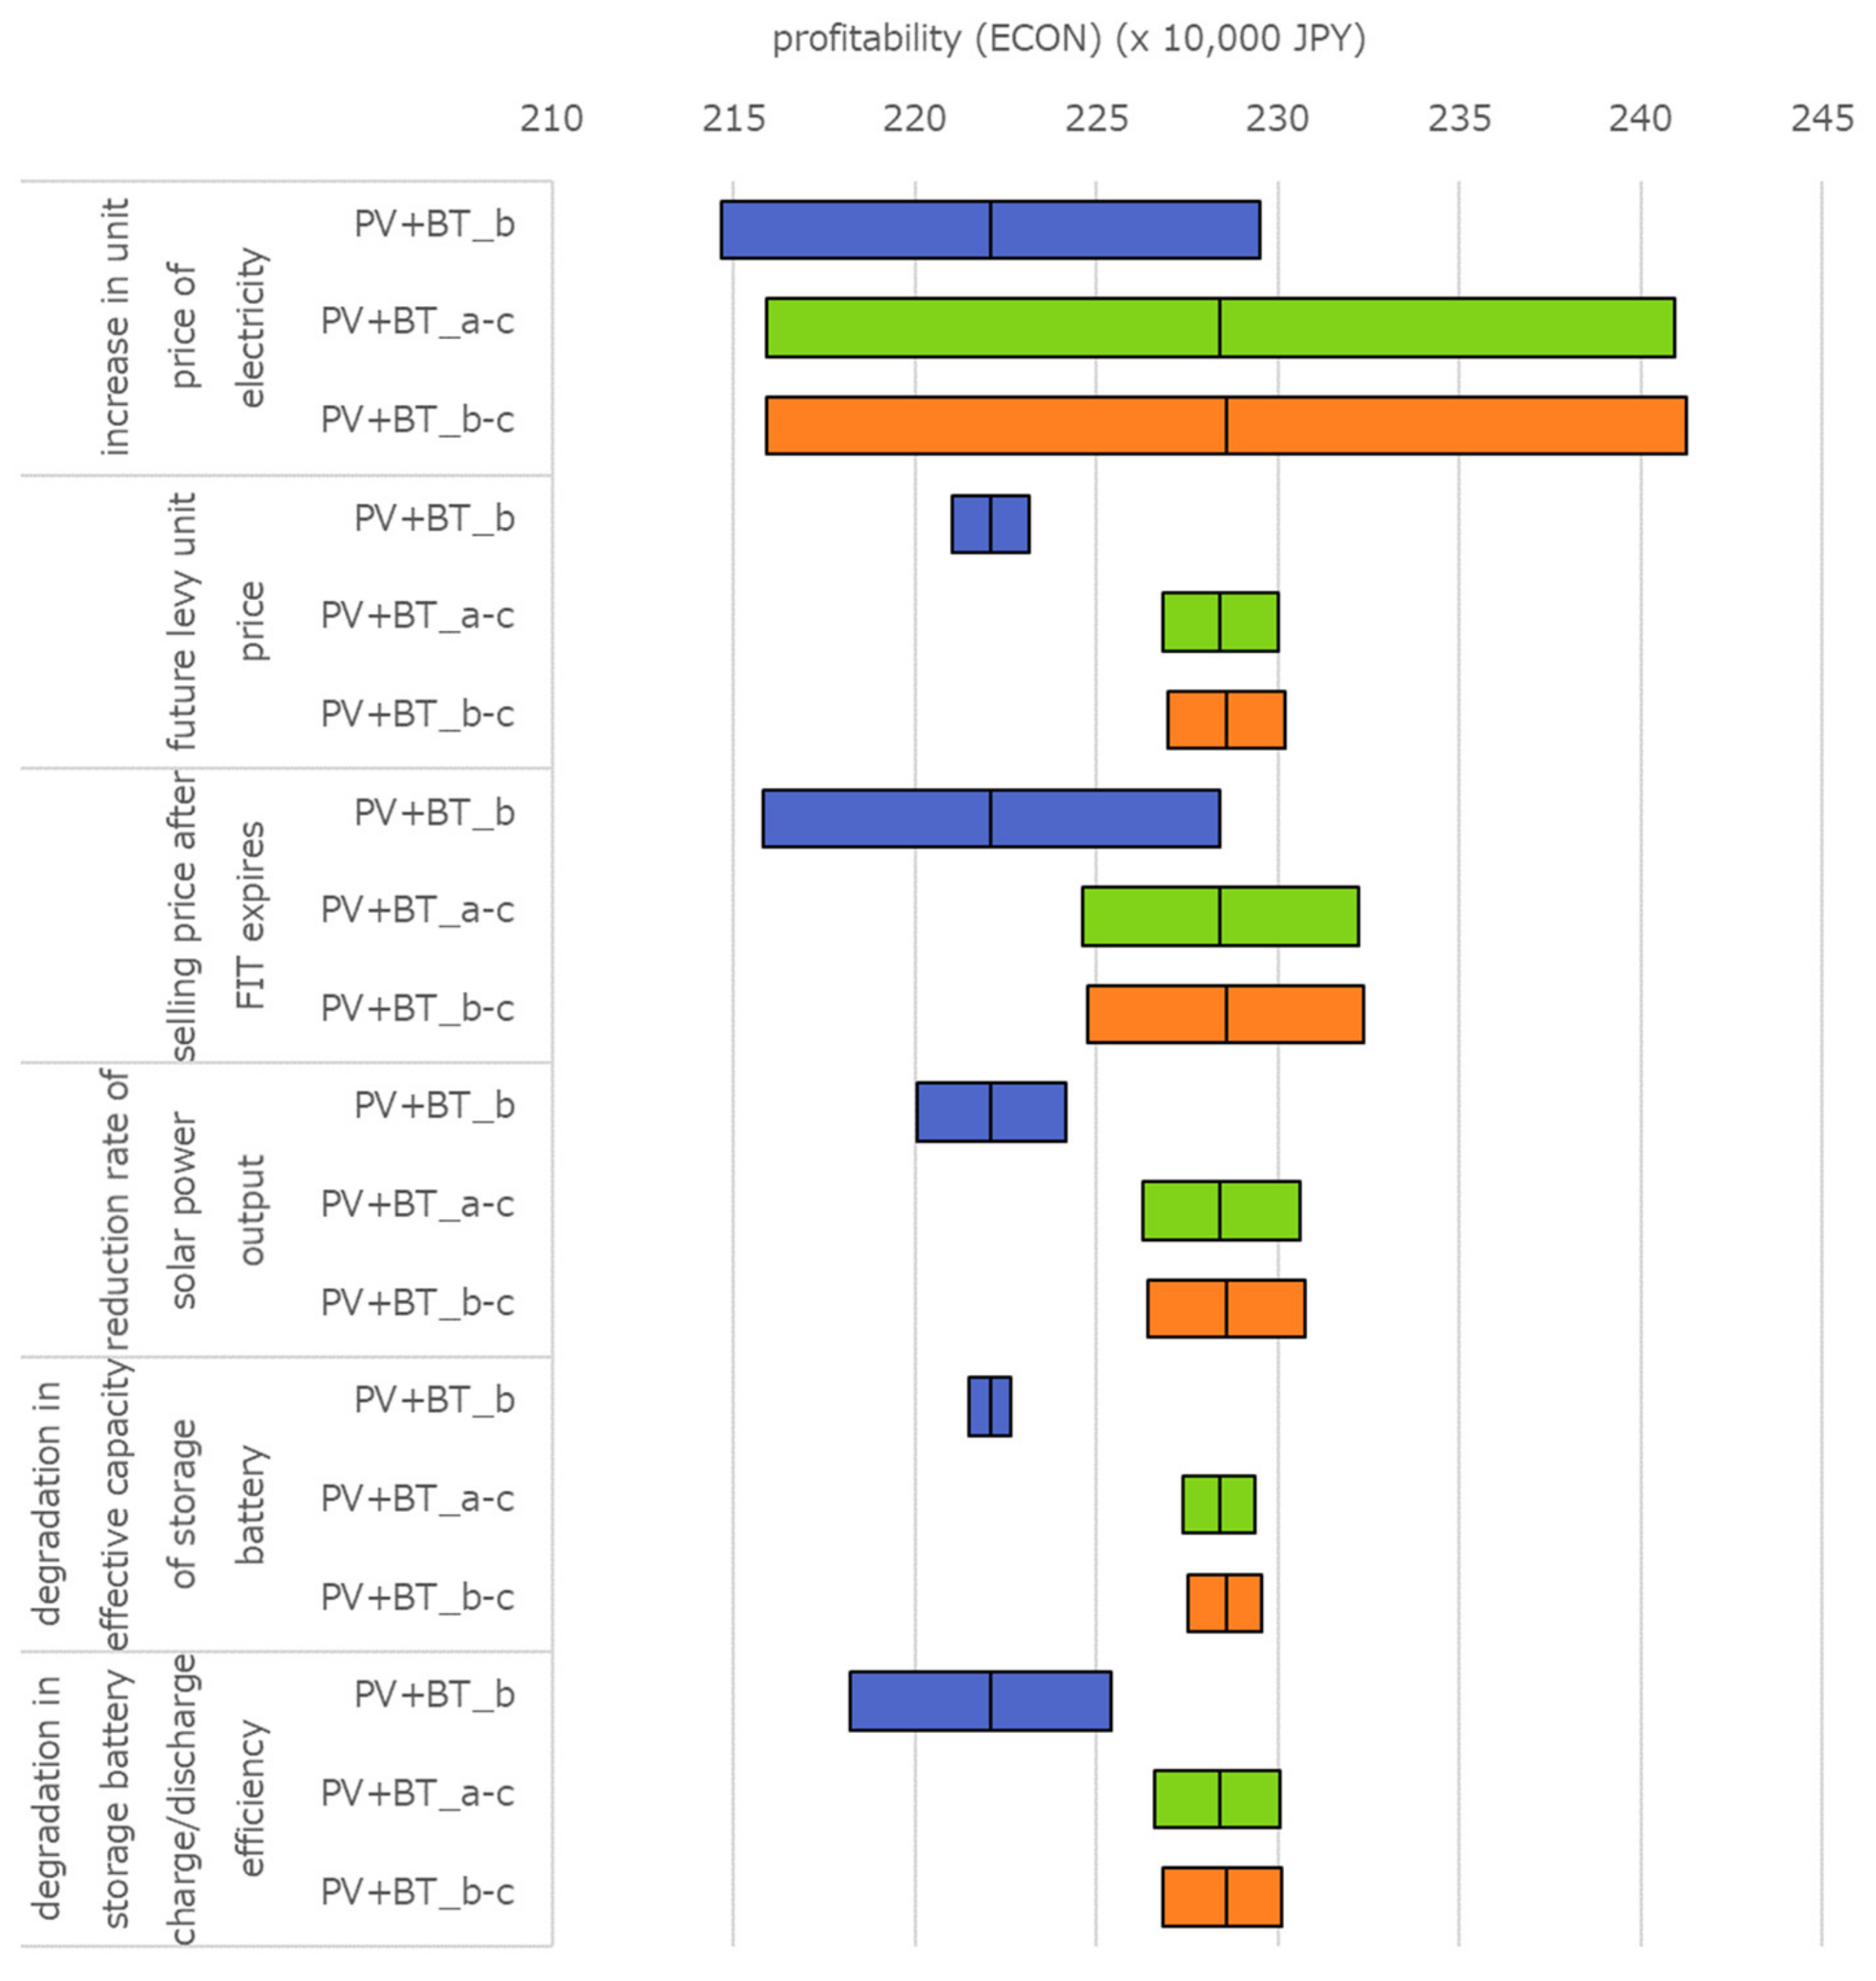
3.3.1. Impacts on Profitability

Figure 12 shows the effect of changing the parameters described in Table 6 on the economic performance of the PV power generation/storage system. Of the six parameters, the increase in the unit price of electricity was the most influential. The range of changes in profitability were ±74,000 JPY for PV+BT_b, ±125,000 JPY for PV+BT_a-c, and ±127,000 JPY for PV+BT_b-c. The next biggest impact was the selling price of electricity after the FIT purchase period. The range of changes in profitability were ±63,000 JPY for PV+BT_b and ±38,000 JPY for PV+BT_a-c and PV+BT_b-c. Since the photovoltaic power generation/storage system is profitable from the price difference between buying and selling electricity, these parameter changes are directly linked to profitability of the system. Interestingly, the impact of future levy unit prices on profitability of the system is rather small. The change in profitability in this regard was ±10,000 JPY for PV+BT_b and ±16,000 JPY for PV+BT_a-c and PV+BT_b-c. This is because the increase in the levy unit price is 0.16 JPY/(kWh/year) even in the high case, which is about one third of the increase in the electricity charge unit price, and that the levy unit price is expected to decrease after 2030. The results of the sensitivity analysis revealed the following. The introduction of a photovoltaic power generation/storage system reduce the amount of surplus electricity sold, which reduce the future levy unit price. However, even if the levy unit price decreases in the future, profitability of the system is not impaired. In other words, it was suggested that household profits (improvement of economic efficiency) and public profits (decrease in levy unit price) can be achieved at the same time by introducing a PV power generation/storage system. For other parameters, the decrease in the effective capacity of the storage battery affects the economic efficiency of PV+BT_b to some extent. However, the degree of influence is small compared with the rise in the unit price of electricity and the selling price after the FIT purchase period. Regarding the other parameters, the decrease in the effective storage battery capacity affects the profitability of Scenario PV+BT_sb to some extent. However, the impact is smaller than the increase in the unit price of electricity and the selling price after the expiration of the FIT period.
Figure 13 shows the results of the sensitivity analysis on the increase in electricity unit price, which had the largest impact. The increase in the electricity unit price linearly affects the economic performance of the system and the profitability rises as the unit price increases. Moreover, the higher the unit price, the more profitable Scenario PV+BT_a-c and Scenario PV+BT_b-c become.

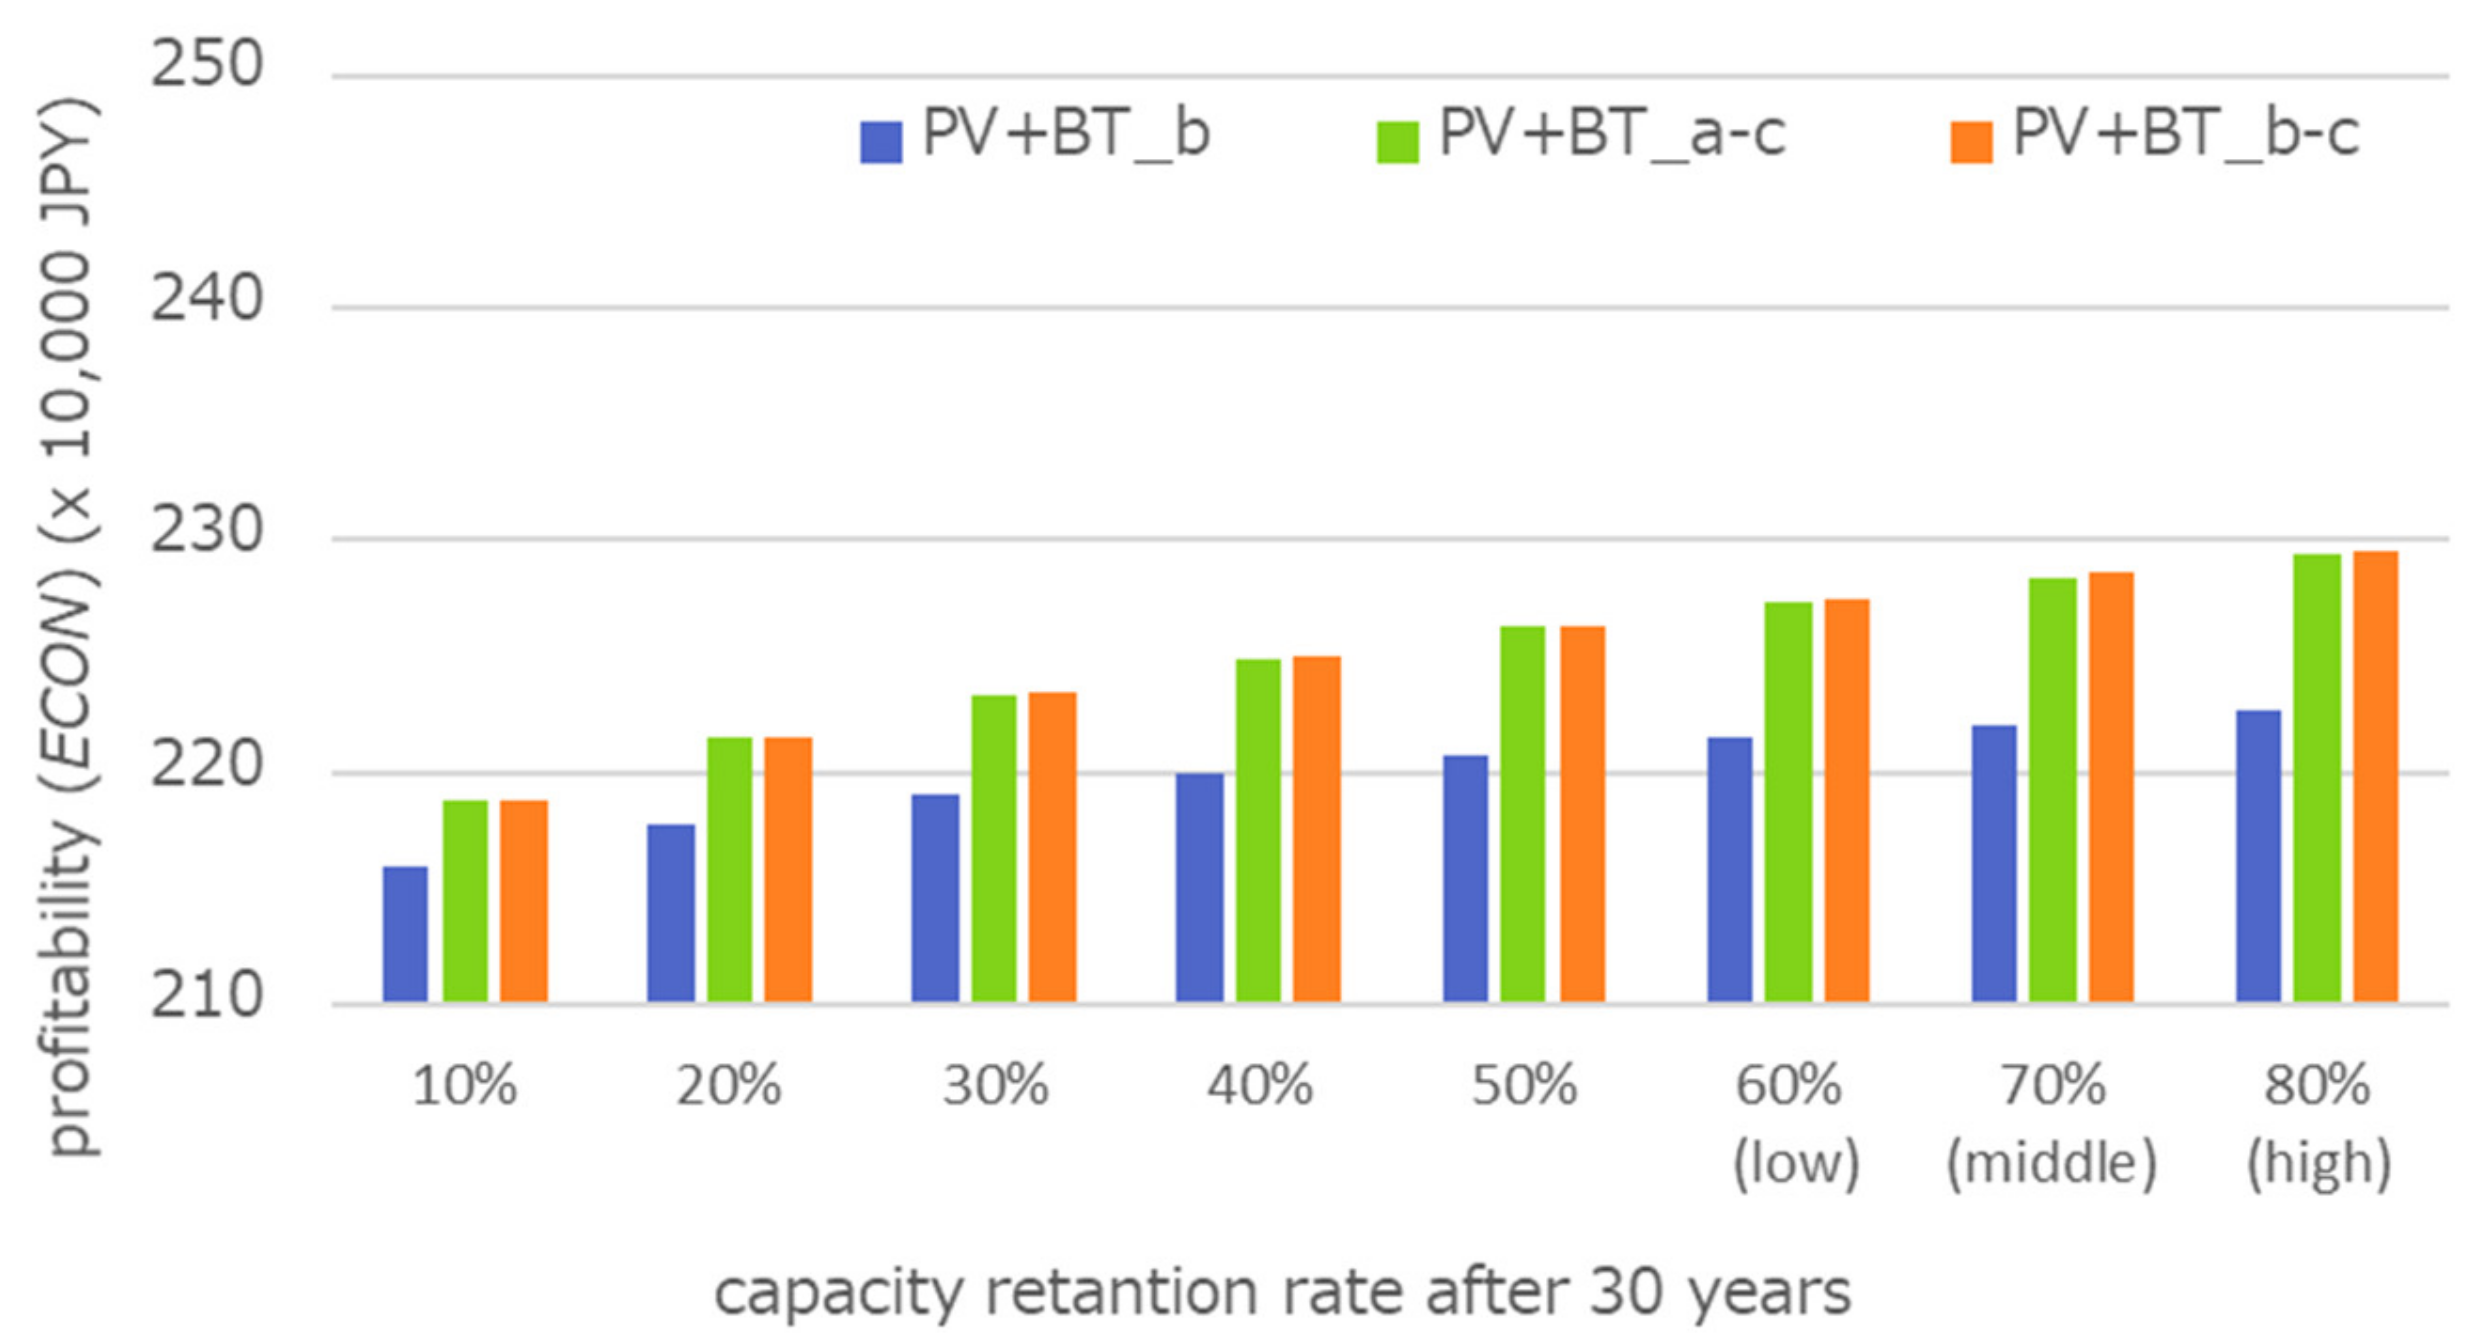
3.3.2. Effect of Time-Related Deterioration of Effective Capacity of The Storage Battery

Figure 14 shows the results of the sensitivity analysis that examines the effects of capacity retention on profitability of the PV storage battery system. The decrease in the capacity retention rate has a non-linear effect on the profitability of the system, and the lower the capacity retention rate, the lower the profitability. When the capacity retention rate drops significantly to 10%, which is the lowest assumed this study, the profitability was 2.160 million JPY for PV+BT_b and 2.188 million JPY for PV+BT_a-c and PV+BT_b-c. These are almost the same as the economic efficiency when the increase in the electricity charge unit price in Figure 13 is 0.055 JPY/kWh/year.

3.3.3. Impact on Self-Consumption Rate

Figure 15 shows the effect of changing the parameters listed in Table 6 on the self-consumption rate of PV power generation.
A decrease in the output of PV generation and a decrease in the effective capacity of the storage battery had some effect on the self-consumption rate, whereas the other parameters had no effect.

4. Conclusions

This study analyzed the profitability of residential PV battery systems in Japan by performing simulations to assess the self-consumption and economic performance of the systems, while considering various factors that have not been sufficiently studied to date. The main conclusions are summarized below:
  • The profitability of residential PV battery systems can be increased by charging the surplus PV power generated with a shift in the battery operation mode of the storage battery when the purchase contract period of FIT is over. Profitable battery operation modes and investment recovery conditions differ by regions.
  • By selecting the operation mode to charge the surplus power, more than half of the generated power can be consumed at home.
  • The results of the sensitivity analysis showed that an increase in the unit price of electricity, the selling price after the expiration of the FIT period, and significant decrease in battery capacity retention rate greatly affect the economic efficiency of the system. However, the economic efficiency of the system is not impaired when the future levy unit price decreases due to an increase in private consumption.
In this present study, we evaluated the effect of introducing a home-use PV power generation/storage system, assuming typical values of a PV power generation capacity of 4.5 kW and a storage battery rated capacity of 5.65 kWh. We recognize that it may be more profitable to introduce larger capacity photovoltaics and batteries in households that consume larger amount of electricity. In the future, we would like to evaluate how the difference in the installed capacity of PV power generation and storage batteries affects the profitability of the system and the self-consumption rate. In addition, we calculated the profitability based on the current electricity rate plan for all-electric homes. However, the electricity rate plan itself may change due to changes in the power source composition over the long term. It is necessary to combine micro-analysis focusing on individual households and macro-analysis focusing on the power system to evaluate the impact of changes in electricity rate plans on the effects of introducing home-use PV power generation and power storage systems.
The scope of our research is limited to the current situation in Japan due to the fact that the calculation results were obtained from electricity rate plans and power consumption data in Japan. It is expected, however, that internet-of-things (IoT) devices such as home energy management system (HEMS), that measure the power consumption of individual houses, are in the process of being introduced in many countries across the world. The simulation method employed in this study, which utilizes the actual power consumption data of individual houses, can inform future studies on the profitability of residential PV battery systems in other countries.

Author Contributions

Conceptualization, T.H., A.O.; methodology, T.H., A.O.; software, T.H., A.O.; validation, A.O.; formal analysis, T.H., A.O.; investigation, H.W.; data curation, T.H.; writing—original draft preparation, T.H, A.O., H.W.; writing—review and editing, H.W.; visualization, H.W., A.O.; supervision, T.H.; project administration, T.H.; funding acquisition, T.H., A.O. All authors have read and agreed to the published version of the manuscript.

Funding

This research was funded by JSPS KAKENHI Grant Numbers JP 18H04155, JP 18K14171.

Institutional Review Board Statement

Not applicable.

Informed Consent Statement

Not applicable.

Data Availability Statement

Not applicable.

Conflicts of Interest

The authors declare no conflict of interest.

References

  1. IRENA. Electricity Storage and Renewables: Costs and Markets to 2030. 2017. Available online: https://www.irena.org/publications/2017/Oct/Electricity-storage-and-renewables-costs-and-markets (accessed on 23 March 2021).
  2. Weniger, J.; Bergner, J.; Tjaden, T.; Quaschning, V. Economics of Residential PV Battery Systems in the Self-Consumption Age. In Proceedings of the 29th European PV Solar Energy Conference and Exhibition, Amsterdam, The Netherlands, 22–26 September 2014; pp. 3871–3877. [Google Scholar]
  3. Naumann, M.; Karl, R.C.; Truong, C.N.; Jossen, A.; Hesse, H.C. Lithium-ion Battery Cost Analysis in PV-household Application. Energy Procedia 2015, 73, 37–47. [Google Scholar] [CrossRef] [Green Version]
  4. Truong, C.N.; Naumann, M.; Karl, R.C.; Müller, M.; Jossen, A.; Hesse, H.C. Economics of Residential Photovoltaic Battery Systems in Germany: The Case of Tesla’s Powerwall. Batteries 2016, 2, 14. [Google Scholar] [CrossRef]
  5. Kaschub, T.; Jochem, P.; Fichtner, W. Solar Energy Storage in German Households: Profitability, Load Changes and Flexibility. Energy Policy 2016, 98, 520–532. [Google Scholar] [CrossRef] [Green Version]
  6. Japan Electrical Manufacturers’ Association. JEMA Chikuden Shisutemu Bijon Ver.5, 2020 [Prospects for Power Storage System Ver.5, 2020]. Available online: https://www.jema-net.or.jp/jema/data/S7216(20200313).pdf (accessed on 23 March 2021).
  7. Tabuchi Electrics Press Release, 26 September 2019. Available online: http://www.zbr.co.jp/news/docs/%E4%BD%8F%E5%AE%85%E7%94%A8%E8%93%84%E9%9B%BB%E3%83%8F%E3%82%A4%E3%83%96%E3%83%AA%E3%83%83%E3%83%89%E3%82%B7%E3%82%B9%E3%83%86%E3%83%A0%E2%80%9CEIBS7%E2%80%9D%E6%96%B0%E7%99%BA%E5%A3%B2.pdf (accessed on 23 March 2021).
  8. Tabuchi Electrics Storage Hybrid System. Available online: http://www.enetelus.jp/products/post_eibs2.html (accessed on 23 March 2021).
  9. Sharp. Cloud Battery System. Available online: https://jp.sharp/e_solution/battery/products/wb1821_spec.html (accessed on 23 March 2021).
  10. Sharp. Cloud Battery System. Available online: https://jp.sharp/e_solution/battery/products/wb1621_spec.html (accessed on 23 March 2021).
  11. Eliiy Power. Power iE6 Hybrid. Available online: https://www.eliiypower.co.jp/products/general/pi6h.html (accessed on 23 March 2021).
  12. Eliiy Power. Power iE5 Link. Available online: https://www.eliiypower.co.jp/products/general/pi5l.html (accessed on 23 March 2021).
  13. Panasonic. Energy Bill Simulation—ENEPITA. Available online: https://sumai.panasonic.jp/solar_battery/simulation/ (accessed on 23 March 2021).
  14. Kyocera. Residential Solar Power Generation Simulation. Available online: http://solarsystem.kyocera.co.jp/solar/app/simu/bp/step1.html (accessed on 23 March 2021).
  15. Omine, E.; Kobayashi, H.; Asari, M.; Ueno, T. PV Setchi Juyoka Niokeru Chikudenchi No Keizaiseihyoka—Chikudenchi Setchi Niyori Keizai Meritto Gashojiru Joken no Kento, [Economical Evaluation of Battery Energy Storage System for PV Installing Customer -Evaluation of Condition to Obtain Economic Benefit by Installing Battery-]. CRIEPI Res. Rep. 2013, R122018. Available online: https://criepi.denken.or.jp/jp/kenkikaku/report/detail/R12018.html (accessed on 23 March 2021).
  16. Yabe, K.; Hayahsi, Y. An Evaluation of Economical Capacity of Storage Battery Equipped with Residential PV System and Reverse Power Flow Pattern. IEEJ Trans. Power Energy 2018, 138, 175–182. [Google Scholar] [CrossRef]
  17. Yabe, K.; Hayahsi, Y. Economic Evaluation of Increased Self-Use of PV Output Driven by Storage Battery System. IEEJ Trans. Power Energy 2019, 139, 363–371. [Google Scholar] [CrossRef]
  18. Power Generation Cost Verification Working Group. Report on Verification of Power Generation Costs, etc. to the Long-Term Energy Supply and Demand Outlook Subcommittee (Reference Material 2) List of Specifications for Each Power Source. Available online: https://www.enecho.meti.go.jp/committee/council/basic_policy_subcommittee/mitoshi/cost_wg/pdf/cost_wg_03.pdf (accessed on 23 March 2021).
  19. Hokkaido Electric Power Company. Government Approval of Rise in Electricity Charge Rise. Available online: https://wwwc.hepco.co.jp/hepcowwwsite/info/2014/__icsFiles/afieldfile/2014/10/15/authoriz_previse_1.pdf (accessed on 23 March 2021).
  20. Tohoku Electric Power Company. Government Approval of Rise in Electricity Charge Rise. Available online: https://www.tohoku-epco.co.jp/ryokin_app/reason/pdf/summary_ninka.pdf (accessed on 23 March 2021).
  21. Tokyo Electric Power Company. Approved Electricity Charge Rates. Available online: https://www.tepco.co.jp/cc/press/betu12_j/images/120725j0201.pdf (accessed on 23 March 2021).
  22. Hokuriku Electric Power Company. Revision of Electricity Charge Rates. Available online: http://www.rikuden.co.jp/press/attach/17112901.pdf (accessed on 23 March 2021).
  23. Chubu Electric Power Company. Government Approval of Rise in Electricity Charge Rise. Available online: https://www.chuden.co.jp/publicity/press/__icsFiles/afieldfile/2020/02/12/20140418_pre.pdf (accessed on 23 March 2021).
  24. Kansai Electric Power Company. Price Cut in Electricity Charge. Available online: https://www.kepco.co.jp/corporate/pr/2018/pdf/0528_1j_01.pdf (accessed on 23 March 2021).
  25. Chugoku Electric Power Company. Revision of Electricity Rates. Available online: https://www.energia.co.jp/press/2019/12018.html (accessed on 23 March 2021).
  26. Shikoku Electric Power Company. Government Approval of Rise in Electricity Charge Rise. Available online: https://www.yonden.co.jp/press/re1308/data/pr001-01.pdf (accessed on 23 March 2021).
  27. Kyushu Electric Power Company. Price Cut in Electricity Charge. Available online: http://www.kyuden.co.jp/var/rev0/0186/0444/ku54dd14.pdf (accessed on 23 March 2021).
  28. Japan Photovoltaic Energy Association. 3.1 Calculation of Expected Annual Power Generation. Available online: http://www.jpea.gr.jp/pdf/011.pdf (accessed on 23 March 2021).
  29. Agency for Natural Resources and Energy. Response to Reconstruction of Renewable Energy Policy. 2019. Available online: https://www.meti.go.jp/shingikai/enecho/denryoku_gas/saisei_kano/pdf/014_08_00.pdf (accessed on 23 March 2021).
  30. Calculation Committee for Procurement Price. Opinions on Procurement Prices for 2020. Available online: https://www.meti.go.jp/shingikai/santeii/pdf/20200204001_1.pdf (accessed on 23 March 2021).
  31. Choi, S.; Sato, R.; Ishii, T.; Chiba, Y.; Masuda, J. Tasunen No Okugai Bakuro Niyoru Kakushu Taiyo Denchi Mojuru No Keijihenka Tokusei [Temporal Variation Properties of Various Solar Cell Modules due to Long-Term Outdoor Exposure]. Available online: https://unit.aist.go.jp/rpd-envene/PV/ja/results/2017/poster/P37_.pdf (accessed on 23 March 2021).
  32. Japan Housing Finance Agency. Flat 35. Available online: https://www.flat35.com/loan/flat35/ (accessed on 23 March 2021).
  33. Agency for Natural Resources and Energy. Price Reduction Scheme for Stationary Storage Batteries. Available online: https://www.meti.go.jp/committee/kenkyukai/energy_environment/energy_resource/pdf/005_08_00.pdf (accessed on 23 March 2021).
Figure 1. Typical configuration of a residential PV battery system used in this study.
Sustainability 13 05370 g001
Figure 2. Comparison of sample average with reference values in annual power consumption (above); comparison of sample average with reference values in solar power generation (below).
Sustainability 13 05370 g002
Figure 3. Power consumption per hour of sample average and that of reference values across the year.
Sustainability 13 05370 g003
Figure 4. Future renewable energy unit price levies.
Sustainability 13 05370 g004
Figure 5. Storage battery operation modes 1, 2, and 3.
Sustainability 13 05370 g005
Figure 6. Profitability of residential PV battery systems by scenario.
Sustainability 13 05370 g006
Figure 7. Profitability of residential PV battery systems by region.
Sustainability 13 05370 g007
Figure 8. Relationships between solar power generation unit price and storage battery unit price.
Sustainability 13 05370 g008
Figure 9. Self-consumption rate by scenario.
Sustainability 13 05370 g009
Figure 10. Changes in self-consumption rates.
Sustainability 13 05370 g010
Figure 11. Electricity Self-Consumption Rate by Region.
Sustainability 13 05370 g011
Figure 12. Effects of parameter changes on profitability.
Sustainability 13 05370 g012
Figure 13. Effects of the increased electricity unit price on profitability.
Sustainability 13 05370 g013
Figure 14. Effects of the capacity retention rate on profitability.
Sustainability 13 05370 g014
Figure 15. Effects of parameter changes on self-consumption rate.
Sustainability 13 05370 g015
Table 1. Potential factors that influence the profitability of residential PV battery systems.
Geographical FactorsPower Consumption/Solar Power Generation
Technical factors
-
initial system performance
-
performance degradation over time
-
battery operation mode
Socio-economic factors
-
electricity rate plans
-
increase in electricity rates
-
levy on renewable energy
-
electricity sales price
-
equipment prices and subsidies
Table 2. Electricity unit prices and time zones in rate plans for all-electric houses applied by electric power companies.
Electric Power CompanyTime Zones and Corresponding Electricity Unit Prices
Daytime HoursMorning Hours and Evening HoursNighttime Hours
Hokkaido Electric Power Company40.68 JPY (April–October: 13:00–18:00)
36.61 JPY (November–March: 13:00–18:00)
30.91 JPY (April–October: 8:00–13:00, 18:00–22:00)
27.82 JPY (November–March: 8:00–13:00, 18:00–22:00)
14.64 JPY (April–October: 22:00–08:00)
13.18 JPY (November–March: 22:00–08:00)
Tohoku Electric Power Company43.14 JPY (July–September: 10:00–17:00, December–February: 16:00–18:00)
39.22 JPY (March–June, October–November: 10:00–17:00)
26.73 JPY (March–November 8:00–10:00, 17:00–22:00, December–February: 8:00–16:00, 18:00–22:00)11.43 JPY (year-round: 22:00–08:00)
Tokyo Electric Power Company25.80 JPY (year-round: 6:00–01:00) 17.78 JPY (year-round: 01:00–6:00)
Hokuriku Electric Power Company34.95 JPY (July–September, weekdays: 8:00–20:00)
25.07 JPY (October–June, weekdays: 8:00–20:00)
19.64 JPY (holidays: 8:00–20:00)
12.51 JPY (year-round: 20:00–08:00)
Chubu Electric Power Company38.71 JPY (weekdays: 10:00–17:00)28.52 JPY (weekdays: 8:00–10:00, 17:00–22:00, holidays: 8:00–22:00)16.30 JPY (year-round: 22:00–08:00)
Kansai Electric Power Company27.51 JPY (July–September, weekdays: 10:00–17:00)
25.01 JPY (October–June, weekdays: 10:00–17:00)
21.75 JPY (weekdays: 7:00–10:00, 17:00–23:00, holidays: 7:00–23:00)14.44 JPY (year-round: 23:00–07:00)
Chugoku Electric Power Company32.68 JPY (July–September, weekdays: 9:00–21:00)
30.62 JPY (October–June, weekdays: 09:00–21:00)
14.87 JPY (holidays: 9:00–21:00)
14.87 JPY (year-round: 21:00–09:00)
Shikoku Electric Power Company29.24 JPY (weekdays: 9:00–23:00)
19.48 JPY (holidays: 9:00–23:00)
19.48 JPY (year-round: 23:00–09:00)
Kyushu Electric Power Company26.84 JPY (July–September, December–February, weekdays: 8:00–22:00)
23.95 JPY (March–June, October–November, weekdays: 8:00–22:00)
21.22 JPY (July–September, December–February, holidays: 8:00–22:00)
17.82 JPY (March–June, October–November, holidays: 8:00–22:00)
13.21 JPY (year-round: 22:00–08:00)
Table 3. Initial system performance.
Parameter (Unit)Set Value
PV capacity (kW)4.5
rated capacity of storage battery (kWh)5.65
effective capacity of storage battery (kWh)4.80
battery charge capacity (kWh/h)2.20
battery discharge capacity (kWh/h)3.00
storage battery charge/discharge efficiency0.95
Table 4. Performance degradation over time.
Parameter (Unit) LowIntermediateHigh
reduction rate of solar power output (%/year)0.470.610.75
effective capacity of storage battery, 12,000 cycles (kWh)2.883.363.84
storage battery charge/discharge efficiency, 12,000 cycles0.5700.6650.760
Table 5. Scenarios concerning the combination of solar power generation and storage battery.
ScenarioSolar Power GenerationStorage BatteryBattery Operation Mode
Refnono-
PVyesno-
PV+BT_ayesyesWith boosting effects
PV+BT_byesyesWithout boosting effects (nighttime charge)
PV+BT_cyesyesWithout boosting effects (PV charge)
PV+BT_a-cyesyesFirst 10 years: with boosting effects
11th years and afterword: without boosting effects (PV charge)
PV+BT_b-cyesyesFirst 10 years: without boosting effects (nighttime charge)
11th years and afterword: without boosting effects (PV charge)
Table 6. Daily average of the power unit price and day/night price difference by region.
Daily Average of The Power Unit Price (JPY/kWh)Day/Night Price Difference (JPY/kWh)
Hokkaido25.0818.93
Tohoku23.7121.06
Tokyo24.138.02
Hokuriku18.6512.28
Chubu25.3715.54
Kansai20.058.42
Chugoku20.1710.61
Shikoku23.196.36
Kyushu19.1310.14
Table 7. Scenarios concerning the combination of solar power generation and storage battery.
Annual Power ConsumptionThe Amount of Annual Solar Power GenerationAll-Day Average Unit PriceDay/Night Price Difference of Unit Price
The amount of annual power consumption1.00
The amount of annual solar power generation−0.241.00
All-day average unit price0.310.001.00
Day/night price difference of unit price0.33−0.490.431.00
Table 8. The settings of parameters.
ParameterLowIntermediateHigh
increase in unit price of electricity (JPY/kWh/year)0.00 0.220.44
future levy unit price (JPY/kWh)See Figure 3
selling price after the FIT expires (JPY/kWh)7.39.311.3
reduction rate of solar power output (%/year)0.470.610.75
effective capacity of storage battery, 12,000 cycles (kWh)2.883.363.84
storage battery charge/discharge efficiency, 12,000 cycles0.5700.6650.760
Table 9. Results of regression analysis: economic efficiency of PV+BT_b.
R2Adjusted R2 FSig.
Regression model0.7080.694ANOVA49.7510.000
Partial regression coefficientSDStandard partial regression coefficienttSig.
(constant)−1,319,090.6264,595.7 −4.9850.000
Amount of annual power consumption48.19.20.3445.2510.000
Annual amount of solar power generation1926.4208.10.6689.2570.000
Daily average of electricity charge unit price29,181.27572.40.2723.8540.000
Day/night price difference of electricity charge unit price25,369.84326.50.4655.8640.000
Table 10. Results of regression analysis: Economic efficiency of PV+BT_a-c.
R2Adjusted R2 FSig.
Regression model0.7180.705ANOVA44.4010.000
Partial regression coefficientSDStandard partial regression coefficienttSig.
(constant)−1,372,748.5259,448.7 −5.2910.000
Amount of annual power consumption40.69.00.2914.5250.000
Annual amount of solar power generation1970.2204.10.6859.6550.000
Daily average of electricity charge unit price45,195.87425.10.4226.0870.000
Day/night price difference of electricity charge unit price9231.64242.30.1702.1760.032
Table 11. Results of regression analysis: Economic efficiency of PV+BT_b-c.
R2Adjusted R2 FSig.
Regression model0.7910.617ANOVA52.1330.000
Partial regression coefficientSDStandard partial regression coefficienttSig.
(constant)−1,384,576.7261,127.7 −5.3020.000
Amount of annual power consumption40.29.00.2874.4540.000
Annual amount of solar power generation1967.3205.40.6809.5790.000
Daily average of electricity charge unit price46,177.07473.10.4296.1790.000
Day/night price difference of electricity charge unit price9055.84269.80.1652.1210.037
Publisher’s Note: MDPI stays neutral with regard to jurisdictional claims in published maps and institutional affiliations.

