Abstract
Based on the rapid increase in the demand for people counting and tracking systems for surveillance applications, there is a critical need for more accurate, efficient, and reliable systems. The main goal of this study was to develop an accurate, sustainable, and efficient system that is capable of error-free counting and tracking in public places. The major objective of this research is to develop a system that can perform well in different orientations, different densities, and different backgrounds. We propose an accurate and novel approach consisting of preprocessing, object detection, people verification, particle flow, feature extraction, self-organizing map (SOM) based clustering, people counting, and people tracking. Initially, filters are applied to preprocess images and detect objects. Next, random particles are distributed, and features are extracted. Subsequently, particle flows are clustered using a self-organizing map, and people counting and tracking are performed based on motion trajectories. Experimental results on the PETS-2009 dataset reveal an accuracy of 86.9% for people counting and 87.5% for people tracking, while experimental results on the TUD-Pedestrian dataset yield 94.2% accuracy for people counting and 94.5% for people tracking. The proposed system is a useful tool for medium-density crowds and can play a vital role in people counting and tracking applications.
1. Introduction
People counting and tracking in public places has emerged as a hot topic with increases in the global population. This is because population increases have led to a major increase in mass events. People have a significant interest in events such a carnival, sports [1,2,3,4], concerts, and festivals [5]. However, such events require proper safety measures and crowd management. Heavy crowds’ entrance and exit areas present a challenge for organizers to ensure safety and business health. People counting and tracking systems are used to estimate crowd density and track human activities in crowded areas. Such systems can also be used to manage transport systems, schedule labor, monitor promotional events, and improve surveillance systems [6,7].
Several approaches have been used to implement such systems, but vision-based methods are the most practical based on the popularity of surveillance systems. In this study, vision-based methods were used to count and track people in medium-density crowds. Multiple methods have been developed for such tasks, but various problems still exist based on complex and dynamic backgrounds, object occlusion [8], varying appearances of people, and background/foreground object detection [9]. As we have seen several approaches, but there is still a consideration for a more accurate system. We have identified some as following:
- The system must work irrespective of the people density.
- The system must work irrespective of orientation of camera.
- The system must be competent for real time people counting.
- The solution must provide satisfactory performance in different scenarios, such as open spaces, occlusions, different background, different lighting conditions, and occlusions.
The main goal of this study was to develop a novel, sustainable, and reliable system that can be used to track and count people in public places with simple to medium-density crowds and different orientations and views of cameras. We propose an accurate vision-based system that can be used in different environments to count and track people.
We applied different filters for background removal and extracted foreground objects. We used template matching for the human verification process, and then multiple particles were distributed on objects verified as humans. We considered the problem of object occlusion and attempted to minimize this issue by clustering particle flows (PFs). We used multiple features, including the start point, direction, velocity, and length of PFs, to cluster multiple objects and differentiate occluded objects. A record table for each counted person was maintained to record their position during a sequence of frames. The motion trajectory of each person was used for tracking.
The major contributions of this research can be summarized as follows.
- Multiple filters and a sequence of morphological operations are implemented to remove noise and filter unnecessary objects.
- Feature extraction is performed using a uniform distribution of particles over detected people, and the flows of particles are extracted from multiple consecutive frames to differentiate between multiple individuals.
- To minimize occlusion, multiple people are detected using the features of PF and a modified self-organizing map (SOM).
- People counting and tracking is performed using a record table in combination with motion trajectories recorded for each person.
The remainder of this paper is organized as follows. Section 2 briefly reviews relevant works on people counting and people tracking. Section 3 presents the details of the proposed approach, which consists of three main components: people detection, counting, and people tracking. The proposed method is evaluated on two datasets called PETS-2009 and TUD-Pedestrian, and the experimental results are summarized in Section 4. Finally, conclusions and future work are discussed in Section 5.
2. Literature Review
This section describes different methodologies that have been proposed in recent years for crowd analysis surveillance systems [10]. It is divided into two subsections on people counting and people tracking. A detailed review of related work and methodologies is provided in this section.
2.1. People Counting
Pedestrian counting has been one of the most actively researched topics over the past decade based on its diverse scenarios in terms of occlusion, variations and complex backgrounds. Numerous applications have been proposed for vision-based people counting. Data have been captured using a single zenithal camera [11], single frontal camera [12], or multiple cameras [13].
In [14], methods based on a single camera were divided into two different classes of detection-based and feature-based methods. In the first approach, people facing a camera are detected and counted. In the second approach, people are detected using features (e.g., head, torso, and motion analysis). These methods include motion detection, template-based methods, and spatiotemporal methods. Motion detection and analysis are used to monitor the motion trajectories of moving objects and count them. Template-based methods match predefined regions in images and find the best-matching regions. Spatio-temporal methods count the number of people crossing a specific line and assess discrepancies to specify direction. Model-based and texture-based methods have been widely used in the literature. In [15], moving objects were identified using a specific shape model, and high accuracy was achieved in an occluded environment. However, for non-grid objects, the performance was satisfactory. Texture-based methods are useful for uniform patterns; however, non-uniform objects result in poor performance.
In [16], Horn-Schunck et al. used an optical flow mask to segment objects based on k-means clustering. They argued that results are dependent on the level of smoothness of the image and optical flow. Regardless of image magnitude, if the optical flow is smooth, the correct results can be achieved. To achieve better results, they used a Gaussian filter to smoothen the image. However, for smaller values, their system’s running time increases without result improvement. Mehta et al. [17] used a neural network classifier to recognize background count objects and facilitate location identification in a target scene, but the accuracy of results depends on the orientation of the camera and number of views captured; in the case of variant backgrounds and multi-cameras with multi-views, the system is not much efficient as compared to a single camera. Additionally, in [18], Schlogl et al. used features of motion to classify pixels as moving, non-moving, or stationary objects. They classified pixels into the foreground and background objects and grouped similar pixels together into blobs. They estimated the number of people based on the average human size and filtered objects that were outside the size limit. This system performs well in the case of a medium-density crowd with a minimum level of occlusion. Objects are miscalculated if multiple people/ objects are occluded; these objects are filtered based on size limit and cause a drop in accuracy. In [19], Jalal et Al. used the maximum entropy markov model and hybrid features to segment humans and objects based on their interaction. The proposed could be used in a variety of man–machine interfaces, such as medical application, public-place surveillance, and 3D interactive gaming. However, this algorithm confuses white or light color clothes of people in the case of white wall backgrounds. To cope with this problem, they used human verification based on their height and width ratio, but a frequent change of posture can also impact the height and width ratio and could mislead the segmentation. In [20], Barandiaran et al. used a set of virtual boundary lines as end points to count the number of people crossing the lines using cameras placed at different heights to capture people’s heads. They used the frame differencing method to find the moving objects and counted the heads of people crossing the line. However, this method is applicable in an indoor environment only. There should be a specific entrance and exit line to enter and leave the area. An outdoor environment system could not perform well. In [21], a human model was verified based on the average size of people. In [22], Prakash et al. developed a method in which humans were verified based on a skin color model. They identified skin pixels, and an object having these pixels was declared as human and then tracked according to their motion. However, the performance of this system depends upon the posture of the human. If a person has been captured from the back and his face or hands are not captured, the system accuracy decreased in such scenarios.
2.2. People Tracking
In the literature, the tracking of people has been achieved using various methods. In [23], Maddalena et al. used a counting line on an edge to partition the tracking regions of a target scene. They used multiple cameras to capture the data, and background subtraction was used to identify humans, and people were tracked using motion prediction. The system performed well in occlusion and segmentation of moving and stationary objects. The limitation of the system is the variance of the posture of an individual with multiple orientations. This can mislead the results of people tracking. In [24], Mahwish et al. used a Gaussian filter to smoothen the image and human body parts, and skin pixels are used to verify objects as human. Then, they used a human centroid with a jacquard similarity index to track the people in a medium-density crowd, but their approach did not perform well in a high-density crowd environment. In [25], Jalal et al. detected human bodies and used a random forest model with joint motion to track human silhouettes, but in the case of the human silhouette that is static for a period of time, their system could not track it. In [26], Kamal et al. implemented another method for counting and tracking people. They considered people as dots and used the dots as binary masks. They then used a correlation-based algorithm to track people between consecutive frames. This system is applicable in heavy density crows and a camera posted on a specific height. In frontal view, the camera system could not perform well as expected. In another paper [27], Jalal et al. proposed a procedure to segment and detect moving objects using a frame difference algorithm, which was then used to detect and track people; however, in constant changing backgrounds, frame differencing is not a good choice to segment objects.
In [28,29], Kim et al. proposed a method that uses a standard background subtraction method for foreground map detection in each camera view. They classified foreground pixels into classes and used Bayesian pixel classification to represent individuals in a scene. These classes were integrated to obtain the ground plane locations of people in the top view of the scene. They used the intersections of the central vertical axes of blobs. In [30], Fleuret et al. proposed a method in which they used the global optimization of trajectories to detect individuals. They estimated probabilistic occupancy using a combination of background and color and motion-based generative models. In [31], Du et al. used the intersections between the principal axes of targets to integrate information and used particle filters to track people through multiple cameras on the ground plane. Another study belonging to the same category by Huang and Wang [32] developed a method to estimate the probability of finding moving objects at specific ground locations using foreground images. In [33], Khan and Shah determined foot locations on the ground plane by using planar homographic constraints to track the individuals. Eshel and Moses [34] detected human heads and their feature points were used to derive the trajectories of people. However, this system can work well if data is captured using a camera placed at a specific height.
There are many other states of the art methods used for people counting, but the results depend upon camera position, the orientation of the camera, the variance of backgrounds and densities of people. In this approach, we have considered all aspects and tested our system with different densities of people, multiple orientations of the camera, and different backgrounds.
3. Materials and Methods
The proposed method consists of seven main steps: preprocessing, object detection, people verification, PF and feature extraction, SOM-based clustering, people counting, and people tracking. The main architecture of the proposed system is presented in Figure 1.
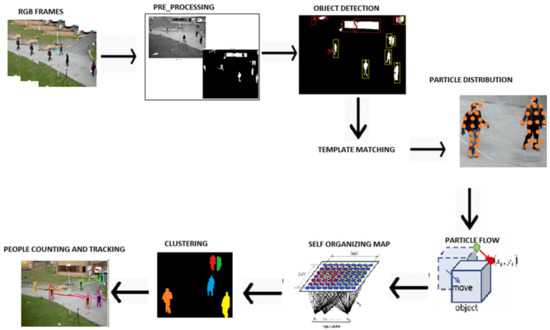
Figure 1.
Architecture of the proposed people counting and tracking system.
Multiple filters are applied to remove noise and smooth images, and object detection is performed using area-based filtering. Objects having a size within the range of the limit specified are considered as objects detected, and the remaining objects are discarded. After object detection, 5–6 templates are chosen from each dataset, and template matching is used to verify objects as people. Further, the PFs of moving objects are extracted, and their features are used with modified SOM to cluster the OF belonging to an individual. People counting is performed based on the correlation between the number of people in an image and the number of PF clusters. After people are detected, the trajectories are drawn and tracked accordingly. The complete work flow of the proposed system is given in Figure 2.
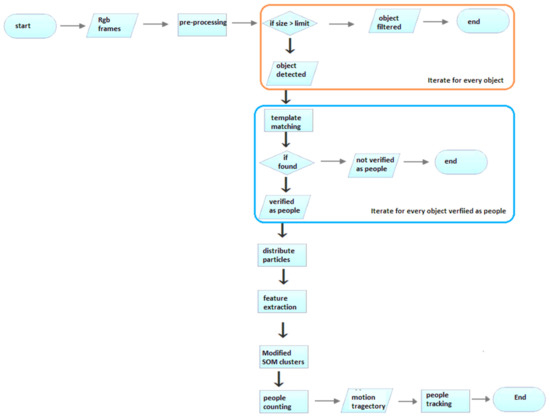
Figure 2.
Work flow of proposed system for people counting and tracking.
3.1. Preprocessing
Videos of the pedestrians are used as inputs for the proposed system. These videos are first converted into individual frames. Each colored frame is then converted into a grayscale image to reduce computation time [35,36,37]. Different weights are assigned to red, green, and blue channels to convert them into grayscale images, as shown in Equation (1):
where R, G, and B denote the red, green, and blue channels of the colored image, respectively, and a, b, and c are the weights of those channels having values 0.3, 0.3, and 0.4, respectively.
A Gaussian filter is used to remove noise [38,39], with a standard deviation applied to smooth the gray-scale images, as shown in Equation (2).
The next step after smoothing the grayscale images is binarization, which converts a grayscale image into a binary image. Binarization f(x,y) is performed using a fixed threshold value [40,41,42], as shown in Equation (3).
where t is the threshold value, and G(x,y) is the Gaussian filter [40]. These binary images are filtered to remove small components that are considered to be noise. Pixel-based area filtering with a threshold and convolution mask is applied to remove small components from images. After noise filtering, the border of image is identified, and objects connecting with the border area are removed to eliminate the background area. An inverse transformation [43] is applied to the filtered images using Equation (4) to reduce the sizes of the regions of interest, and connected regions are extracted to finalize object detection.
where is an inverse image, and is a binary image. Figure 3 presents the silhouette extraction process at different sub-stages.
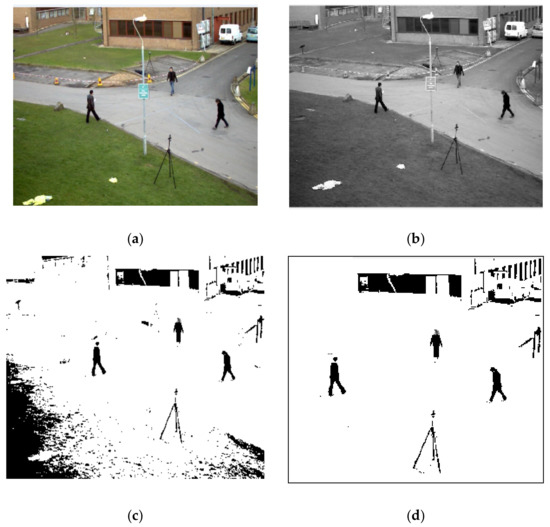
Figure 3.
Preprocessing sub-stages results: (a) input image, (b) Gaussian filtered image, (c) inverse image, and (d) filtered regions.
3.2. Object Detection
The background area is removed using a multivalued threshold, and objects are filtered based on their area. Connected components analysis [43,44,45,46] through a pixel-based search are used to find the clusters [44] having pixels within the range of four neighboring pixels using Equation (5).
The area of each region is computed using Equation (6) after object filtering. The area of an object is computed using the number of pixels q(x, y) contained in that object [47]. These areas are used to detect the largest object in a frame.
We assume that the largest component belongs to the background area. Therefore, the removal of this component removes a large background area. Subsequently, all connected components are labeled and identified according to the sizes of the corresponding objects.
If is a filtered image in which Ao is greater than the value of the lower threshold t1 and less than the upper threshold t2. The results of object detection are presented in Figure 4.
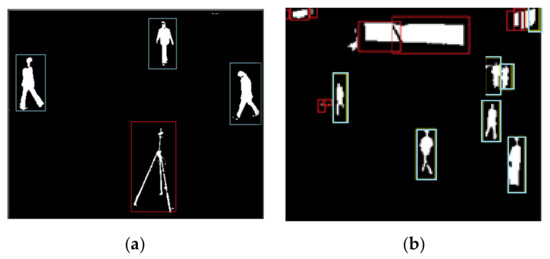
Figure 4.
Object detection in a preprocessed image. (a) Blue boxes represent detected objects and (b) red boxes represent filtered objects.
3.3. People Verification
Template matching is a method that is used to identify matching regions in an image. It is typically used to measure the similarity between a reference image and a test image [48,49,50].
In this study, people verification was performed using template matching. Five to six templates were defined for each dataset and used to find matching regions based on a predefined similarity index. We represent reference images as R(x, y), where x and y are the coordinates of the search pixels in a reference image, and template images as T(xt, yt), where (xt, yt) represent the coordinates of each pixel in a template image. Some example templates are presented in Figure 5.
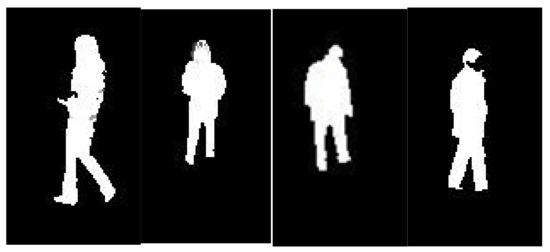
Figure 5.
Example templates used for human verification.
The sum of absolute differences (SAD) [51,52] is used to measure the intensities of pixels. A pixel in a search image with coordinates (xs, ys) has an intensity Is(xs, ys), and a pixel in a template image with coordinates (xt, yt) has an intensity It(xt, yt) [53]. The absolute difference [54] in pixel intensities is defined by Equation (8), and the SAD is computed using Equation (9).
The SAD is computed for all pixels by looping through the pixels in a search image [55]. A mathematical representation of this process is given in Equation (10):
where Srows and Scols denote the rows and columns of the search image, respectively, and Trows and Tcols denote the rows and columns of the template image, respectively. In this method, the lowest SAD score represents the estimate for the best template position within the search image. This method is simple to implement and understand, but it is relatively slow [56].
3.4. PF and Feature Extraction
Some people are occluded by other people in a frame, which can reduce people counting accuracy. To overcome this issue, multiple particles are randomly distributed on targeted objects, and their features are used to cluster people. This is helpful for segment partially occluded people in consecutive frames. Figure 6 presents the random distribution of particles over objects.
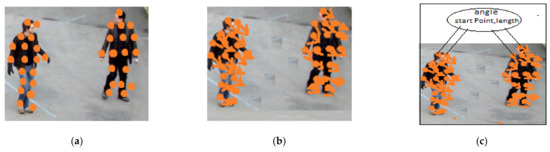
Figure 6.
Particle distributions of objects verified as humans: (a) particle distribution, (b) extraction of PFs, and (c) PF features.
PFs are extracted using the Lucas–Kanade [57] method (as shown in Figure 7) for all particles that are placed on objects detected as humans. The following assumptions were adopted for the application of this technique.
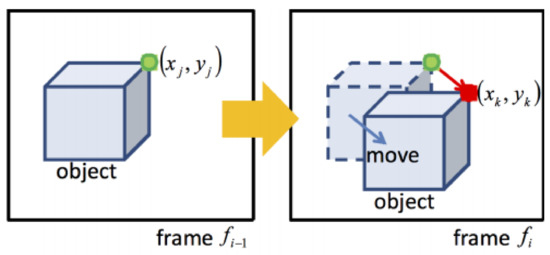
Figure 7.
Lucas–Kanade method.
- The brightness of consecutive frames remains the same.
- Each particle cannot travel a distance above a certain limit
- Neighboring particles retain the same relative position between frames.
The features of PFs, including their starting point, direction, velocity, and length of flow, are extracted and used to cluster people. The velocity of a PF is calculated as the distance covered by particles in unit time [58], as shown in Equation (11)
where Vp is the velocity of the particle, dp is the distance covered by the particle, and t is the time interval [59]. The direction of a particle is derived from its velocity and categorized into three forms, as shown in Equation (12). If the velocity of a PF is greater than zero, its direction is considered to be forward. If the velocity of a PF is less than zero, its direction is considered to be backward. If the velocity of a PF is zero, then the direction is considered to be static. The angle [60] of a PF is calculated using Equation (12)
where x is considered as movement of object horizontally and should be greater than zero. If some people are occluded by other objects, then there is a chance of collision between PFs. To solve this problem, a specific zone of neighboring pixels is defined, and each particle outside that zone is considered as an independent flow particle. The PF [61] evaluation process is presented in Figure 8.
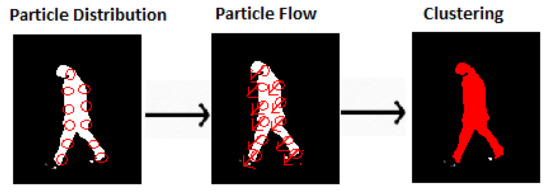
Figure 8.
PF based clustering.
3.5. Modified SOM Clustering
A SOM is a type of artificial neural network that is used to produce a low-dimensional representation of training data [62,63]. It is an unsupervised neural network with a single computational layer that learns using a competitive learning strategy. An SOM uses a random value as an initial weight vector and computes the Euclidean distance [64] between an input vector and the weight vector [65]. It finds the best-matching unit with the minimum Euclidean distance [66], as shown in Equation (13):
where x and w are two points in Euclidean n-space; xi and wji are Euclidean vectors starting from the initial point and D is n-space.
An SOM group’s input values with similar characteristics and separate values that are not similar. The structure of an SOM [67] is presented in Figure 9.
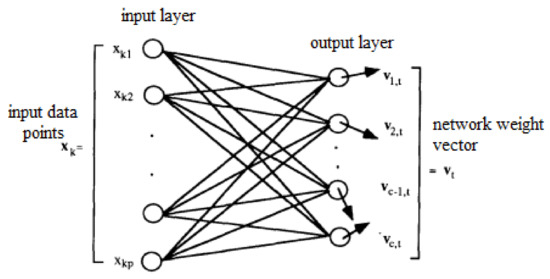
Figure 9.
The structure of an SOM.
We used an SOM for clustering based on the features extracted in the previous phase. Specifically, we used it to cluster PFs that belong to a single person. We extracted the feature for each PF and assumed that all input vectors belonging to one person must be within the boundary of the corresponding centroid. Therefore, instead of using random values for initial weights, we calculated the centroids of objects and used them as initial weights. The complete process is given below:
- SOM used random points as initial weight, but we extracted the centroid of objects and used them in the first iteration as initial weights to feed the SOM.
- After each iteration, PF that belongs to more than one cluster is identified.
- One more feature Direction is added with centroid and feed as initial weight.
- If some PF still belongs to more than one cluster, the start point of PF is added in the initial weight list and used to cluster again.
- Iterate till the maximum level of clustering is achieved.
- To avoid errors, we have cross-checked the first iteration using start points as the first feed.
The initial planes for both datasets are presented in Figure 10.
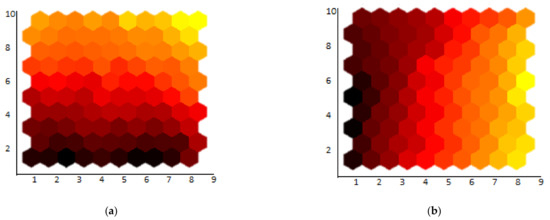
Figure 10.
SOM initial weight planes for the (a) PETS-2009 and (b) TUD-Pedestrian datasets.
Following the distribution of initial neurons, the Euclidean distance was used to cluster the input vectors. The SOM algorithm is presented in Algorithm 1.
| Algorithm 1 Algorithm for Clustering based on PFs and SOM |
| Input: I: Filtered binary image with connected regions C: Centroids of objects verified as humans using template matching Output: N: number of clusters R←getRegionLabelled Pr←RandomParticles(R) Pf = getParticleFlow(Pr) vel←getVelocity(pf) if (vel > 0) d = forward else if(vel < 0) d = backward else d = 0 angle← getAnglePf inputVector← I { vel, d,s,a} Centroid ← C initialWeight←centroid N→ SOM(inputVector) Return N |
3.6. People Counting
We assumed that the number of clusters identified by the SOM was strongly correlated with the number of people in a video. The total number of clusters resulting from the previous step is the number of people counted in that frame. Optical flows are extracted from moving objects that represent pedestrians in video frames; the optical flows detected from a single pedestrian tend to belong to the same cluster. The degree of correlation depends on the camera position, size of the pedestrians in the frames, and various other factors. The proposed method utilizes a portion of the frames in a video sequence for pre-learning and then estimates the number of pedestrians in all frames in the video sequence. Here, the number of clusters in frame Fl is denoted as cq. Our method calculates the average number of clusters [68] C in the frames used for pre-learning, as shown in Equation (14).
To enhance accuracy, a person is only counted after their presence is confirmed in five consecutive frames. In the case of occlusion, if a person disappears and reappears again within the frame limit, then the count will not be decremented. The estimated number of pedestrians in frame f, denoted as , is calculated as shown in Equation (15):
where ci is number of clusters, and cp is number of people as shown in Figure 11.
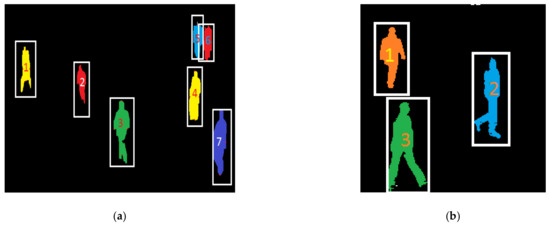
Figure 11.
People counting results for the (a) PETS-2009 dataset and (b) TUD-Pedestrian dataset.
3.7. People Tracking
For people tracking, the motion trajectories [69] of people are extracted by matching frame metrics and maintaining an accurate count. We maintained a record of the idle-state for each person. The idle state represents a person located in the previous frame but not located in the current frame. The f-value represents the number of frames in which a person remains in an idle state. If a person remains idle for 10 frames, then that person will be removed from the count. A record table for each person is maintained, including the person’s id, position in the previous frame pt-1, position in current frame Pc, idle state i-value, and the number of frames with the idle state as the f-value, as shown in Table 1. If there is a person whose previous state is null but who exists in the current frame, then the count for the current frame is incremented. People tracking is performed using motion trajectories across sequences of frames. We calculate the initial velocity, final velocity, initial point, final point, horizontal distance [70], time duration, and direction for each frame based on the previous frames. These values are then used to predict the future positions of people as shown in Figure 12.

Table 1.
Record table for people tracking.
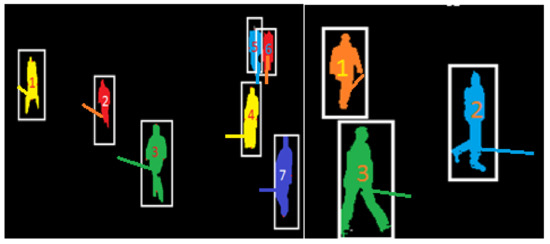
Figure 12.
The results of people tracking and the corresponding motion trajectories.
4. Experiments and Results
Experiments were conducted using the public benchmark PETS-2009 dataset and TUD-Pedestrian dataset to evaluate the accuracy and performance of our system on different sequences of colored frames.
4.1. Experimental Setup
The system has been implemented using Multi-Paradigm Programming Language (matlab) by Mathwork with a core i5 processor and 16GB RAM. We used the 9.1 version of matlab named R2016b to implement the system, whereas the image processing toolbox has been used in the preprocessing step to apply different filters to smoothen the images. This system can be used standalone in real-time scenarios with minimum specifications given above.
4.2. PETS-2009 Dataset
PETS-2009 has been used by multiple researchers [71] for different video surveillance challenges, including people counting, crowd estimation, multi-person tracking, and multiple flow analysis for event recognition. We used multiple views from the S2 subset with people walking in a medium-density crowd. Data were captured from multiple views using multiple frontal and rear camera angles. Therefore, a person showing their front side could not be verified using the same template as a person showing their backside. Some example views from the dataset are presented in Figure 13.
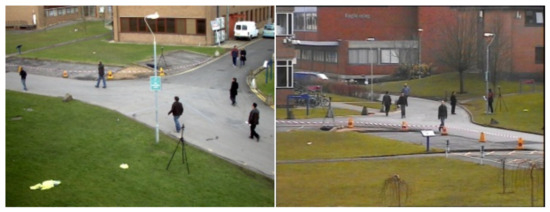
Figure 13.
Sample frames from different views in the PETS-2009 dataset.
4.3. TUD-Pedestrian
The TUD-Pedestrian dataset contains 250 images with 311 fully visible people with significant variations in clothing and orientation. This dataset is typically used for single-frame detector evaluations. The main challenge in this dataset is the variance of the background. The image backgrounds differ between different sequences of frames, and the people are carrying various objects such as bags and umbrellas. Therefore, it is difficult to define a specific filter for background removal and templates for humans to account for different objects. Some example views from the dataset are presented in Figure 14.
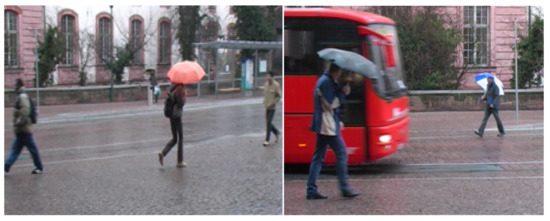
Figure 14.
Random views from the TUD-Pedestrian dataset.
4.4. Performance Measurements
For system evaluation, accuracy, error rate, and precision (F-score) were used as performance measures. Accuracy [72] was calculated using Equation (16), the error rate was calculated using Equation (17), and F-score was calculated using Equation (18).
Tp denotes true positive, Fp denotes false positive, and Fn denotes false negative.
The results of people counting are presented in Table 2 and Table 3. The sequence column represents the number of frames considered for the corresponding experiment, and the ground truth represents the true number of people in a sequence of frames. For each sequence of data, the accuracy error rate and F-score were calculated. The results of counting on the PETS-2009 dataset are presented in Table 2.
Table 2.
The results of people counting using the PETS-2009 dataset.
Table 3.
The results of people counting using the TUD-Pedestrian dataset.
The proposed method was also evaluated on the TUD-Pedestrian dataset, and the results are presented in Table 3.
The results of people tracking are presented in Table 4. The sequence column represents the number of frames considered in the corresponding experiment and the ground truth represents the true number of people in a sequence of frames. For each sequence of data, the accuracy error and F-score were computed, as shown in Table 4.
Table 4.
The results of people tracking on the PETS-2009 dataset.
The results of people tracking for the TUD-Pedestrian dataset are presented in Table 5.
Table 5.
The results of people tracking on the TUD-Pedestrian dataset.
Comparative analysis of the proposed method was performed by comparing it to state-of-the-art people counting approaches. Table 6 reveals that the proposed system achieves a higher accuracy rate (86.9%) and (94.2%) than the existing methods. We have also performed cost analysis in terms of the time required to process a frame in seconds. It is clearly visible that the proposed system requires less time to process one frame as compared to the state-of-the-art methods.
Table 6.
Comparison of the proposed approach to state-of-the-art people counting methods.
Performance comparisons on people tracking were also performed, and the proposed method achieved an accuracy rate of 87.5% and 94.5%. The accuracy of our system was a bit lower than the one of the state-of-the-art methods, but in cost analysis, it is clearly visible that the time required by that system to process one frame is larger than the proposed system that made the performance of the proposed system more efficient, as shown in Table 7.
Table 7.
Comparison of the proposed approach to state-of-the-art people tracking methods.
5. Discussion
We developed an accurate and sustainable system to address the challenges faced by people tracking and counting systems. In this approach, we used seven major modules: preprocessing, object detection, people verification, PF, and feature extraction, Modified SOM clustering, people counting, and tracking. The proposed method is initiated with video frames as inputs. We used the PETS-2009 and TUD-Pedestrian datasets in this study. Next, preprocessing is performed to reduce noise and remove the background areas from images. To this end, a Gaussian filter and a series of morphological operations are applied.
After successful removal of the background area, objects are filtered and are detected. To enhance accuracy and avoid errors, human verification is performed to verify detected people as human silhouettes. Multiple templates from each dataset were used as reference images, and template matching was performed to verify the human silhouettes. There are multiple occurrences at which people are occluded by other objects. To detect people in an occluded environment, we applied clustering using PFs and a modified SOM. We used a random distribution of particles over the human silhouettes and extracted PFs from the scattered particles. Feature extraction was performed on each PF, and the start point, direction, angle, and velocity were used to cluster multiple people. After successful clustering, people counting was performed based on the correlation between clusters and the number of people. We maintained a record table for each person counted to track their motion based on their motion trajectories across sequences of frames. To handle occlusion, we set a threshold number of frames to see if a person would become isolated. Finally, people were tracked based on their motion trajectories.
The proposed system performed very well on both datasets for low- and medium-density crowds. There were some limitations in the case of high-density crowds and continuously occluded objects. We were not able to detect human silhouettes that were partially or fully occluded by other objects for extended periods of time, which is the main reason for the low accuracy of people detection methods. In the images displayed in Figure 15, we could observe people who were partially and fully occluded, but if they remained occluded for a long period of time, their positions could not be detected throughout a video.
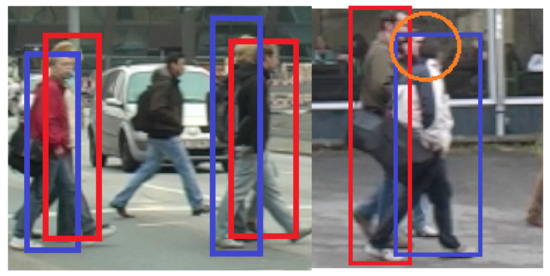
Figure 15.
Some identified limitations of the proposed system.
We presented analyses of the accuracy of the proposed counting and tracking methods for both datasets. The mean accuracy for people counting on the PETS-2009 dataset was 86.9%, with an accuracy of 87.5% for people tracking. The experimental results for the TUD-Pedestrian dataset revealed 94.2% accuracy for people counting and 94.5% accuracy for people tracking.
6. Conclusions
In this study, an accurate, sustainable, and efficient system was proposed for people counting. The main objective of this study was to develop a system that could perform well in low-to-medium density crowds, with occluded objects and different orientations of the camera. We used the template matching method for human verification. To handle occlusion, multiple particles were distributed on objects verified as humans and PFs were extracted. Their features were then used to cluster people and differentiate between multiple occluded individuals. Our system is limited in the case of high-density crowds, resulting in reduced accuracy for object detection. The main reason behind this is size-based object detection in preprocessing. The size of occluded objects gets bigger than the size limit, and they get filtered. The experimental results on the PETS-2009 dataset revealed 86.9% accuracy for people counting and 87.5% accuracy for people tracking. The experimental results on the TUD-Pedestrian dataset revealed 94.2% accuracy for people counting and 94.5% accuracy for people tracking.
In future work, we will improve the proposed system to count and track people in high-density crowd environments more accurately.
Author Contributions
Conceptualization, M.P., Y.Y.G. and D.-S.K.; methodology, M.P. and A.J.; software: M.P.; validation, Y.Y.G., M.G. and S.K.; formal analysis, M.G. and S.K.; resources, Y.Y.G., M.G. and D.-S.K.; writing—review and editing, M.P., M.G. and D.-S.K.; funding acquisition, Y.Y.G., M.G. and D.-S.K. All authors have read and agreed to the published version of the manuscript.
Funding
This research was supported by the IITP (Institute for Information & Communications Technology Planning & Evaluation) (IITP-2020-2020-0-01612), and the National Research Foundation of Korea (NRF) (2018R1A6A1A03024003).
Conflicts of Interest
The authors declare no conflict of interest.
References
- Ryoo, M.S.; Aggarwal, J.K. Spatiotemporal relationship match: Video structure comparison for recognition of complex human activities. In Proceedings of the 2009 IEEE 12th International Conference on Computer Vision, Kyoto, Japan, 29 September–2 October 2009; pp. 1593–1600. [Google Scholar]
- Shehzad, A.; Jalal, A.; Kim, K. Multi-prson tracking in smart surveillance system for crowd counting and normal/abnormal events detection. In Proceedings of the 2019 International Conference on Applied and Engineering Mathematics (ICAEM), Taxila, Pakistan, 27–29 August 2019. [Google Scholar]
- Mahmood, M.; Jalal, A.; Sidduqi, M.A. Robust Spatio-Temporal Features for Human Interaction Recognition via Artificial Neural Network. In Proceedings of the 2018 International Conference on Frontiers of Information Technology (FIT), Islamabad, Pakistan, 17–19 December 2018; pp. 218–223. [Google Scholar]
- Jalal, A.; Quaid, M.A.K.; Sidduqi, M.A. A Triaxial acceleration-based human motion detection for ambient smart home sys-tem. In Proceedings of the 2019 16th International Bhurban Conference on Applied Sciences and Technology (IBCAST), Islamabad, Pakistan, 8–12 January 2019; pp. 353–358. [Google Scholar]
- Jalal, A.; Kim, Y.-H.; Kim, Y.-J.; Kamal, S.; Kim, D. Robust human activity recognition from depth video using spatiotemporal multi-fused features. Pattern Recognit. 2017, 61, 295–308. [Google Scholar] [CrossRef]
- Kyo, K.; Sung, H. Distance-based formation control using euclidean dstance dynamics matrix: Three-agent case. In Proceedings of the American Control Conference, San Francisco, CA, USA, 29 June–1 July 2011; pp. 4810–4815. [Google Scholar]
- Jalal, A.; Quaid, M.A.K.; Hasan, A.S. Wearable Sensor-Based Human Behavior Understanding and Recognition in Daily Life for Smart Environments. In Proceedings of the 2018 International Conference on Frontiers of Information Technology (FIT), Islamabad, Pakistan, 17–19 December 2018; pp. 105–110. [Google Scholar]
- Ayesha, A.; Ahmad, J. Automated body parts estimation and detection using salient maps and Gaussian matrix model. In Proceedings of the IBCAST, Islamabad, Pakistan, 12–16 January 2021. [Google Scholar]
- Rafique, A.A.; Jalal, A.; Ahmed, A. Scene Understanding and Recognition: Statistical Segmented Model using Geometrical Features and Gaussian Naïve Bayes. In Proceedings of the 2019 International Conference on Applied and Engineering Mathematics (ICAEM), Taxila, Pakistan, 27–29 August 2019; pp. 225–230. [Google Scholar]
- Batool, M.; Jalal, A.; Kim, K. Sensors Technologies for Human Activity Analysis Based on SVM Optimized by PSO Algorithm. In Proceedings of the 2019 International Conference on Applied and Engineering Mathematics (ICAEM), Taxila, Pakistan, 27–29 August 2019; pp. 145–150. [Google Scholar]
- Antic, B.; Letic, D.; Culibrk, D.; Crnojevic, V. K-means based segmentation for real-time zenithal people counting. In Proceedings of the 2009 16th IEEE International Conference on Image Processing (ICIP), Cairo, Egypt, 7–10 November 2009; pp. 2565–2568. [Google Scholar]
- Ahmad, J.; Kamal, S. Real-Time Life Logging via a Depth Silhouette-based Human Activity Recognition System for Smart Home Services. In Proceedings of the 2014 International Bhurban Conference on Advanced Video and Signal Based Surveillance (AVSS), Seoul, Korea, 26–29 August 2014. [Google Scholar]
- Israr, A.; Ahmad, J.; Kim, K. Pose estimation and detection for event recognition using sense-aware features and Adaboost classifier. In Proceedings of the 2021 International Bhurban Conference on Applied Sciences and Technologies (IBCAST), Islamabad, Pakistan, 12–16 January 2021. [Google Scholar]
- Masoud, O.; Papanikolopoulos, N.P. A novel method for tracking and counting pedestrians in real-time using a single camera. IEEE Trans. Veh. Technol. 2001, 50, 1267–1278. [Google Scholar] [CrossRef]
- Heikkila, M.; Pietikäinen, M. A texture-based method for modeling the background and detecting moving objects. IEEE Trans. Pattern Anal. Mach. Intell. 2006, 28, 657–662. [Google Scholar] [CrossRef] [PubMed]
- Meinhardt-Llopis, E.; Pérez, J.S.; Kondermann, D. Horn-Schunck Optical Flow with a Multi-Scale Strategy. Image Process. Line 2013, 3, 151–172. [Google Scholar] [CrossRef]
- Schofield, A.; Mehta, P.; Stonham, T. A system for counting people in video images using neural networks to identify the background scene. Pattern Recognit. 1996, 29, 1421–1428. [Google Scholar] [CrossRef]
- Schlögl, T.; Wachmann, B.; Bischof, H.; Kropatsch, W. People Counting in Complex Scenarios; Institute of Computer Graphics and Vision (7100): Graz, Austria, 2002. [Google Scholar]
- Jalal, A.; Khalid, N.; Kim, K. Automatic Recognition of Human Interaction via Hybrid Descriptors and Maximum Entropy Markov Model Using Depth Sensors. Entropy 2020, 22, 817. [Google Scholar] [CrossRef]
- Barandiaran, J.; Murguia, B.; Boto, F. Real-Time People Counting Using Multiple Lines. In Proceedings of the 2008 Ninth International Workshop on Image Analysis for Multimedia Interactive Services, Klagenfurt, Austria, 7–9 May 2008; pp. 159–162. [Google Scholar] [CrossRef]
- Maddalena, L.; Petrosino, A.; Russo, F. People counting by learning their appearance in a multi-view camera environment. Pattern Recognit. Lett. 2014, 36, 125–134. [Google Scholar] [CrossRef]
- Prakash, S.; Jayaraman, U.; Gupta, P. A skin-color and template based technique for automatic ear detection. In Proceedings of the Seventh International Conference on Advances in Pattern Recognition, Kolkata, India, 4–6 February 2009. [Google Scholar]
- Chen, W.; Cao, L.; Chen, X.; Huang, K. A novel solution for multi-camera object tracking. In Proceedings of the 2014 IEEE International Conference on Image Processing (ICIP), Paris, France, 27–30 October 2014; pp. 2329–2333. [Google Scholar]
- Pervaiz, M.; Jalal, A.; Kim, K. Hybrid Algorithm for Multi People Counting and Tracking for Smart Surveillance. In Proceedings of the 2021 International Bhurban Conference on Applied Sciences and Technologies (IBCAST), Islamabad, Pakistan, 12–16 January 2021; pp. 530–535. [Google Scholar]
- Jalal, A.; Uddin, M.Z.; Kim, T.-S. Depth video-based human activity recognition system using translation and scaling invar-iant features for life logging at smart home. IEEE Trans. Consum. Electron. 2012, 58, 863–871. [Google Scholar] [CrossRef]
- Jalal, A.; Kamal, S.; Kim, D. A Depth Video Sensor-Based Life-Logging Human Activity Recognition System for Elderly Care in Smart Indoor Environments. Sensors 2014, 14, 11735–11759. [Google Scholar] [CrossRef]
- Jalal, A.; Kamal, S.; Kim, D. Shape and Motion Features Approach for Activity Tracking and Recognition from Kinect Video Camera. In Proceedings of the 2015 IEEE 29th International Conference on Advanced Information Networking and Applications Workshops, Gwangiu, Korea, 24–27 March 2015; pp. 445–450. [Google Scholar]
- Ahmed, A.; Jalal, A.; Rafique, A.A. Salient Segmentation based Object Detection and Recognition using Hybrid Genetic Transform. In Proceedings of the 2019 International Conference on Applied and Engineering Mathematics (ICAEM), Taxila, Pakistan, 27–29 August 2019; pp. 203–208. [Google Scholar]
- Jalal, A.; Nadeem, A.; Bobasu, S. Human Body Parts Estimation and Detection for Physical Sports Movements. In Proceedings of the 2019 2nd International Conference on Communication, Computing and Digital systems (C-CODE), Islamabad, Pakistan, 6–7 March 2019; pp. 104–109. [Google Scholar]
- Jalal, A.; Quaid, M.A.K.; Kim, K. A Wrist Worn Acceleration Based Human Motion Analysis and Classification for Ambient Smart Home System. J. Electr. Eng. Technol. 2019, 14, 1733–1739. [Google Scholar] [CrossRef]
- Kim, K.; Jalal, A.; Mahmood, M. Vision-Based Human Activity Recognition System Using Depth Silhouettes: A Smart Home System for Monitoring the Residents. J. Electr. Eng. Technol. 2019, 14, 2567–2573. [Google Scholar] [CrossRef]
- Quaid, M.A.K.; Jalal, A. Wearable sensors based human behavioral pattern recognition using statistical features and reweighted genetic algorithm. Multimed. Tools Appl. 2020, 79, 6061–6083. [Google Scholar] [CrossRef]
- Nadeem, A.; Jalal, A.; Kim, K. Human Actions Tracking and Recognition Based on Body Parts Detection via Artificial Neural Network. In Proceedings of the 3rd International Conference on Advancements in Computational Sciences (ICACS 2020), Lahore, Pakistan, 17–19 February 2020; pp. 1–6. [Google Scholar]
- Tahir, S.B.U.D.; Jalal, A.; Batool, M. Wearable Sensors for Activity Analysis using SMO-based Random Forest over Smart home and Sports Datasets. In Proceedings of the 2020 3rd International Conference on Advancements in Computational Sciences (ICACS), Lahore, Pakistan, 17–19 February 2020; pp. 1–6. [Google Scholar]
- Jalal, A.; Uddin, M.Z.; Kim, J.T.; Kim, T.S. Recognition of human home activities via depth silhouettes and R transformation for smart homes. Indoor Built Environ. 2012, 21, 184–190. [Google Scholar] [CrossRef]
- Jalal, A.; Kim, Y.; Kim, D. Ridge body parts features for human pose estimation and recognition from RGB-D video data. In Proceedings of the Fifth International Conference on Computing, Communications and Networking Technologies (ICCCNT), Hefei, China, 11–14 July 2014; pp. 1–6. [Google Scholar]
- Kamal, S.; Jalal, A.; Kim, D. Depth Images-based Human Detection, Tracking and Activity Recognition Using Spatiotemporal Features and Modified HMM. J. Electr. Eng. Technol. 2016, 11, 1921–1926. [Google Scholar] [CrossRef]
- Amna, S.; Jalal, A.; Kim, K. An Accurate Facial expression detector using multi-landmarks selection and local transform features. In Proceedings of the IEEE ICACS Conference, Lahore, Pakistan, 17–19 February 2020. [Google Scholar]
- Ahmad, J.; Mouazma, B.; Kim, K. Sustainable Wearable System: Human Behavior Modeling for Life-Logging Activities Using K-Ary Tree Hashing Classifier. Sustainability 2020, 12, 10324. [Google Scholar]
- Jalal, A.; Lee, S.; Kim, J.T.; Kim, T.-S. Human activity recognition via the features of labeled depth body parts. In Proceedings of the Smart Homes and Health Telematics, Seoul, Korea, 23–25 September 2012. [Google Scholar]
- Kamal, S.; Jalal, A. A Hybrid Feature Extraction Approach for Human Detection, Tracking and Activity Recognition Using Depth Sensors. Arab. J. Sci. Eng. 2016, 41, 1043–1051. [Google Scholar] [CrossRef]
- Jalal, A.; Kamal, S.; Kim, D. Human depth sensors-based activity recognition using spatiotemporal features and hidden mar-kov model for smart environments. J. Comput. Netw. Commun. 2016, 2016, 8087545. [Google Scholar]
- Jalal, A.; Kamal, S.; Kim, D. Facial Expression recognition using 1D transform features and Hidden Markov Model. J. Electr. Eng. Technol. 2017, 12, 1657–1662. [Google Scholar]
- Jalal, A.; Kamal, S.; Kim, D. A depth video-based human detection and activity recognition using multi-features and embedded hidden Markov models for health care monitoring systems. Int. J. Interact. Multimed. Artif. Intell. 2017, 4, 5462. [Google Scholar]
- Mahmood, M.; Jalal, A.; Evans, H.A. Facial Expression Recognition in Image Sequences Using 1D Transform and Gabor Wavelet Transform. In Proceedings of the 2018 International Conference on Applied and Engineering Mathematics (ICAEM), London, UK, 4–6 July 2018; pp. 1–6. [Google Scholar]
- Adnan, R.; Jalal, A.; Kim, K. Automated sustainable multi-object segmentation and recognition via modified sampling consensus and kernel sliding perceptron. Symmetry 2020, 12, 1928. [Google Scholar]
- Nadeem, A.; Jalal, A.; Kim, K. Accurate Physical Activity Recognition using Multidimensional Features and Markov Model for Smart Health Fitness. Symmetry 2020, 12, 1766. [Google Scholar] [CrossRef]
- Chan, A.; Morrow, M.; Nuno, V. Analysis of crowded scenes using holistic properties. In Proceedings of the IEEE Workshop on CVPR, Miami, FL, USA, 6 August 2009; p. 101108. [Google Scholar]
- Mouazma, B.; Ahmad, J.; Kim, K. Telemonitoring of Daily Activity Using Accelerometer and Gyroscope in Smart Home Environments. J. Electr. Eng. Technol. 2020, 15, 2801–2809. [Google Scholar]
- Amir, N.; Jalal, A.; Kim, K. Automatic human posture estimation for sport activity recognition with robust body parts detection and entropy markov model. Multimed. Tools Appl. 2021, 1–34. [Google Scholar] [CrossRef]
- Israr, A.; Jalal, A.; Kim, K. Adaptive Pose Estimation for Gait Event Detection Using Context-Aware Model and Hierarchical Optimization. J. Electr. Eng. Technol. 2021, 1–9. [Google Scholar] [CrossRef]
- Zhu, C.; Miao, D. Influence of kernel clustering on an RBFN. CAAI Trans. Intell. Technol. 2019, 4, 255–260. [Google Scholar] [CrossRef]
- Jalal, A.; Sarif, N.; Kim, J.T.; Kim, T.-S. Human Activity Recognition via Recognized Body Parts of Human Depth Silhouettes for Residents Monitoring Services at Smart Home. Indoor Built Environ. 2013, 22, 271–279. [Google Scholar] [CrossRef]
- Jalal, A.; Kim, Y. Dense depth maps-based human pose tracking and recognition in dynamic scenes using ridge data. In Proceedings of the 2014 11th IEEE International Conference on Advanced Video and Signal Based Surveillance (AVSS), Seoul, Korea, 26–29 August 2014; pp. 119–124. [Google Scholar]
- Basavegowda, H.S.; Dagnew, G. Deep learning approach for microarray cancer data classification. CAAI Trans. Intell. Technol. 2020, 5, 22–33. [Google Scholar] [CrossRef]
- Jiang, R.; Mou, X.; Shi, S.; Zhou, Y.; Wang, Q.; Dong, M.; Chen, S. Object tracking on event cameras with offline–online learning. CAAI Trans. Intell. Technol. 2020, 5, 165–171. [Google Scholar] [CrossRef]
- Keshtegar, B.; Nehdi, M.L. Machine learning model for dynamical response of nano-composite pipe conveying fluid under seismic loading. Int. J. Hydromechatron. 2020, 3, 38. [Google Scholar] [CrossRef]
- Murlidhar, B.R.; Sinha, R.K.; Mohamad, E.T.; Sonkar, R.; Khorami, M. The effects of particle swarm optimisation and genetic algorithm on ANN results in predicting pile bearing capacity. Int. J. Hydromechatron. 2020, 3, 69. [Google Scholar] [CrossRef]
- Shahgoli, A.; Zandi, Y.; Heirati, A.; Khorami, M.; Mehrabi, P.; Petkovic, D. Optimisation of propylene conversion response by neuro-fuzzy approach. Int. J. Hydromechatron. 2020, 3, 228–237. [Google Scholar] [CrossRef]
- Gochoo, M.; Akhter, I.; Jalal, A.; Kim, K. Stochastic Remote Sensing Event Classification over Adaptive Posture Estimation via Multifused Data and Deep Belief Network. Remote Sens. 2021, 13, 912. [Google Scholar] [CrossRef]
- Jalal, A.; Ahmed, A.; Rafique, A.A.; Kim, K. Scene Semantic Recognition Based on Modified Fuzzy C-Mean and Maximum Entropy Using Object-to-Object Relations. IEEE Access 2021, 9, 27758–27772. [Google Scholar] [CrossRef]
- Badar, S.; Jalal, A.; Kim, K. Wearable Inertial Sensors for Daily Activity Analysis Based on Adam Optimization and the Maximum Entropy Markov Model. Entropy 2020, 22, 579. [Google Scholar]
- Ahmed, A.; Jalal, A.; Kim, K. A Novel Statistical Method for Scene Classification Based on Multi-Object Categorization and Logistic Regression. Sensors 2020, 20, 3871. [Google Scholar] [CrossRef]
- Jalal, A.; Batool, M.; Kim, K. Stochastic Recognition of Physical Activity and Healthcare Using Tri-Axial Inertial Wearable Sensors. Appl. Sci. 2020, 10, 7122. [Google Scholar] [CrossRef]
- Jalal, A.; Quaid, M.A.K.; Kim, K. A study of accelerometer and gyroscope measurements in physical life-log activities. Sensors 2020, 20, 6670. [Google Scholar] [CrossRef]
- Jalal, A.; Akhtar, I.; Kim, K. Human Posture Estimation and Sustainable Events Classification via Pseudo-2D Stick Model and K-ary Tree Hashing. Sustainability 2020, 12, 9814. [Google Scholar] [CrossRef]
- Javeed, M.; Jalal, A.; Kim, K. Wearable sensors-based exertion recognition using statistical features and random forest for physical healthcare monitoring. In Proceedings of the 2021 International Bhurban Conference on Applied Sciences and Technologies (IBCAST), Islamabad, Pakistan, 12–16 January 2021. [Google Scholar]
- Khalid, N.; Gochoo, M.; Jalal, A.; Kim, K. Modeling Two-Person Segmentation and Locomotion for stereoscopic Action Identification: A Sustainable Video Surveillance System. Sustainability 2021, 13, 970. [Google Scholar] [CrossRef]
- Ahmed, A.; Jalal, A.; Kim, K. Multi-objects Detection and Segmentation for Scene Understanding Based on Texton Forest and Kernel Sliding Perceptron. J. Electr. Eng. Technol. 2021, 16, 1143–1150. [Google Scholar] [CrossRef]
- Javeed, M.; Gochoo, M.; Jalal, A.; Kim, K. HF-SPHR: Hybrid Features for Sustainable Physical Healthcare Pattern Recognition Using Deep Belief Networks. Sustainability 2021, 13, 1699. [Google Scholar] [CrossRef]
- Rizwan, S.; Jalal, A.; Gochoo, M.; Kim, K. Robust Active Shape Model via Hierarchical Feature Extraction with SFS-Optimized Convolution Neural Network for Invariant Human Age Classification. Electronics 2021, 10, 465. [Google Scholar] [CrossRef]
- Ansar, H.; Jalal, A.; Gochoo, M.; Kim, K. Hand Gesture Recognition Based on Auto-Landmark Localization and Reweighted Genetic Algorithm for Healthcare Muscle Activities. Sustainability 2021, 13, 2961. [Google Scholar] [CrossRef]
Publisher’s Note: MDPI stays neutral with regard to jurisdictional claims in published maps and institutional affiliations. |
© 2021 by the authors. Licensee MDPI, Basel, Switzerland. This article is an open access article distributed under the terms and conditions of the Creative Commons Attribution (CC BY) license (https://creativecommons.org/licenses/by/4.0/).