Article

A Methodological Approach towards Sustainable Urban Densification for Urban Sprawl Control at the Microscale: Case Study of Tanta, Egypt

1
Department of Urban Planning, Faculty of Urban and Regional Planning, Cairo University, Giza 12613, Egypt
2
Department of Urban Management, Graduate School of Engineering, Kyoto University, Kyoto 615-8245, Japan
3
Water Resources Research Center, Disaster Prevention Research Institute (DPRI), Kyoto University, Kyoto 611-0011, Japan
4
Architectural Engineering Department, Faculty of Engineering, Tanta University, Tanta 31733, Egypt
5
Department of Regional Planning, Faculty of Urban and Regional Planning, Cairo University, Giza 12613, Egypt
*
Author to whom correspondence should be addressed.
Sustainability 2021, 13(10), 5360; https://doi.org/10.3390/su13105360
Submission received: 13 April 2021 / Revised: 4 May 2021 / Accepted: 5 May 2021 / Published: 11 May 2021
(This article belongs to the Special Issue Urban Sprawl and Sustainability II)

Abstract

:
When a high need for new residences coincides with an insufficient area of obtainable land within cities, urban sprawl occurs. Although densification is a well-known policy for controlling urban sprawl, one of the main challenges faced by researchers is that of determining urban densification potentials and priorities at the city scale. This paper aims to establish a methodology to facilitate decision-making regarding urban densification using five different methods. The proposed methodology utilizes high-quality city strategic plans (CSPs) and urban regulation documents and adopts geographic information systems (GISs) to determine and map the potential areas for densification. Multiple sustainability parameters, including environmental, economic, and social parameters, are selected, and weighted using an analytical hierarchy process (AHP) to prioritize the densification sites. The proposed method is tested in Tanta, Egypt, which has suffered due to agricultural losses of approximately 10 km2 within the last 50 years. The results credibly demonstrate the means by which to accommodate approximately 428% of the anticipated population increase in Tanta by 2027 and thereby save more than 53% of the approved deducted agricultural lands under the current urban regulations. Generally, this methodology offers a new model to optimize urban densification, which can be effective in urban management to achieve city resilience.

1. Introduction

Today, over half of the world’s population lives in cities, and the number of city inhabitants is anticipated to grow considerably in the upcoming years [1]. Due to population and economic growth, rapid urbanization, the high demand for housing units, and limited available land for housing development within city administrative boundaries, the issue of urban sprawl has arisen [2]. Various definitions have been introduced to describe urban sprawl as a particular frame of urban development with low-density, scattered, auto-dependent, and ecologically and socially impactful characteristics [3]. Urban sprawl conforms to a particular expansion pattern mostly described as “scattered development”, and it is considered to be a significant concern for sustainable development [4]. The emergence of related phenomena in urban development is unavoidable and causes harmful environmental, economic, and social impacts [2,5]. Examples of the significant problems caused by urban sprawl include extensive travel distances and gas emissions, social injustice, the loss of agriculture and natural lands, and climate change [6,7].
In policymaking, there is a growing need for a strategy that can manage urban sprawl and its various negative consequences, especially residential expansion [2]. Therefore, governments have endeavored to control urban sprawl using various integrated urban growth management strategies involving municipalities, urban planners, investors, and civil society [8,9]. The concept of “urban containment”—forming geographical restrictions on urban growth—has emerged as one of the most essential and controversial strategy issues associated with urban sprawl [10]. The containment strategies for urban sprawl have been classified into three major types: urban growth boundaries (UGBs), green belts, and urban service boundaries (USBs) [9]. A UGB is a line that represents the physical boundary that determines urban and rural areas [11]. A greenbelt usually refers to a band surrounding a city or urban area beyond which planners and government restrict growth. Greenbelts are mainly formed by the public or through the non-profit purchase of open space lands or farmland development rights [12]. A USB identifies the area beyond which the municipality has decided that the city’s infrastructure should not extend [13]. Thus, an urban containment strategy is generally an attempt to intentionally use public land acquisitions, land-use regulations, and infrastructure investments to contain or direct growth to specific locations [9]. Another strategy, urban densification, has evolved as a reaction to the urban sprawl problem, emerging from the need for more efficiently used urban spaces that maximize land savings and optimize intra-urban transport for improved accessibility [14,15,16]. In summary, urban containment strategies have different drawbacks, which in turn require an integrated framework at the regional and urban levels. However, appropriate urban densification is recommended with a valid and effective framework to limit urban sprawl and to avoid different defects at the spatial, economic, and infrastructural levels [7].
Urban densification has not been clearly defined [17]. Densification is a generic term for the process of making cities more compact, which has been increasingly supported since the 1990s and has been globally applied as a planning policy [18,19]. Generally, the densification strategy means that land is used more intensively. This strategy determines the net increase in housing units to accommodate additional populations within an existing urban area [2,20]. Thus, densification in planning can be determined by two main variables: an increase in population and an increase in dwellings within the city boundary. Both variables can be influenced by land-use planning, but it is the planning system that ultimately regulates land uses and building densities, not the occupancy rates of buildings [19,21]. Therefore, this study focuses on the increase in dwelling units that can be achieved through various forms influenced by potential densification site locations. Accordingly, there are five main forms of urban densification: (1) infill development, which is the process of filling in vacant open lands between buildings in the city [22]; (2) roof stacking, which is the addition of floors to existing buildings to accommodate more dwelling units [8]; (3) transforming and renovating the roofs of residential buildings into dwelling units [23]; (4) densification by filling “backyards”, back lands and gardens, which allows for the horizontal extension of existing buildings; and (5) the redevelopment of land at higher densities by demolishing existing low-density buildings and slum areas [23,24]. The urban densification needs and capacity of each city must be identified by the responsible local authorities while maintaining respect for sustainable development and the quality of urban life [25,26].
Urban densification strategies have been adopted in the city planning policies of many developed countries because of their benefits, which include the conservation of lands and efficient land use while limiting sprawl, containing transport networks, and reducing dependency on mass transport. Such benefits also include the reduction of expenditures on services and infrastructure that increase with urban sprawl, the promotion of a socially interactive environment with vitality and various activities, and the enhancement of economic viability [27,28,29,30]. Despite its benefits, various problems and challenges are associated with implementing an urban densification strategy, including an increase in air pollution and congestion, the modification of urban morphologies and architectural typologies, the neglect of urban heritage, the creation of heat island effects and wind discomfort, the reduction of daylight and solar access, an increase in flood and tsunami risks in vulnerable areas, and additional pressure placed on urban infrastructure, networks, and services [31,32,33,34,35]. Moreover, researchers have debated the correlation between high urban density and reduced use of automobiles [36]. Studies have highlighted the secondary effects of some types of densification on urban green areas to define the challenges and strategies in achieving flourishing urban green spaces [37,38,39]. Overall, an urban densification strategy seems favorable concerning many environmental criteria; however, it comes with social constraints and high construction costs [34,40]. The integration of environmental, economic, and social parameters in the densification process to create a methodology that meets physical needs and considers the community’s sustainability is highly recommended to overcome the disadvantages of urban densification [8].
Urban densification measures are also used in land-use planning to calculate development land requirements, estimate site capacities, and control individual site development. To summarize, better measures of densification are needed for three reasons: (1) to support the research on the impacts of densification and thereby guide urban planning policy, (2) to enable the measurement of progress towards sustainability, and (3) to provide a planning tool. Approaches and methods to implement and measure potential urban densification sites differ throughout the world [28,41,42]. Different methods and approaches have been investigated in previous studies on urban densification quantification and mapping in developed countries such as the United Kingdom, Denmark, and Belgium [8,27,43]. Methodologies have been introduced to determine the potential of urban densification through roof stacking and attic extension [8,44]. In Denmark and Finland, potential sites for urban densification have been mapped based on GIS and residents’ questionnaires [45,46]. Other studies focus on why and where to seek densification from a macroscale perspective [24] (pp. 1–5), [47,48]. However, densification at the microscale (urban block or parcel) is hardly studied.
Accordingly, there is currently no comprehensive urban densification methodology at the microscale (urban block or parcel) that can quantify the potential results of the five defined densification methods applied to urban densification sites considering both sustainable development and the quality of urban life. In contrast to conventional methodologies for urban densification, which focus on the macroscale or on a single densification strategy, this study aims to (1) develop a methodology for identifying the primary areas with potential for urban densification regarding the five densification methods (filling backyards, infilling land, demolition and rebuilding, roof transformation, and roof stacking) and (2) prioritize sites according to multiple sustainability parameters. The following sustainability parameters are used in this study: environmental (slope, natural and man-made risk areas, and accessibility to daylight); economic (land value, industrial and commercial centers); and social (transportation accessibility, elementary schools’ accessibility, accessibility to public green spaces and population density). This study covers only the urban and policy configuration phase since there are two additional phases to implement urban densification: (A) building structural configuration and (B) architectural configuration. The proposed methodology applies high-quality city strategic plans (CSPs) and urban regulation documents and uses GIS to determine and map the potential areas for densification. Sustainability parameters, selected and weighted by five urban planning experts, are adopted based on the literature review and using an analytical hierarchy process (AHP) to prioritize the densification sites. According to this methodology, a Tanta city map was produced to determine the capability to accommodate additional inhabitants. The methodology developed in this paper offers a common and applicable urban planning method for decision-making regarding urban densification potential and its prioritization worldwide.

2. Study Area

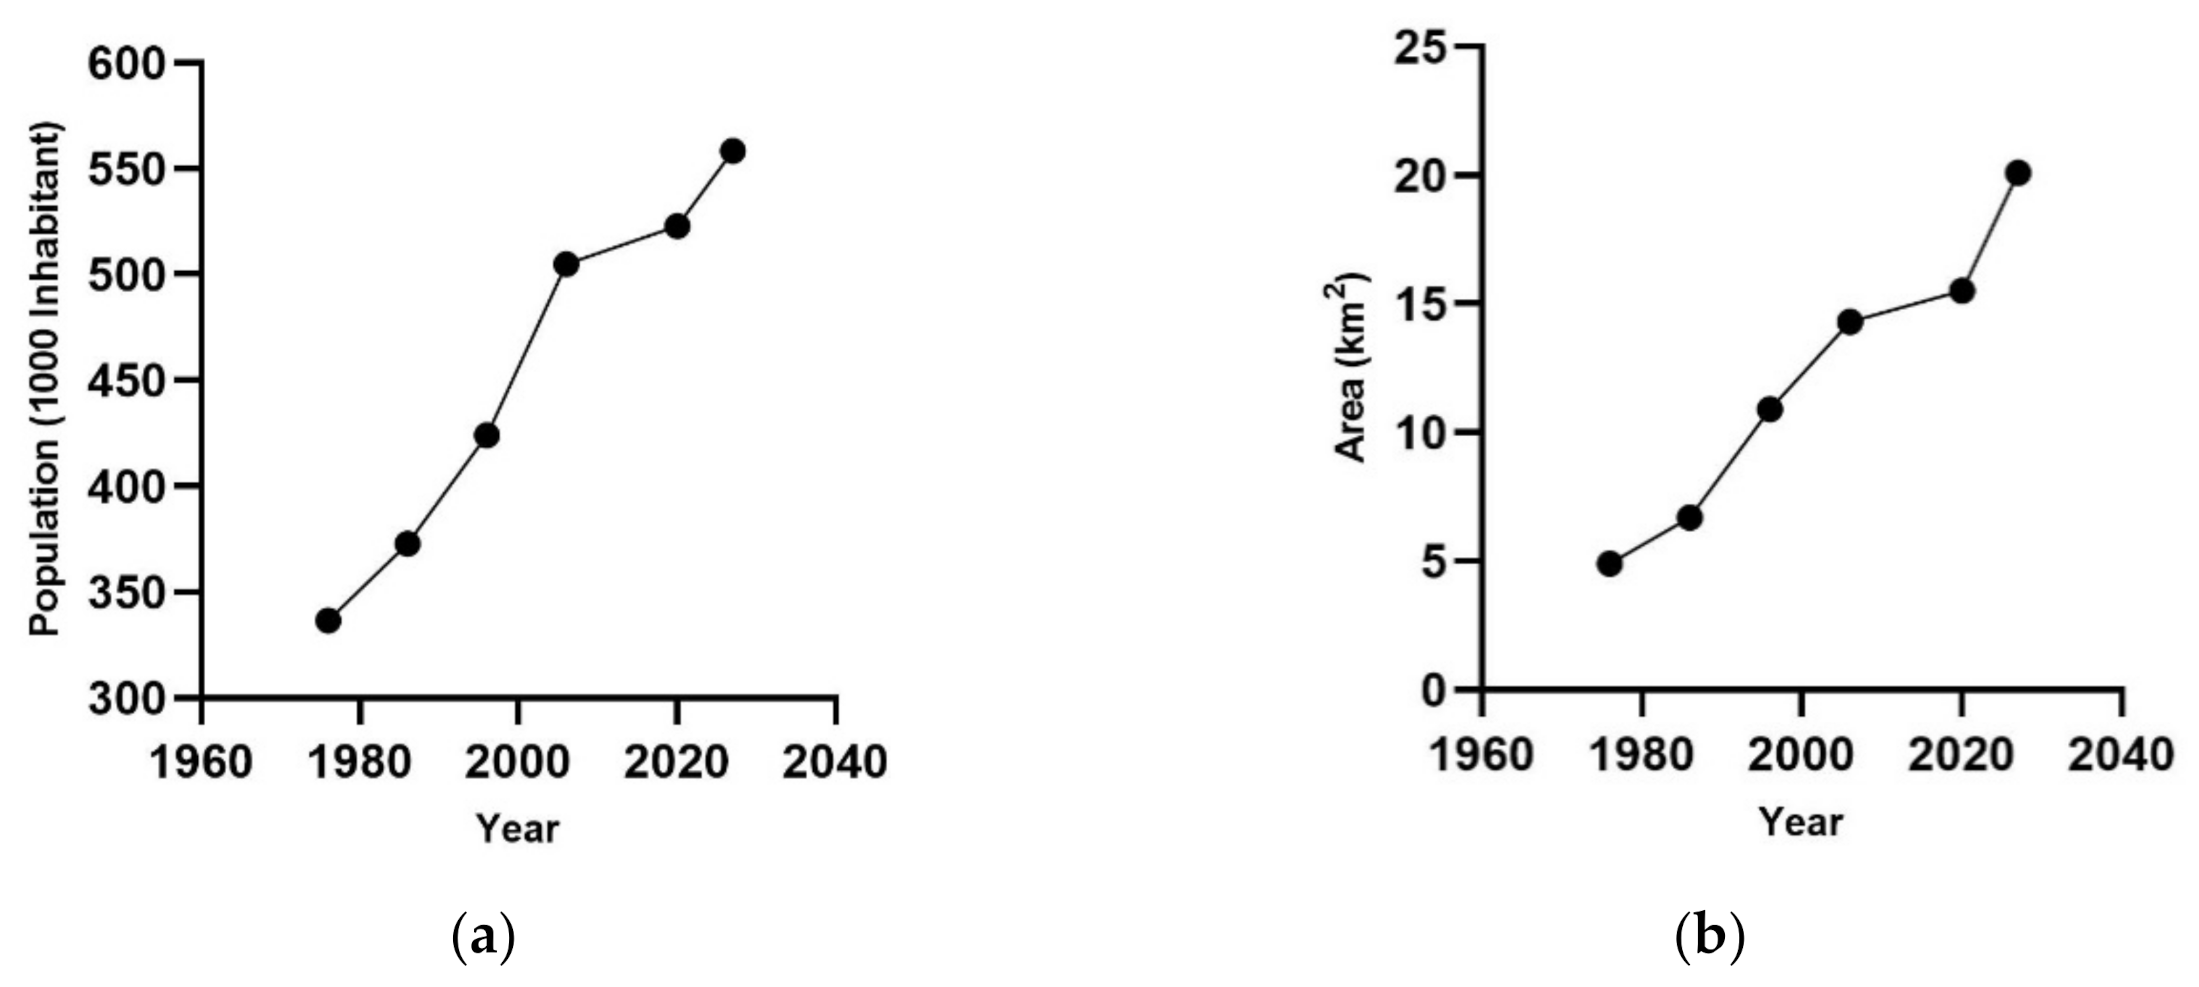
Tanta city is the capital of El Gharbia Governorate, Egypt. Tanta is located at the intersection of latitude 30°47′28” N and longitude 30°59′53” E and at an altitude of 10 m above sea level. The city is part of the Nile Delta and is surrounded by high-quality agricultural lands. The city is divided into two districts, each consisting of seven wards or “sheikhas” (Figure 1). The total population of the city (as of 2017) is 504,855 inhabitants. The city has emerged as one of the most attractive cities in the Nile Delta. Over the last 25 years, the city has undergone rapid development and massive increases in urban and population growth. The urban area increased from 10.9 km2 in 1996 to 15.5 km2 in 2020 and is expected to reach 20.1 km2 in 2027. Agricultural lands also decreased rapidly, from 8.5 km2 in 2007 to 7.4 km2 in 2020, and they are expected to reach 2.8 km2 in 2027. Additionally, the population increased by almost 1.4 times from 1996 to 2017 and is expected to reach 558,383 inhabitants in 2027 (Figure 2). The city has one of the highest population densities in the governorate administrative division (23,475 people/km2), with strong urban growth and development from 1976 to 2020 [43].

3. Materials and Methods

3.1. Data Availability

Several data sets were collected and analyzed in this study (Table 1). Census data, demographic data, and current urban databases from Tanta’s approved CSP 2027 were collected. The resultant data covered land uses, building conditions, historical buildings, slum areas, maximum allowable height, building footprints, natural and man-made risk areas, road width, building height, land value, industrial and commercial centers, the points and routes of public transport lines, elementary schools, public green spaces, and population density. Additionally, topographic features based on remote sensing data (in digital elevation models, DEMs) with an accuracy of 30 m were utilized [49]. These data sets (Table 1) were used to produce potential sites for residential densification and prioritization maps in Tanta city, Egypt [43].

3.2. Proposed Method

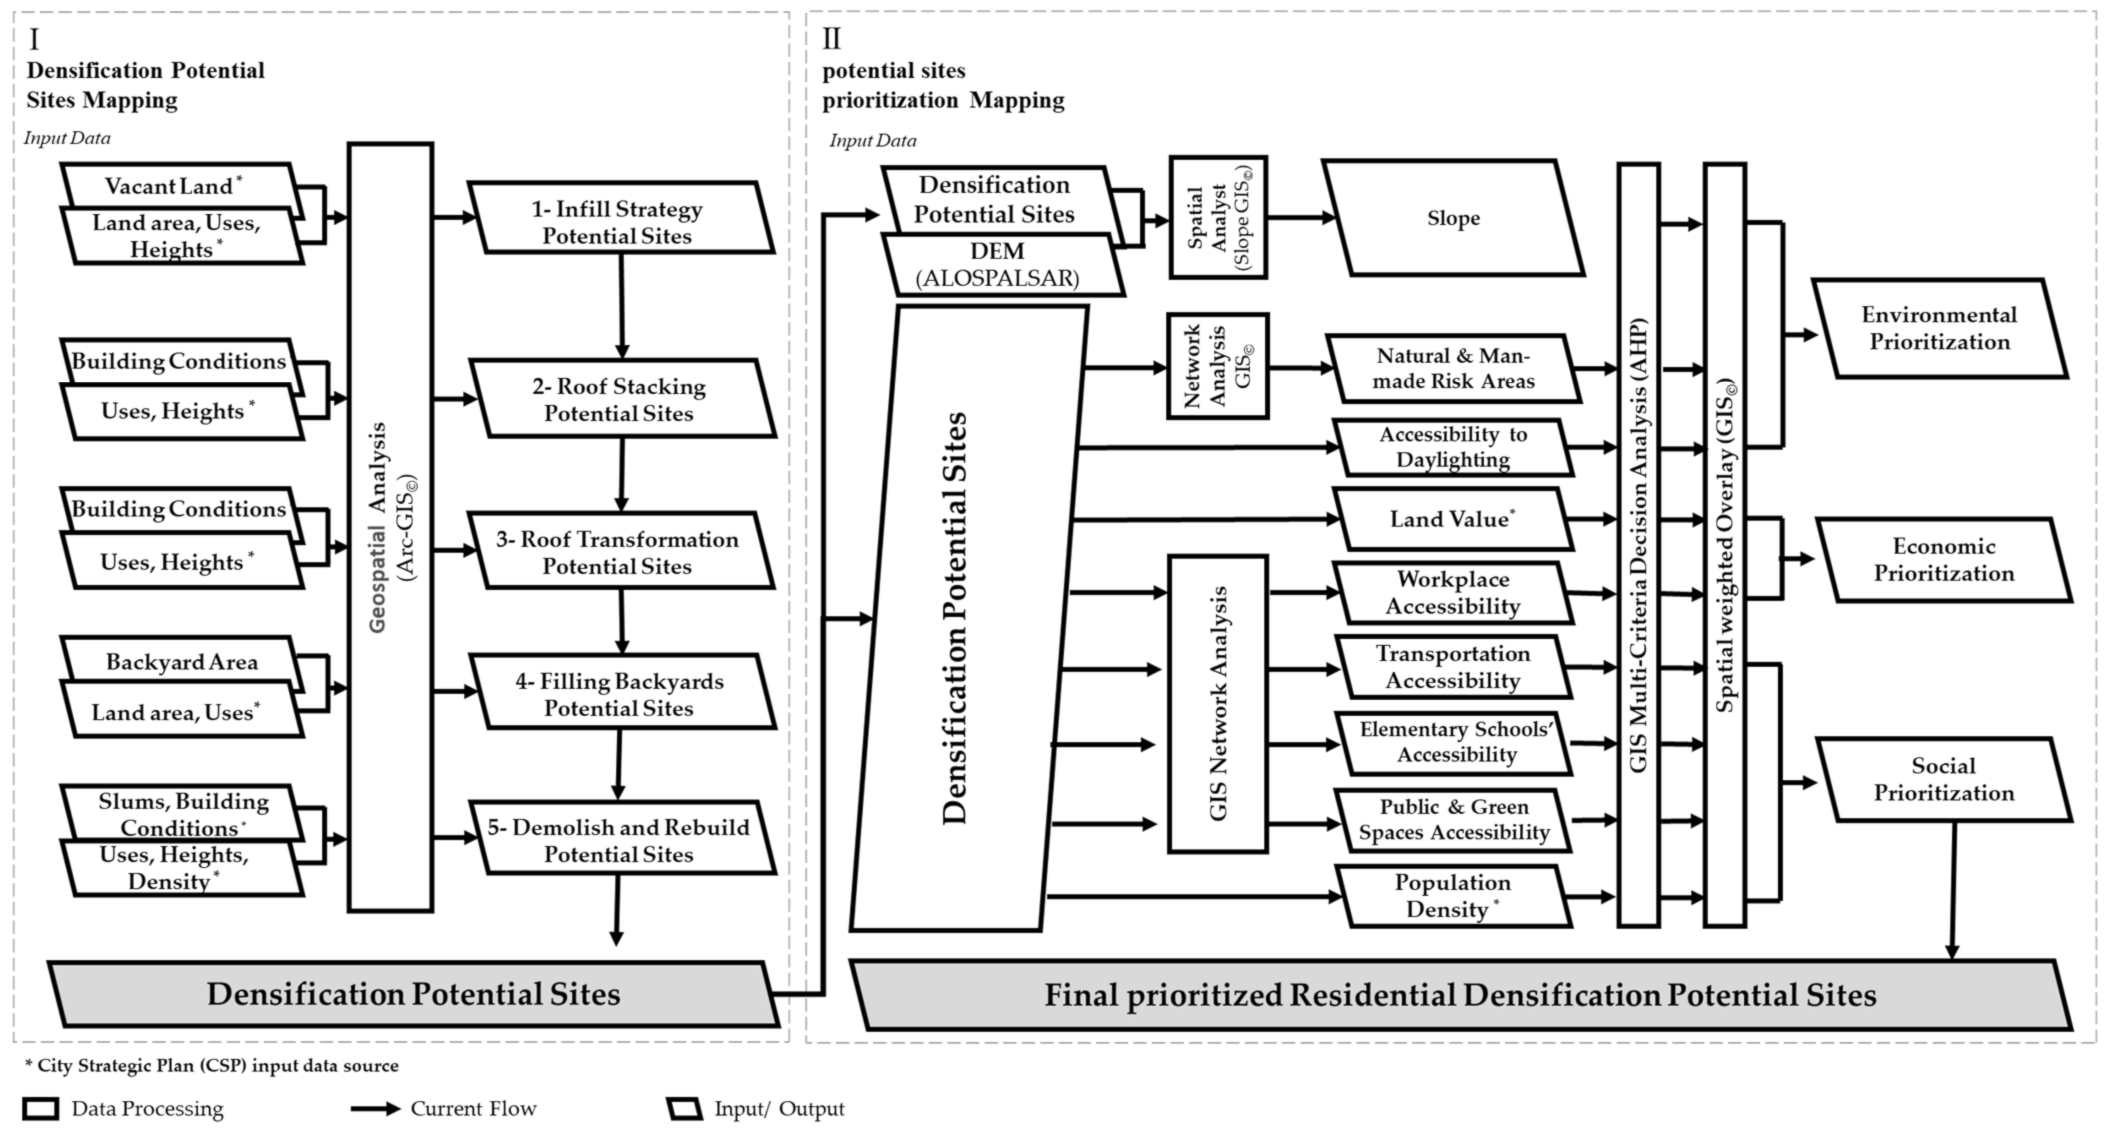
Overall method: A comprehensive method is proposed to quantify and map the potential sites for residential densification at the microscale and to determine their priority for inclusion in the densification plan following two main sub-methods. Each method is explained in detail below (Figure 3).
(I)
Quantifying and mapping potential sites for residential densification:
The method is carried out in six steps (Figure 3) in section I (left). (1) The potential site map from the infill strategy is set by determining the vacant lands and building regulations, which include the following: the use of the land (all uses except residential use are excluded), the minimum allowable area for residential buildings, and the maximum allowable height. (2) The potential sites for the roof stacking strategy are mapped by determining the building condition (buildings with poor condition are excluded), excluded buildings (historical residential buildings), and the current and maximum allowable height (subtracting the current height from the maximum allowable height to identify the potential stories that can be added). (3) The potential sites for the roof transformation strategy are mapped by determining the building condition (buildings in poor condition are excluded), the current roof’s used area, and the maximum allowable extension (subtracting the maximum allowable extension and the current roof’s used area to identify the potential areas that can be added). (4) The potential sites for the filling backyard strategy are mapped by determining the buildings with suitable backyards (the built ratio is less than the ratio determined by the building regulations), the current area of the backyards, and the maximum allowable extension (subtracting the maximum allowable extension and the current backyard area to identify the potential areas that can be added). (5) The potential sites for the demolition and rebuilding strategy are mapped by determining the building conditions (buildings with moderate and good conditions are excluded), slum areas (identified by the responsible official organization), and maximum allowable height. (6) The final residential densification potential site map is produced by combining the five abovementioned maps (infilling, roof stacking, roof transformation, filling backyards, and demolition and rebuilding).
(II)
Prioritizing potential sites for residential densification:
Multiple sustainability indicators, environmental (slope, natural and man-made risk areas, and accessibility to daylight); economic (land value, industrial and commercial centers); and social (accessibility to transportation, elementary schools, and public green spaces and population density), are used (Figure 3) in section I (left). All indicator maps are produced based on CSP data sets obtained from detailed urban surveys. GIS-based multicriteria analysis, the AHP approach, is applied to assign the relative weight for each sustainability indicator, enabling the development of a map for prioritizing potential sites for residential densification. The resulting priority map is categorized into four equally divided categories from the minimum to the maximum sustainability scores: low, moderate, high, and very high [35].

3.2.1. Potential Sites for Residential Densification

There are currently few tools to help responsible city planners develop rational densification strategies for urban areas considering quality of life and sustainable development. A generic methodology was proposed to determine the potential sites for urban densification in Tanta. Three of the five strategies were found to be applicable in Tanta city. These three strategies are infilling land, demolition and rebuilding, and roof stacking. Backyard filling was considered to be a low-effectiveness strategy, and roof transformation strategies were not applicable in the study area for the following reasons:
  • Regarding the backyard filling strategy, Tanta city is one of the oldest cities in Egypt, and most of the buildings were built without backyards; therefore, there are very few backyards to be filled.
  • Roof transformation strategy: According to Egyptian law, for buildings with several units, the roof is considered a common space for services for all building residents. There is an exception to this rule in the new cities; a residential unit covering no more than 25% of the ground floor area may be built on the roof.
The criteria for mapping the urban densification potential by those three strategies were established based on urban regulations and the characteristics of the land and buildings. The General Organization of Physical Planning (GOPP) provides this information in GIS database format [43]. The main program used in this study was ArcGIS software.
In the following section, a detailed explanation of the three strategies utilized for the residential identification of potential Tanta sites is provided.

Land Infill Strategy

In the infill strategy, new buildings are established in vacant lots, gaps between buildings, and areas not previously built up [22,50]. In Tanta, there are four types of land that can be infilled: (1) non-arable lands, which are agricultural lands that have not been replanted; (2) vacant lands; (3) agricultural pockets, which are agricultural lands surrounded by buildings within or on the boundaries of the urban cluster; and (4) yards, which are vacant lands used as informal dumps. All the potential areas for the landfill strategy are filtered considering two main aspects of Egyptian regulations: (1) planned land use should be considered in that the vacant lands should be allocated for residential use within the Tanta CSP, and (2) the area of the parcel to be built for residential use cannot be less than 120 m2. The building height should comply with the CSP’s regulations, which in our case is 6 floors (ground + 5 floors). The footprint of the building should not exceed 80% of the total area of the parcel. Different processes are applied to calculate the built area expected to be added from each densification strategy. The vacant plot land area is multiplied directly by 80% (the allowable built area of the total parcel area) and then multiplied by 6 (the maximum allowable height), as determined by the new building regulations issued in 2021.

Demolition and Rebuilding Strategy

This strategy is applied to cracked and ruined residential buildings in addition to buildings in the slum areas, which have already been classified by the responsible authority. The building height is the main parameter for this strategy for both the current and planned situations. Regarding the current situation, the total affected population to be resettled is calculated based on the current height of the building and the population density. For the planned situation, the building heights should be fulfilled by the CSP’s regulations. Approximately 66.6% of the total land resulting from the demolition and rebuilding of slums or deteriorated buildings in Tanta city is estimated to be dedicated to residential use, as 33.3% is reserved for roads, spaces, and services according to Egyptian urban planning law. Then, the result is multiplied by 6 (the maximum allowable height).

Roof Stacking Strategy

This strategy mainly concerns the addition of new floors to the rooftops of existing buildings to create one or more stories of living spaces [51]. The study found that buildings are permitted to have 6 floors according to the requirements (ground + 5 floors). Each block’s area was multiplied by the maximum allowable added floors to calculate the total added area, and then all the block’s areas were summed to obtain the final area resulting from the roof stacking strategy.
Finally, after calculating the built area resulting from each densification strategy, the expected number of units was calculated by considering three levels of apartments: economic, medium, and high. The average area of units in Tanta city was found to be 200 m2 [43]. After calculating the number of added units, the expected population was calculated by multiplying the number of units by the average number of family members, which was 3.7 [43].

3.2.2. Method for Prioritizing Potential Sites for Residential Densification

The main input of this part of the methodology is the map of potential sites for residential densification resulting from the first part of this methodology. Multiple sustainability indicators must be obtained including environmental (slope, natural and man-made risk areas, and accessibility to daylight); economic (land value, industrial and commercial centers); and social (accessibility to transportation, elementary schools, and public green spaces and population density) indicators (Table 2). For this purpose, the raw data from the CSP data sets must be analyzed, as shown in the following section.

Environmental Parameters

A.
Slope
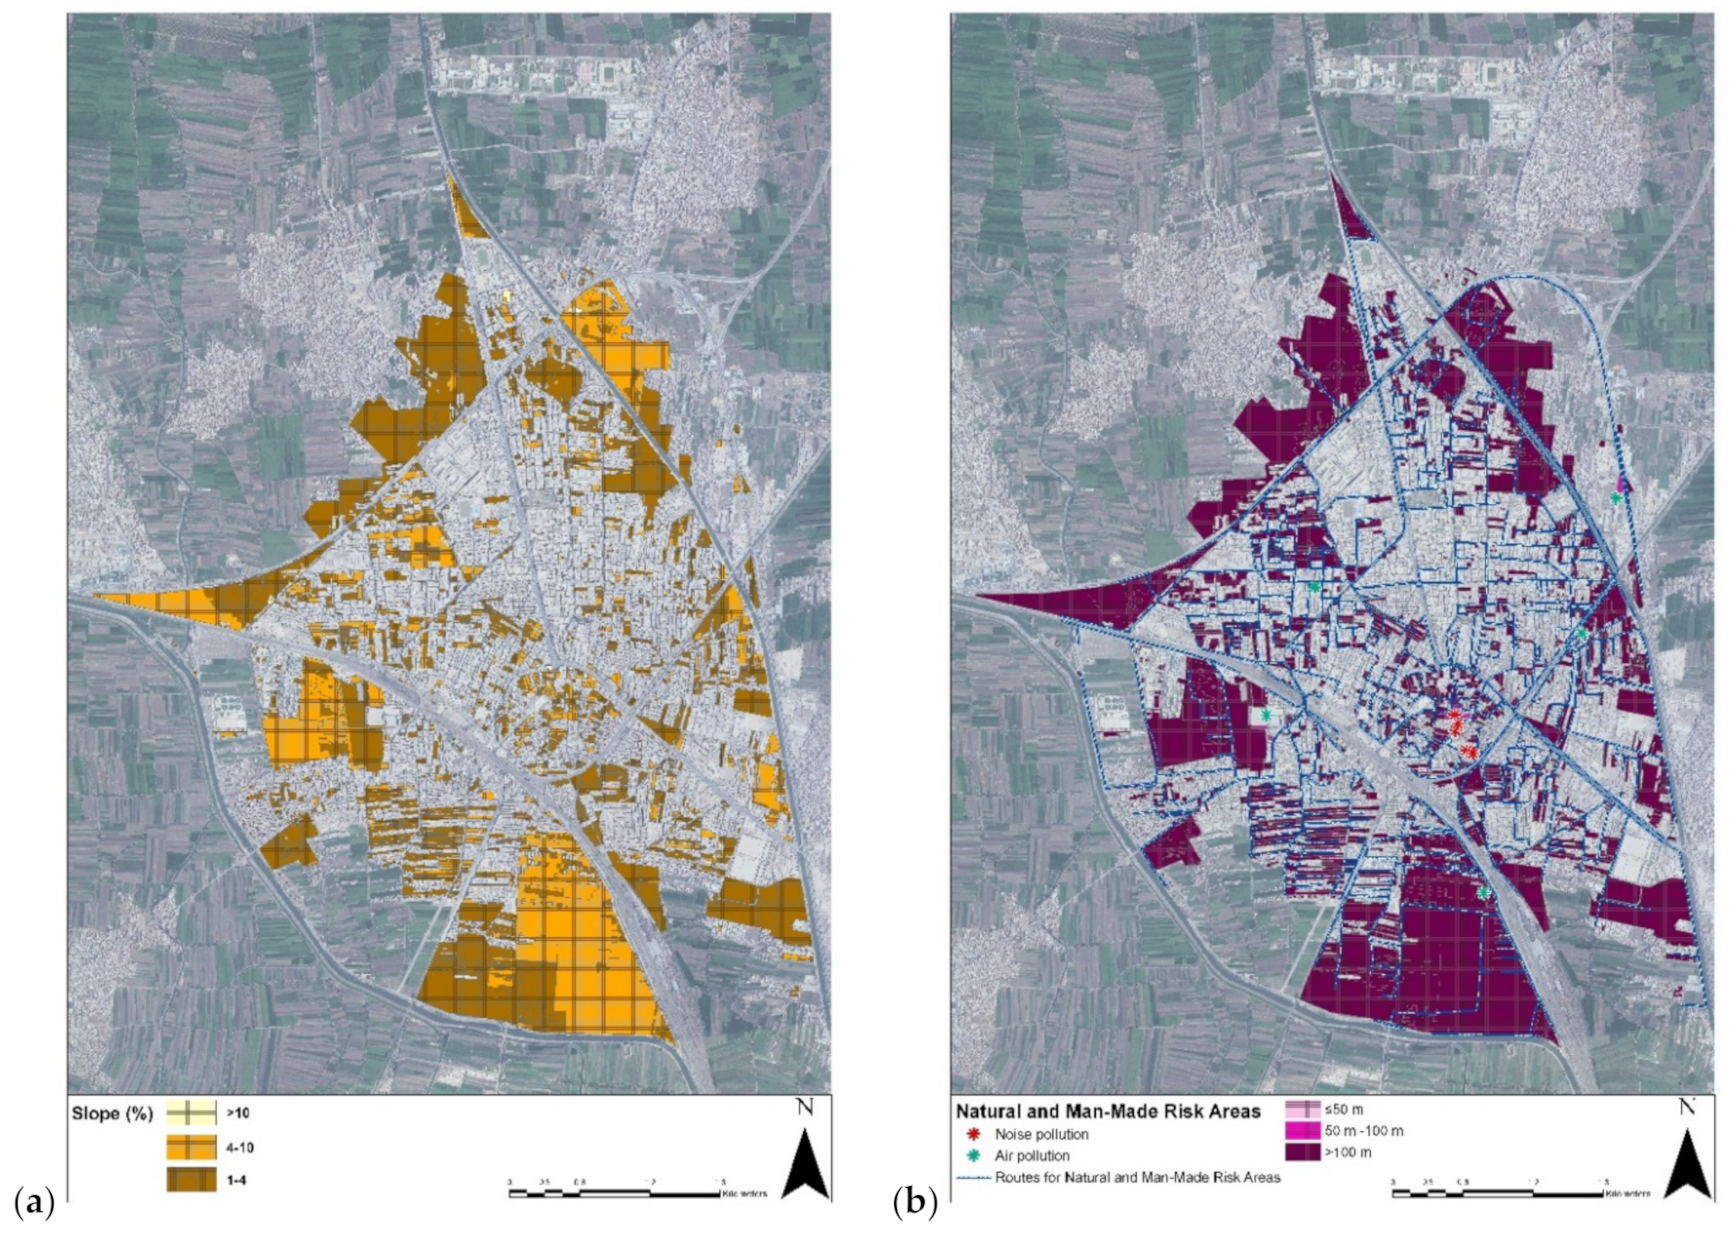
The digital elevation model (DEM) was obtained through advanced land observation system-phased array synthetic aperture radar (ALOS-PALSAR) data available from the Alaska Satellite Facility (ASF) Distributed Active Archive Center (DAAC) with 30 m resolution [49]. The original DEM was processed using a spatial analyst (slope), and value points were extracted using tools in ArcMap 10.6.1 to obtain the slope layer. The resulting slope map was ranked into three categories as follows [52]: from 1° to 3.99°, from 4° to 10°, and higher than 10°. The first category is generally suitable for all developments and uses, while the second category is suitable for medium-density residential development. The third category is considered suitable for low-density residential development and has the lowest score (Table 2).
B.
Natural and man-made risk areas
For residential densification, the distance from potential risks, whether natural or human-dependent, must be considered. Natural risks, such as flooding and geologic faults, are not considered to be threats in Tanta city. The city faces only man-made risks, and those associated with gas and power lines, air pollution caused by factories, and noise are considered in this study. Accordingly, the farther sites are from such risk areas, the higher their priority for residential densification. For the distance calculation for each of the potential sites for residential densification, the network analysis method was used. The first step to implement the network analysis was to combine all potential sites for densification in one layer. The second step was to modify the road network in Tanta city and to fill in the missing data. Third, network data set layers were created using the modified road layer from the previous step. Finally, a method was followed (new closest facility) between two layers (natural and man-made risk areas—potential sites for residential densification) and then solved. The resulting map was ranked into three categories as follows [53]: ≤50 m, 50–100 m, and more than 100 m (Table 2).
C.
Accessibility to daylight
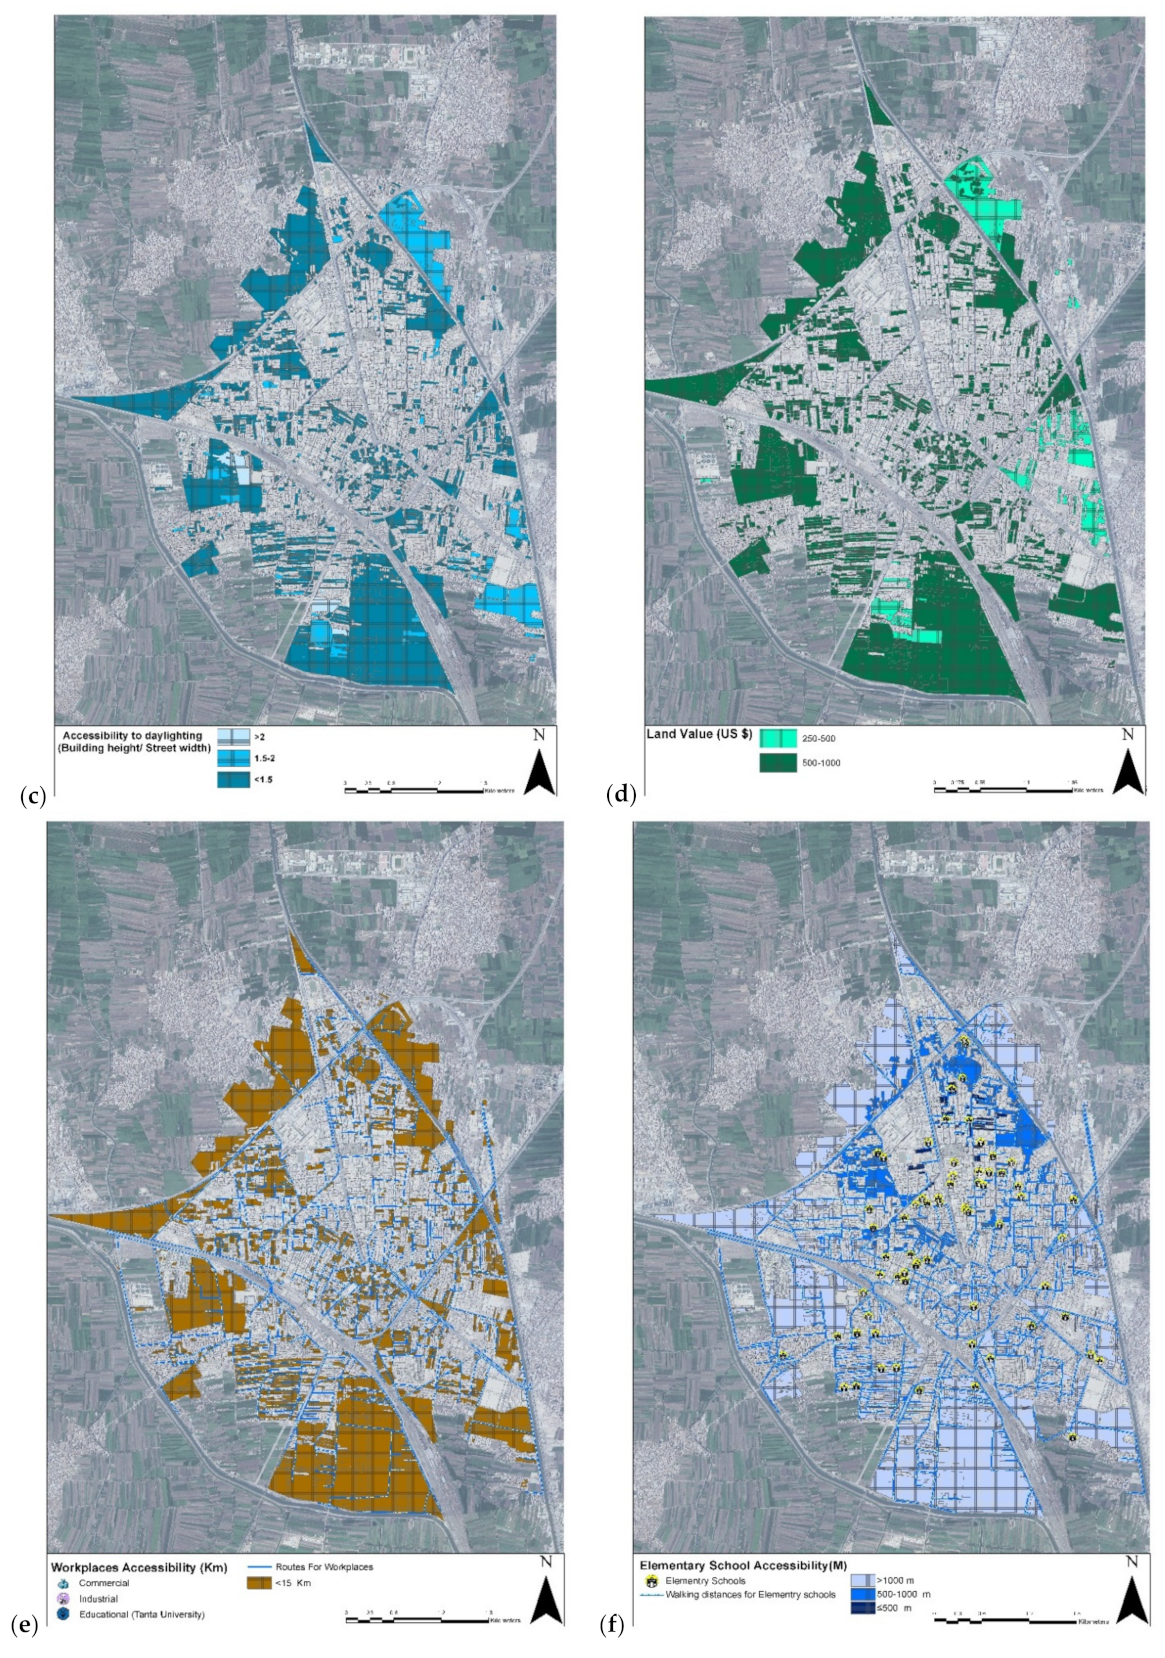
Through the available data on the width of the streets and the height of the buildings, the study identified accessibility to daylight indicators (building height/street width). Accordingly, multiple steps were followed. First, the number of floors is made equivalent to the building height in meters using the field calculator tool. Second, the buffer tool was used to make a buffer for the road layer to intersect with the land-use layer to link the parcels/buildings and the roads nearby. Finally, a spatial joint was used to move the data (building height/street width) into a new layer and then identify accessibility to daylight values for each parcel. The resulting map was ranked into three categories as follows [53]: less than 1.5, 1.5–2, and higher than 2 (Table 2).

Economic Parameters

A.
Land Value
The land value at the parcel level was included given that the potential for housing densification is highly influenced by the cost of land [35,54]. The higher the land price, the higher the maximum allowable height permissioned to be built will be. Therefore, areas with a higher price were considered a priority for densification ranging from 500 USD /m2 to 1000 USD /m2, 250 USD /m2 to 500 USD /m2, and, finally, areas less than 250 USD /m2 (Table 2).
B.
Commercial and industrial centers
Accessibility to retail commerce (shops and malls) was considered an essential part of the advantages for any location with high population density due to the necessity of satisfying a wide variety of supply demands. Given that Tanta has a well-established industrial sector, with 42.82% of the employment concentrated in the manufacturing sector, proximity to these features (factories and manufacturing companies) was considered a factor favoring an area’s priority for densification. Concerning the distance calculation, the network analysis method was used, as mentioned in the section regarding areas with natural and man-made risks (Section 3.2.2-Environmental Parameters-B). The only difference concerned the final step and involved the analyzed layers (commercial and industrial centers—potential sites for residential densification). The resulting map was ranked into three categories as follows [2]: more than 25 km, 15–25 km, and less than 15 km (Table 2).

Social Parameters

In the third set of sustainability parameters, a group of variables associated with the presence of and accessibility to infrastructure and urban facilities was included.
A.
Public transportation accessibility
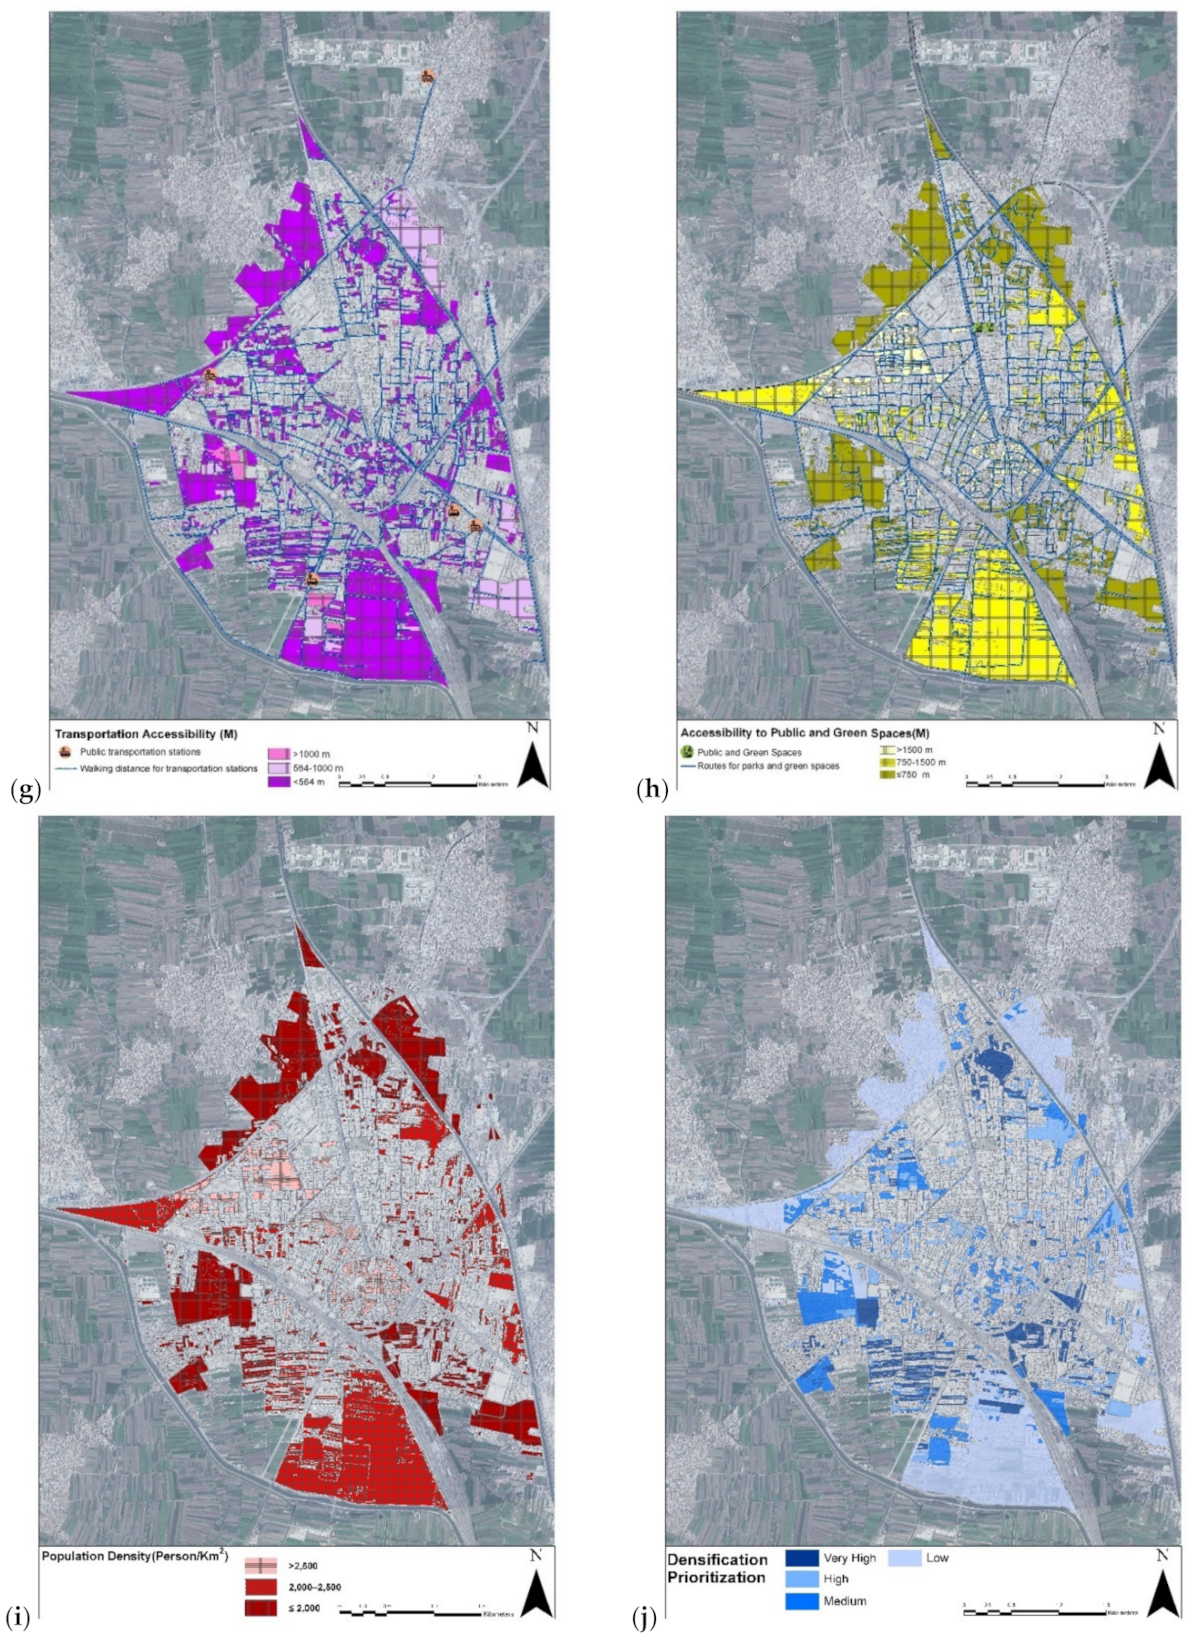
There is a strong relationship between public transport networks and a sustainable, compact urban form. Better connectivity with transport facilities and shorter trip distances results in a better air quality and better environmental sustainability. Concerning the distance calculation, the network analysis method was used, as mentioned in the section regarding natural and man-made risk areas (Section 3.2.2-Environmental Parameters-B). This method was used to change the analyzed layers (transportation stations—potential sites for residential densification). The resulting map was ranked into three categories, as follows [8,54]: >1000 m, 564–1000 m, and less than 564 m (Table 2).
B.
Accessibility to elementary schools
First, advantageous locations are close to educational facilities, especially elementary schools, since these are frequently used services, with almost daily trips. An elementary school’s accessibility or proximity may be described by how efficiently it can be reached in terms of time and travel distance and can be measured as the distance of a parcel to the nearest school. The network analysis method was used for distance calculation, as mentioned in the section regarding natural and man-made risk areas ((Section 3.2.2-Environmental Parameters-B), changing the analyzed layers (elementary schools—potential sites for residential densification). The resulting map was ranked into three categories, as follows [54]: >1500 m, 500–1500 m, and less than 500 m (Table 2).
C.
Accessibility to public and green spaces
Parks and green areas are considered to improve living conditions in densely populated areas. However, Tanta city suffers from a lack of such areas. Regarding the distance calculation, the network analysis method was used as mentioned in the section regarding natural and man-made risk areas (Section 3.2.2-Environmental Parameters-B), changing the analyzed layers (public and green spaces—potential sites for residential densification). The resulting map was ranked into three categories as follows [8,53]: >1500 m, 750–1500 m, and less than 750 m (Table 2).
D.
Population density
Urban densification patterns tend to be characterized by an ongoing increase in high densities at the expense of low densities. Therefore, urban densification is a higher priority at sites with low population density than at saturated sites. The resulting map was ranked into three categories as follows [2]: >2500 persons/km2, 2000–2500 persons/km2, and less than 2000 persons/km2 (Table 2).

Weighting of the Sustainability Index Using AHP

AHP is a vital tool for decision-makers, enabling their preferences regarding analysis and discussion [55]. AHP is implemented using six steps, as discussed and illustrated below [56].
  • The relative importance of each parameter in a pair is determined according to the pairwise comparison importance scale; this step is called prioritization.
  • A pairwise comparison for a matrix of (9 × 9) cells is created to hold the nine sustainability indicators. The elements in row i and column j of the matrix are labelled I, J. The matrix has the property of reciprocity (aij = 1/aij).
  • The matrix is standardized using the mathematical expression aij/ i , j = 1 n a i j [56].
  • The normalized value for each parameter from pairwise comparisons is used with the weighted values in the last column of the standardized matrix to obtain the eigenvector, which represents the consistency index (CI) matrix [55].
  • The CI is applied to check the pairwise comparison matrix using Equation (1):
    CI = λ   m a x n n 1
    where CI is the consistency index, n is the number of vulnerability parameters being compared, and λ max is the largest value of the eigenvector matrix.
  • The consistency ratio (CR) is the CI ratio and the random index (RI), and it is expressed mathematically using Equation (2).
    C R = C I R I
The CR to check the consistency of the pairwise comparisons was developed by Saaty [56]. The CR was calculated, and the value was found to be 0.046, which is less than 10% (0.1), indicating that the pairwise matrix is consistent. The final densification prioritization map was obtained by using the weighted overlay function in ArcGIS. The resulting weighted overlaid raster was ranked into four classes, from very high to low.
According to the proposed criteria, all layers that have been converted to raster format were reclassified using an ordinal scale from 1 to 3, with higher values indicating higher priority sites (Table 2).
Each indicator’s importance was evaluated by a group of experts (5 experts) in a pairwise comparison, establishing a ranking within each category.
The prioritization map was calculated using a weighted ranking for each indicator according to the following function (3), presented by Aroca-Jimenez et al [57].
w e i g h t e d   r a n k i n g = f = 1 n w f s f
where f is the sustainability indicator, n is the total number of indicators, w f is the relative weight assigned to the indicators, and s f represents the indicator score.
Each indicator was then multiplied by its corresponding weight and combined into integrated models with a weighted overlay sum function [35,54].
The category models were then combined in a general model with equal weights assigned to the components in each category (environment, economic, and social). The workflow of the prioritization module was conducted in the ArcGIS environment.

4. Results

4.1. Residential Densification Potential Sites in Tanta, Egypt

The total needed units in Tanta city until 2027 were calculated, as shown in Table 3. The results showed that a total of 53,528 inhabitants were expected to be added to the current population, leading to a total need for 14,467 units to accommodate this growth in Tanta’s population.
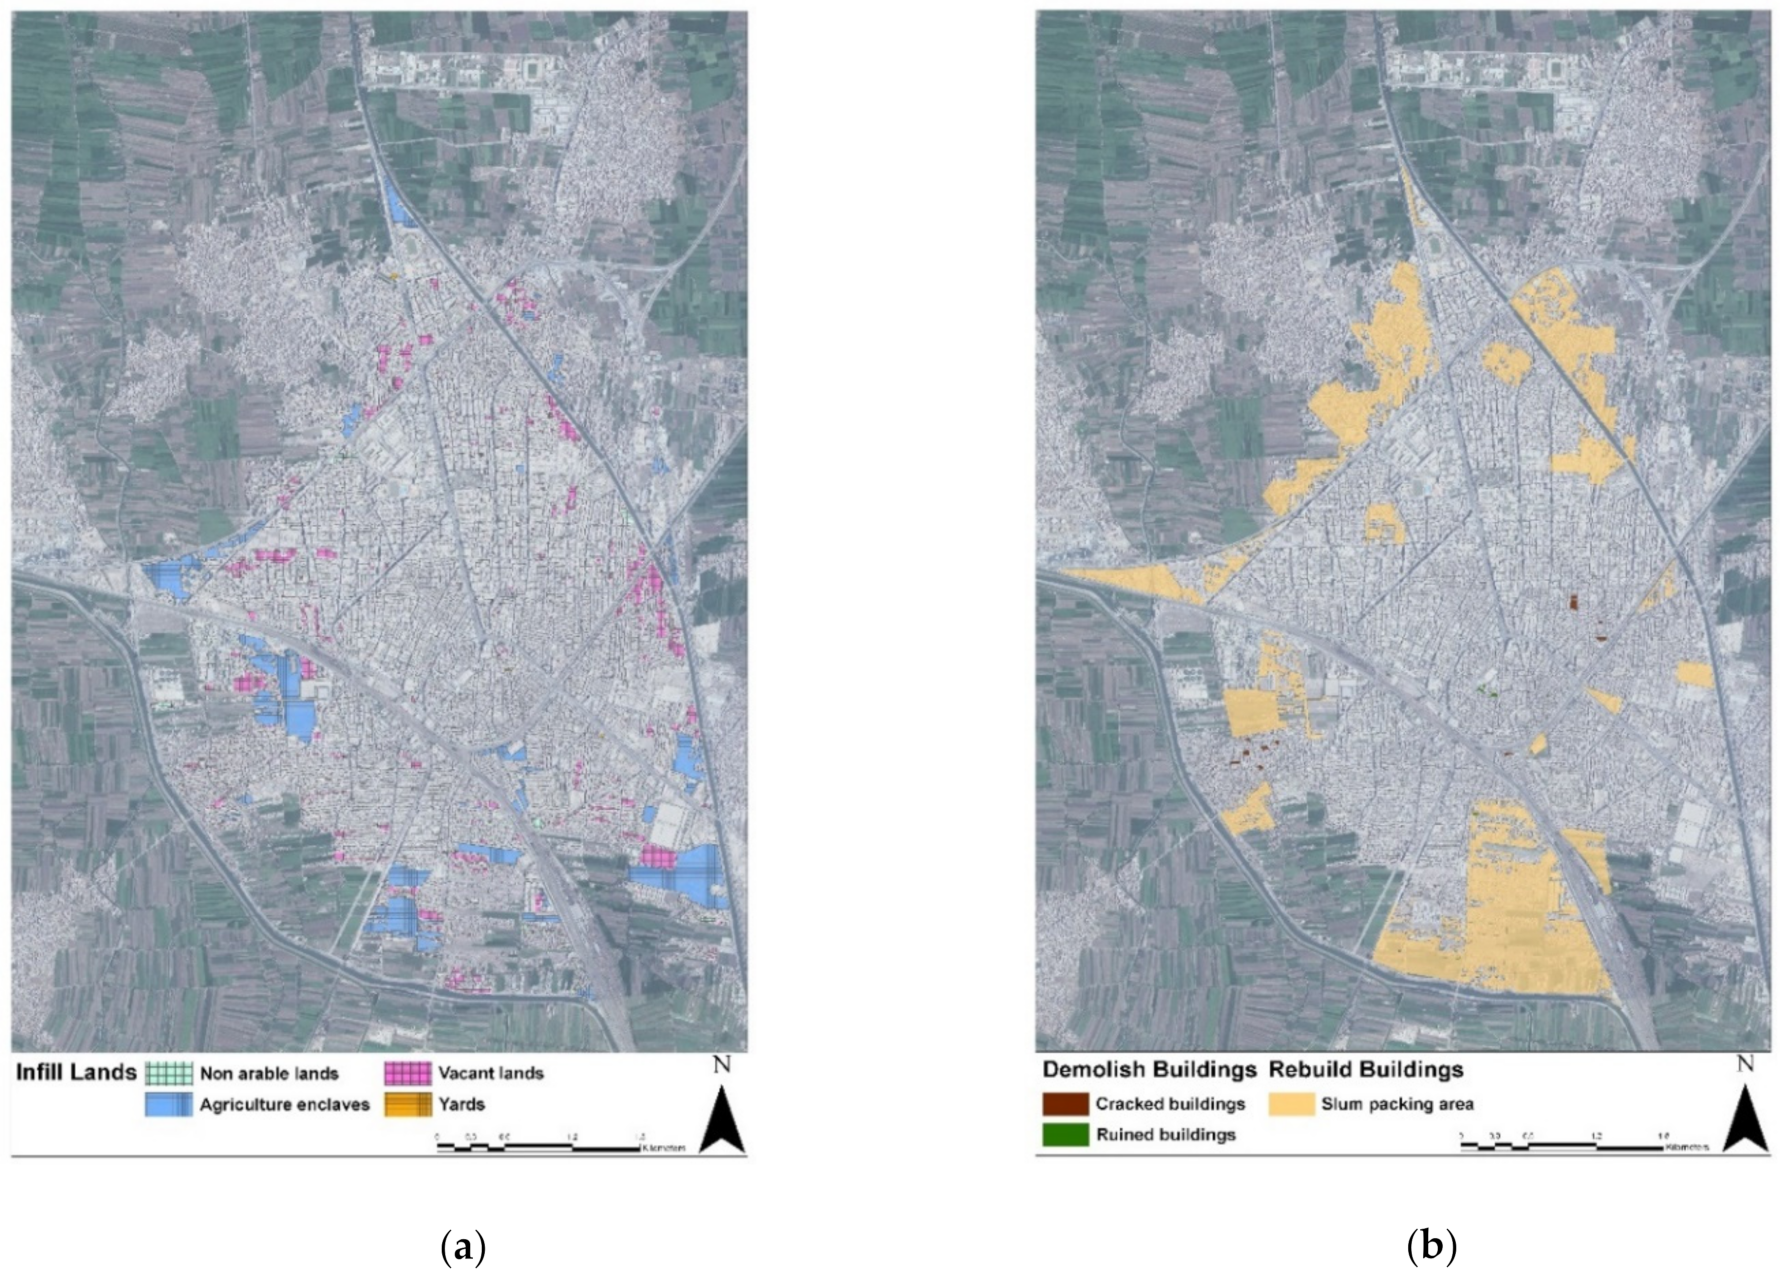
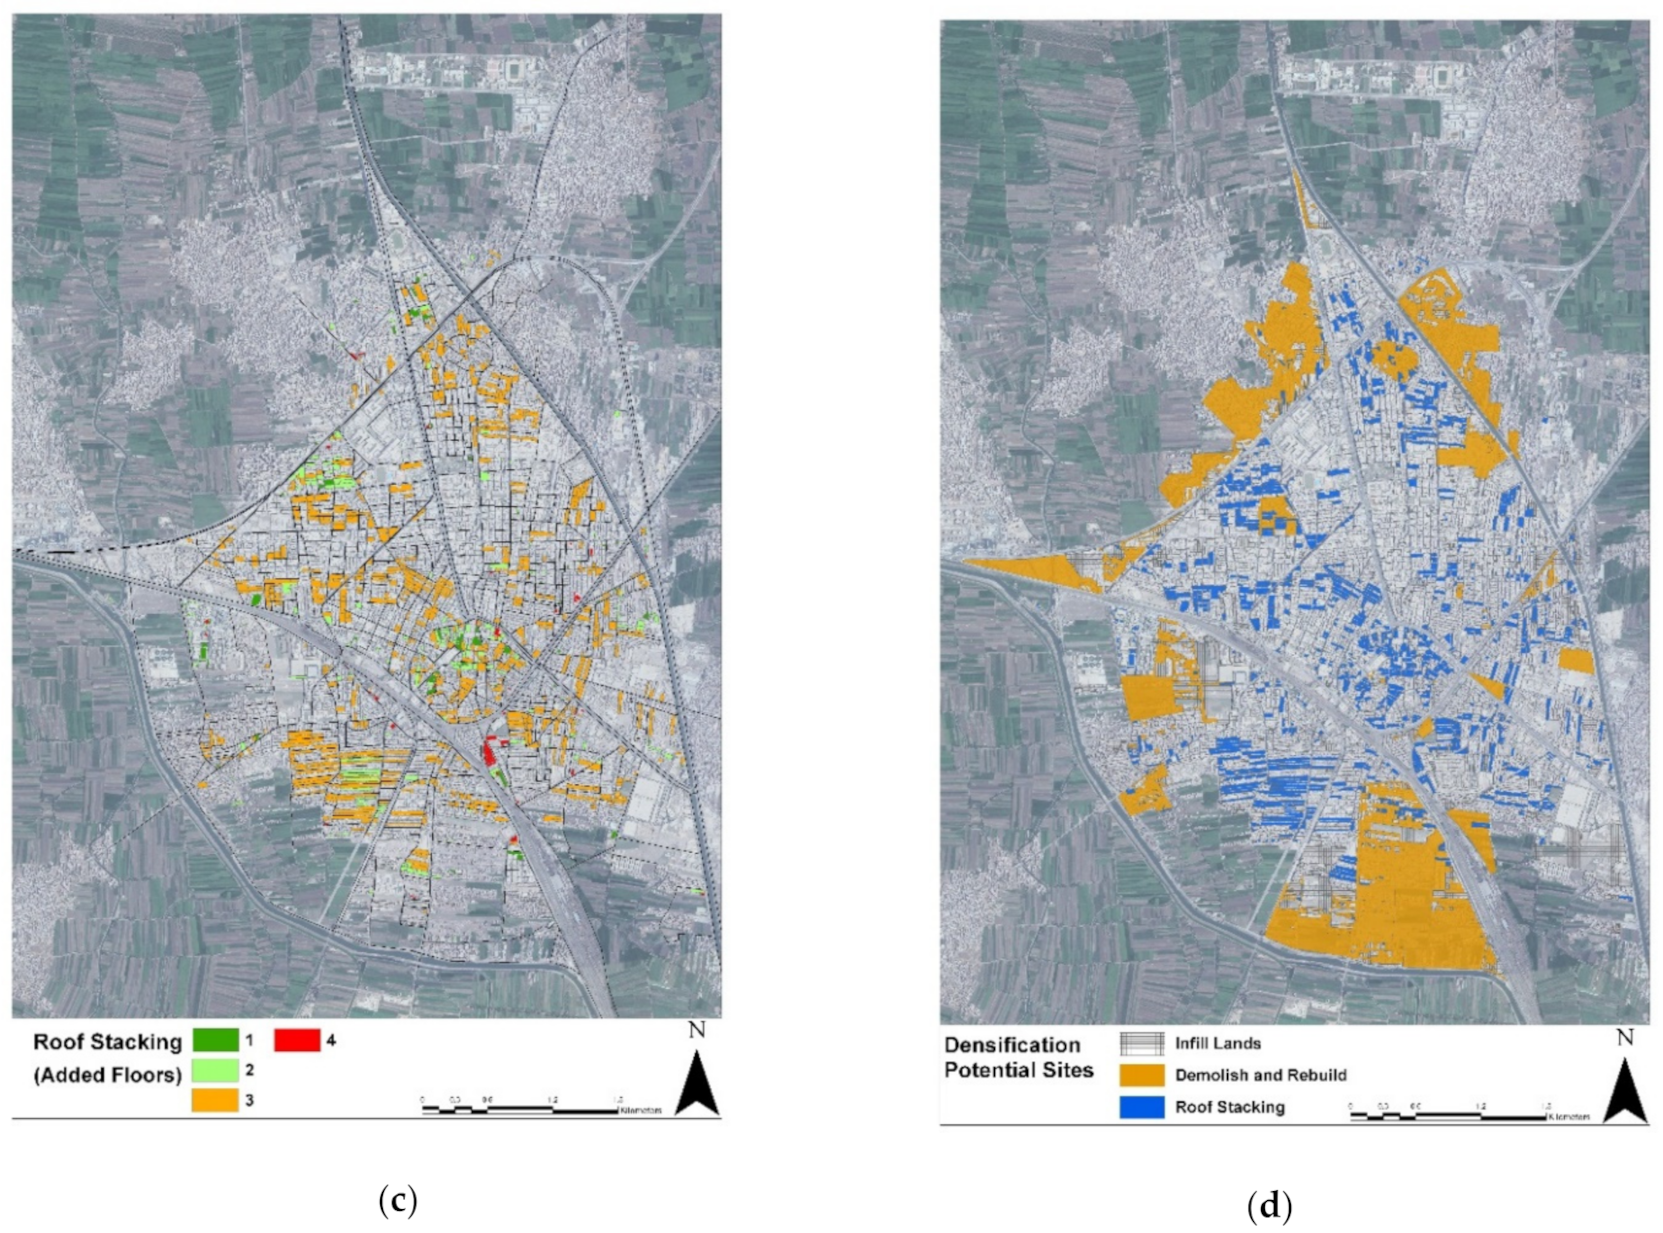
The potential densification area for each strategy was mapped (Figure 4), and the expected numbers of added units and added population (Table 4) were calculated.
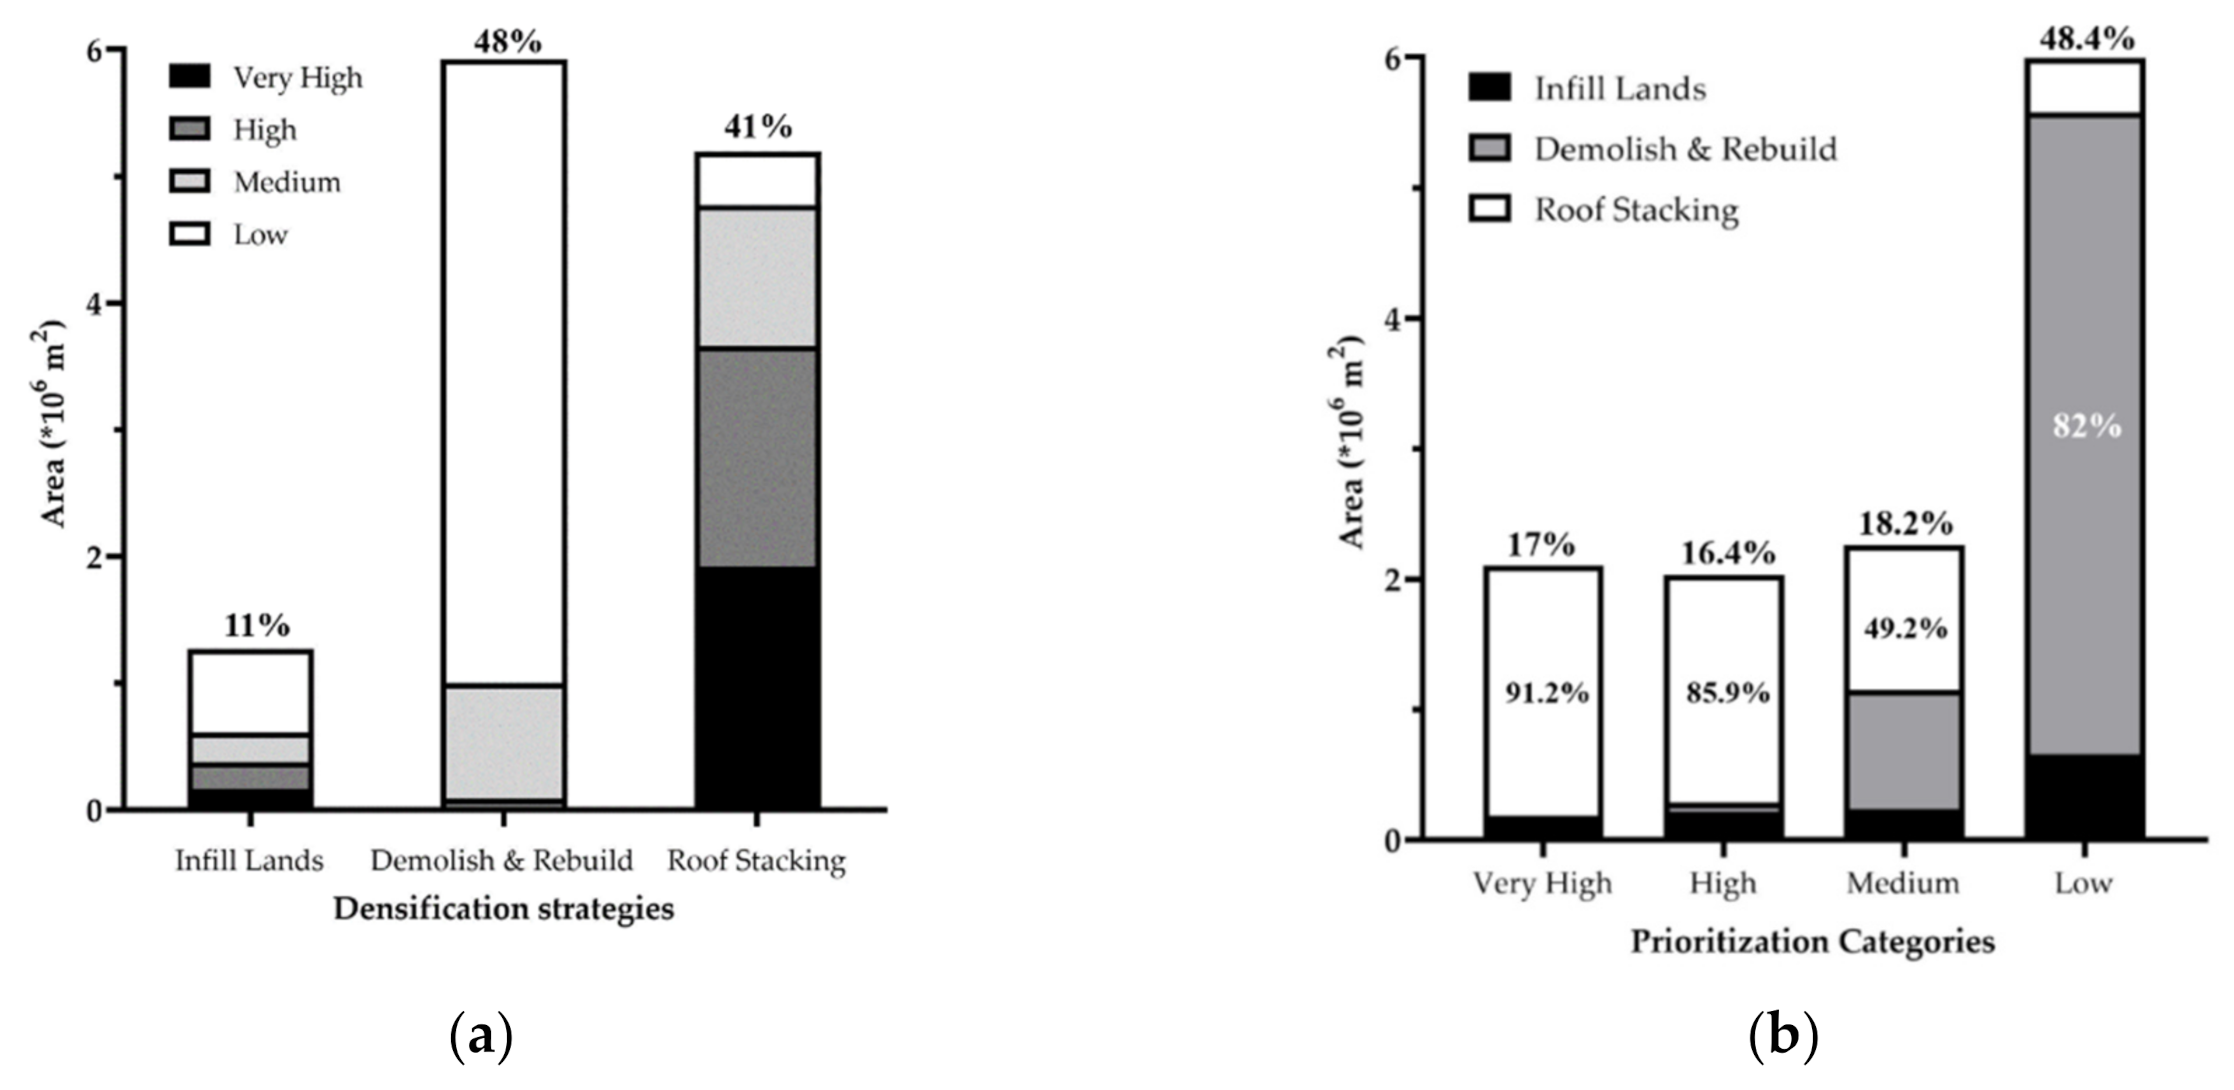
Figure 4a and Table 4 show that the total available area to use for residential buildings according to the infill strategy amounts to 1,272,273 m2, which provides 6361 units; this area can accommodate almost 23,537 inhabitants. Figure 4b and Table 4 shows that the area available for the demolition and rebuilding strategy amounts to 5,922,114 m2, which provides 29,611 units; this area can accommodate almost 109,559 inhabitants. Although this strategy provides a higher population ratio, it is considered the most expensive and difficult method to implement. Many procedures are required to replan and rebuild these areas. Figure 4c shows the areas available for the roof stacking strategy divided by the number of floors added. As presented in Table 4, the area available for this strategy amounts to 5,192,569 m2, which provides 25,963 units; this area can accommodate almost 96,062 inhabitants. The roof stacking strategy is preferred since it does not occupy additional urban spaces, maintains the actual potential for green spaces, recreational functions, or urban services, and it is easily applicable in already urbanized districts. The total expected population to be accommodated by using densification strategies is 229,159 inhabitants, representing approximately 45.3% of the city’s current population and 428% of the population’s expected population in 2027. The potential contributions of each of the urban densification strategies to population accommodation were found to be 11%, 48%, and 41% through infill, demolition and rebuilding, and roof stacking strategies, respectively (Table 4).

4.2. Prioritized Sites for Residential Densification in Tanta, Egypt

Different indicators affect the prioritization of sites for residential densification in Tanta city. As discussed in the methodology section, different indicators are spatially investigated and aggregated using the proposed index to determine each site’s priorities in densification to help decision-makers implement the densification plan.
Densification prioritization score maps for the nine indicators were calculated based on predefined ranks (Table 2) to determine the city’s priorities for future densification plans. Second, the resulting indicator weights for slope, natural and man-made risk areas, accessibility to daylight, land value, workplace accessibility, transportation accessibility, elementary school accessibility, accessibility to public green spaces, and population density obtained using AHP were found to be 2.7%, 14.9%, 12.2%, 13.4%, 13.2%, 13.1%, 17.5%, 3.8%, and 9.1%, respectively. Indicator densification prioritization maps (Figure 5a–i) and the final densification prioritization map in Tanta city (Figure 5j) were generated accordingly.
The prioritization categories of the potential densification sites (Table 5) were divided into four priority levels (very high, high, medium, and low). According to the results, the areas of very high priority represent 17% and can accommodate apartments for a population of 38,871 inhabitants. The areas with high priority represent 16.4% and can accommodate apartments for a population of 37,563 inhabitants. The areas with medium priority represent 18.2% and can accommodate apartments for a population of 41,799 inhabitants. The areas with low priority represent 48.4% and can accommodate units for a population of 110,925 inhabitants.
Table 6 shows that the roof stacking strategy contributes more than 91% of the total sites in the very high priority category, approximately 86% of the total sites in the high category, more than 49% of the total sites in the medium category, and 7% of the total sites in the low category. The infill strategy contributes 7.8%, 10.5%, 10.4%, and 11% of the total sites in the very high, high, medium, and low categories, respectively. The demolition and rebuilding strategy represents 0.9%, 3.5%, 40.4%, and 82% of the total sites in the very high, high, medium, and low categories, respectively.

5. Discussion

To control urban sprawl, urban containment strategies must be applied along with urban densification strategies. Three urban containment strategies (UGB, green belts, and USB), five urban densification strategies (filling backyards, infilling land, demolition and rebuilding, roof transformation, and roof stacking), and three urban densification phases (urban and policy configuration, building structural configuration, and architectural configuration) were identified in this study. Unlike the previous studies, which have concentrated on one urban densification strategy [8,51], this study presented a comprehensive methodology addressing all five strategies and implemented three of them (infilling land, demolition and rebuilding, and roof stacking) in Tanta city, Egypt, covering only the urban and policy configuration phase.
Current urban planning agendas encourage rational urban densification as a sustainable development approach towards increasing cities’ compactness. Accordingly, this study was developed in three phases: (1) literature review, (2) proposal of a comprehensive methodology for identifying and mapping all five strategies of urban densification and prioritizing the potential sites determined through a set of nine indicators to support decision-making, and (3) validation of the proposed methodology utilizing Tanta city, Egypt, as a case study. The case study demonstrated the applicability of the developed methodology to an actual city. Based on the existing urban regulations, the potential sites for carrying out the urban densification strategy in Tanta could provide 428% of the additional residential living space required in Tanta by 2027 due to population increases.
The greatest strategy contributing to potential sites for urban densification in Tanta was found to be demolition and rebuilding, with 48%, followed by the roof stacking strategy, with 42%, and infilling lands, with 11% (Figure 6). Densification strategy sites categorized according to the priorities, illustrating the percentage of the total area of potential densification sites represented by each strategic area, and (b) prioritization categories in percentages, with an illustration of the contribution of each densification strategy. The potential densification sites were divided into four priority levels (very high, high, medium, and low). According to the results, employing very high- and high-priority sites can provide apartments accommodating a population of only 76,434 inhabitants, which is more than sufficient to absorb the population growth in Tanta city until 2027. The roof stacking strategy contributes to more than 91% of the total sites in the very high-priority category and almost 86% of the high-priority sites. Moreover, the demolition and rebuilding strategy, which comes first in contributing to the total added units, represents 82% of the total sites in the low-priority category. This is because the sites that are acceptable for the demolition and rebuilding strategy suffer from a lack of services, infrastructure, proximity to workplaces, and green spaces. Accordingly, the roof stacking strategy is the most effective strategy from the sustainability point of view, followed by the land infilling strategy, and demolition and rebuilding come last (Figure 6). We also found that the GIS techniques and layers introduced in this paper are crucial for urban planners and decision-makers involved in city strategic planning.
The results indicate the need to revise current urban regulations from the perspective of cities’ urban densification potential. The consequences of urban densification on city inhabitants’ quality of life should be studied further. Many challenges, such as social behaviors or residents’ refusal of related projects in their neighborhoods, can impede progress in urban densification projects on a wide scale. Social action plays a key role in increasing the gap between actual demand and supply in the housing market and leads to a deficiency of the units needed by society.
However, this study presents a general perception of the potential areas for densification and their priority level for consideration in the decision-making process. Although the study considers different factors for prioritizing the potential sites and exploits all available data, further studies could improve the results.

6. Conclusions

This study is the first attempt to develop a comprehensive and unified methodology for quantifying and mapping potential sites for urban densification using all five methods. Moreover, it is the first attempt to combine land infilling, demolition and rebuilding, and roof stacking strategies to quantify and map urban densification sites in one paper, and the concept itself is applied in Egypt and the Middle East and North Africa (MENA) region for the first time. The proposed methodology used in this study is specifically outlined, and its application to the Tanta case study is reproducible. The method is parameterized and applicable in various areas at the microscale in different locations. In this study, the methodology was applied using the case study of Tanta city, Egypt. However, the total number of units that can be added through urban densification strategies in this study is not the actual number that is likely to be added in the near future. The total added units represent only the maximum potential sites resulting from the application of different urban densification strategies (land infilling, demolition and rebuilding, and roof stacking) based on our calculation assumptions. These assumptions have some limitations since they do not consider the satisfaction of the targeted society. There are also limitations to this study regarding the selection of sustainability parameters and their weighting process. Accordingly, there is a certain level of uncertainty in the resulting numbers. However, the results reveal the efficiency of implementing densification strategies to address the city’s urban expansion problems, which have led to the loss of many agricultural land areas.
Sustainability indicators need to be adapted in urban planning regulations at the micro scale to provide additional opportunities to reasonably employ the different densification strategies and consider society’s quality of life.
Generally, this methodology offers a new strategy to optimize urban densification, which can be effective in urban management to achieve city resilience. Additionally, it is useful for controlling urban growth and contributes to creating livable, sustainable communities in developing countries, e.g., Egypt. Additional applications to other urban regions would support the development of an automated tool for estimating such potentials on various scales.
In conclusion, Egyptian cities have a strong potential for urban densification using various densification strategies. However, for any urban densification strategy to be successful, the process should integrate city planning, urban and building regulations, engineering, architectural, social, and economic aspects. This paper introduced an approach to various urban densification strategies highlighting the significance of using a multidisciplinary approach at the scientific and institutional levels for implementing urban densification projects.

Author Contributions

Conceptualization, K.I.A. and H.H.; methodology, K.I.A.; software, K.I.A.; formal analysis, K.I.A. and B.E.; resources, K.I.A., H.H., and K.A.F.; data curation, K.I.A., H.H., K.A.F., and B.E.; writing—original draft preparation, K.I.A.; writing—review and editing, K.I.A., B.E., and T.O.; visualization, K.I.A., K.A.F., and B.E.; supervision, M.S.; project administration, S.A.K. and T.S.; funding acquisition, Cairo University; and partial support provided to K.I.A. by the Egyptian High Education Ministry. All authors have read and agreed to the published version of the manuscript.

Funding

This study was funded by Kyoto University, and partial support was provided to K.I.A. by the Egyptian High Education Ministry.

Institutional Review Board Statement

Not applicable.

Informed Consent Statement

Not applicable.

Acknowledgments

This work was supported by Innovative Africa: Educational Networking Programs for Human Resource Development in Africa’s SDGs, an inter-university exchange program Kyoto University received from the Japanese Ministry of Education, Culture, Sports, Science and Technology (MEXT). The authors also appreciate the General Organization of Physical Planning (GOPP), Egypt, for providing us with Tanta city urban data sets.

Conflicts of Interest

The authors declare that there is no conflict of interest.

References

  1. Brenner, N.; Schmid, C. The ‘Urban Age’ in Question: The ‘Urban Age’ in Question. Int. J. Urban. Reg. Res. 2014, 38, 731–755. [Google Scholar] [CrossRef]
  2. Broitman, D.; Koomen, E. Residential Density Change: Densification and Urban Expansion. Comput. Environ. Urban. Syst. 2015, 54, 32–46. [Google Scholar] [CrossRef]
  3. Burchell, R.W.; Shad, N.A. The Evolution of the Sprawl Debate in the United States. Hastings Environ. Law J. 1998, 5, 137. [Google Scholar]
  4. Burchfield, M.; Overman, H.G.; Puga, D.; Turner, M.A. Causes of Sprawl: A Portrait from Space. Q. J. Econ. 2006, 121, 587–633. [Google Scholar] [CrossRef]
  5. Artmann, M.; Inostroza, L.; Fan, P. Urban Sprawl, Compact Urban Development and Green Cities. How Much Do We Know, How Much Do We Agree? Ecol. Indic. 2019, 96, 3–9. [Google Scholar] [CrossRef]
  6. He, J.; Bao, C.-K.; Shu, T.-F.; Yun, X.-X.; Jiang, D.; Brown, L. Framework for Integration of Urban Planning, Strategic Environmental Assessment and Ecological Planning for Urban Sustainability within the Context of China. Environ. Impact Assess. Rev. 2011, 31, 549–560. [Google Scholar] [CrossRef]
  7. Kotharkar, R.; Bahadure, P.; Sarda, N. Measuring Compact Urban Form: A Case of Nagpur City, India. Sustainability 2014, 6, 4246–4272. [Google Scholar] [CrossRef] [Green Version]
  8. Amer, M.; Mustafa, A.; Teller, J.; Attia, S.; Reiter, S. A Methodology to Determine the Potential of Urban Densification through Roof Stacking. Sustain. Cities Soc. 2017, 35, 677–691. [Google Scholar] [CrossRef]
  9. Pendall, R.; Martin, J. Holding the Line: Urban Containment in the United States; Center on Urban and Metropolitan Policy, The Brookings Institution: Washington, DC, USA, 2002. [Google Scholar]
  10. Jehling, M.; Hecht, R.; Herold, H. Assessing Urban Containment Policies within a Suburban Context—An Approach to Enable a Regional Perspective. Land Use Policy 2018, 77, 846–858. [Google Scholar] [CrossRef]
  11. He, Q.; Tan, R.; Gao, Y.; Zhang, M.; Xie, P.; Liu, Y. Modeling Urban Growth Boundary Based on the Evaluation of the Extension Potential: A Case Study of Wuhan City in China. Habitat Int. 2018, 72, 57–65. [Google Scholar] [CrossRef]
  12. Han, A.T.; Go, M.H. Explaining the National Variation of Land Use: A Cross-National Analysis of Greenbelt Policy in Five Countries. Land Use Policy 2019, 81, 644–656. [Google Scholar] [CrossRef]
  13. Wu, Y.; Sun, X.; Sun, L.; Choguill, C.L. Optimizing the Governance Model of Urban Villages Based on Integration of Inclusiveness and Urban Service Boundary (USB): A Chinese Case Study. Cities 2020, 96, 102427. [Google Scholar] [CrossRef]
  14. Charmes, E.; Keil, R. The Politics of Post-Suburban Densification in Canada and France: DEBATES & DEVELOPMENTS. Int. J. Urban. Reg. 2015, 39, 581–602. [Google Scholar] [CrossRef]
  15. Holman, N.; Mace, A.; Paccoud, A.; Sundaresan, J. Coordinating Density; Working through Conviction, Suspicion and Pragmatism. Prog. Plan. 2015, 101, 1–38. [Google Scholar] [CrossRef] [Green Version]
  16. Schmidt-Thomé, K.; Haybatollahi, M.; Kyttä, M.; Korpi, J. The Prospects for Urban Densification: A Place-Based Study. Environ. Res. Lett. 2013, 8, 025020. [Google Scholar] [CrossRef]
  17. Boyko, C.T.; Cooper, R. Clarifying and Re-Conceptualising Density. Prog. Plan. 2011, 76, 1–61. [Google Scholar] [CrossRef]
  18. de Roo, G. Environmental Conflicts in Compact Cities: Complexity, Decisionmaking, and Policy Approaches. Environ. Plann. B Plann. Des. 2000, 27, 151–162. [Google Scholar] [CrossRef]
  19. Jenks, M.; Colin, J. Dimensions of the Sustainable City; Springer: Berlin/Heidelberg, Germany, 2010. [Google Scholar]
  20. Erick, S.F.; Marisol, R.S. Spatial Suitability for Urban Sustainable Densification in a Borderland City. J. Geogr. Reg. Plann. 2017, 10, 266–277. [Google Scholar] [CrossRef] [Green Version]
  21. Bibby, P.; Henneberry, J.; Halleux, J.-M. Under the Radar? ‘Soft’ Residential Densification in England, 2001–2011. Environ. Plan B Urban. Anal. City Sci. 2020, 47, 102–118. [Google Scholar] [CrossRef] [Green Version]
  22. Marique, A.-F.; Reiter, S. Retrofitting the Suburbs: Insulation, Density, Urban Form and Location. Environ. Manag. Sustain. Dev. 2014, 3, 138–153. [Google Scholar] [CrossRef] [Green Version]
  23. Attia, S. Overview and Recommendation on Urban Densification Potential in Liège, Belgium. In Proceedings of the High-Quality Retrofit and Redensification with Timber Construction Systems, Graz, Austria, 17–19 June 2015; pp. 62–69. [Google Scholar]
  24. Burton, E.; Jenks, M.; Williams, K. Achieving Sustainable Urban Form; Routledge: Oxfordshire, UK, 2000; ISBN 9780419244509. [Google Scholar]
  25. Burton, E.; Jenks, M.; Williams, K. The Compact City: A Sustainable Urban Form? Routledge: Oxfordshire, UK, 2003; ISBN 9780203362372. [Google Scholar]
  26. de Roo, G.; Miller, D. Compact Cities and Sustainable Urban. Development: A Critical Assessment of Policies and Plans from an International Perspective; Ashgate: Aldershot, UK; Burlington, VT, USA, 2000; ISBN 978-0-203-47862-2. [Google Scholar]
  27. Ahmad, S.; Puppim de Oliveira, J.A. Determinants of Urban Mobility in India: Lessons for Promoting Sustainable and Inclusive Urban Transportation in Developing Countries. Transp. Policy 2016, 50, 106–114. [Google Scholar] [CrossRef] [Green Version]
  28. Dembski, S.; Sykes, O.; Couch, C.; Desjardins, X.; Evers, D.; Osterhage, F.; Siedentop, S.; Zimmermann, K. Reurbanisation and Suburbia in Northwest Europe: A Comparative Perspective on Spatial Trends and Policy Approaches. Prog. Plan. 2019, 100462. [Google Scholar] [CrossRef]
  29. Pont, M.Y.B.; Mashhoodi, B.; Kasraian Moghaddam, D. Where, How and Why to Intensify the City: Applying Regression Modelling to Estimate Intensification Potentials; Department of Civil Engineering of the University of Coimbra and e-GEO, Research Center in Geography and Regional Planning of the Faculty of Social Sciences and Humanities of the Nova University of Lisbon: Lisbon, Portugal, 2011; pp. 283–288. [Google Scholar]
  30. McHarg, I.L. Design with Nature; American Museum of Natural History: New York, NY, USA, 1969; ISBN 0-385-02142-9. [Google Scholar]
  31. León Canales, J.; Vicuña del Río, M.; Gubler, A. Increasing Tsunami Risk through Intensive Urban Densification in Metropolitan Areas: A Longitudinal Analysis in Viña Del Mar, Chile. Int. J. Dis. Risk. Reduct. 2019, 41, 101312. [Google Scholar] [CrossRef]
  32. Reiter, S. Assessing Wind Comfort in Urban Planning. Environ. Plann. B 2010, 37, 857–873. [Google Scholar] [CrossRef] [Green Version]
  33. Saber, M.; Abdrabo, K.I.; Habiba, O.M.; Kantosh, S.A.; Sumi, T. Impacts of Triple Factors on Flash Flood Vulnerability in Egypt: Urban Growth, Extreme Climate, and Mismanagement. Geosciences 2020, 10, 24. [Google Scholar] [CrossRef] [Green Version]
  34. Westerink, J.; Haase, D.; Bauer, A.; Ravetz, J.; Jarrige, F.; Aalbers, C.B.E.M. Dealing with Sustainability Trade-Offs of the Compact City in Peri-Urban Planning Across European City Regions. Eur. Plan. Stud. 2013, 21, 473–497. [Google Scholar] [CrossRef]
  35. Abdrabo, K.I.; Kantoush, S.A.; Saber, M.; Sumi, T.; Habiba, O.M.; Elleithy, D.; Elboshy, B. Integrated Methodology for Urban Flood Risk Mapping at the Microscale in Ungauged Regions: A Case Study of Hurghada, Egypt. Remote Sens. 2020, 12, 3548. [Google Scholar] [CrossRef]
  36. Williams, K. The Effectiveness of the UK Planning System in Delivering Sustainable Development via Urban Intensification. Ph.D. Thesis, School of Architecture, Oxford Brookes University, Oxford, UK, 1997. [Google Scholar]
  37. Bolleter, J.; Ramalho, C.E. The Potential of Ecologically Enhanced Urban Parks to Encourage and Catalyze Densification in Greyfield Suburbs. J. Landsc. Archit. 2014, 9, 54–65. [Google Scholar] [CrossRef]
  38. Haaland, C.; van den Bosch, C.K. Challenges and Strategies for Urban Green-Space Planning in Cities Undergoing Densification: A Review. Urban. For. Urban. Green. 2015, 14, 760–771. [Google Scholar] [CrossRef]
  39. van Heezik, Y.; Adams, A.L. Vulnerability of Native and Exotic Urban Birds to Housing Densification and Changing Gardening and Landscaping Trends. Urban. Ecosyst. 2016, 19, 1551–1563. [Google Scholar] [CrossRef]
  40. Li, C.; Cheng, X.; Li, N.; Du, X.; Yu, Q.; Kan, G. A Framework for Flood Risk Analysis and Benefit Assessment of Flood Control Measures in Urban Areas. Int. J. Environ. Res. Public Health 2016, 13, 787. [Google Scholar] [CrossRef] [Green Version]
  41. Jehling, M.; Schorcht, M.; Hartmann, T. Densification in Suburban Germany: Approaching Policy and Space through Concepts of Justice. Town Plan. Rev. 1970, 91, 217–238. [Google Scholar] [CrossRef]
  42. Meijer, R.; Jonkman, A. Land-Policy Instruments for Densification: The Dutch Quest for Control. Town Plan. Rev. 1970, 91, 239–259. [Google Scholar] [CrossRef]
  43. General Organization for Physical Planning (GOPP). General Strategic Plan of 2027 for Proposed Future Urbanization Area for the City of Tanta; GOPP: Cairo, Eygpt, 2018. [Google Scholar]
  44. Jaksch, S.; Franke, A.; Österreicher, D.; Treberspurg, M. A Systematic Approach to Sustainable Urban Densification Using Prefabricated Timber-Based Attic Extension Modules. Energy Procedia 2016, 96, 638–649. [Google Scholar] [CrossRef] [Green Version]
  45. Chen, T.-H.K.; Qiu, C.; Schmitt, M.; Zhu, X.X.; Sabel, C.E.; Prishchepov, A.V. Mapping Horizontal and Vertical Urban Densification in Denmark with Landsat Time-Series from 1985 to 2018: A Semantic Segmentation Solution. Remote Sens. Environ. 2020, 251, 112096. [Google Scholar] [CrossRef]
  46. Kyttä, M.; Broberg, A.; Tzoulas, T.; Snabb, K. Towards Contextually Sensitive Urban Densification: Location-Based SoftGIS Knowledge Revealing Perceived Residential Environmental Quality. Landsc. Urban. Plan. 2013, 113, 30–46. [Google Scholar] [CrossRef]
  47. Couch, C.; Petschel-Held, G.; Leontidou, L. Urban Sprawl in Europe: Landscape, Land-Use Change and Policy; John Wiley & Sons: Hoboken, NJ, USA, 2008; ISBN 0-470-69134-4. [Google Scholar]
  48. Newman, P.; Kenworthy, J. Sustainable Urban Form: The Big Picture. Achiev. Sustain. Urban. 2000, 2000, 109–120. [Google Scholar]
  49. A.S.F. DEM 30 m. Available online: https://search.asf.alaska.edu/#/?dataset=ALOS&zoom=7.334585016709559¢er=28.682014,29.484976&polygon=POINT(29.7851%2031.1334)&resultsLoaded=true&granule=ALPSRP141900610-KMZ (accessed on 12 March 2020).
  50. Brunner, J.; Cozens, P. ‘Where Have All the Trees Gone?’Urban Consolidation and the Demise of Urban Vegetation: A Case Study from Western Australia. Plan. Pract. Res. 2013, 28, 231–255. [Google Scholar] [CrossRef]
  51. Amer, M.; Attia, S. Roof Stacking: Learned Lessons from Architects; Dencity: Zero Energy Lightweight Construction for Urban Densification; SBD Lab, Urban & Environmental Engineering Department (UEE) Faculty of Applied Sciences|Liège University (ULg): Liège, Belgium, 2017. [Google Scholar]
  52. Lee, T.J.; Glickman, S.L.; Angle, R.; Blatt, N.E.; Bradley, B.; Callahan, J.B.; Cunningham, D.; D’Amore, M.D.; Diacogiannis, J.N.; Dougherty, P.H.; et al. Steep Slopes: Guide | Model. Regulations; Pennsylvania Department of Conservation and Natural Resources: Dickinson Township, PA, USA, 2008; p. 27. [Google Scholar]
  53. Ministry of Housing. Egypt Unified Building Code Law No. 119; Ministry of Housing: Cairo, Egypt, 2008.
  54. Samad, R.B.; Morshed, K.M. GIS Based Analysis for Developing Residential Land Suitability. J. Settl. Spat. Plan. 2016, 7, 23–34. [Google Scholar]
  55. Saaty, T.L. What is the analytic hierarchy process? In Mathematical Models for Decision Support; Springer: Berlin/Heidelberg, Germany, 1988; pp. 109–121. [Google Scholar]
  56. Saaty, T.L. Fundamentals of Decision Making and Priority Theory with the Analytic Hierarchy Process; RWS Publications: Pittsburgh, PA, USA, 2000; Volume 6, ISBN 1-888603-15-1. [Google Scholar]
  57. Aroca-Jimenez, E.; Bodoque, J.M.; Garcia, J.A.; Diez-Herrero, A. Construction of an Integrated Social Vulnerability Index in Urban Areas Prone to Flash Flooding. Nat. Hazards Earth Syst. Sci. 2017, 17, 1541–1557. [Google Scholar] [CrossRef] [Green Version]
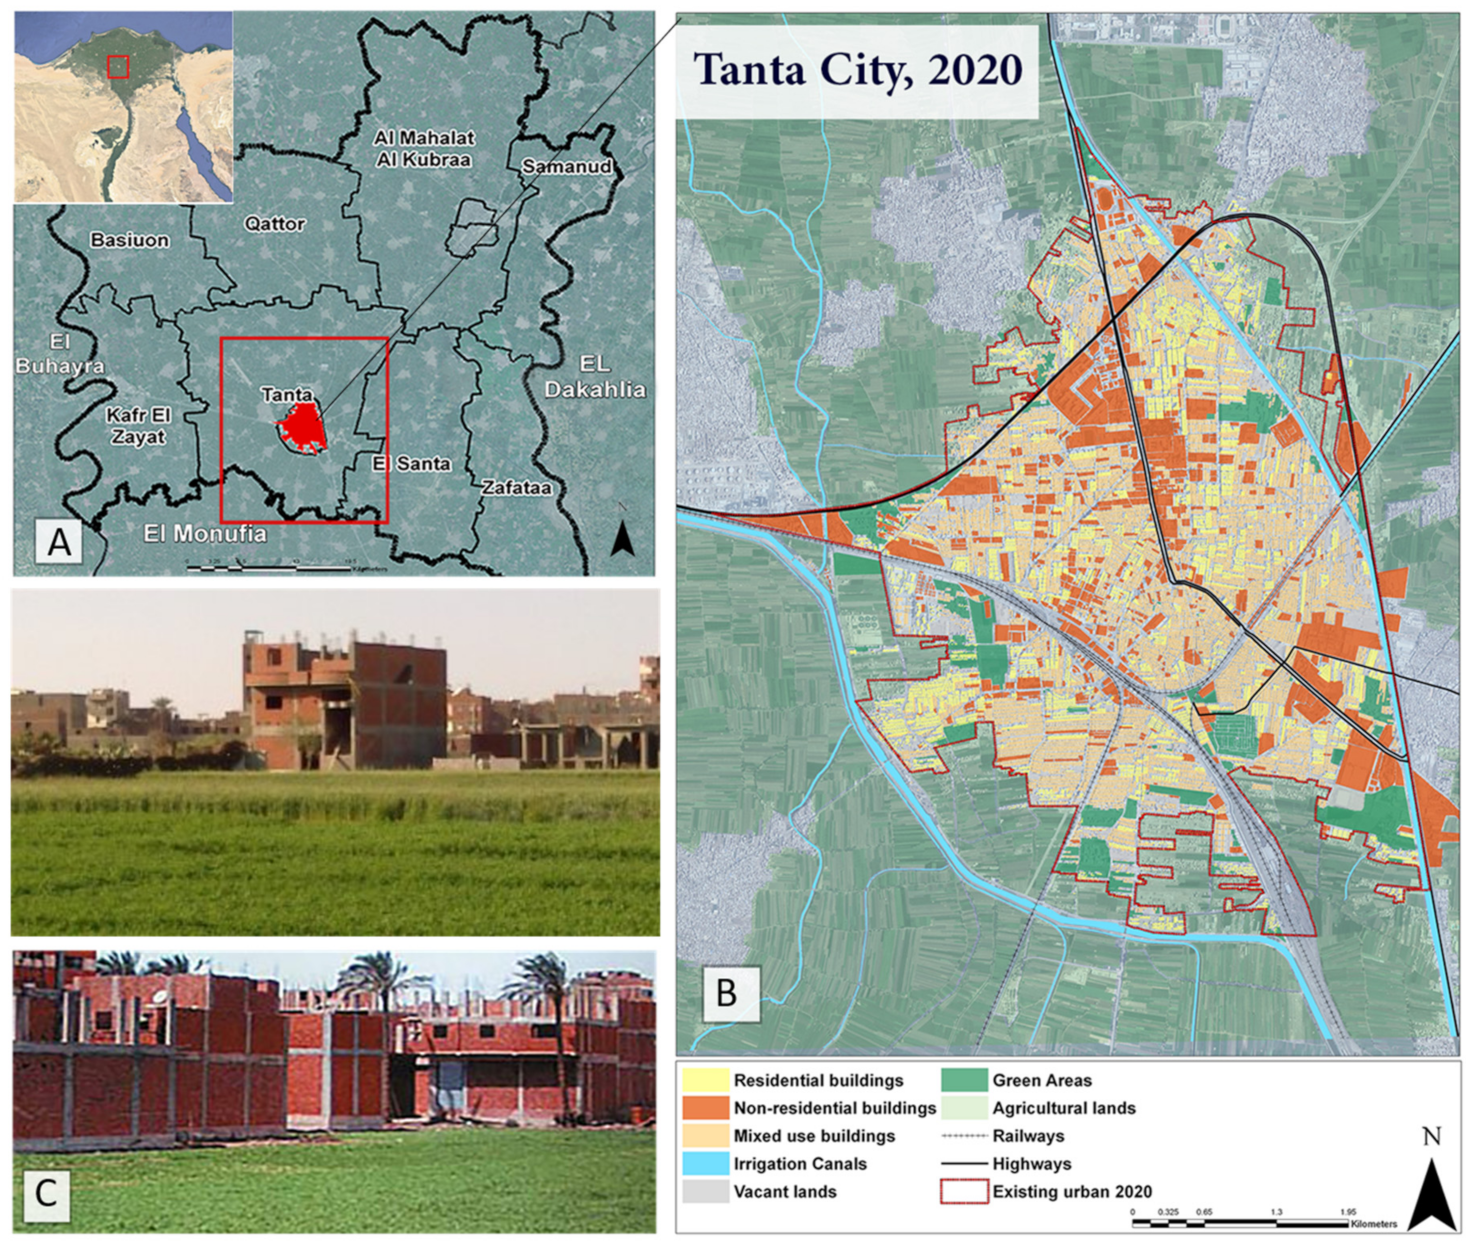
Figure 1. The study area of (A) the Nile Delta region, (B) land use in Tanta city and (C) urban sprawl in Tanta city.
Sustainability 13 05360 g001
Figure 2. (a) Population growth and (b) urban expansion in Tanta between 1976 and 2027.
Sustainability 13 05360 g002
Figure 3. Flow chart for data processing and methods, I (left) densification potential site mapping method, and II (right) potential site prioritizing mapping method.
Sustainability 13 05360 g003
Figure 4. Map of potential sites for residential densification resulting from (a) the infilling strategy, (b) the demolition and rebuilding strategy, (c) the roof stacking strategy, and (d) the final map of potential sites for residential densification for all three strategies.
Sustainability 13 05360 g004aSustainability 13 05360 g004b
Figure 5. Densification priority maps according to (a) slope, (b) natural and man-made risk areas, (c) accessibility to daylight, (d) land value, (e) workplace accessibility, (f) transportation accessibility, (g) elementary schools’ accessibility, (h) accessibility to public green spaces, and (i) population density and (j) the final densification prioritization map in Tanta city.
Sustainability 13 05360 g005aSustainability 13 05360 g005bSustainability 13 05360 g005c
Figure 6. (a) Densification strategy sites categorized according to the priorities, illustrating the percentage of the total area of potential densification sites each strategic area represents, and (b) prioritization categories in percentages, with an illustration of the contribution of each densification strategy.
Sustainability 13 05360 g006
Table 1. Material descriptions.
Data TypeDateFormatSource of DataDerived Data
ALOS-PALSAR (DEM)
(30 m spatial resolution)
2020Geotiff[49]Topographic parameters
Current urban database
of Tanta city
2018Geospatial database, JPEG, PDF[43]Sustainability indicators and related data
Table 2. Scoring criteria for densification indicators.
IndicatorsParameterPrioritizing Core CriteriaSourceWeight
Low
(Score = 1)
Moderate
(Score = 2)
High
(Score = 3)
SlopeInclination in %>104–10<4[52]2.7%
Natural and Man-Made Risk AreasDistance in meters≤5050–100>100[53]14.9%
Accessibility to DaylightBuilding height/Street width>1.51.5–2>2[53]12.2%
Land ValueCost in USD/m2≤250250–500500–1000[35,54]13.4%
Workplace AccessibilityDistance in km>2515–25<15[2]13.2%
Transportation AccessibilityDistance in meters>1000564–1000<564[8,54]13.1%
Elementary Schools’ AccessibilityDistance in meters>1000500–1000<500[54]17.5%
Accessibility to Public Green SpacesDistance in meters>1500750–1500<750[8,53]3.8%
Population Densitypersons/km2>25002000–2500<2000[35]9.1%
Table 3. Total required units in 2027 in Tanta city.
Current Population (2017) (Inhabitants)Future Population (2027) (Inhabitants)Added Population (Inhabitants)Required Units
504,855558,38353,52814,467
Table 4. Total built areas, units, and population from the utilized densification strategies.
Densification StrategyBuilt Area (m2)UnitsAdded Population (Inhabitants)%
Infill1,272,273.9636123,53711%
Demolition and Rebuilding5,922,114.729,611109,55948%
Roof Stacking5,192,569.125,96396,06241%
Total12,386,957.761,935229,159100%
Table 5. The prioritization categories of the potential densification sites.
Densification PriorityBuilt Area (m2)UnitsAdded Population (Inhabitants)%
Very High2,101,15910,50638,87117%
High2,030,45110,15237,56316.4%
Medium2,259,40411,29741,79918.2%
Low5,995,94229,979110,92548.4%
Table 6. Categories of the potential densification sites.
Densification StrategyVery HighHighMediumLow
Infilling7.8%10.5%10.4%11.0%
Demolition and Rebuilding0.9%3.5%40.4%82.0%
Roof Stacking91.2%85.9%49.2%7.0%
Publisher’s Note: MDPI stays neutral with regard to jurisdictional claims in published maps and institutional affiliations.