Article

Evaluation of Rural Dwellings’ Energy-Saving Retrofit with Adaptive Thermal Comfort Theory

1
School of Architecture, Anhui Science and Technology University, Bengbu 233100, China
2
School of Management, Anhui Science and Technology University, Bengbu 233100, China
3
School of Architecture and Art, Hefei University of Technology, Hefei 230009, China
*
Author to whom correspondence should be addressed.
Sustainability 2021, 13(10), 5350; https://doi.org/10.3390/su13105350
Submission received: 27 April 2021 / Accepted: 6 May 2021 / Published: 11 May 2021

Abstract

:
The purpose of energy-saving retrofit of rural dwellings is to obtain a more comfortable indoor thermal environment with reasonable investment. The utilization rate of heating and air conditioning equipment for dwellings in poor rural areas is very low, and the buildings operate in natural ventilation mode all year round. Since the existing research on energy-saving retrofit is aimed at air-conditioned buildings, the research methods and results are not applicable to rural dwellings. This paper proposes a set of energy-saving retrofit evaluation methods suitable for natural ventilation buildings and applies it to the research on energy-saving retrofit of rural dwellings in cold climate regions of China. The specific process is as follows: First, this paper analyzed the current situation using field research and established a typical building model. Second, the DesignBuilder software was used to simulate all 725 schemes. Subsequently, the three main retrofit measures (replacing the external insulation windows, setting the external wall insulation layer and setting the roof insulation layer) were analyzed separately, and the optimal parameters of each retrofit measure were obtained. Finally, the entropy weight method was used to perform a multi-objective optimization analysis on all retrofit plans. The results show that 6+12A+6-mm insulating glass windows + 50-mm external wall insulation + 90-mm roof insulation is the optimal energy-saving reconstruction scheme. Compared with the benchmark building, the energy-saving rate of the optimal scheme is increased by 23.81%, and the annual adaptive thermal discomfort degree-hours are decreased by 13.17%.

1. Introduction

At present, the housing problem of farmers in China has been basically solved, but the indoor living environment varies greatly between urban and rural areas. How to allow farmers to live comfortably and environmentally friendly is an important issue for the harmonious development of the society and an important task for rural development at this stage [1]. China’s rural dwellings are basically built on their own homestead, and the design drawings are decided by the owners themselves. There is no supervision and review by professional organizations, and very few buildings are carried out with energy-saving design. In poor rural areas, the utilization rate of heating and air-conditioning equipment is very low. The operating mode of buildings is mainly natural ventilation, and residents mainly address changes in the indoor thermal environment through adaptive behaviors. In order to improve the indoor thermal environment and improve the quality of life of farmers, it is imperative to renovate residential buildings for energy conservation in rural areas [2].
Related studies on the energy-saving retrofit of existing buildings have been conducted by scholars. Literature [3,4,5] studies the thermal insulation layer of the buildings’ exterior walls in different climate zones of Turkey, with the goal of saving energy and input costs and determining the optimal thickness of the thermal insulation layer for different types of exterior walls. Yang et al. [6] used the DOE-2 software to study the energy-saving retrofit of buildings in hot-summer and cold-winter regions in China and compared their feasibility. Solvang and Zhang [7] analyzed the energy-saving effect of retrofit on the external walls, doors, windows, roofs and heating systems of government office buildings. Sheina et al. [8] conducted research on the energy-saving retrofit of educational buildings in Russia and proposed evaluation standards for the energy-saving retrofit of college buildings. Domínguez et al. [9] conducted research on the energy-saving retrofit of residential buildings in the Mediterranean area and analyzed the retrofit plan of the envelope structure based on the energy-saving rate. Dominguez-Delgado et al. [10] studied the cool roof used in the retrofit of residential buildings in southern Spain and analyzed its energy savings and economic efficiency from the perspective of the full life cycle of the building. Xinhui et al. [11] analyzed the current situation of building energy saving through the investigation of rural residential buildings in Shanxi and used software to simulate and calculate 13 types of typical buildings to obtain the optimal parameters of the external walls. Zhe [12] studied residential buildings in rural areas of Jinan and analyzed their energy-saving potential by comparing 12 retrofit schemes. However, there are few working conditions analyzed in the study, and the practical guiding significance is limited. Sheng and Lin [13] conducted a study on the energy-saving transformation of the central heating system of the building and found that the optimization and transformation of the central heating pipe network could improve the overall energy-saving rate of the building. He et al. [14] studied the energy-saving effects of using different types of exterior windows in the energy-saving retrofit of high-rise residential buildings in different climate zones and proposed suitable exterior window types for them. Liu et al. [15] conducted research on the energy-saving potential of the retrofit of low-rise residential buildings and found that their energy-saving potential was huge. Ascione et al. [16] studied the energy-saving retrofit of villas on the Mediterranean coast and optimized the building envelope and equipment system with energy saving and cost optimization indicators.
The existing research mainly focuses on air-conditioned buildings, and there are few research projects carried out on naturally ventilated buildings in rural areas. The energy-saving effect of air-conditioned buildings is the result of the comprehensive effect of the thermal performance of the envelope and the efficiency of the equipment system, and the energy-saving effect of naturally ventilated buildings mainly reflects the influence of building envelope. Since the contribution rate of the envelope and equipment system in a building’s energy saving is difficult to accurately define, the existing research results are not applicable to naturally ventilated buildings. Liu et al. [17,18] proposed a method to determine the energy-saving rate of the building envelope itself by using the adaptive thermal comfort model, which is more in line with the actual situation of users. Studies have confirmed the above-mentioned energy-saving evaluation methods, which can accurately evaluate the energy-saving contribution rate of the envelope structure [19,20,21]. It is necessary to fully consider the influence of adaptability and accurately analyze the energy-saving rate of the envelope when a building using the natural ventilation mode is reformed for energy savings. Therefore, this paper adopts the above methods to analyze the energy-saving properties of buildings.
The rural buildings studied are essentially buildings using the natural ventilation operation mode. The fundamental purpose of building energy-saving retrofits is to improve the indoor thermal environment quality on the basis of energy savings and economy. The decision making takes retrofit costs, energy-saving rate and indoor thermal comfort as optimization indexes, and the relationships among these three indexes are mutually influenced and restricted, which can be regarded as a multi-objective optimization problem [22].
Some scholars have studied the multi-objective optimization of building energy-saving retrofits. Gero et al. [23] was the first to propose the multi-objective optimization analysis method for buildings’ design process; the model used the buildings’ thermal performance, costs and usable area as the optimization objectives. Juan et al. [24] developed a decision-making system based on a genetic algorithm to determine the optimal retrofit plan for a building, considering costs and quality. Kaklauskas et al. [25] took importance, priority and degree of utility of a plan as decision-making goals to make decisions on architectural retrofit plans. Flourentzou and Roulet [26] used a multi-objective analysis method to study the ventilation strategies of university buildings and made decisions with the indoor air quality, thermal comfort and energy consumption as goals. Asadi et al. [27] took cost and energy savings as the optimization goals and used the MATLAB software programming technology to make optimization decisions. Deb et al. [28] applied the artificial neural network method to HVAC (Heating, Ventilation and Air Conditioning) energy-saving prediction after building retrofit and obtained the most accurate prediction model after many iterations. Asadi et al. [29] developed a target optimization technology combining TRNSYS, GenOpt and MATLAB to optimize the retrofit costs, energy saving and thermal comfort of residential buildings. A real case study verified the effectiveness of the above method. Han et al. [30] proposed a neural network method based on affinity propagation (AP) clustering, which is conducive to making more objective building energy-saving retrofit decisions. The existing research on multi-objective optimization mainly uses mathematical algorithms, mathematical models and software programming technology to perform many iterative analyses for optimization decisions. The above methods are relatively complicated and inconvenient to operate in the actual design process.
Buildings are complex systems, the use of pure mathematical models is often not accurate enough, and a large number of building information data sets are needed in the quantitative analysis of building features [31]. The entropy weight method was first introduced into information theory by Shannon [32]. The basic idea is to determine the weight of an index according to the difference of the index and, subsequently, to evaluate the quality of the sample. It is suitable for the quantitative analysis of a large number of data sets. At present, the entropy weight method has been widely used in logistics management [33,34], electronic information [35], engineering materials [36], environmental engineering [37], safety management [38,39] and other fields. Mehdi et al. [40] used the entropy weight method to establish a prediction model to effectively evaluate the risk of food. Hongmei et al. [41] applied the entropy method to the field of electronic communication and accurately predicted the ionospheric F2 layer critical frequency by establishing a model. Mo et al. [42] used the entropy method to effectively select the optimal water supply plan in the study of agricultural water resource management. The above research has proved that, in the process of multi-objective optimization analysis, the entropy method can avoid the influence of subjective factors and make the evaluation results more objective. However, Yuxin et al. [43] and Qian et al. [44] believed that, in the data standardization process of the entropy method, too many zero values would cause errors if not corrected. In the process of data standardization in this study, each indicator has no more than one zero value, which has been modified. Therefore, the entropy method can be effectively used in this paper.
In the field of research on energy-saving retrofit of buildings, energy-saving rate and thermal comfort are the main evaluation indicators for retrofit schemes. The existing research projects on energy-saving retrofit of buildings are carried out in the heating and air-conditioning mode. The energy-saving rate is calculated according to the energy consumption saved by the equipment, and the calculation of the thermal comfort indicator does not consider people’s adaptive behaviors. The main research target of this paper is residential buildings without heating and air-conditioning equipment in poor rural areas. The thermal comfort indicator needs to fully consider the influence of people’s adaptive behaviors. Therefore, the traditional evaluation indicators are no longer applicable, and the existing research results are not applicable to the energy-saving retrofit of buildings in rural areas. The novelties and the main contributions of this paper are the introduction of a new energy-saving evaluation method based on the theory of adaptive thermal comfort and the first proposal to adopt the annual adaptive thermal discomfort degree hours as the thermal comfort evaluation indicator for carrying out research on rural residential buildings. In addition, this paper introduces the entropy weight method into the multi-objective optimization decision making of building energy-saving retrofit for the first time.
Taking building energy saving, indoor thermal comfort and retrofit costs as optimization objectives, this study evaluates all 725 retrofit schemes and makes optimization decisions. The research results can provide guidance for the energy-saving retrofit of rural dwellings in cold climate areas of China; it can also provide references for other climate areas. The set of evaluation methods for the energy-saving renovation of natural ventilation buildings proposed in this paper have wide applicability. The concrete steps recommended in practice are as follows: Determine the optional parameters of the retrofit measures; simulate all the working conditions with software; calculate the index values used in the optimization decision; and determine the optimal scheme by using the entropy weight method.

2. Methods

2.1. Modeling

The energy-saving retrofit of existing residential buildings requires a large amount of manpower and material resources, and the costs of comprehensive retrofits are relatively high. The subsequent service life of renovated buildings should not be less than 20 years [45]. Therefore, buildings with better construction quality are selected as samples during the field investigation. Northern Anhui belongs to the cold climate area. There is no central heating, and the rural economic development is backward in this area. The survey found that rural dwellings in Northern Anhui are representative of China, and that the layout still bears the marks of traditional Chinese quadrangle courtyards, such as a main entrance in the southeast corner and a screen wall at the entrance. Furthermore, the layout of a building adapts to the farming lifestyle of the North, with farming tools and storage spaces in the southern side. On the east side of a building, there is a kitchen. A two-story main building in the south of a building is the core of the building and the main living space for the residents. The kitchen and storeroom, where people spend very little time, are completely separated from the main building as auxiliary spaces. Therefore, the main building is taken as the object of energy-saving retrofit, and the auxiliary space is temporarily not considered in the study.
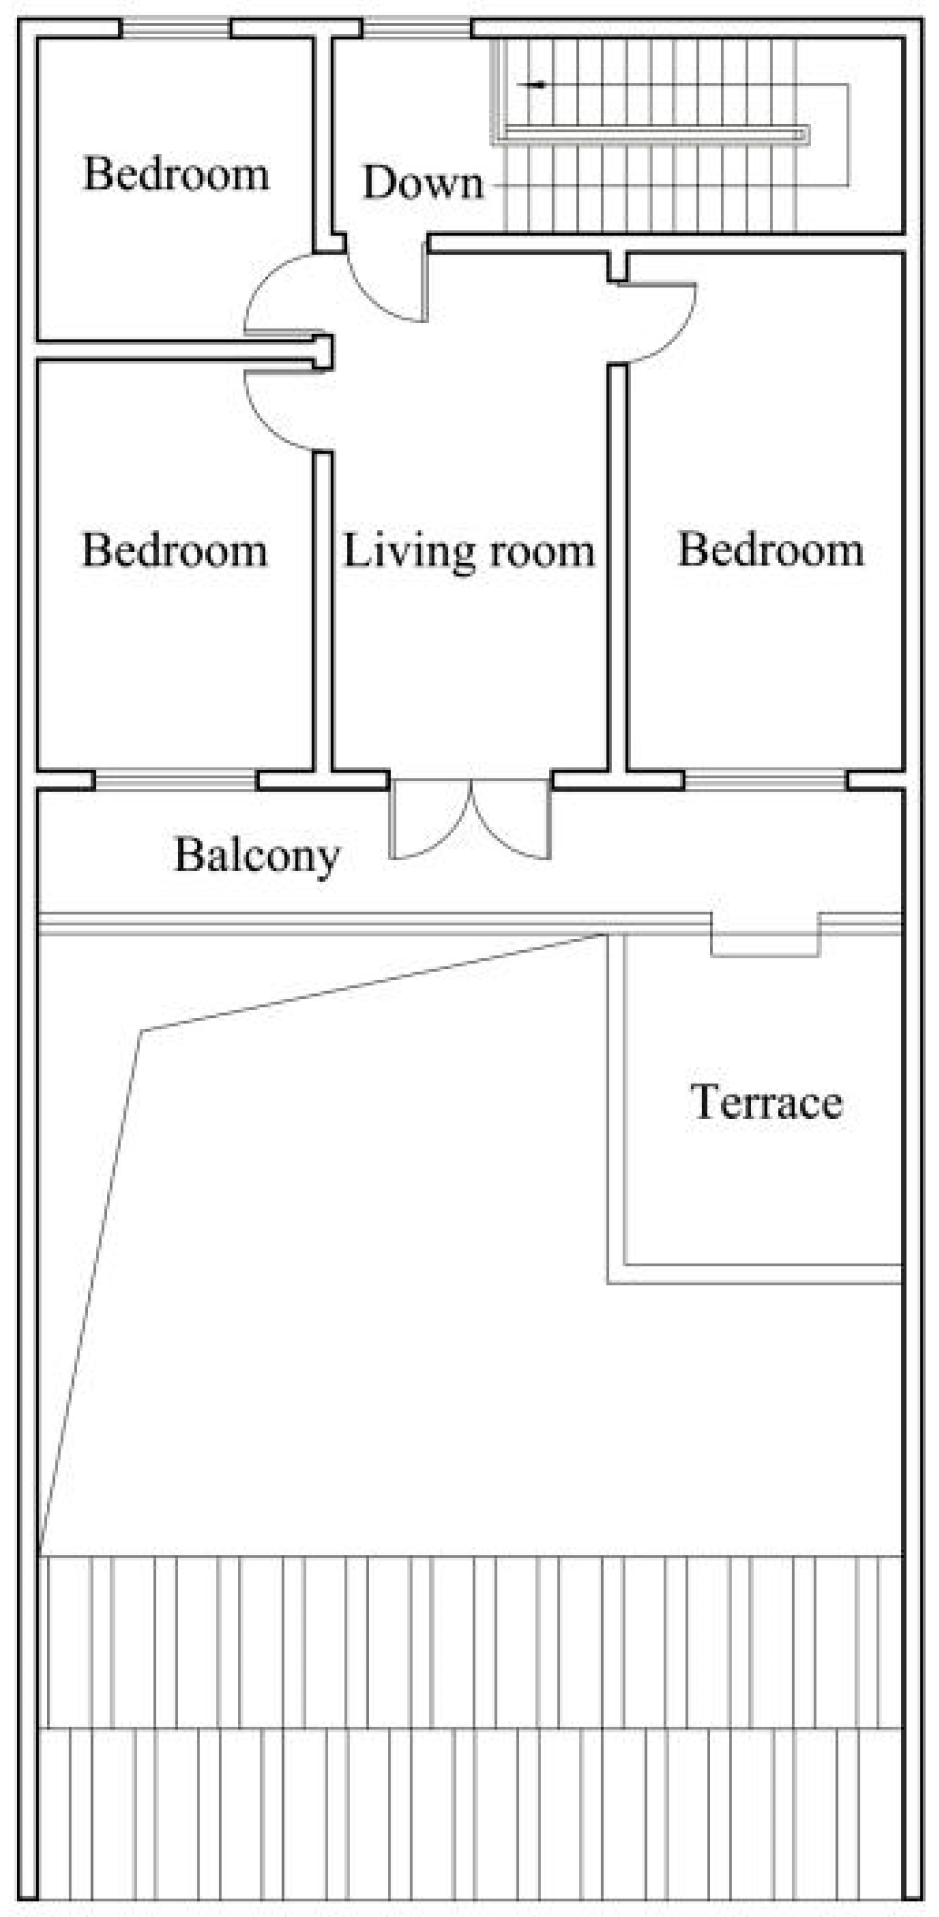
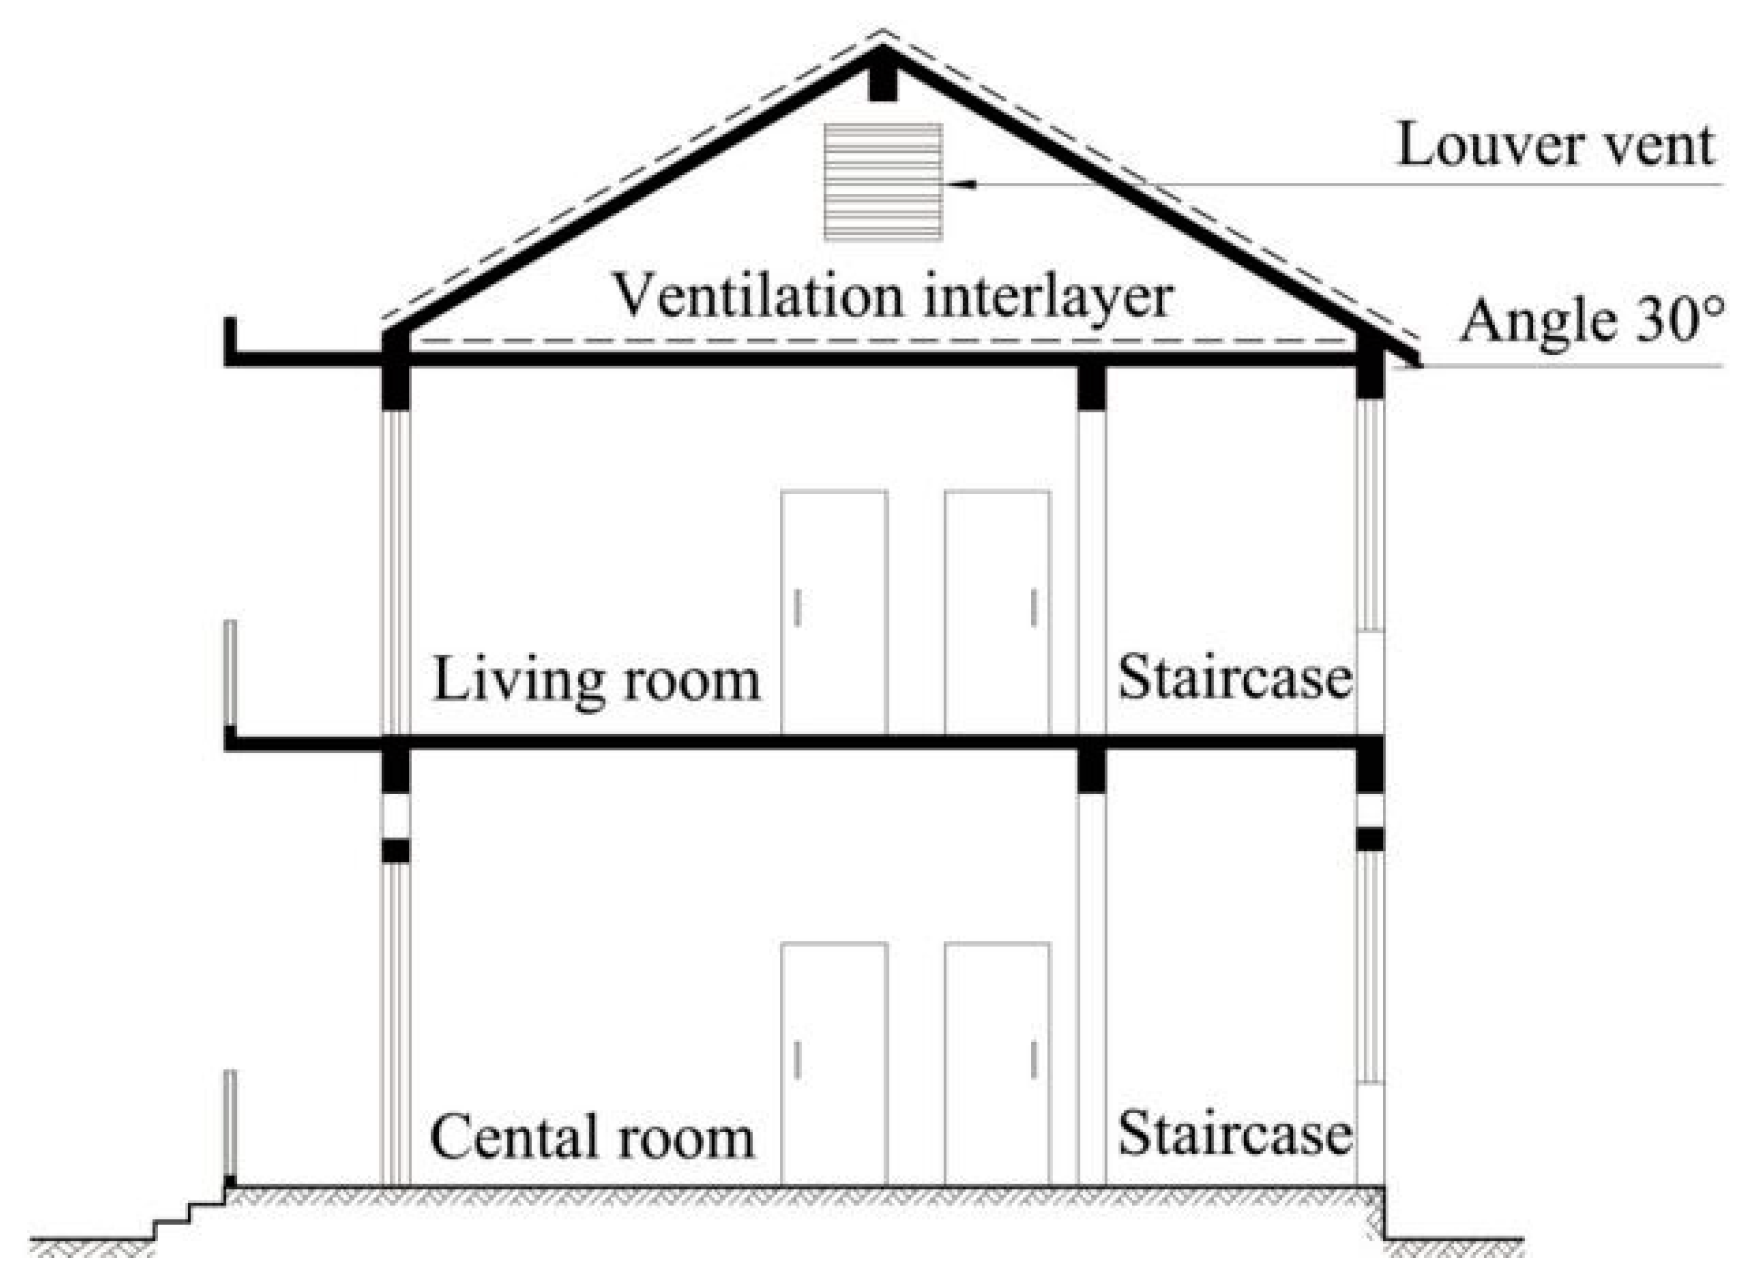
A typical building model (Figure 1) is established on the basis of the investigation, and the floor plan is shown in Figure 2 and Figure 3. The basic information of the building model is as follows: It covers an area of 213.3 m2, and the main building area is 175.2 m2. The width is 9.9 m, and the depth is 8.4 m. The building is a brick-concrete structure that is two stories high. One story is 3.9 m high, and the second story is 3.3 m high. The angle of the sloped roof is 30°, there is a ventilated air layer (Figure 4), the east and west gables are correspondingly set with louver vents, and the outer door is made of thick solid wood. In addition, the building has no additional shading components, and the outer surface is gray. The main building envelope structure materials are shown in Table 1.

2.2. Building Energy-Saving Retrofit Methods

Ninety percent of the energy loss of the building envelope comes from the external walls, windows and roofs [46]. The envelope of rural residential buildings in cold areas should use external windows with good thermal insulation performance and include external wall and roof insulation layers [47]. Therefore, this paper mainly analyzes the above three aspects in the study of the energy-saving retrofit of building envelopes. The costs of different types of external windows are calculated according to local material prices, and the specific parameters are shown in Table 2.
The retrofit method of external wall and roof is to add a certain thickness of external insulation layer [45]. In combination with the specific climate and building conditions in Northern Anhui, an inorganic thermal insulation mortar is selected as the building’s external thermal insulation material. The parameters of the inorganic thermal insulation mortar are as follows [48]: thermal conductivity of 0.07 W/(m·K) and dry density of 350 kg/m3. The maximum thickness of the external insulation layer of the external wall is set to 50 mm, and the maximum thickness of the insulation layer of the roof is set to 100 mm [49]. In the simulation calculation, the external wall insulation layer is increased at 5 mm intervals, and the roof is increased at 10 mm intervals. The retrofit costs of the exterior wall and roof insulation layer are determined according to literature [50], and the heat transfer coefficient and costs are shown in Table 3.
The DesignBuilder software was used to simulate all 725 schemes. The physical parameters of the simulation calculation are based on the local building standards [51,52,53]. The physical boundary conditions of simulation are as follows: location = Huaibei (there is no meteorological data of Huaibei, and Xuzhou meteorological data can be selected for the calculation [54]), longitude = 116.79°, latitude = 33.96°, altitude = 32.3 m, Tmin. = −12.7 °C, Tmean = 15.1 °C, Tmax. = 36.1 °C [54]; building ventilation rate = 0.5 h−1, lighting power density = 5 W/m2 and equipment power density = 3.8 W/m2; two people in the bedroom, three people in the central room, three people in the living room and one person in the other rooms; metabolic rate = 1.2 MET [55,56,57]; clothing insulation is set as 0.5 clo in summer and 1.0 clo in winter [57,58]; the occupancy rate, lighting utilization rate and equipment utilization rate are set according to the literature [58]. Other system settings are as follows: building running in “simple” natural ventilation mode, schedule = on 24/7; model infiltration = 0.5 h−1, and schedule = on 24/7 [59].

2.3. Energy-Saving Evaluation Method

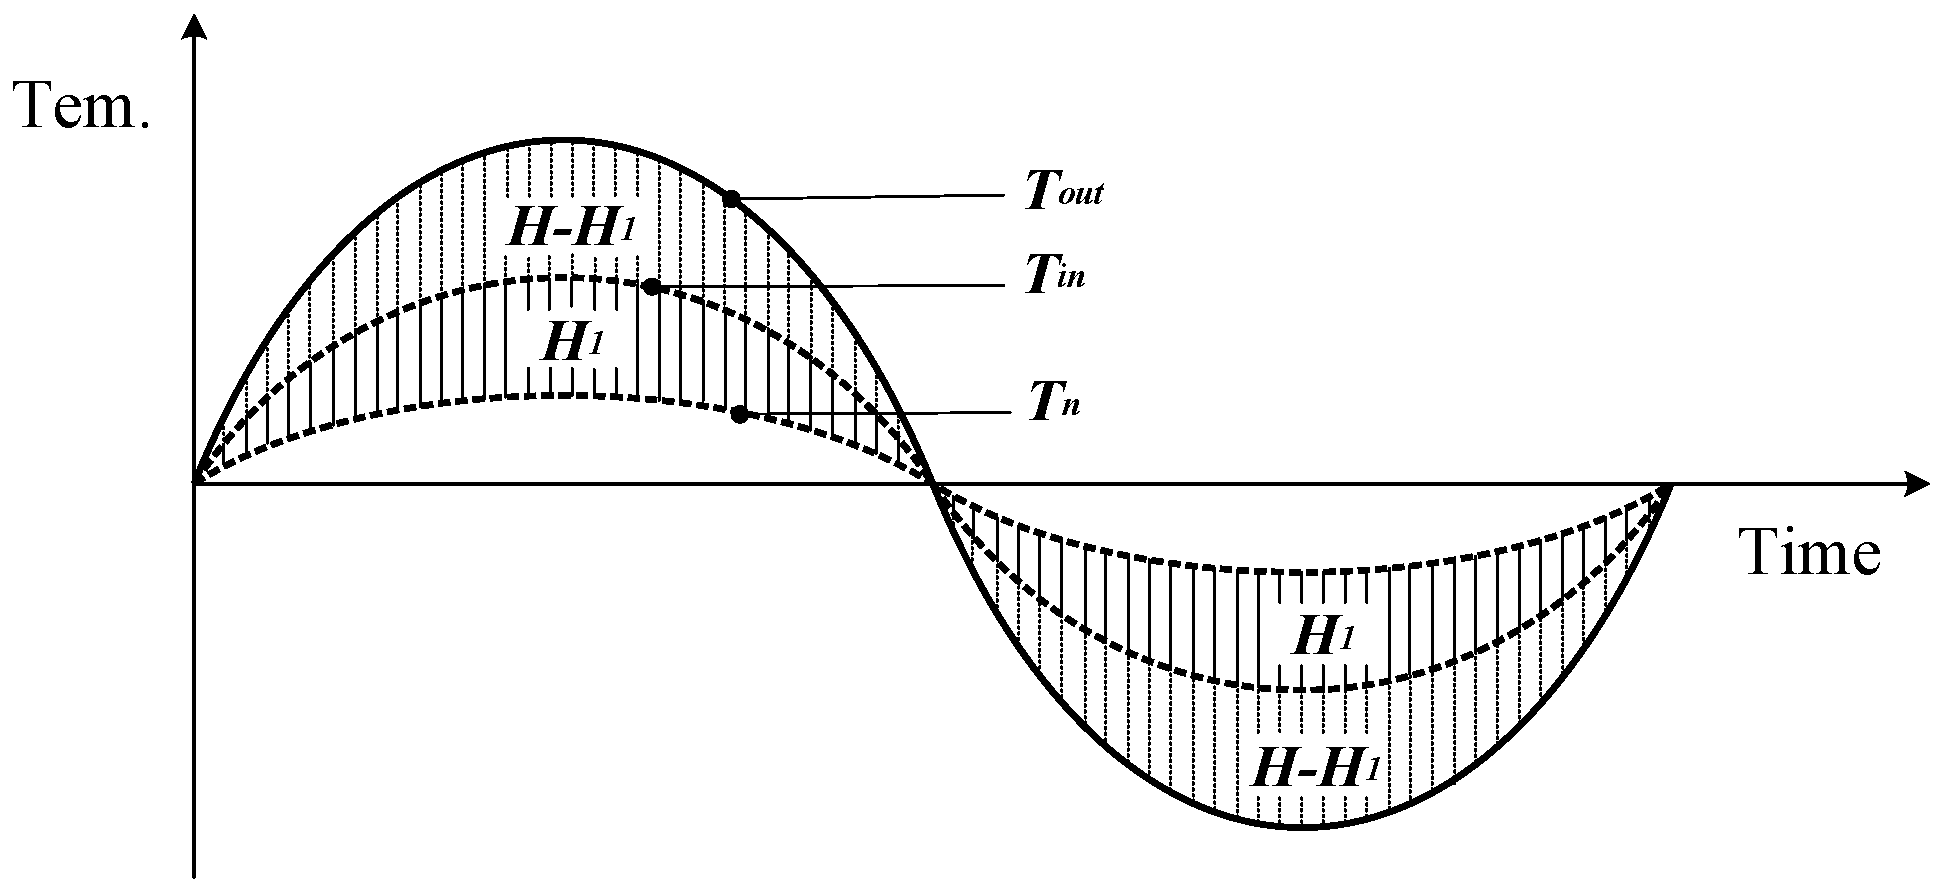
The adaptive thermal comfort model can be used to scientifically evaluate the energy-saving effect of naturally ventilated buildings [18]. The main evaluation index is the energy-saving contribution rate of envelope structure J (hereafter referred to as the “energy-saving rate”). The larger J is, the more energy saving the building will be. The calculation of index J is based on the hourly values of natural ventilation indoor temperature Tin and outdoor temperature Tout, and the annual values of Tin and Tout can be obtained through software simulation. Figure 5 shows the calculation principle of the energy-saving rate J: the area between the annual hourly outdoor temperature curve Tout and the comfortable temperature Tn curve is the reference degree-hours H; the area between the annual hourly indoor temperature curve Tin and comfortable temperature Tn is the design degree-hours H1; HH1 is the envelope structure adjustment degree-hours; ΔH, and J are the ratio of ΔH to H. The detailed calculation of the above indexes is shown in Equations (1)–(3) [60]:
H = i = 1 8760 | T o u t T n |
H 1 = i = 1 8760 | T i n T n |
J = H H 1 H
where 8760 is the number of hours in a year; Tout is the outdoor air temperature, °C; Tn is the indoor comfortable temperature, °C, which is calculated by adopting the adaptive thermal comfort model (4) for cold regions in China [61]; and Tin is the mean indoor operative temperature, °C. The calculation equation is as follows (5) [61]:
T n = 0.271 T o u t + 20.014
T i n = i = 1 N t i s i i = 1 N s i
where si is the area of each room in the building model, ti is the indoor operative temperature of each room, and N is the total number of rooms in the building model.

2.4. Thermal Comfort Evaluation Method

In a naturally ventilated building, the indoor thermal environment cannot be simply evaluated by the predicted mean vote (PMV), and the impact of the subject’s adaptive behavior on thermal comfort needs to be considered. The adaptive predicted mean vote (APMV) can reasonably evaluate the indoor thermal comfort of naturally ventilated buildings [62]. The calculation is shown in Equation (6) [63]:
A P M V = P M V / ( 1 + λ · P M V )
where λ is the adaptive coefficient, which is taken from literature [64] (when PMV ≥ 0, λ = 0.24, and when PMV < 0, λ = −0.50). PMV is the weighted average of all room areas, and the calculation is shown in Equation (7):
P M V = i = 1 N P M V i s i i = 1 N s i
where si is the area of each room in the building model, PMVi is the predicted mean vote of each room, and N is the total number of rooms in the building model.
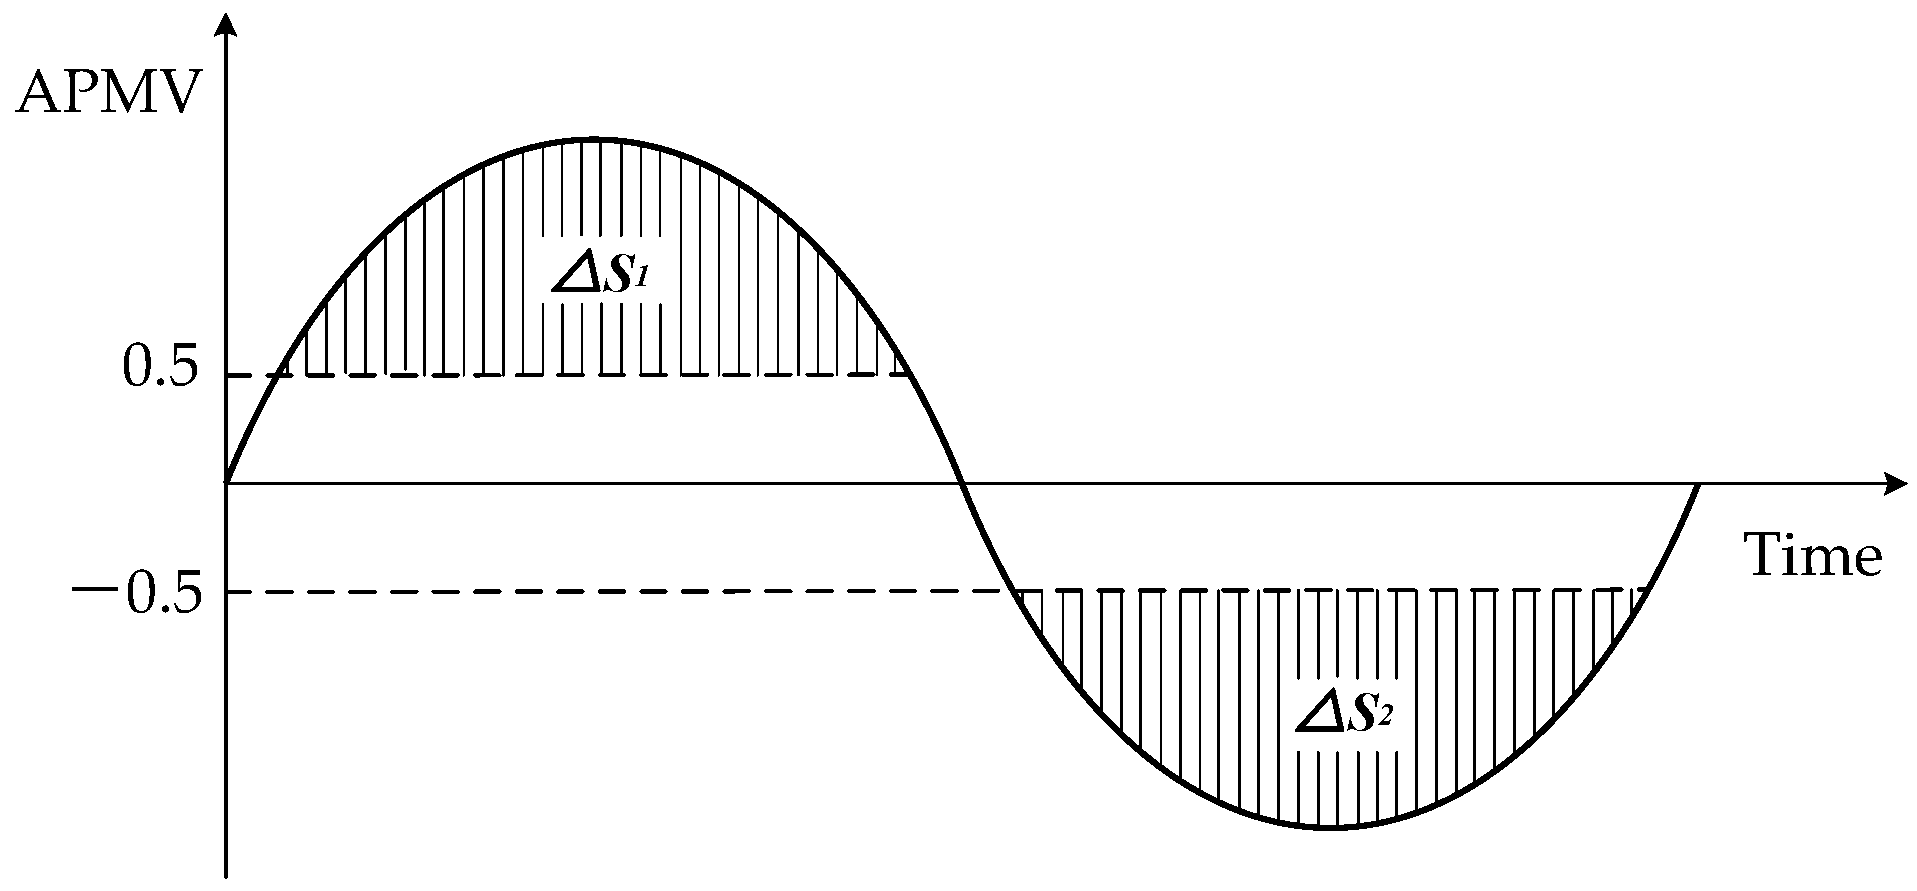
While the APMV index can be used to evaluate the indoor comfort of a naturally ventilated building at a certain moment, it is unreasonable to only use the average APMV index to evaluate the indoor thermal comfort of a year or a longer time span. Based on the evaluation method of references [65,66], the index ΔS of the indoor annual adaptive thermal discomfort degree-hours is proposed to evaluate the comfort level of naturally ventilated buildings over a long period of time. ΔS not only reflects the time of thermal discomfort, but it also reflects the degree of thermal discomfort. Figure 6 illustrates the calculation principle of ΔS: the area of the curve above 0.5 is the annual hot adaptive thermal discomfort degree-hours (ΔS1), the area below −0.5 is the annual cold adaptive thermal discomfort degree-hours (ΔS2), and ΔS1 plus ΔS2 is ΔS. See Equation (8) for a detailed calculation:
Δ S = i = 1 8760 Δ A P M V
where ΔAPMV is degree of adaptive thermal discomfort. The adaptive thermal comfort zone is APMV ∈ [−0.5, 0.5]; when the hourly APMV is outside the comfort zone, the difference is calculated. The calculation is shown in Equation (9) [64]:
Δ A P M V = { A P M V 0.5 ( A P M V > 0.5 ) 0 ( 0.5 A P M V 0.5 ) 0.5 A P M V ( A P M V < 0.5 )

2.5. Entropy Weight Decision-Making Method

Generally, the smaller the information entropy Ej of the index is, the greater the degree of variation of the index value will be, the more information it provides, the greater the role it plays in the comprehensive evaluation and the greater its weight Wj and vice versa is [32]. The smaller Ti (the proximity value) is, the better the evaluated scheme will be. The detailed calculation steps are as follows:
  • Data normalization: Assuming that the original matrix of entropy evaluation is X, X = (xij) n × k (I = 1, 2, …, n; j = 1, 2, …, k); the normalized matrix is Y, and the elements of Y are calculated in Equations (10) and (11) [67]:
    y i j = x i j min { x 1 j , , x n j } max { x 1 j , , x n j } min { x 1 j , , x n j }   ( Positive   indicators )
    y i j = max { x 1 j , , x n j } x i j max { x 1 j , , x n j } min { x 1 j , , x n j }   ( Negative   indicators )
  • Calculation of index entropy Ej [68]:
    E j = 1 ln k × i = 1 n p i j × ln p i j ;   E j [ 0 , 1 ]
    P i j = y i j i = 1 n y i j
    where, in order to make lnPij meaningful, when Pij = 0, assume that Pij × lnPij = 0. However, when Pij = 1, Pij × lnPij = 0, which is inconsistent with reality and will introduce errors to the analysis results. Therefore, Pij needs to be corrected, as shown in Equation (13) [68]:
    P i j = 1 + y i j i = 1 n ( 1 + y i j )
  • Calculation of index entropy weight Wj [31]:
    W j = 1 E j k i = 1 k E j ( j = 1 , 2 , , k ) ;   W j [ 0 , 1 ]
  • Calculation of proximity Ti: The judgment matrix A after considering the entropy weight is as follows [68]:
    A = [ a 11 a 1 k a n 1 a n k ] = [ W 1 y 11 W k y 1 k W 1 y n 1 W k y n k ]
Find the optimal value of each column in matrix A, that is, sequence R, where R = (R1, R2, ..., Rk). The proximity value of the evaluated object to the optimal sequence R is calculated in Equation (15) [31]:
T i = 1 j = 1 k a i j R j j = 1 k R j 2 ( j = 1 , 2 , , k ) ;   T i [ 0 , 1 ]

3. Results

The main measures for the energy-saving retrofit of the building envelope are to replace the external insulation windows, to set the external wall insulation layer and to set the roof insulation layer. The parameters of the three retrofit measures (see Section 2.2) can be freely combined to obtain 725 groups of working conditions. The statistics of the main indicators of all working conditions are shown in Table 4.

3.1. Energy-Saving Retrofit of External Windows

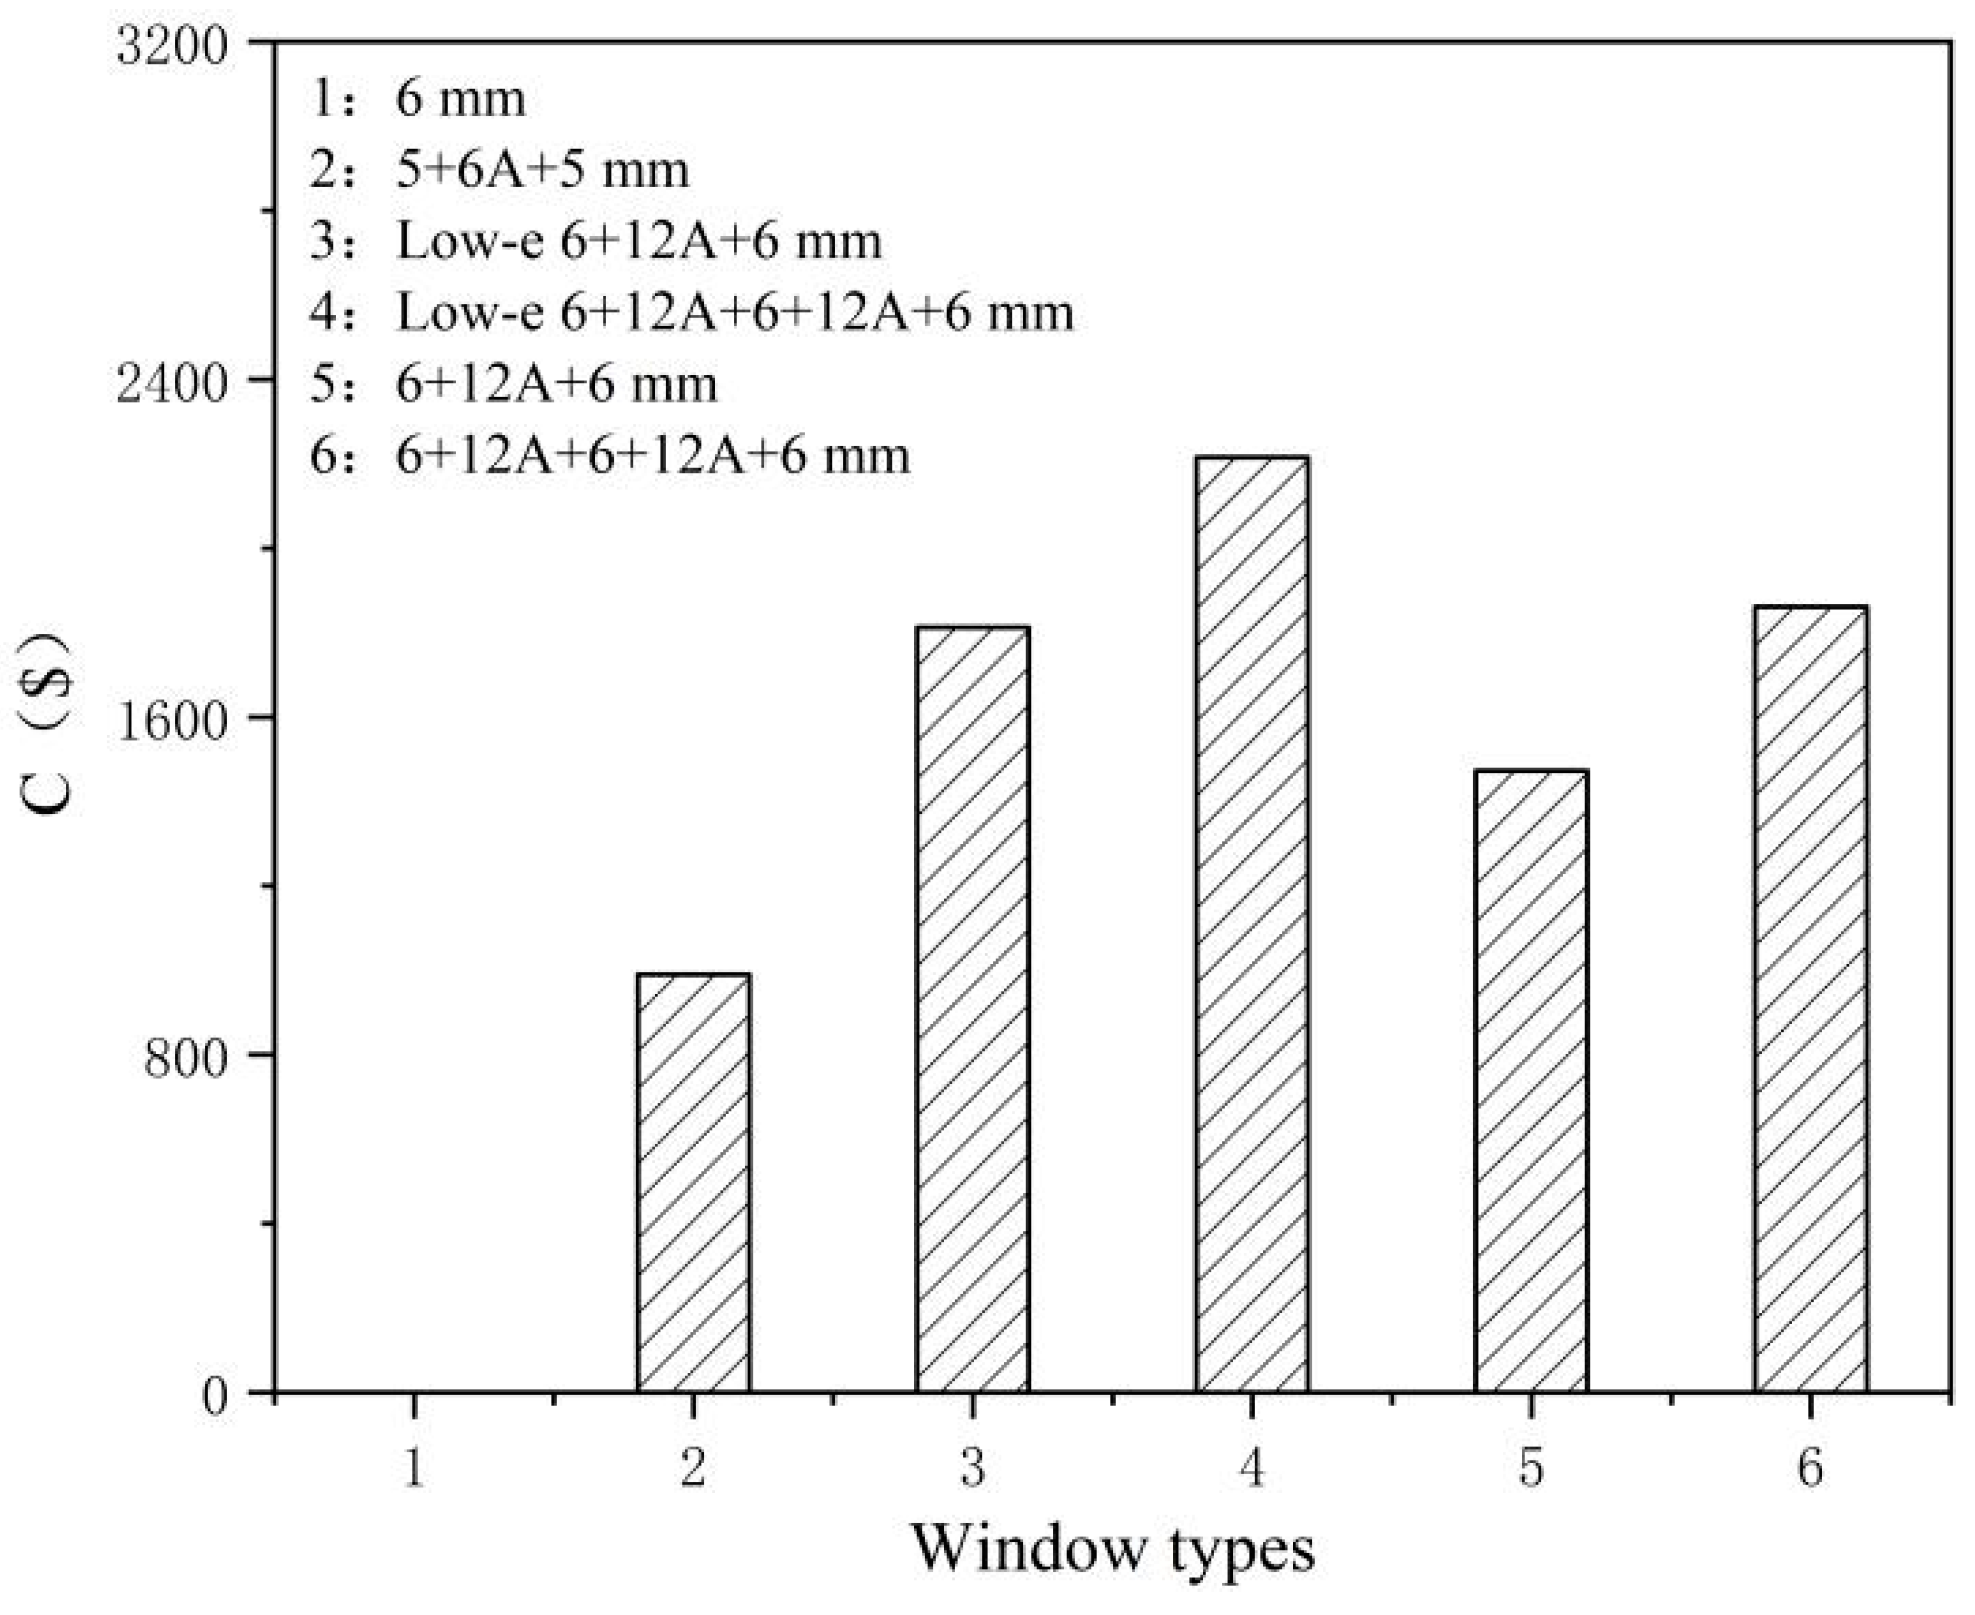
Six types of external windows can be selected in building energy-saving retrofits, and the heat transfer coefficient Uw and retrofit costs C of external windows are greatly different. As shown in Table 2, the Uw of the low-e 6+12A+6+12A+6 three-layer insulating glass window is the smallest (1.307 W/m2K), which is 77.38% lower than the heat transfer coefficient of the original external windows. The retrofit costs C of the external windows are opposite to the change in Uw. The smaller the heat transfer coefficient is, the higher the costs will be, as shown in Figure 7.
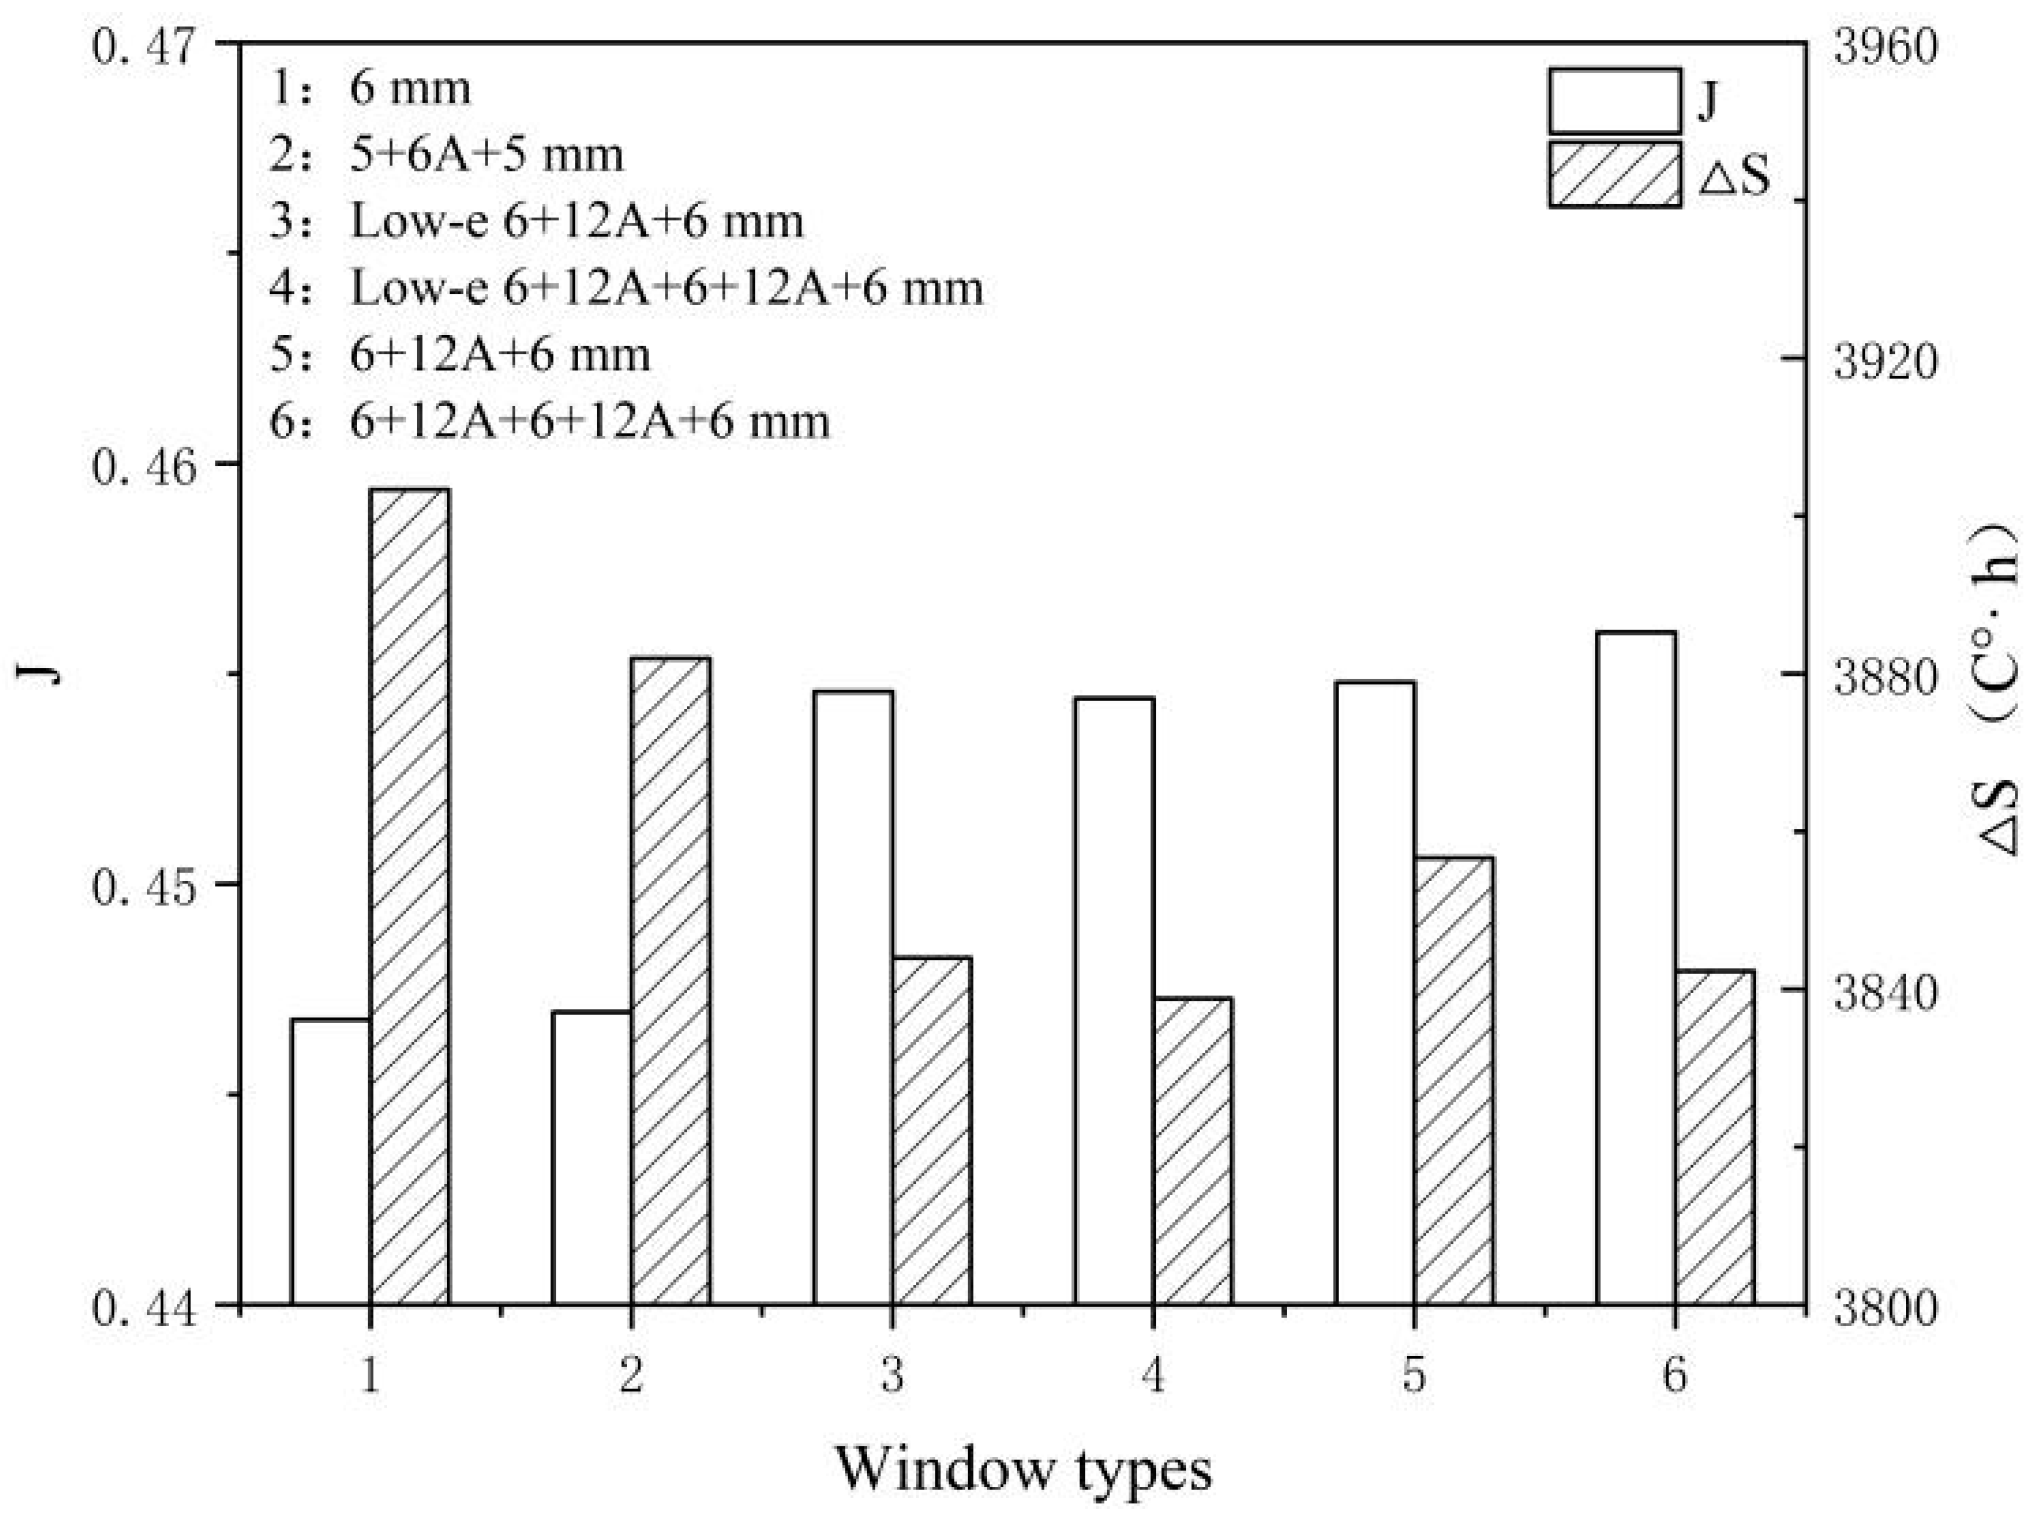
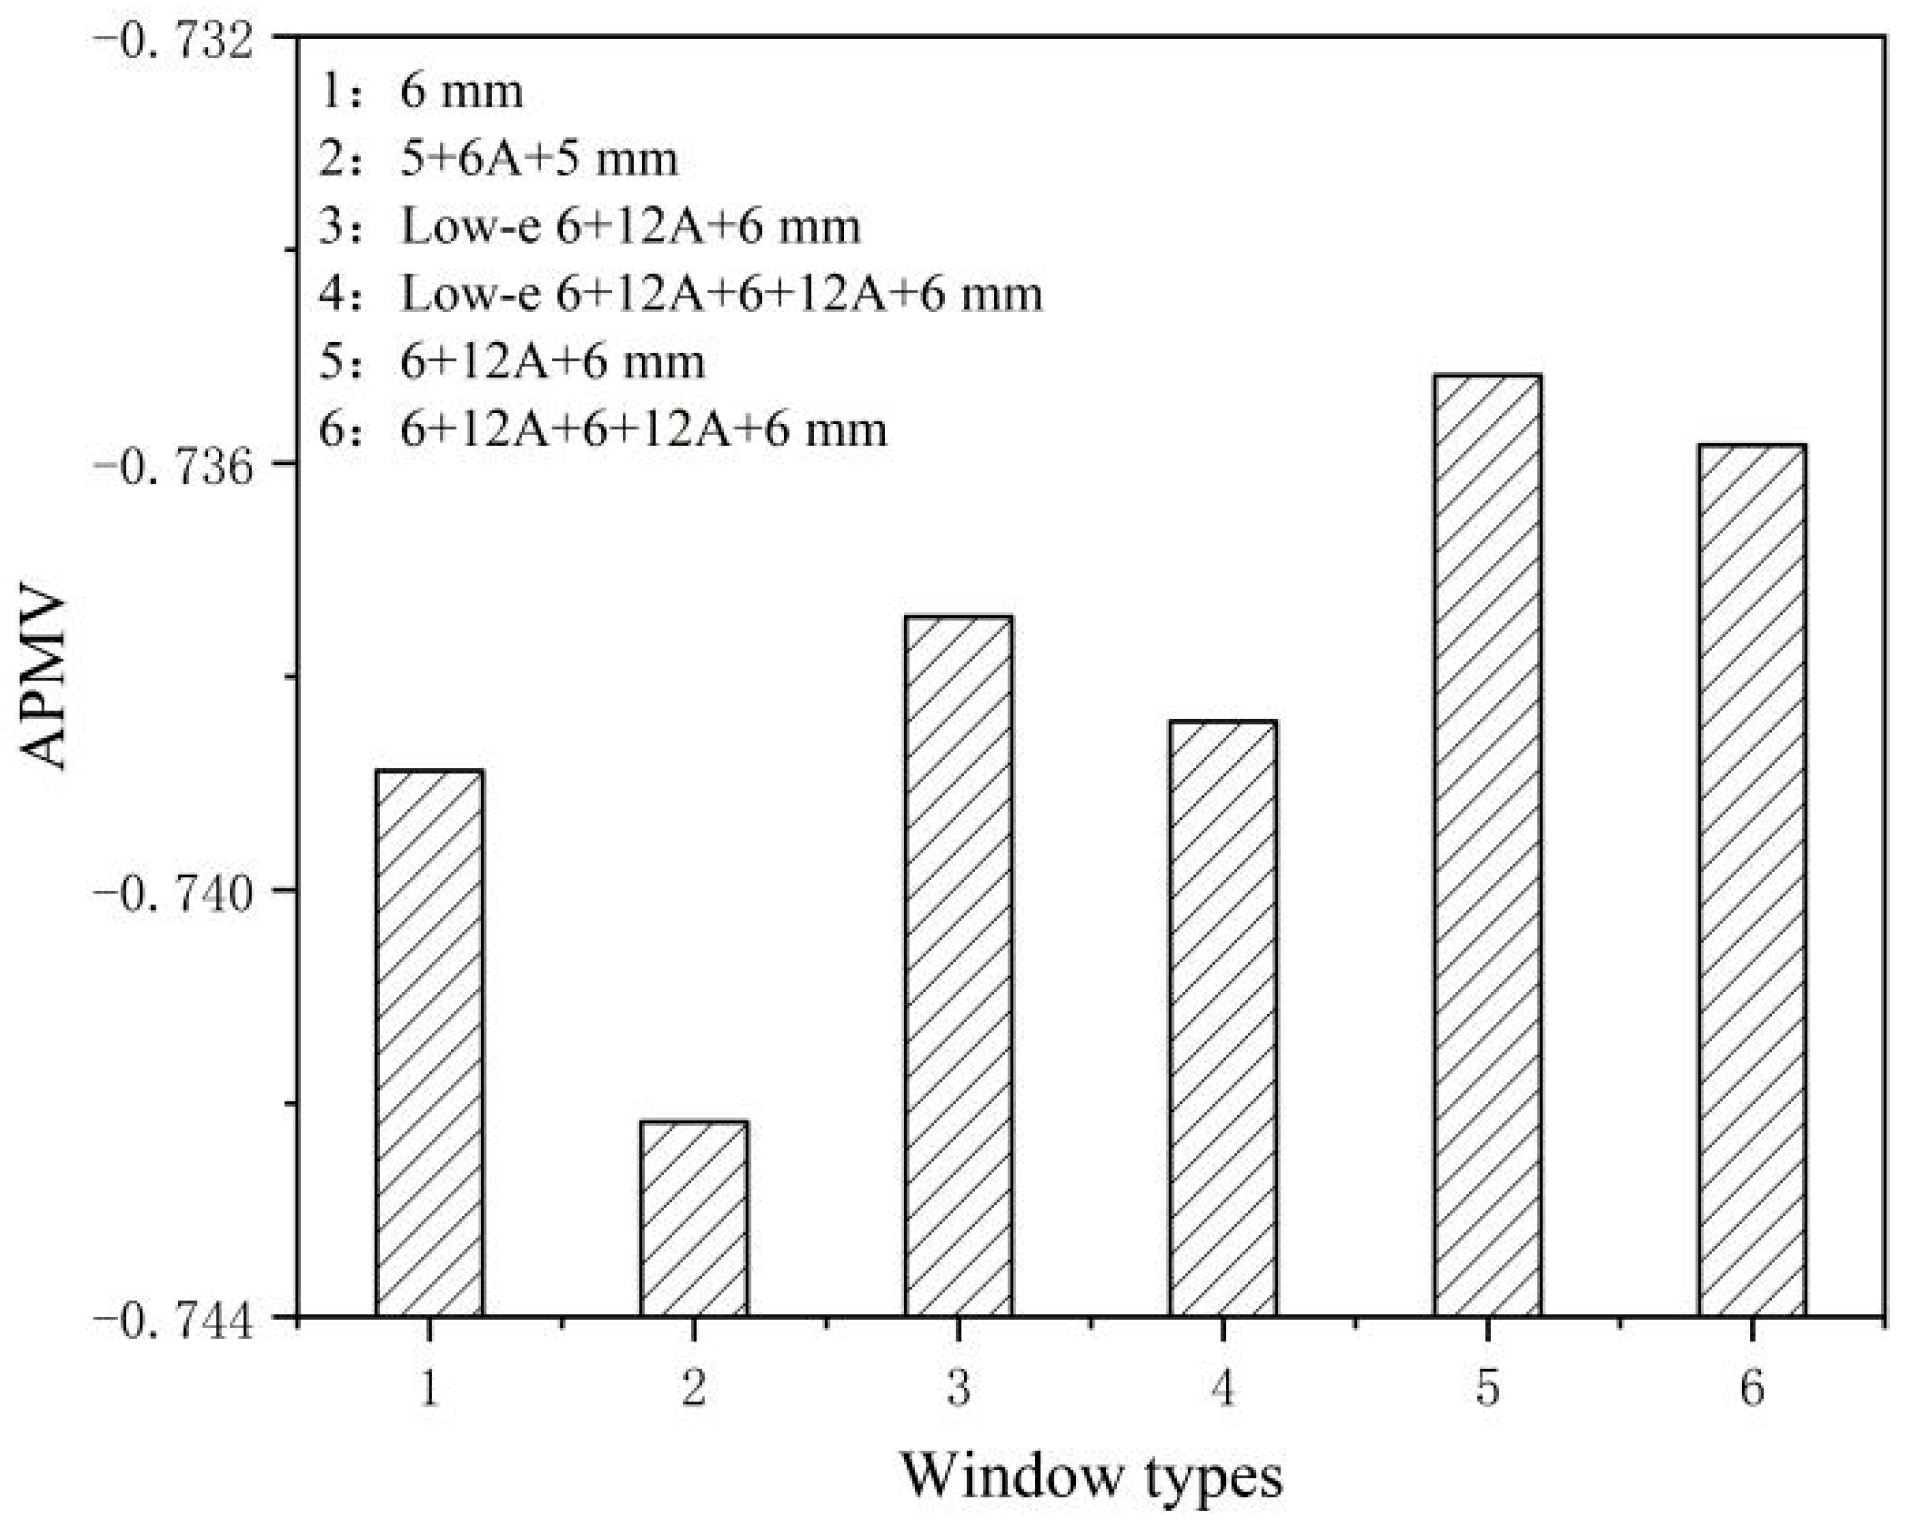
Different types of external window have different effects after energy-saving retrofits. The energy-saving rate J and adaptive thermal discomfort degree-hours ΔS of external windows retrofits are shown in Figure 8. The maximum energy-saving rate of the 6+12A+6+12A+6 three-layer insulating glass windows is 0.4560, which is 2.06% higher than that of the original building. The energy-saving rate of the 5+6A+5 double insulating glass windows is only 0.03% higher than that of the original building. The J of the other three types of external window are similar, and they increased by 1.70%, 1.74% and 1.79%, respectively. The change in adaptive thermal discomfort degree-hours is different from the energy-saving rate. The ΔS of the low-e 6+12A+6+12A+6 three-layer insulating glass windows is the smallest (3838.80 C°·h), which is 1.65% less than that of the original building. The ΔS of the 5+6A+5 double insulating glass windows is only 0.05% lower than that of the original building. The ΔS values of the other external windows are 1.20%, 1.52% and 1.56%, respectively, which are lower than that of the original building. As shown in Figure 9, the annual average APMV of buildings with different types of external window varies slightly. The APMV of the 6+12A+6 double insulating glass windows is the largest (−0.735), which is 0.50% more than that of the original external windows. The APMV of the 5+6A+5 double insulating glass windows is the smallest, which is 0.44% lower than that of the original external windows.

3.2. Energy-Saving Retrofit of the External Wall

The effect of the energy-saving retrofit of the external wall of the building is achieved by adding an external insulation layer to reduce the heat transfer coefficient. As shown in Table 3, the thickness De of the external wall insulation layer is negatively correlated with the heat transfer coefficient Ue.
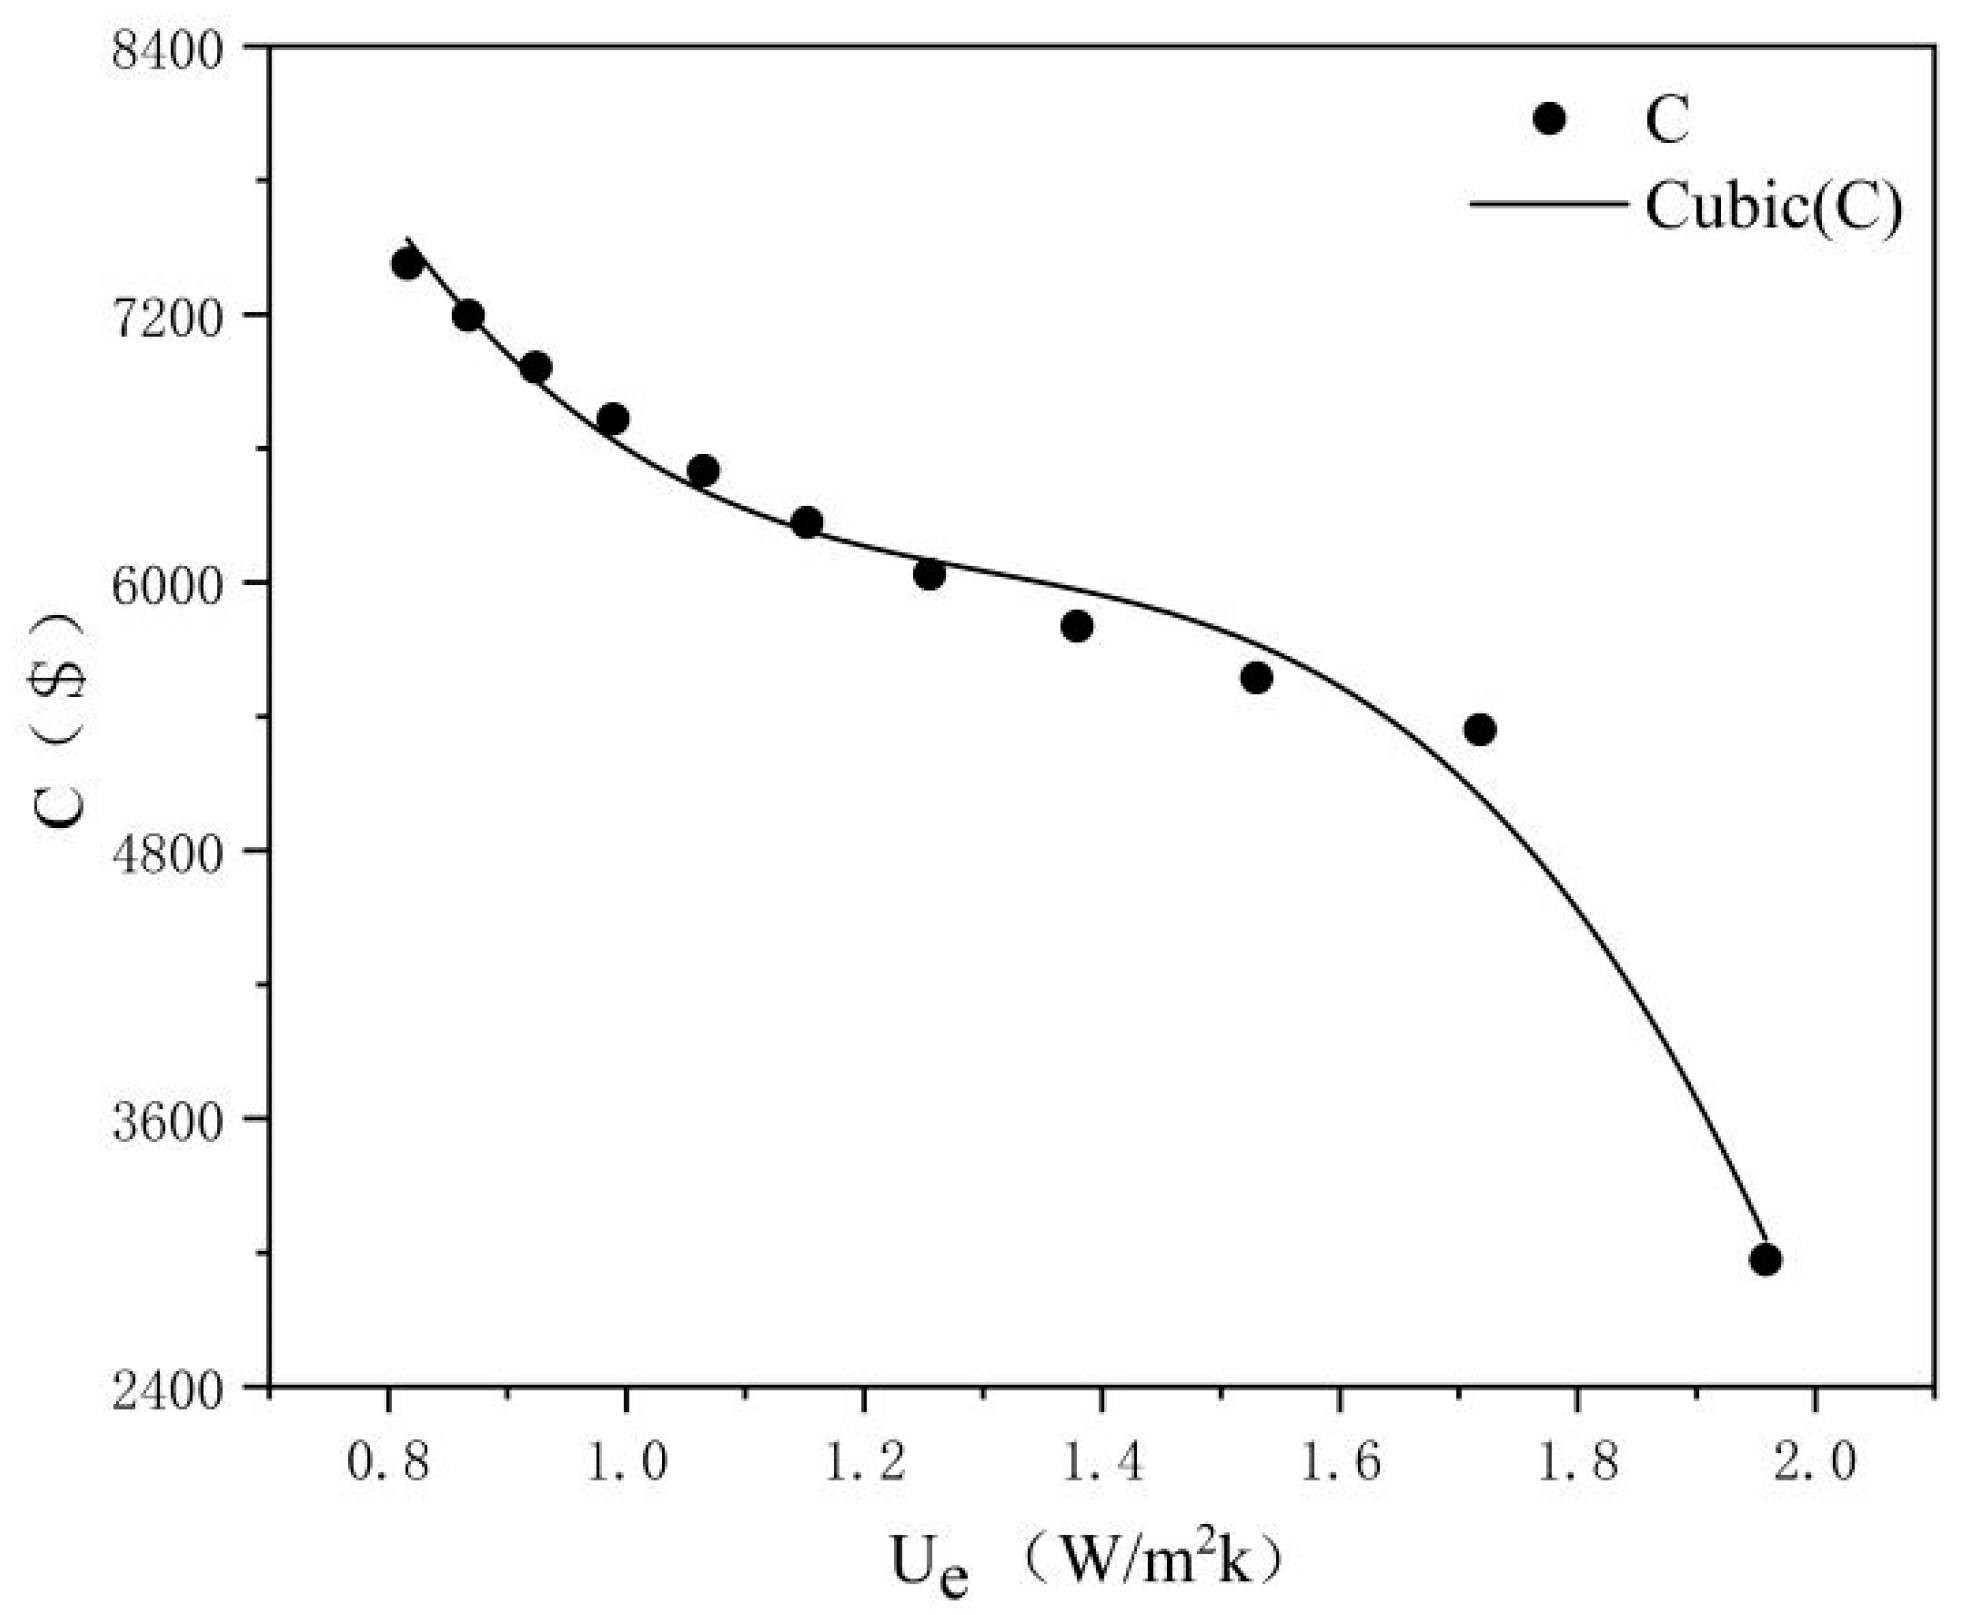
The relationship between the external wall heat transfer coefficient Ue and retrofit costs C is shown in Figure 10. The smaller the heat transfer coefficient is, the greater the retrofit costs will be. The fitting relationship between Ue and C is shown in Equation (16):
C = 2.6118 × 10 4 4.4050 × 10 4 × U e + 3.2932 × 10 4 × U e 2 8.40 × 10 4 × U e 3 ,   R 2 = 0.9824
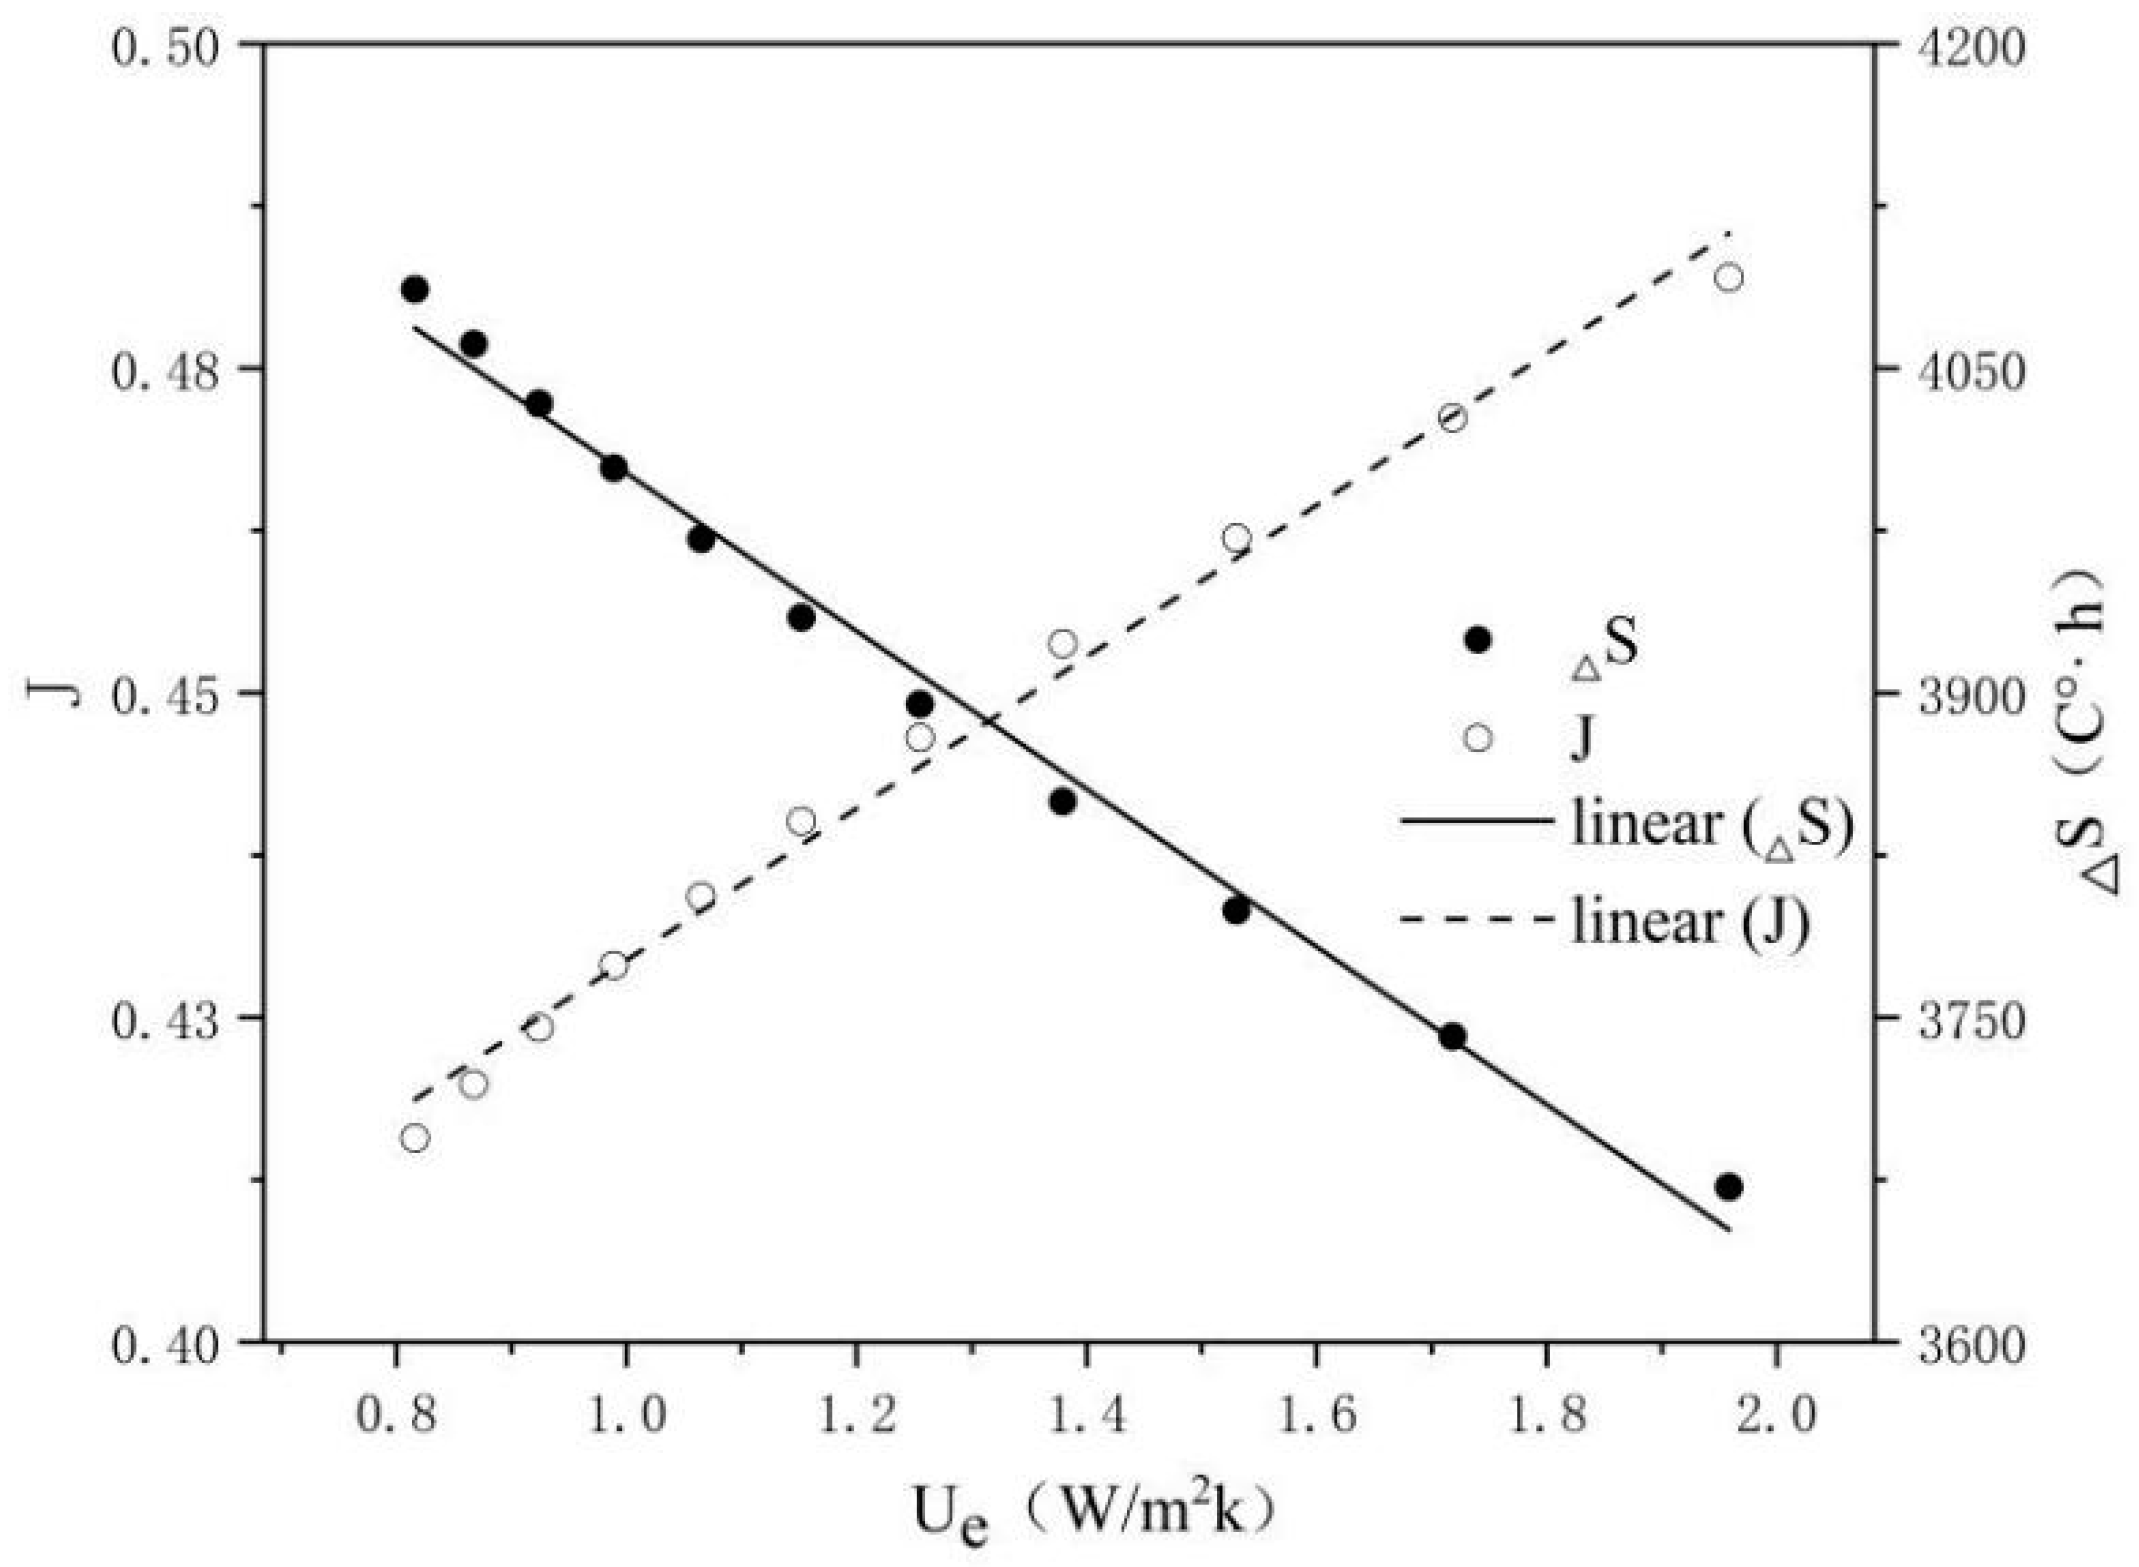
The external wall heat transfer coefficient Ue has a greater impact on building energy saving and indoor thermal comfort. As shown in Figure 11, the lower Ue is, the higher the energy-saving rate J of the building envelope will be. Equation (18) can be obtained from the fitting of Ue and J. According to Equation (17), the energy-saving rate of the envelope increases by 0.608% when the heat transfer coefficient of the external wall decreases by 0.1 W/m2K. The smaller Ue is, the smaller the adaptive thermal discomfort degree-hours ΔS, and the more comfortable the indoor thermal environment will be. From the fitting Equation (18) of Ue and ΔS, it can be found that, for every 0.1 W/m2k reduction in Ue, ΔS decreases by 35.06 C°·h:
J = 0.5277 0.0608 × U e ,   R 2 = 0.9911
Δ S = 3426.0632 + 350.5542 × U e ,   R 2 = 0.9903
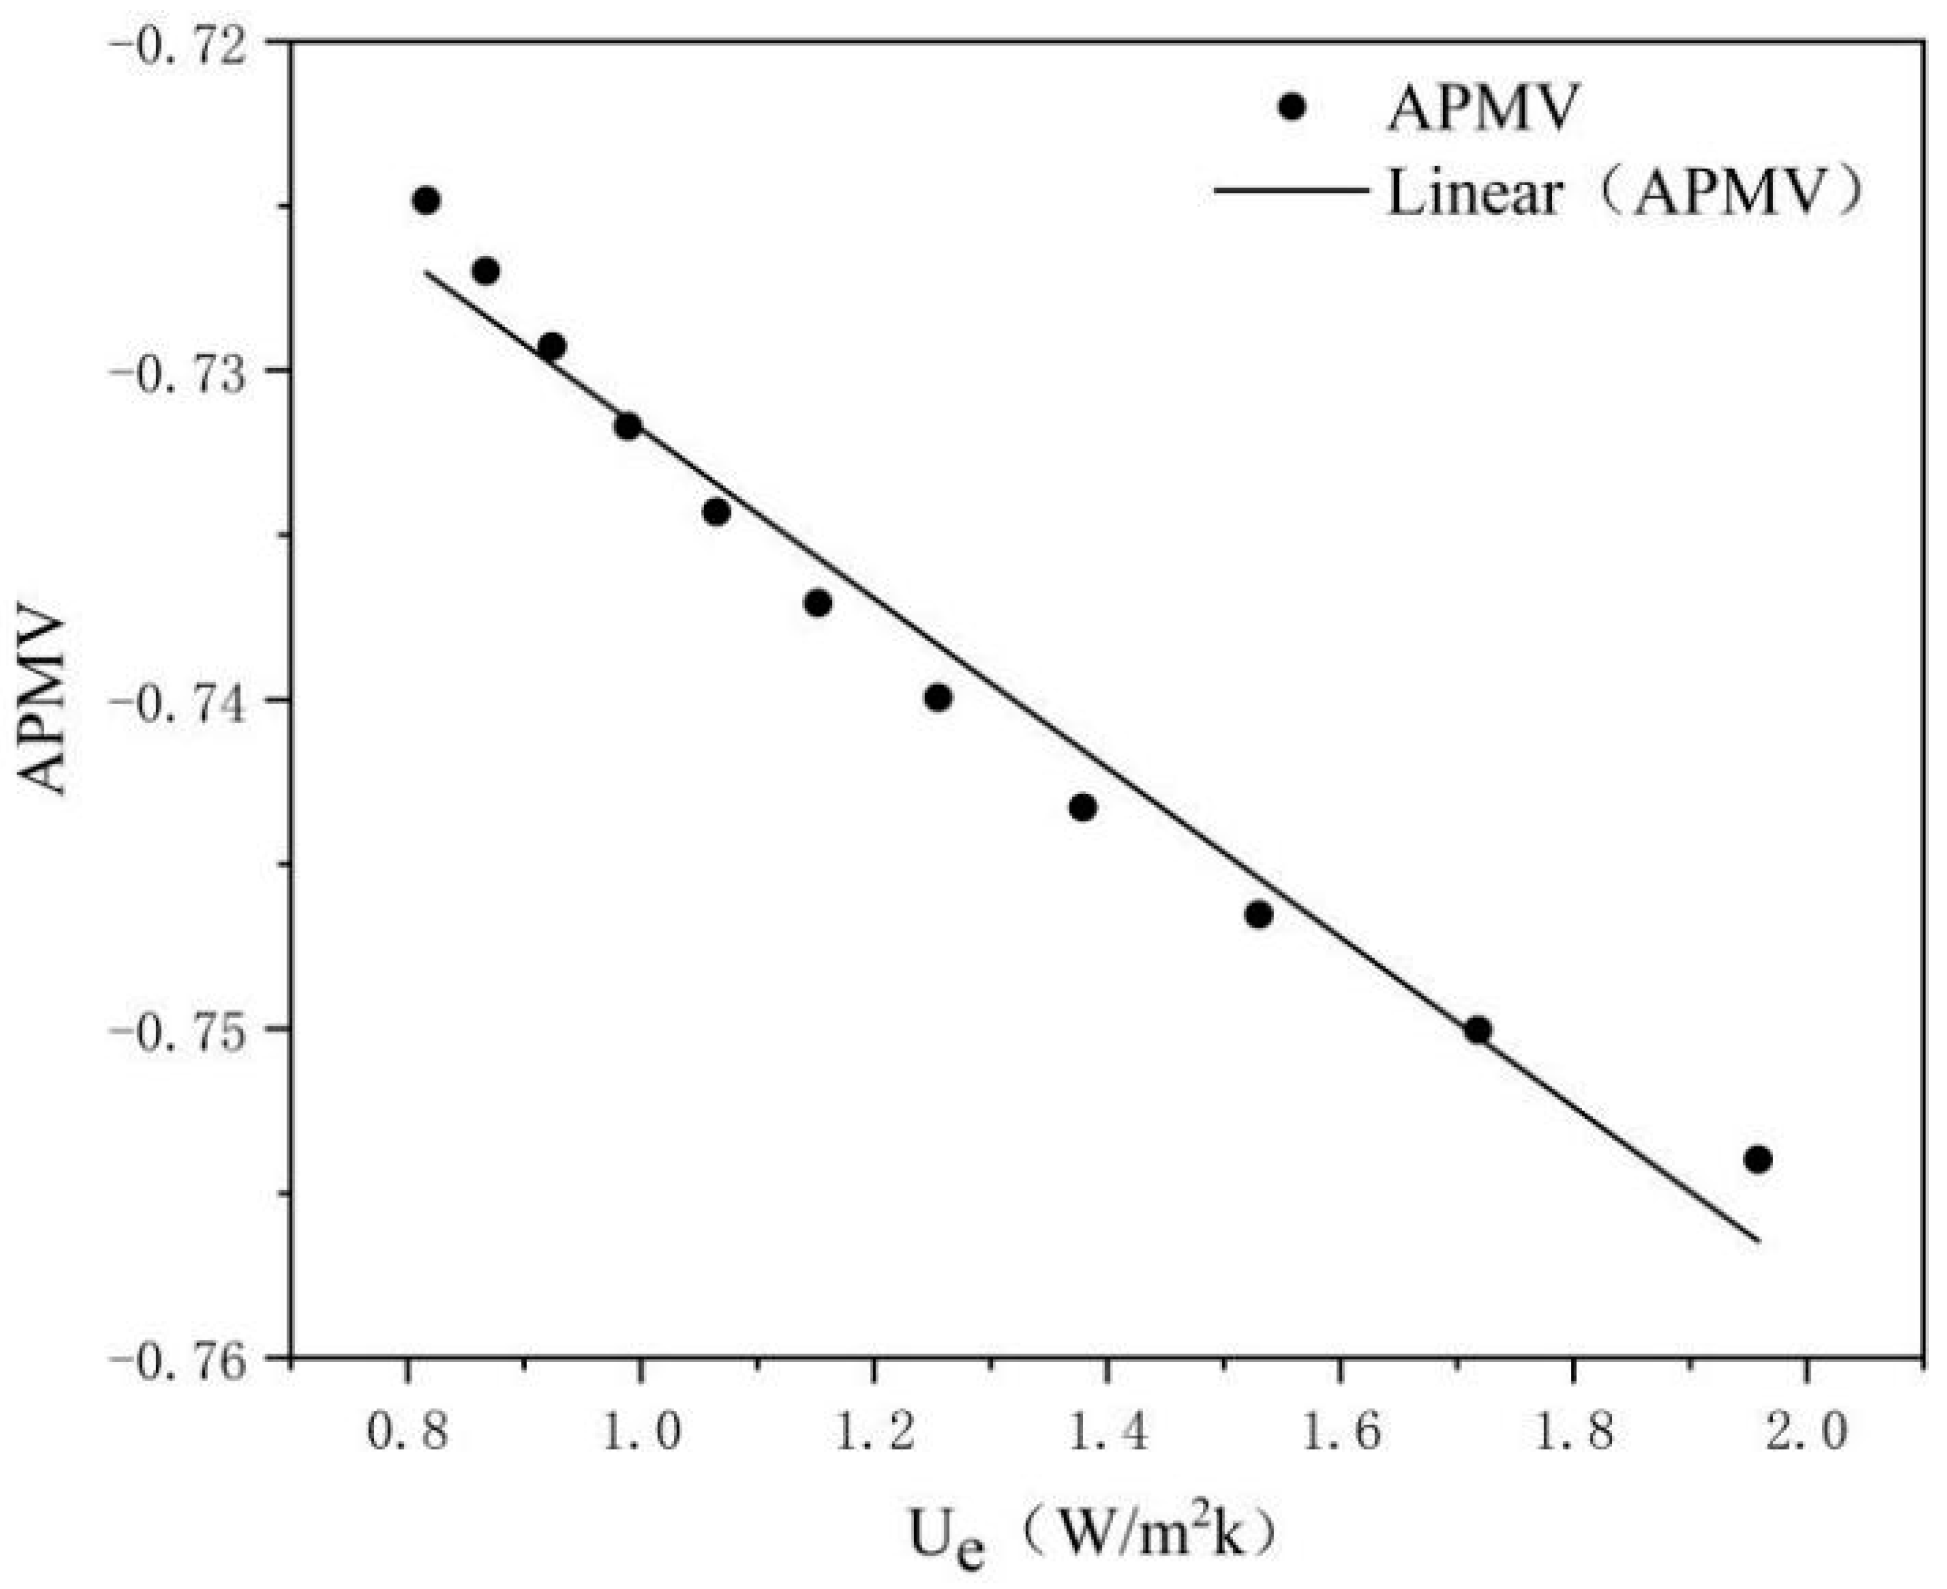
The relationship between the external wall heat transfer coefficient Ue and the adaptive thermal comfort index APMV is shown in Figure 12. The smaller Ue is, the larger the APMV (closer to the comfort zone) will be. The fitting equation of Ue and APMV is shown in Equation (19), that is, the APMV increases 2.58 × 10⁻³ when Ue decreases by 0.1 W/m2K:
A P M V = 0.7062 0.0258 × U e ,   R 2 = 0.9730

3.3. Energy-Saving Retrofit of the Roof

Rural residential buildings mainly have sloped roofs. There is usually a thermal insulation ventilated air layer between the second-story ceiling and the roof. There are two options for the location of the external insulation layer, as shown in Figure 3, by the dotted line. The calculation results show that the energy-saving and thermal comfort effects are better if an external insulation layer is added to the sloped roof. Therefore, the external insulation layer is added to the sloped roof as the main measure.
The relationship between the thickness of the roof insulation layer and the heat transfer coefficient is shown in Table 3. As Dr increases, Ur decreases continuously; when Dr increases to 80 mm, the change in Ur tends to be flat.
The roof heat transfer coefficient Ur is negatively correlated with the retrofit costs C as a whole. Figure 13 shows that the larger the roof heat transfer coefficient is, the lower the building retrofit costs will be. The relationship between C and Ur can be fitted as a power function, as shown in Equation (20):
C = 6.1583 × 10 3 × U r 0.1967 ,   R 2 = 0.9236
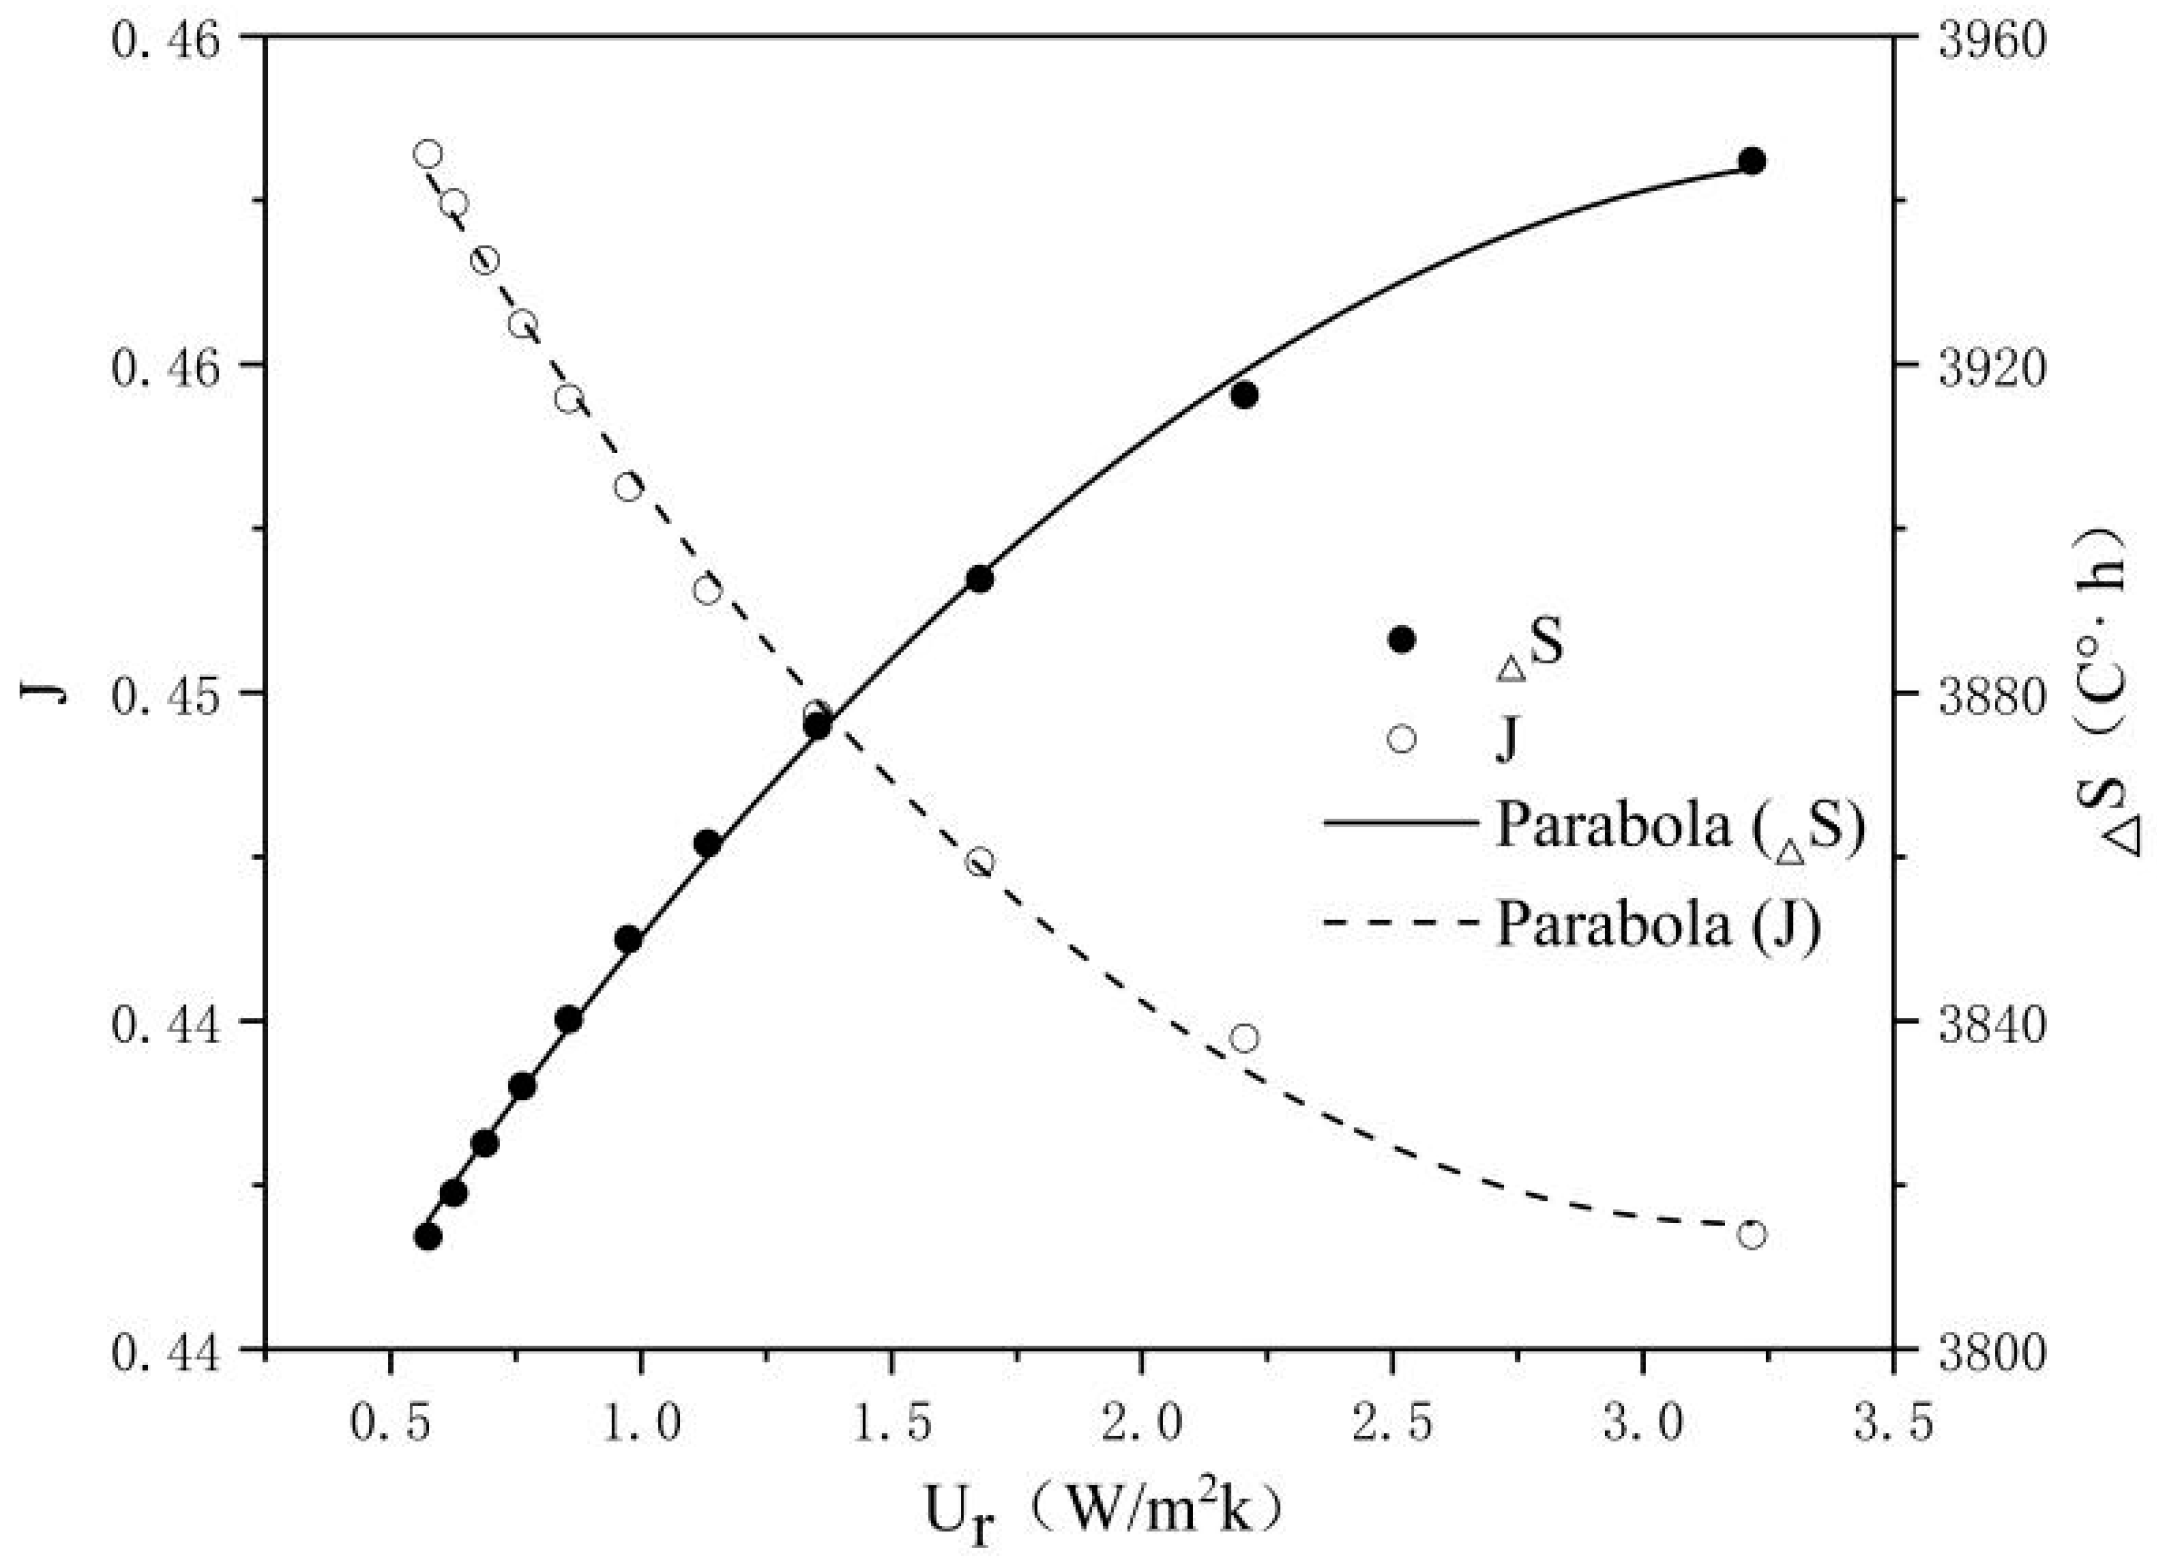
The influence of roof heat transfer coefficient Ur on building energy saving and indoor thermal comfort is shown in Figure 14. The larger Ur is, the smaller the value of J, and the worse the building energy-saving effect will be. The fitting equation of Ur and J is shown in Equation (21). The larger Ur is, the greater ΔS, and the worse the indoor thermal environment will be. The fitting equation of Ur and ΔS is shown in Equation (22):
J = 0.4687 0.0177 × U r + 0.0028 × U r 2 ,   R 2 = 0.9973
Δ S = 3760.3759 + 104.7619 × U r 14.8360 × U r 2 ,   R 2 = 0.9985
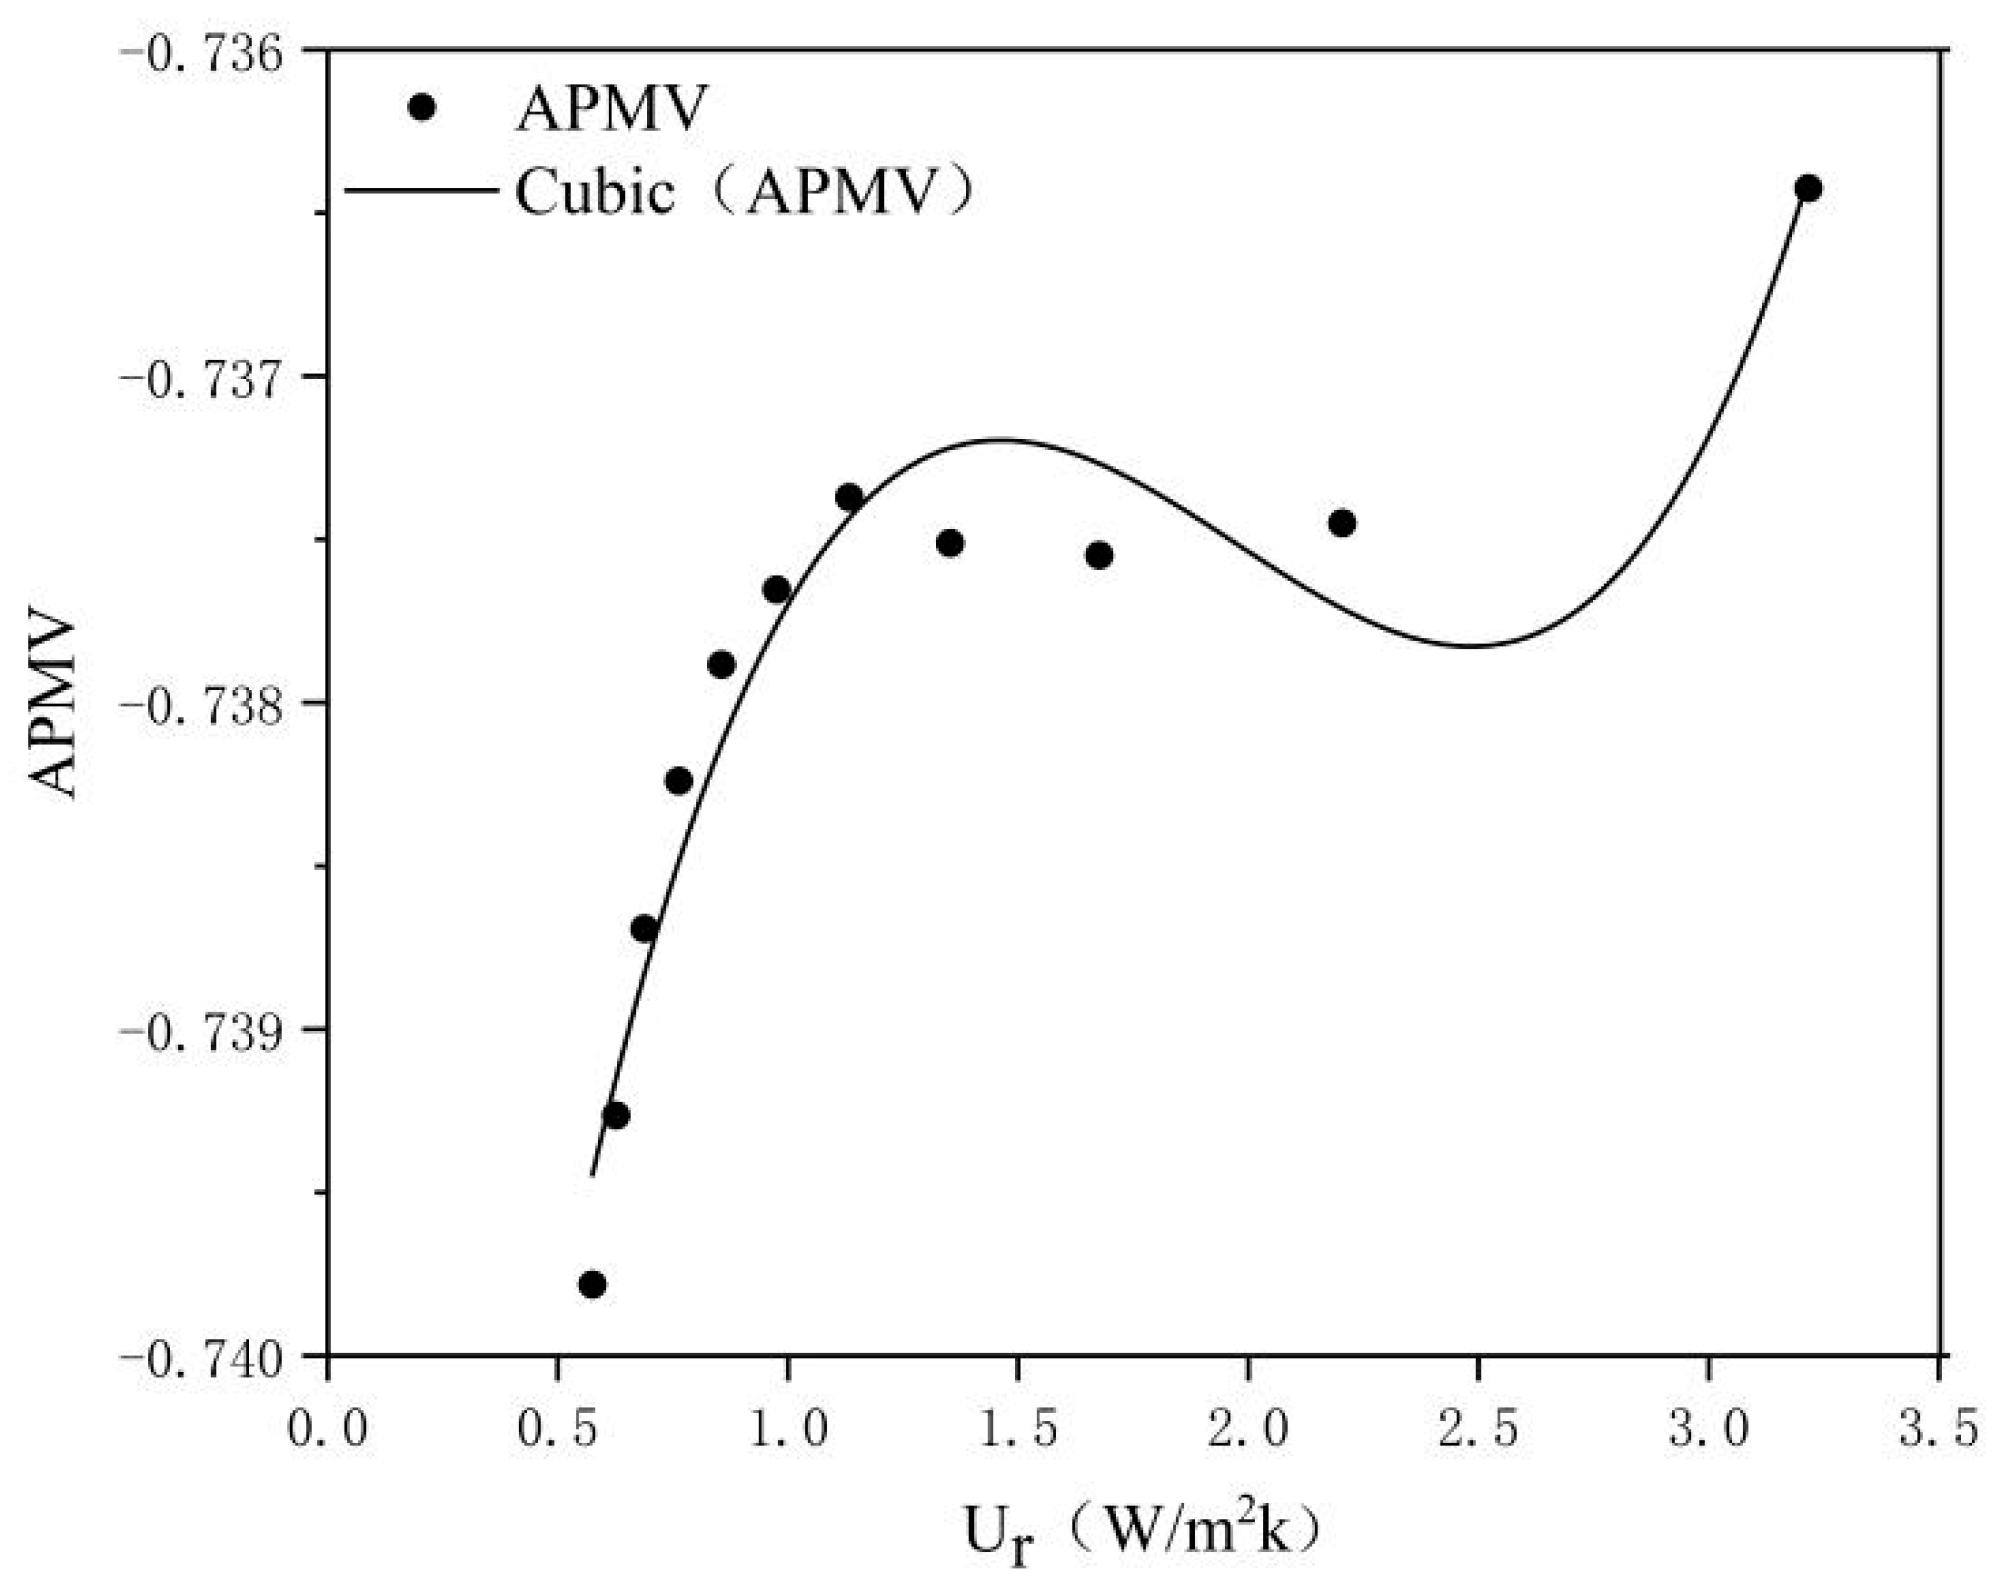
The influence of roof heat transfer coefficient Ur on the APMV is shown in Figure 15. As Ur increases, the APMV presents a nonlinear change. Ur and APMV can be fit as a cubic function equation; see Equation (23):
A P M V = 0.7431 + 0.0097 × U r 0.0053 × U r 2 + 8.8656 × 10 4 × U r 3 ,   R 2 = 0.9194

4. Discussion

4.1. The Impact of Costs on the Energy Saving Rate and Thermal Comfort

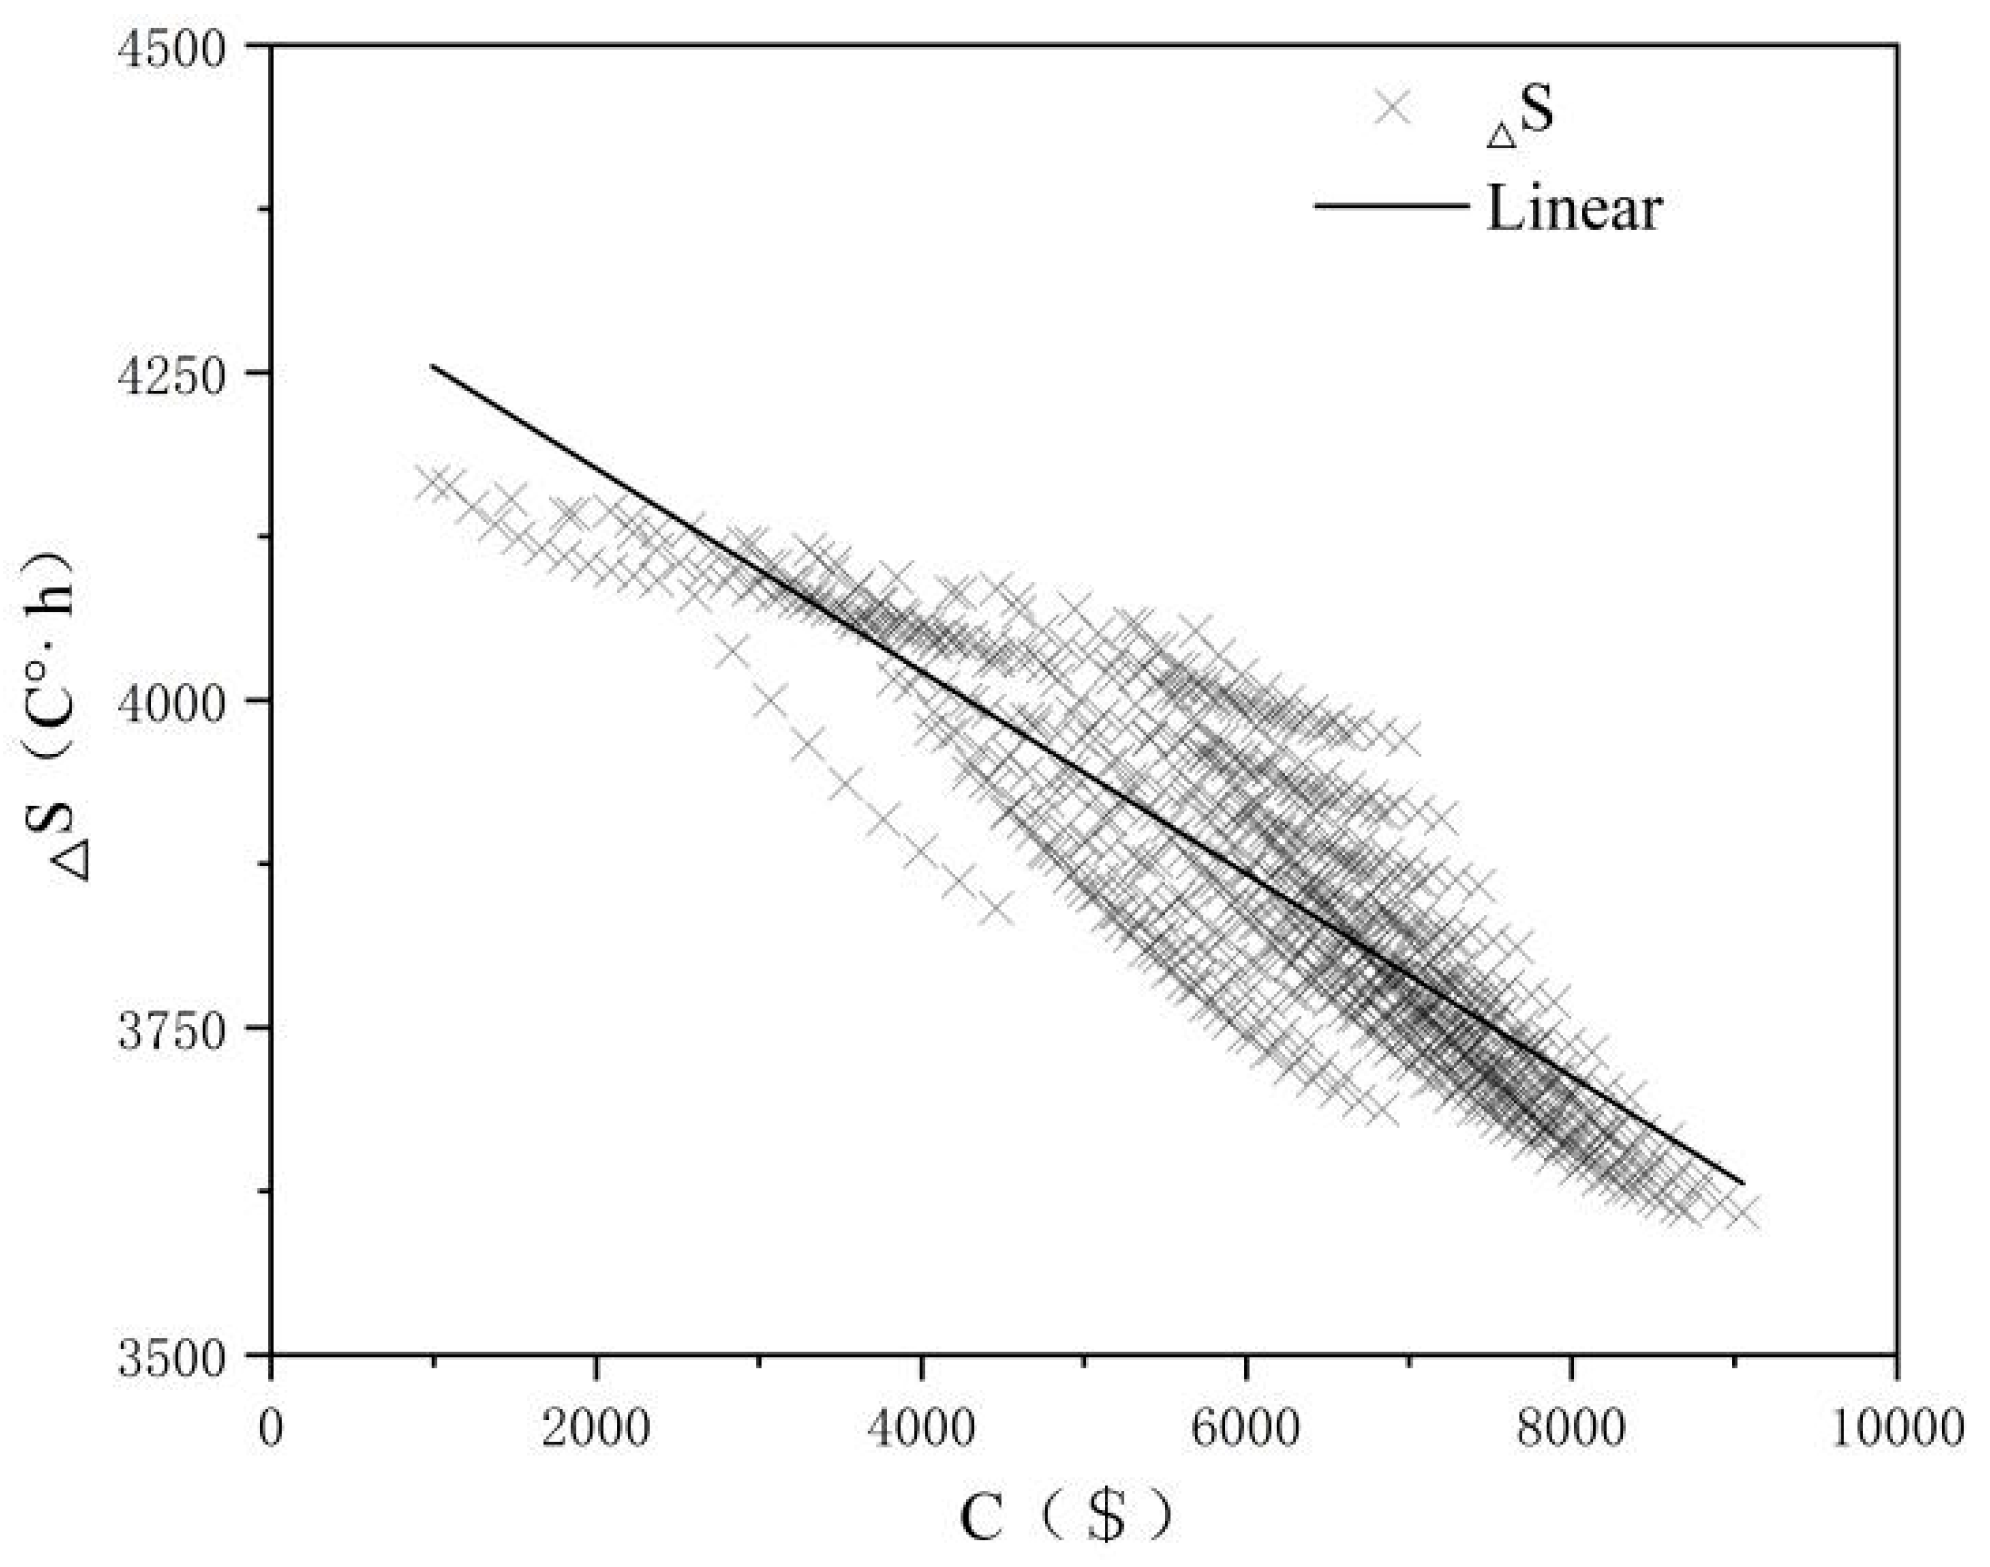
The impact of the total input costs of building retrofit on the building energy-saving rate is shown in Figure 16. The higher the costs are, the better the energy-saving effect will be. The influence of retrofit costs C on energy-saving rate J can be fit as Equation (24). Equation (24) shows that, for every $1000 increase in retrofit costs, the building energy-saving rate will increase by 1.30%. The influence of the total retrofit costs on the thermal comfort of the building is shown in Figure 17. The retrofit costs C are negatively correlated with the adaptive thermal discomfort degree-hours ΔS. The fitting Equation (25) of C and ΔS shows that, for every $1000 increase in the retrofit costs, the adaptive thermal discomfort degree-hours decrease by 77.40 C°·h.
J = 0.3734 + 1.2981 × 10 5 × C ,   R 2 = 0.7363
Δ S = 4331.7018 0.0774 × C ,   R 2 = 0.7681

4.2. The Impact of Costs on Different Retrofit Measures

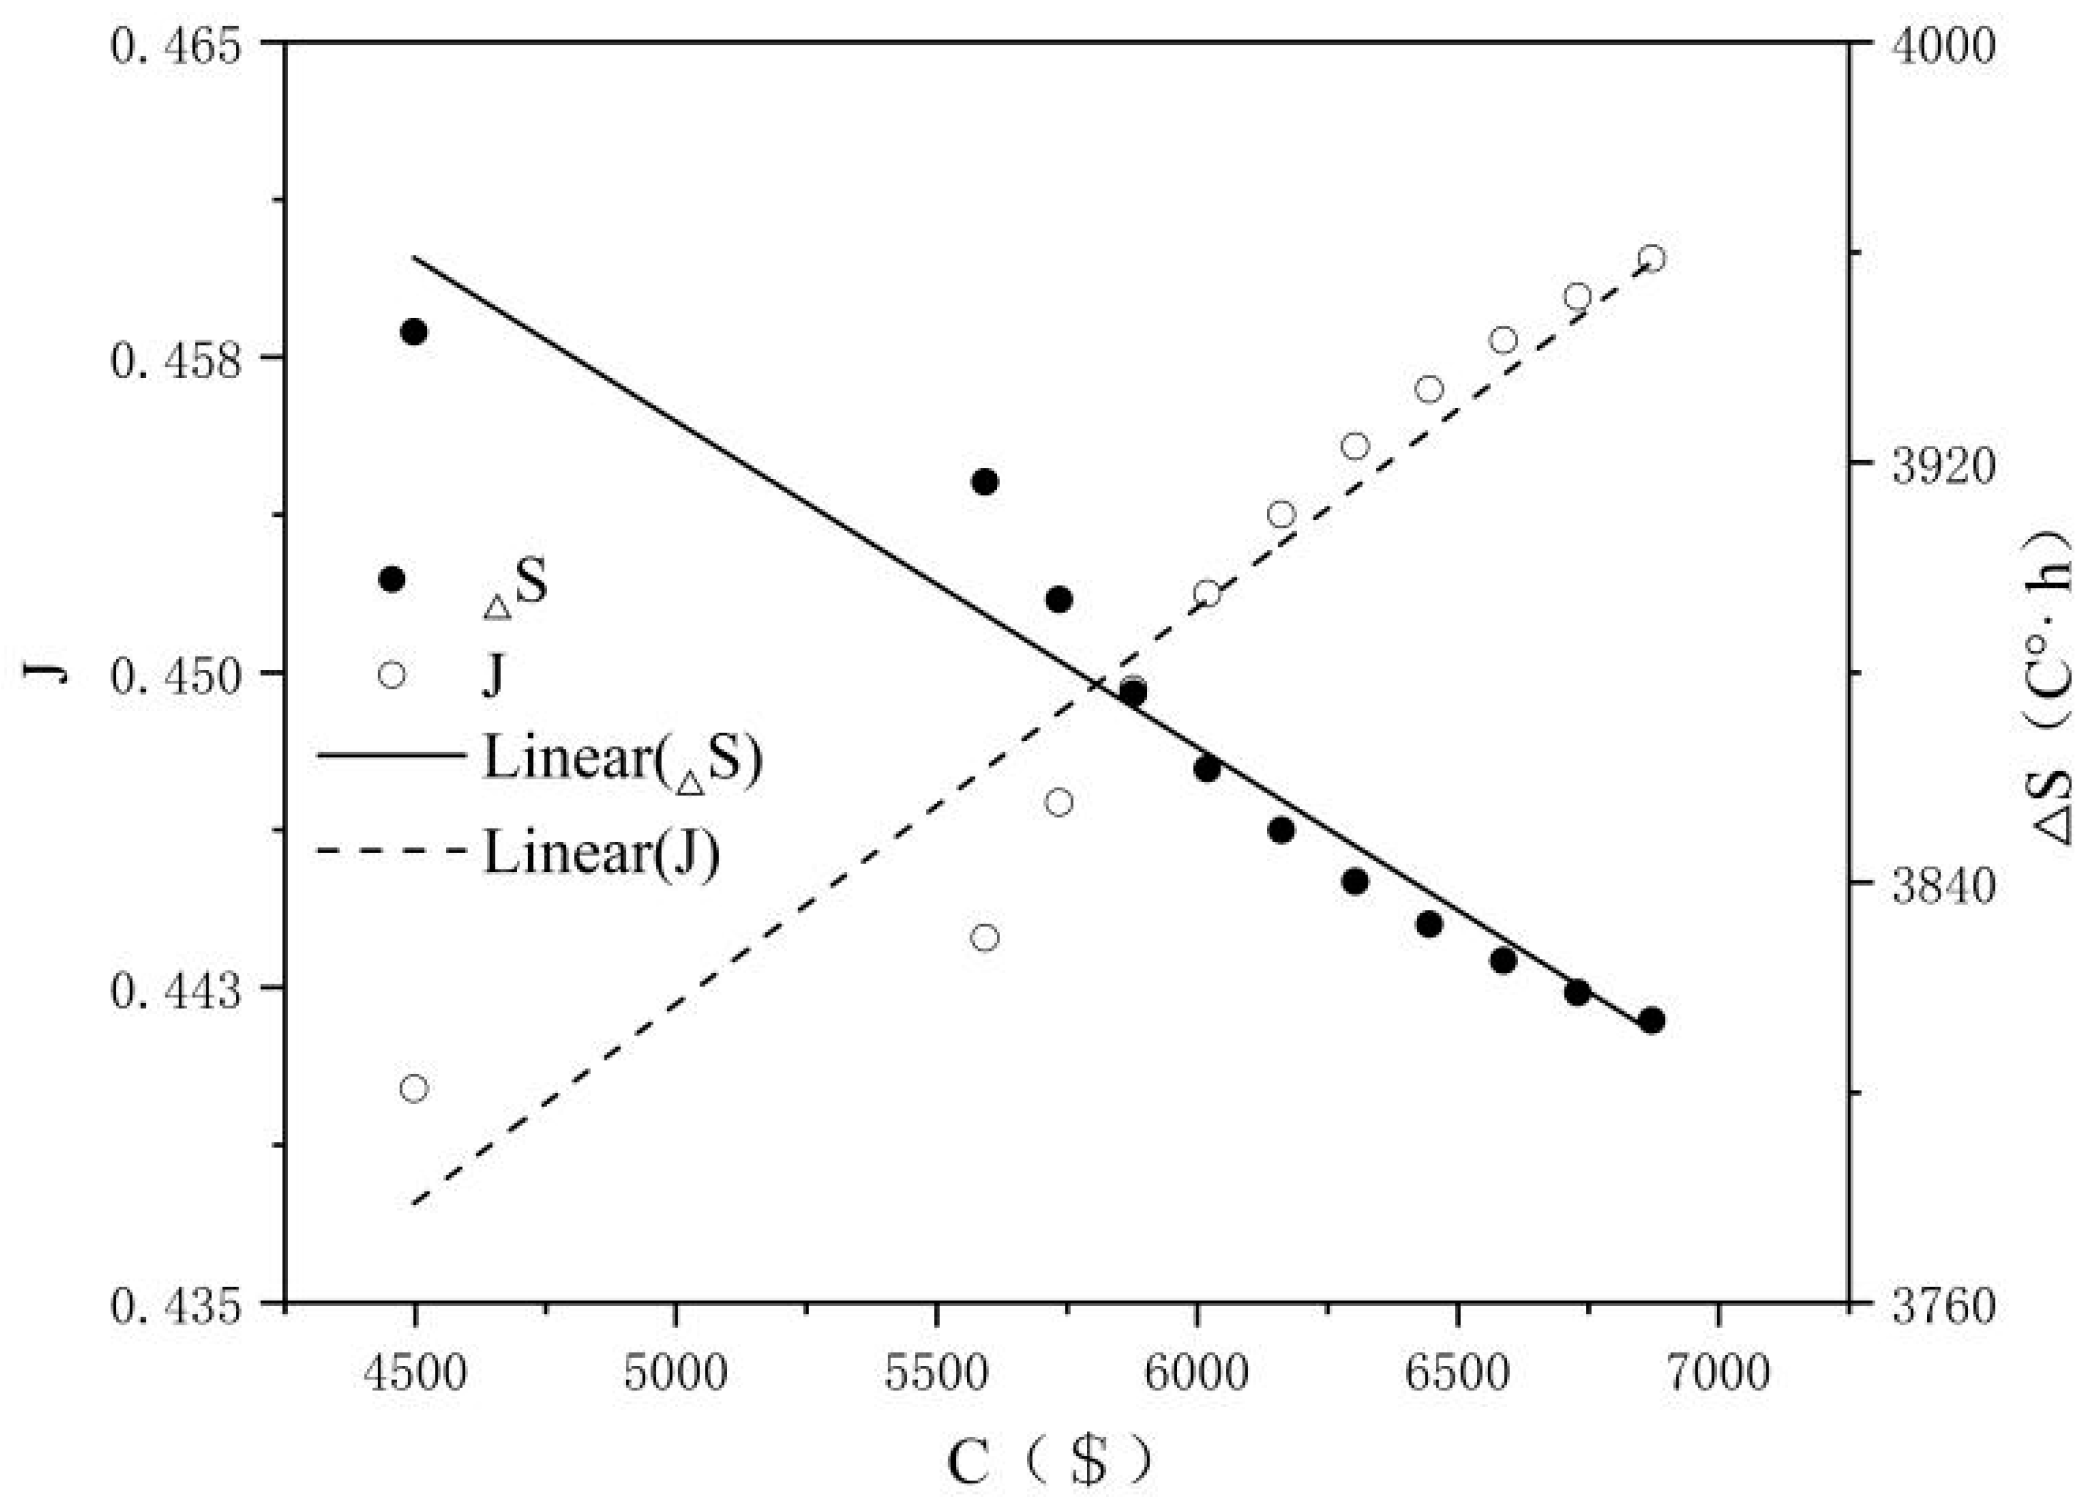
The building’s energy-saving reconstruction measures mainly include replacing the external windows and adding an external wall and roof insulation layer. The costs have different influences on the energy-saving effect of different reconstruction measures. According to Figure 18, Figure 19 and Figure 20, it can be seen that, overall, the higher the input costs are, the higher the energy-saving rate J of the building, and the smaller the adaptive thermal discomfort degree-hours will be. The sensitivity of the energy-saving rate and comfort level of different retrofit measures to changes in costs is different.
The fitting equations of energy-saving rate J and retrofit costs C are shown in Table 5. Comparing the slopes of each fitting equation shows that the absolute slope of the external wall is the largest, indicating that J is the most sensitive to the change in C during the retrofit of the external wall. The energy-saving rate increases by 1.71% for every $1000 increase in the retrofit costs of the external wall. The energy-saving rate increases by 0.45% and 0.94% for every $1000 increase in the retrofit costs of the external window and roof.
The fitting equations of ΔS and C are shown in Table 6. The ΔS of the external wall is the most sensitive to the change of C, and ΔS decreases by 98.7 C°·h for every $1000 increase in C. The ΔS of the external window and roof decreases by 32 C°·h and 62 C°·h for every $1000 increase in C.

4.3. Entropy Weight Optimization Analysis

The detailed calculation steps of the entropy weight decision method are shown in Section 2.5. Equations (12) and (14) are used to analyze the data of all working conditions, and the entropy E and entropy weight W of the three indicator variables are obtained, as shown in Table 7. The entropy weight of the retrofit costs, which is 0.3454, is the highest. The entropy value of energy-saving rate is the largest, and the corresponding entropy weight, which is 0.3218, is the smallest.
Equation (15) is used to calculate the index data of each working condition to obtain the proximity value Ti of all retrofit schemes. By comparison, it is found that the minimum value of Ti is 0.3403 (optimal scheme), and the corresponding operating parameters are 6+12A+6 double insulating glass windows, a 50 mm thick external wall insulation layer and a 90 mm thick roof insulation layer. Compared with the benchmark scheme (Table 8), it is found that, under the optimal working condition, the building energy-saving rate J increases by 23.81%, and the adaptive thermal discomfort degree-hours ΔS decreases by 13.17%.
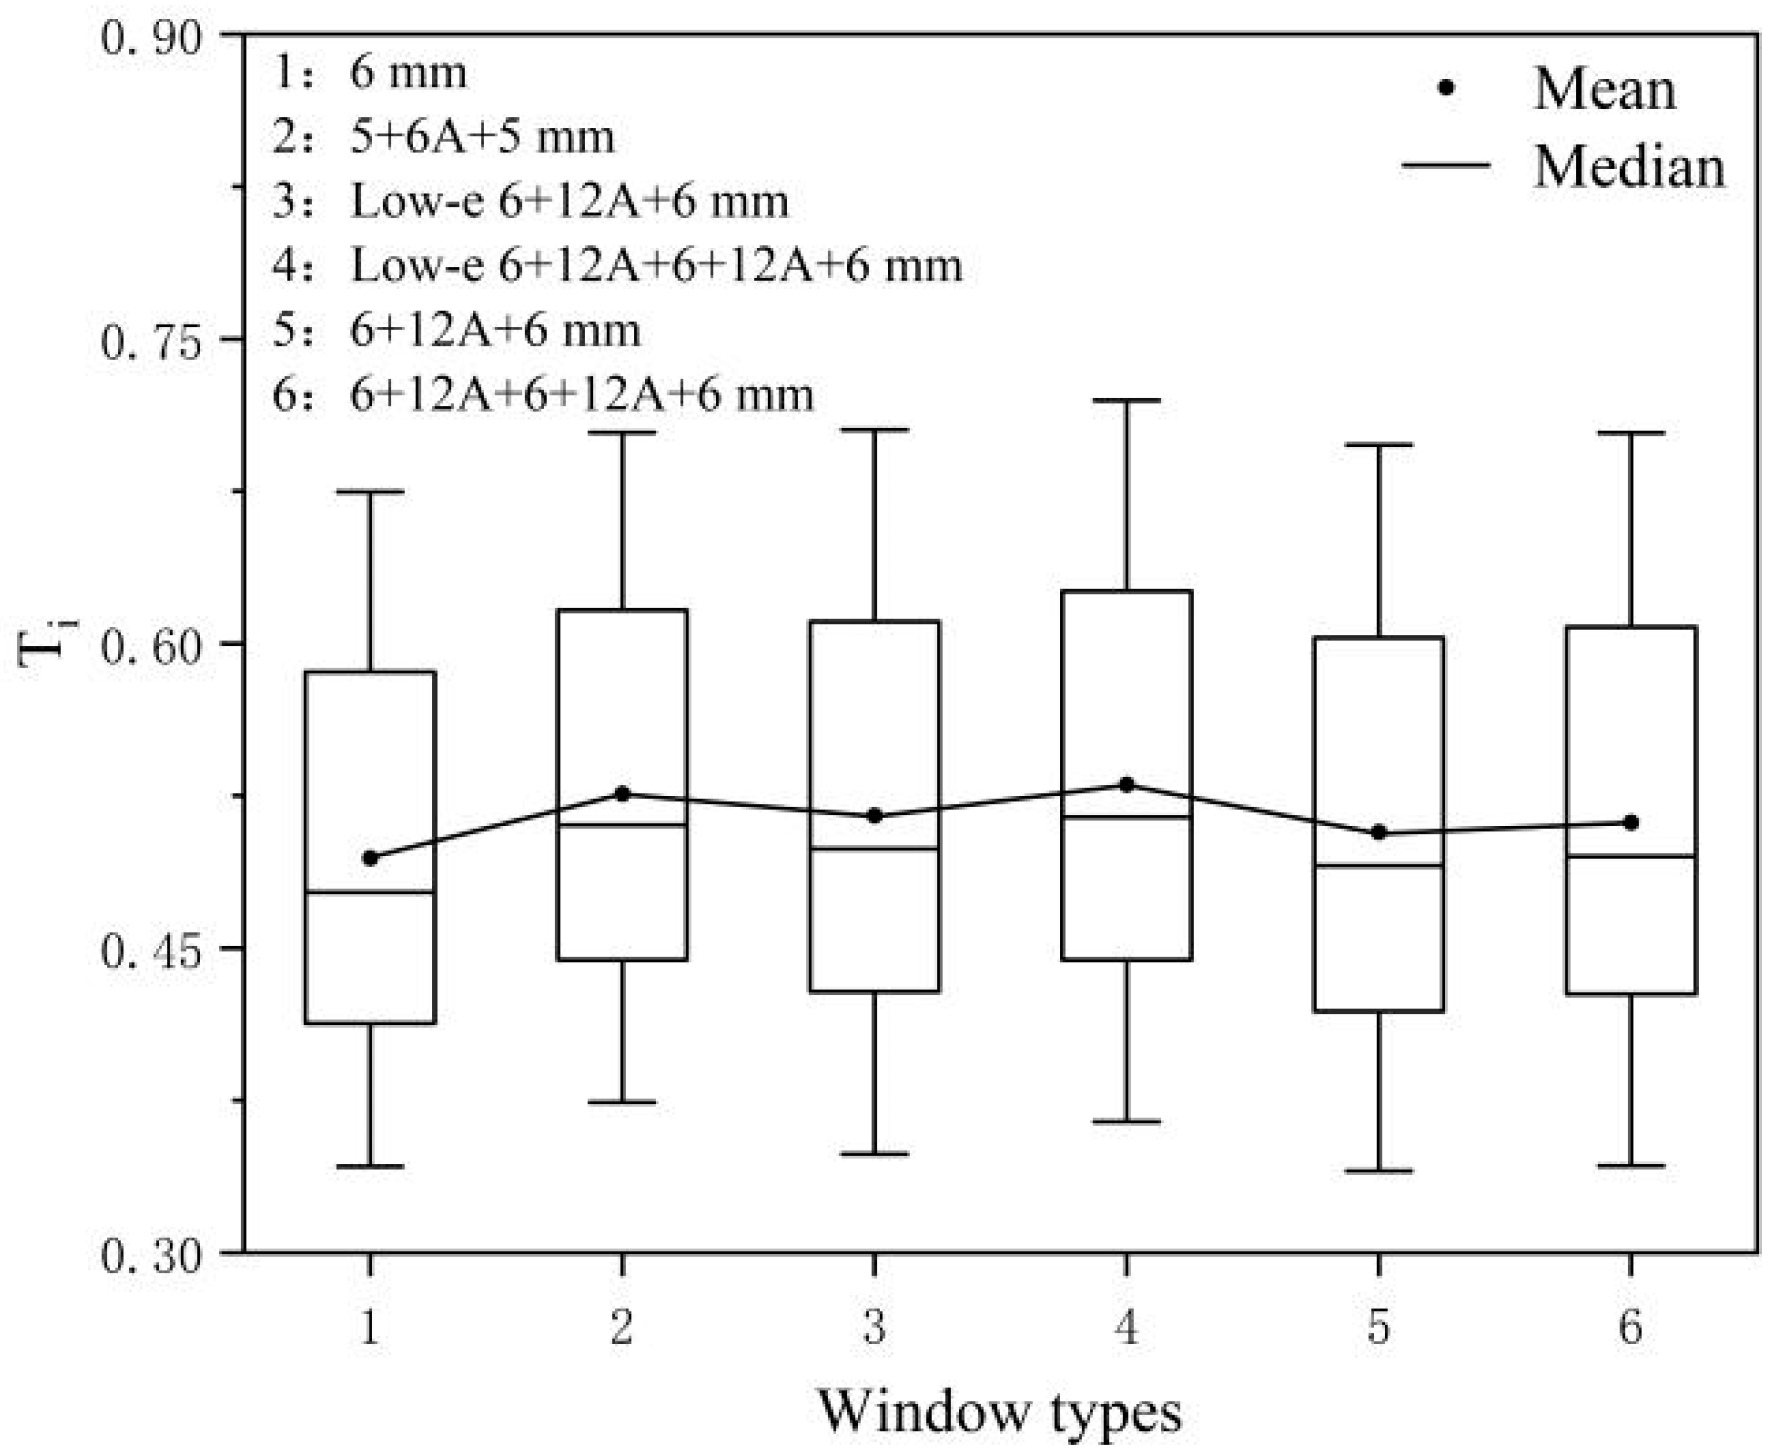
As Figure 21 shows, the overall proximity value of the single-glass 6 mm external window and 6+12A+6 insulating glass window is very small, while the overall proximity value of the low-e 6+12A+6 three-layer insulating glass window is the largest with an average value of 0.5306. The greater Ti is, the worse the reconstruction scheme will be. The mean proximity values ( T i ¯ ) of other external windows are shown in Table 9.
As Figure 22 shows, as the thickness of the external wall insulation layer changes, the Ti data are relatively scattered, indicating that the proximity value is more sensitive to the change in the external wall insulation layer thickness. Overall, the mean proximity T i ¯ value decreases as the insulation layer thickness increases. When the thickness of the external wall insulation layer is 50 mm (optimal insulation thickness), T i ¯ is the smallest, which is 0.3821.
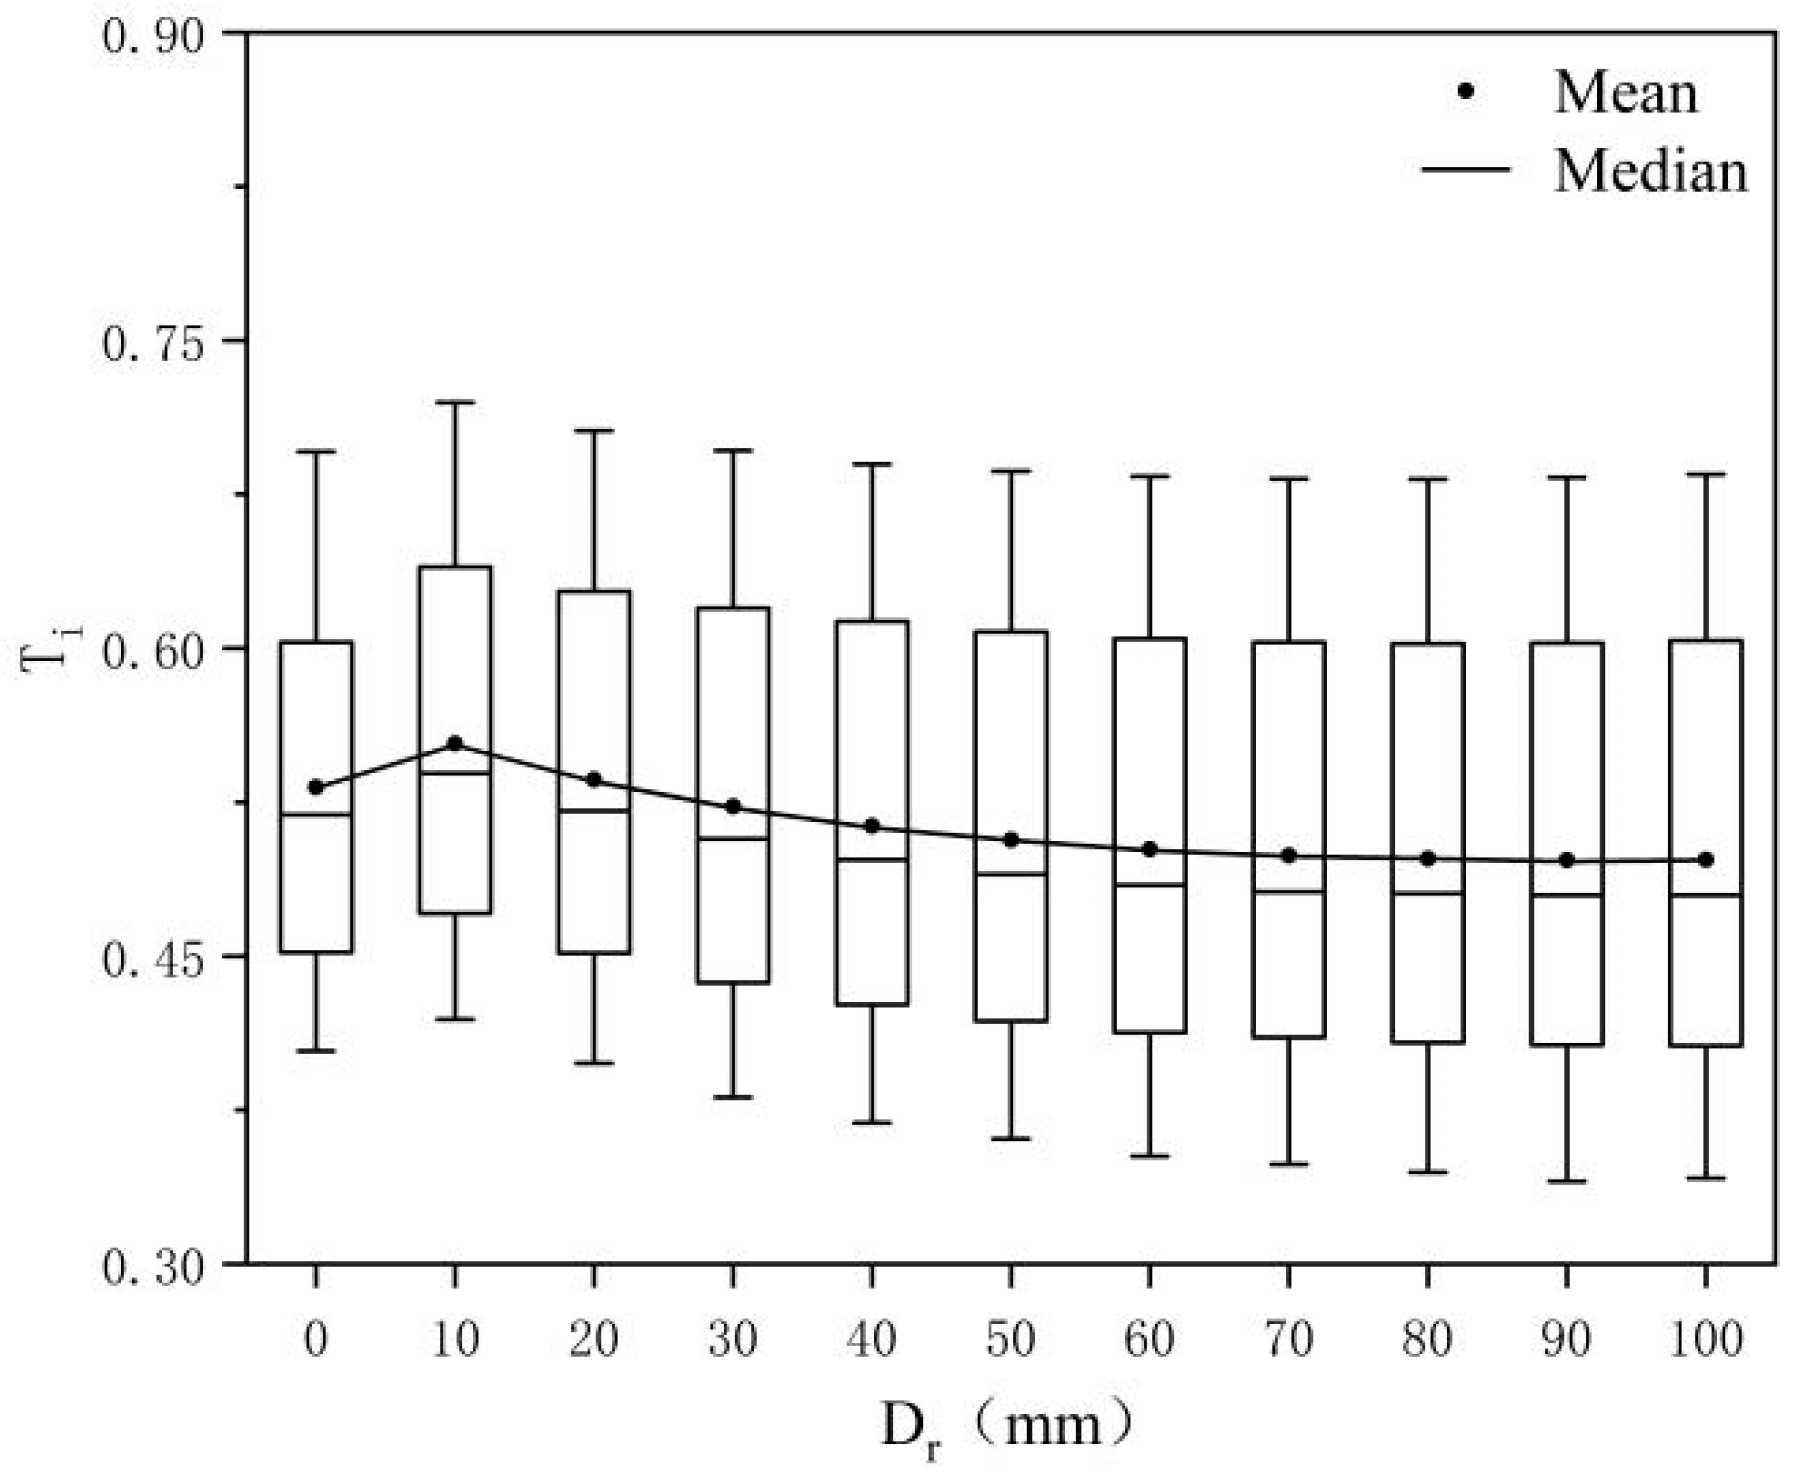
The variation in T i ¯ in the roof reconstruction with the thickness of the insulation layer is shown in Figure 23. The distribution of the data is relatively concentrated, and the proximity is less sensitive to the change in the thickness of the insulation layer than to the change in the external wall. When the thickness of the insulation layer increases to 70 mm, T i ¯ changes slightly. When the thickness of the insulation layer is 90 mm (optimal insulation thickness), T i ¯ is the smallest, which is 0.4967. As the thickness increases to 100 mm, T i ¯ begins to rise. The T i ¯ values of the external wall and roof with different thickness insulation layer are shown in Table 10.

5. Conclusions

This study mainly took rural residential buildings with natural ventilation as the research object, and the typical building energy-saving retrofit model was established on the basis of a field investigation. The main measures of building energy-saving retrofit were replacing the external windows and adding external wall and roof insulation layers. The parameters of the three measures were freely combined, and a total of 725 working conditions were obtained. The representative values of energy saving and the thermal comfort performance of the buildings were obtained using simulation analysis software. Taking the energy-saving rate, thermal comfort and retrofit costs of the envelope structure as the optimization objectives, the entropy weight method was used to analyze all the working conditions, and the advantages and disadvantages were ranked by the proximity value as the index so as to obtain the optimal energy-saving retrofit scheme. The main conclusions of the study can be summarized as follows.
Total investment costs have a great impact on the energy-saving effect after retrofit. For every $1000 increase in retrofit costs, the building energy-saving rate J increased by 1.30%, and ΔS decreased by 77.40 C°·h. Among the three retrofit measures, the energy-saving effect of the external insulation layer of the external wall is the most sensitive to the retrofit costs. For every $1000 increase in the costs, the building energy-saving rate J increased by 1.71%, and ΔS decreased by 98.70 C°·h. In the case of limited retrofit funds, the order of selection of energy-saving retrofit measures was external wall, roof and external windows.
Under the condition of natural ventilation, the building energy-saving retrofit should give priority to the selection of 6 m thick single layer glass windows and 6+12A+6 mm double insulating glass windows, and it is not suitable to use low-e 6+12A+6+12A+6 mm three-layer insulating glass windows.
The entropy weight method is used to give objective weights to the optimization indexes. Using this method, costs have the largest entropy weight (EC = 0.3454), followed by the adaptive thermal discomfort degree-hours and the energy-saving rate. Taking Ti as the decision index, the optimal scheme was selected. The optimal scheme parameters were 6+12A+6-mm double insulating glass window + 50-mm thick external wall insulation + 90-mm thick roof insulation. Compared with the benchmark building, it was found that the energy-saving rate J of the optimal scheme was increased by 23.81%, ΔS was decreased by 13.17%, and the retrofit costs were $8163.65.
The mean proximity T i ¯ decreases as the thickness of the external wall insulation layer increases, and the minimum value was 0.3821 when the thickness was 50 mm (optimal insulation thickness). For roof insulation, the minimum T i ¯ was 0.4967 when the thickness of the insulation layer was 90 mm (optimal insulation thickness).

Author Contributions

Conceptualization, W.C. and W.W.; methodology, W.C.; software, W.C. and L.Y.; field investigation, data collection and validation, L.C. and Q.Z.; writing—original draft preparation, W.C. and L.C.; writing—review and editing, W.C. and W.W.; revision, supervision, and submission, W.C., L.C. and W.W.; project administration, Q.Z.; funding acquisition, L.Y. and W.W. All authors have read and agreed to the published version of the manuscript.

Funding

This research was funded by “Anhui Province Natural Science Foundation, grant number 2008085ME177”, “National Innovation and Entrepreneurship Training Project of China, grant number 202010879077” and “Natural Science Key Research Project of Anhui Education Department, grant number KJ2019A0802”.

Informed Consent Statement

Informed consent was obtained from all subjects involved in the study.

Conflicts of Interest

The authors declare no conflict of interest.

Nomenclature

Uwexternal window heat transfer coefficient (W/m2K)
Ueexternal wall heat transfer coefficient (W/m2K)
Urroof heat transfer coefficient (W/m2K)
Deexternal wall insulation thickness (mm)
Drroof insulation thickness (mm)
Cretrofit costs ($)
Jenergy-saving contribution rate of envelope structure (referred to as the “energy-saving rate”) [19]
Toutoutdoor air temperature (°C)
Tinmean indoor operative temperature (°C)
Tnindoor comfortable temperature (°C)
Hreference degree-hours (C°·h)
H1design degree-hours (C°·h)
tiindoor operative temperature in a room (°C)
siroom floor area (m2)
Nthe total number of rooms in the building model
PMVpredicted mean vote
APMVadaptive predicted mean vote [64]
λadaptive coefficient [62]
ΔSannual adaptive thermal discomfort degree-hours (C°·h)
ΔS1annual hot adaptive thermal discomfort degree-hours (C°·h)
ΔS2annual cold adaptive thermal discomfort degree-hours (C°·h)
ΔAPMVdegree of adaptive thermal discomfort
Ejentropy
Wjentropy weight
Tiproximity [31]
T i ¯ mean proximity

References

  1. 2020 Annual Report on China Building Energy Efficiency; Building Energy Efficiency Research Center of Tsinghua University: Beijing, China, 2020.
  2. Houkai, W.; Zhixiong, D. China Rural Development Report, 3rd ed.; China Social Sciences Press: Beijing, China, 2020; pp. 480–503. [Google Scholar]
  3. Ekici, B.B.; Gulten, A.A.; Aksoy, U.T. A study on the optimum insulation thicknesses of various types of external walls with respect to different materials, fuels and climate zones in Turkey. Appl. Energy 2012, 92, 211–217. [Google Scholar] [CrossRef]
  4. Guven, S. Calculation of optimum insulation thickness of external walls in residential buildings by using exergetic life cycle cost assessment method: Case study for Turkey. Environ. Prog. Sustain. Energy 2019, 38, e13232. [Google Scholar] [CrossRef]
  5. Kurekci, N.A. Determination of optimum insulation thickness for building walls by using heating and cooling degree-day values of all Turkey’s provincial centers. Energy Build. 2016, 118, 197–213. [Google Scholar] [CrossRef]
  6. Yang, Z.; Zhao, Y.; Xu, X.; Zhai, B. Analysis and comparison of building energy saving reconstruction in hot summer and warm winter regions of South China and cold regions of North China. Energy Build. 2012, 54, 192–195. [Google Scholar] [CrossRef]
  7. Solvang, W.D.; Zhang, C.Y. Benefit Analysis of the Energy Saving Reconstruction of the Office Building in Chagan Hada; Trans Tech Publications: Zurich, Switzerland, 2011; pp. 4976–4980. [Google Scholar]
  8. Sheina, S.G.; Zilberova, I.Y.; Vongay, A.O. Energy-Saving Processes Simulation in Reconstruction of Educational Institutions Edifices; EDP Sciences: Les Ulis, France, 2017; p. 00153. [Google Scholar]
  9. Domínguez, S.; Sendra, J.J.; León, A.L.; Esquivias, P.M. Towards energy demand reduction in social housing buildings: Envelope system optimization strategies. Energies 2012, 5, 2263–2287. [Google Scholar] [CrossRef] [Green Version]
  10. Dominguez-Delgado, A.; Domínguez-Torres, H.; Domínguez-Torres, C.-A. Energy and Economic Life Cycle Assessment of Cool Roofs Applied to the Refurbishment of Social Housing in Southern Spain. Sustainability 2020, 12, 5602. [Google Scholar] [CrossRef]
  11. Xinhui, Z.; Zhicong, M.; Chenhui, G.; Zhao, L. Analysis on energy consumption of rural residential buildings in Shanxi. J. Xi’an Univ. Architect. Technol. (Nat. Sci. Ed.) 2020, 52, 667–673. [Google Scholar]
  12. Zhe, L. Analysis on the Suitability of Energy Saving Retrofit and Clean Heating for Rural Buildings in Shandong. Master’s Thesis, Shandong Jianzhu University, Jinan, China, 2019. [Google Scholar]
  13. Sheng, X.; Lin, D. Energy saving analyses on the reconstruction project in district heating system with distributed variable speed pumps. Appl. Therm. Eng. 2016, 101, 432–445. [Google Scholar] [CrossRef]
  14. He, Q.; Ng, S.T.; Hossain, M.; Skitmore, M. Energy-efficient window retrofit for high-rise residential buildings in different climatic zones of China. Sustainability 2019, 11, 6473. [Google Scholar] [CrossRef] [Green Version]
  15. Liu, C.; Mohammadpourkarbasi, H.; Sharples, S. Evaluating the potential energy savings of retrofitting low-rise suburban dwellings towards the Passivhaus EnerPHit standard in a hot summer/cold winter region of China. Energy Build. 2021, 231, 110555. [Google Scholar] [CrossRef]
  16. Ascione, F.; Bianco, N.; Mauro, G.M.; Napolitano, D.F. Villas on Islands: Cost-effective energy refurbishment in Mediterranean coastline houses. Energy Procedia 2019, 159, 192–200. [Google Scholar] [CrossRef]
  17. Liu, Y.; Wuxing, W.; Lei, Z. A Calculation Method of Building Energy Saving Rate. Patent ZL201510072207, 2015. [Google Scholar]
  18. Liu, Y.; Yufan, L.; Lei, Z. Calculation Method of Building Energy Saving Rate Based on Human Thermal Adaptation Model. Patent ZL201510070484, 2015. [Google Scholar]
  19. Liu, Y.; Yang, L.; Zheng, W.; Liu, T.; Zhang, X.; Liu, J. A novel building energy efficiency evaluation index: Establishment of calculation model and application. Energy Convers. Manag. 2018, 166, 522–533. [Google Scholar] [CrossRef]
  20. Albatayneh, A.; Alterman, D.; Page, A.; Moghtaderi, B. The impact of the thermal comfort models on the prediction of building energy consumption. Sustainability 2018, 10, 3609. [Google Scholar] [CrossRef] [Green Version]
  21. Nicol, J.F.; Humphreys, M.A. Adaptive thermal comfort and sustainable thermal standards for buildings. Energy Build. 2002, 34, 563–572. [Google Scholar] [CrossRef]
  22. Shi, X. Multi-Objective Optimization of Building Design Based on Performance. In Proceedings of the 13th National Conference on Building Technology, Beijing, China, 24–26 September 2010; pp. 162–165. [Google Scholar]
  23. Gero, J.S.; D’Cruz, N.; Radford, A.D. Energy in context: A multicriteria model for building design. Build. Sci. 1983, 18, 99–107. [Google Scholar] [CrossRef]
  24. Juan, Y.-K.; Kim, J.H.; Roper, K.; Castro-Lacouture, D. GA-based decision support system for housing condition assessment and refurbishment strategies. Autom. Constr. 2009, 18, 394–401. [Google Scholar] [CrossRef]
  25. Kaklauskas, A.; Zavadskas, E.K.; Raslanas, S. Multivariant design and multiple criteria analysis of building refurbishments. Energy Build. 2005, 37, 361–372. [Google Scholar] [CrossRef]
  26. Flourentzou, F.; Roulet, C.A. Elaboration of retrofit scenarios. Energy Build. 2002, 34, 185–192. [Google Scholar] [CrossRef]
  27. Asadi, E.; da Silva, M.G.; Antunes, C.H.; Dias, L.; Glicksman, L. Multi-objective optimization for building retrofit: A model using genetic algorithm and artificial neural network and an application. Energy Build. 2014, 81, 444–456. [Google Scholar] [CrossRef]
  28. Deb, C.; Lee, S.E.; Santamouris, M. Using artificial neural networks to assess HVAC related energy saving in retrofitted office buildings. Sol. Energy 2018, 163, 32–44. [Google Scholar] [CrossRef]
  29. Asadi, E.; da Silva, M.G.; Antunes, C.H.; Dias, L. A multi-objective optimization model for building retrofit strategies using TRNSYS simulations, GenOpt and MATLAB. Build. Sci. 2012, 56, 370–378. [Google Scholar] [CrossRef]
  30. Han, Y.; Fan, C.; Geng, Z.; Ma, B.; Cong, D.; Chen, K.; Yu, B. Energy efficient building envelope using novel RBF neural network integrated affinity propagation. Energy 2020, 209, 118414. [Google Scholar] [CrossRef]
  31. Weidong, W.; Duan, Q.; Feng, Y.; Lv, Y.; Wang, J.; Meng, Q. Constructing prototypical building models based on the similarity theory coupled with entropy weight method. Sci. Technol. 2020, 26, 90–100. [Google Scholar] [CrossRef]
  32. Shannon, C.E. A mathematical theory of communication. ACM SIGMOBILE Mobile Comput. Commun. Rev. 2001, 5, 3–55. [Google Scholar] [CrossRef]
  33. Yan, X.; Gong, J.; He, J.; Zhang, H.; Zhang, C.; Liu, Z. Integrated Data Mining and TOPSIS Entropy Weight Method to Evaluate Logistics Supply and Demand Efficiency of a 3PL Company. Math. Probl. Eng. 2020, 2020, 1–12. [Google Scholar] [CrossRef]
  34. Feng, J.; Gong, Z. Integrated linguistic entropy weight method and multi-objective programming model for supplier selection and order allocation in a circular economy: A case study. J. Clean. Prod. 2020, 277, 122597. [Google Scholar] [CrossRef]
  35. Lin, H.; Du, L.; Liu, Y. Soft Decision Cooperative Spectrum Sensing with Entropy Weight Method for Cognitive Radio Sensor Networks. IEEE Access 2020, 8, 109000–109008. [Google Scholar] [CrossRef]
  36. Gong, W.; Wang, N.; Zhang, N.; Han, W.; Qiao, H. Water resistance and a comprehensive evaluation model of magnesium oxychloride cement concrete based on Taguchi and entropy weight method. Constr. Build. Mater. 2020, 260, 119817. [Google Scholar] [CrossRef]
  37. Wang, C.; Xu, M.; Olsson, G.; Liu, Y. Characterizing of water-energy-emission nexus of coal-fired power industry using entropy weighting method. Resour. Conserv. Recycl. 2020, 161, 104991. [Google Scholar] [CrossRef]
  38. Huang, W.; Zhang, Y.; Yu, Y.; Xu, Y.; Xu, M.; Zhang, R.; De Dieu, G.J.; Yin, D.; Liu, Z. Historical data-driven risk assessment of railway dangerous goods transportation system: Comparisons between Entropy Weight Method and Scatter Degree Method. Reliab. Eng. Syst. 2021, 205, 107236. [Google Scholar] [CrossRef]
  39. Zhu, Q.; Liu, L. Ranking Factors of Infant Formula Milk Powder Using Improved Entropy Weight Based on HDT Method and Its Application of Food Safety. Processes 2020, 8, 740. [Google Scholar] [CrossRef]
  40. Mehdi, S.; Hossein, M.; Seyed, Z.H.; Ali, R.I. Assessment of food hazard mapping in urban areas using entropy weighting method: A case study in Hamadan city, Iran. Acta Geophys. 2019, 8, 21. [Google Scholar]
  41. Bai, H.; Feng, F.; Wang, J.; Wu, T. A Combination Prediction Model of Long-Term Ionospheric foF2 Based on Entropy Weight Method. Entropy 2020, 22, 442. [Google Scholar] [CrossRef] [PubMed] [Green Version]
  42. Li, M.; Sun, H.; Singh, V.P.; Zhou, Y.; Ma, M. Agricultural Water Resources Management Using Maximum Entropy and Entropy-Weight-Based TOPSIS Methods. Entropy 2020, 21, 364. [Google Scholar] [CrossRef] [Green Version]
  43. Zhu, Y.; Tian, D.; Yan, F. Effectiveness of entropy weight method in decision-making. Math. Probl. Eng. 2020, 2020, 1–5. [Google Scholar] [CrossRef]
  44. Qian, B.; Zhu, Y.; Wang, Y.; Yan, F. Can Entropy Weight Method Correctly Reflect the Distinction of Water Quality Indices? Water Resour. Manag. 2020, 8, 4. [Google Scholar]
  45. Chinese Standard JGJ/T129-2012, Technical Specification for Energy Efficiency Retrofitting of Existing Residential Buildings; China Academy of Building Research: Beijing, China, 2012.
  46. Zhang, H.; Wang, L. Building Energy Saving Technology; Higher Education Press: Beijing, China, 2016. [Google Scholar]
  47. Chinese Standard GB/T 50824-2013, Design Standard for Energy Efficiency of Rural Residental Building; China Academy of Building Research: Beijing, China, 2012.
  48. Chinese Standard JGJ 253-2011, Technical Specification for Themal Insulating Systems of Inorgania Lightweight Aggregate Mortar; Guangsha Construction Group Co. Ltd. and Ningbo Rongshan New Material Co. Ltd.: Beijing, China, 2011.
  49. Chinese Standard DBT 279-2010, Inorganic Insulation Mortar Wall Insulation System; Anhui Institute of Product Quality Supervision and Inspection: Hefei, China, 2010.
  50. Anhui Provincial Construction Engineering Cost Management Station. Anhui Provincial Construction Engineering Cost Management Station, Anhui Province Construction Engineering Valuation Quota; Anhui Province Construction Engineering Valuation Quota; China Building Materials Industry Press: Beijing, China, 2018. [Google Scholar]
  51. Carlos, E.; Naghelli, O.; Norma, A.R. Energy Savings on an Industrial Building in Different Climate Zones: Envelope Analysis and PV System Implementation. Sustainability 2020, 12, 1391. [Google Scholar]
  52. Yu, D.; Tongyu, Q.; Siyuan, Z.; Lu, H.; Rui, B.; Haibo, G.; Xunzhi, Y. Comparative Whole Building Life Cycle Assessment of Energy Saving and Carbon Reduction Performance of Reinforced Concrete and Timber Stadiums—A Case Study in China. Sustainability 2020, 12, 1566. [Google Scholar]
  53. Andrey, A.; Ben, C. Numerical simulation of thermal mass enhanced envelopes for office buildings in subtropical climate zones. Energy Build. 2016, 118, 214–225. [Google Scholar]
  54. Chinese Standard JGJ/T 346-2014, Standard for Weather Data of Building Energy Efficiency; China Academy of Building Research: Beijing, China, 2014.
  55. Ryu, J.; Kim, J.; Hong, W.; de Dear, R. Defining the thermal sensitivity (Griffiths constant) of building occupants in the Korean residential context. Energy Build. 2020, 208, 109648. [Google Scholar] [CrossRef]
  56. Zhou, L.; Li, N.; He, Y.; Peng, J.; Wang, C.; Yongga, A. A field survey on thermal comfort and energy consumption of raditional electric heating devices (Huo Xiang) for residents in regions without central heating systems in China. Energy Build. 2019, 196, 134–144. [Google Scholar] [CrossRef]
  57. ASHRAE-55:2017, Thermal Environmental Conditions for Human Occupancy; American Society of Heating, Refrigerating and Air-Conditioning Engineering: Atlanta, GA, USA, 2013.
  58. Chinese Standard JGJ 26-2018, Design Standard for Energy Efficiency of Residential Buildings in Severe Cold and Cold Zones; China Academy of Building Research: Beijing, China, 2018.
  59. Xu, J.; Lu, Z.; Gao, W.; Yang, M.; Su, M. The comparative study on the climate adaptability based on indoor physical environment of traditional dwelling in Qinba mountainous areas, China. Energy Build. 2019, 197, 140–155. [Google Scholar]
  60. Liu, T.; Liu, J.; Qiao, Y.; Yang, L.; Liu, Y. Energy-Saving Performance Evaluation Method of Phase Change Heat Storage Wall Room Based on Human Thermal Adaptation. Build. Sci. 2020, 36, 133–139. [Google Scholar]
  61. Liu, Y.; Yan, H.; Yan, M. The Basis of Climate Adaptation for Human Thermal Comfort; Science Press: Beijing, China, 2017. [Google Scholar]
  62. Yao, R.; Li, B.; Liu, J. A theoretical adaptive model of thermal comfort-Adaptive Predicted Mean Vote (aPMV). Build. Environ. 2009, 44, 2089–2096. [Google Scholar] [CrossRef]
  63. Ming, R.; Yu, W.; Zhao, X.; Liu, Y.; Li, B.; Essah, E.; Yao, R. Assessing energy saving potentials of office buildings based on adaptive thermal comfort using a tracking-based method. Energy Build. 2020, 208, 109611. [Google Scholar] [CrossRef]
  64. Chinese Standard GB/T 50785-2012, Evaluation Standard for Indoor Thermal Environment in Civil Buildings; China Academy of Building Research: Beijing, China, 2012.
  65. ISO 7730, Ergonomics of the Thermal Environment—Analytical Determination and Interpretation of Thermal Comfort Using Calculation of the PMV and PPD Indices and Local Thermal Comfort Criteria; International Standardization Organization: Geneva, Switzerland, 2005; p. 48.
  66. DIN EN 15251, Indoor Environmental Input Parameters for Design and Assessment of Energy Performance of Buildings Addressing Indoor Air Quality, Thermal Environment, Lighting and Acoustics. 2007. Available online: http://www.cres.gr/greenbuilding/PDF/prend/set4/WI_31_Pre-FV_version_prEN_15251_Indoor_Environment.pdf (accessed on 20 September 2019).
  67. Tian, X.; Meie, W.; Chao, S.; Weiping, C. Evaluation of the natural attenuation capacity of urban residential soils with ecosystem-service performance index (EPX) and entropy-weight methods. Environ. Pollut. 2018, 238, 222–229. [Google Scholar]
  68. Yan, W.; Gu, L. Application of the method of Entropy proportion in the engineering mark. J. Xi’an Univ. Architect. Technol. (Nat. Sci. Ed.) 2004, 36, 98–100. [Google Scholar]
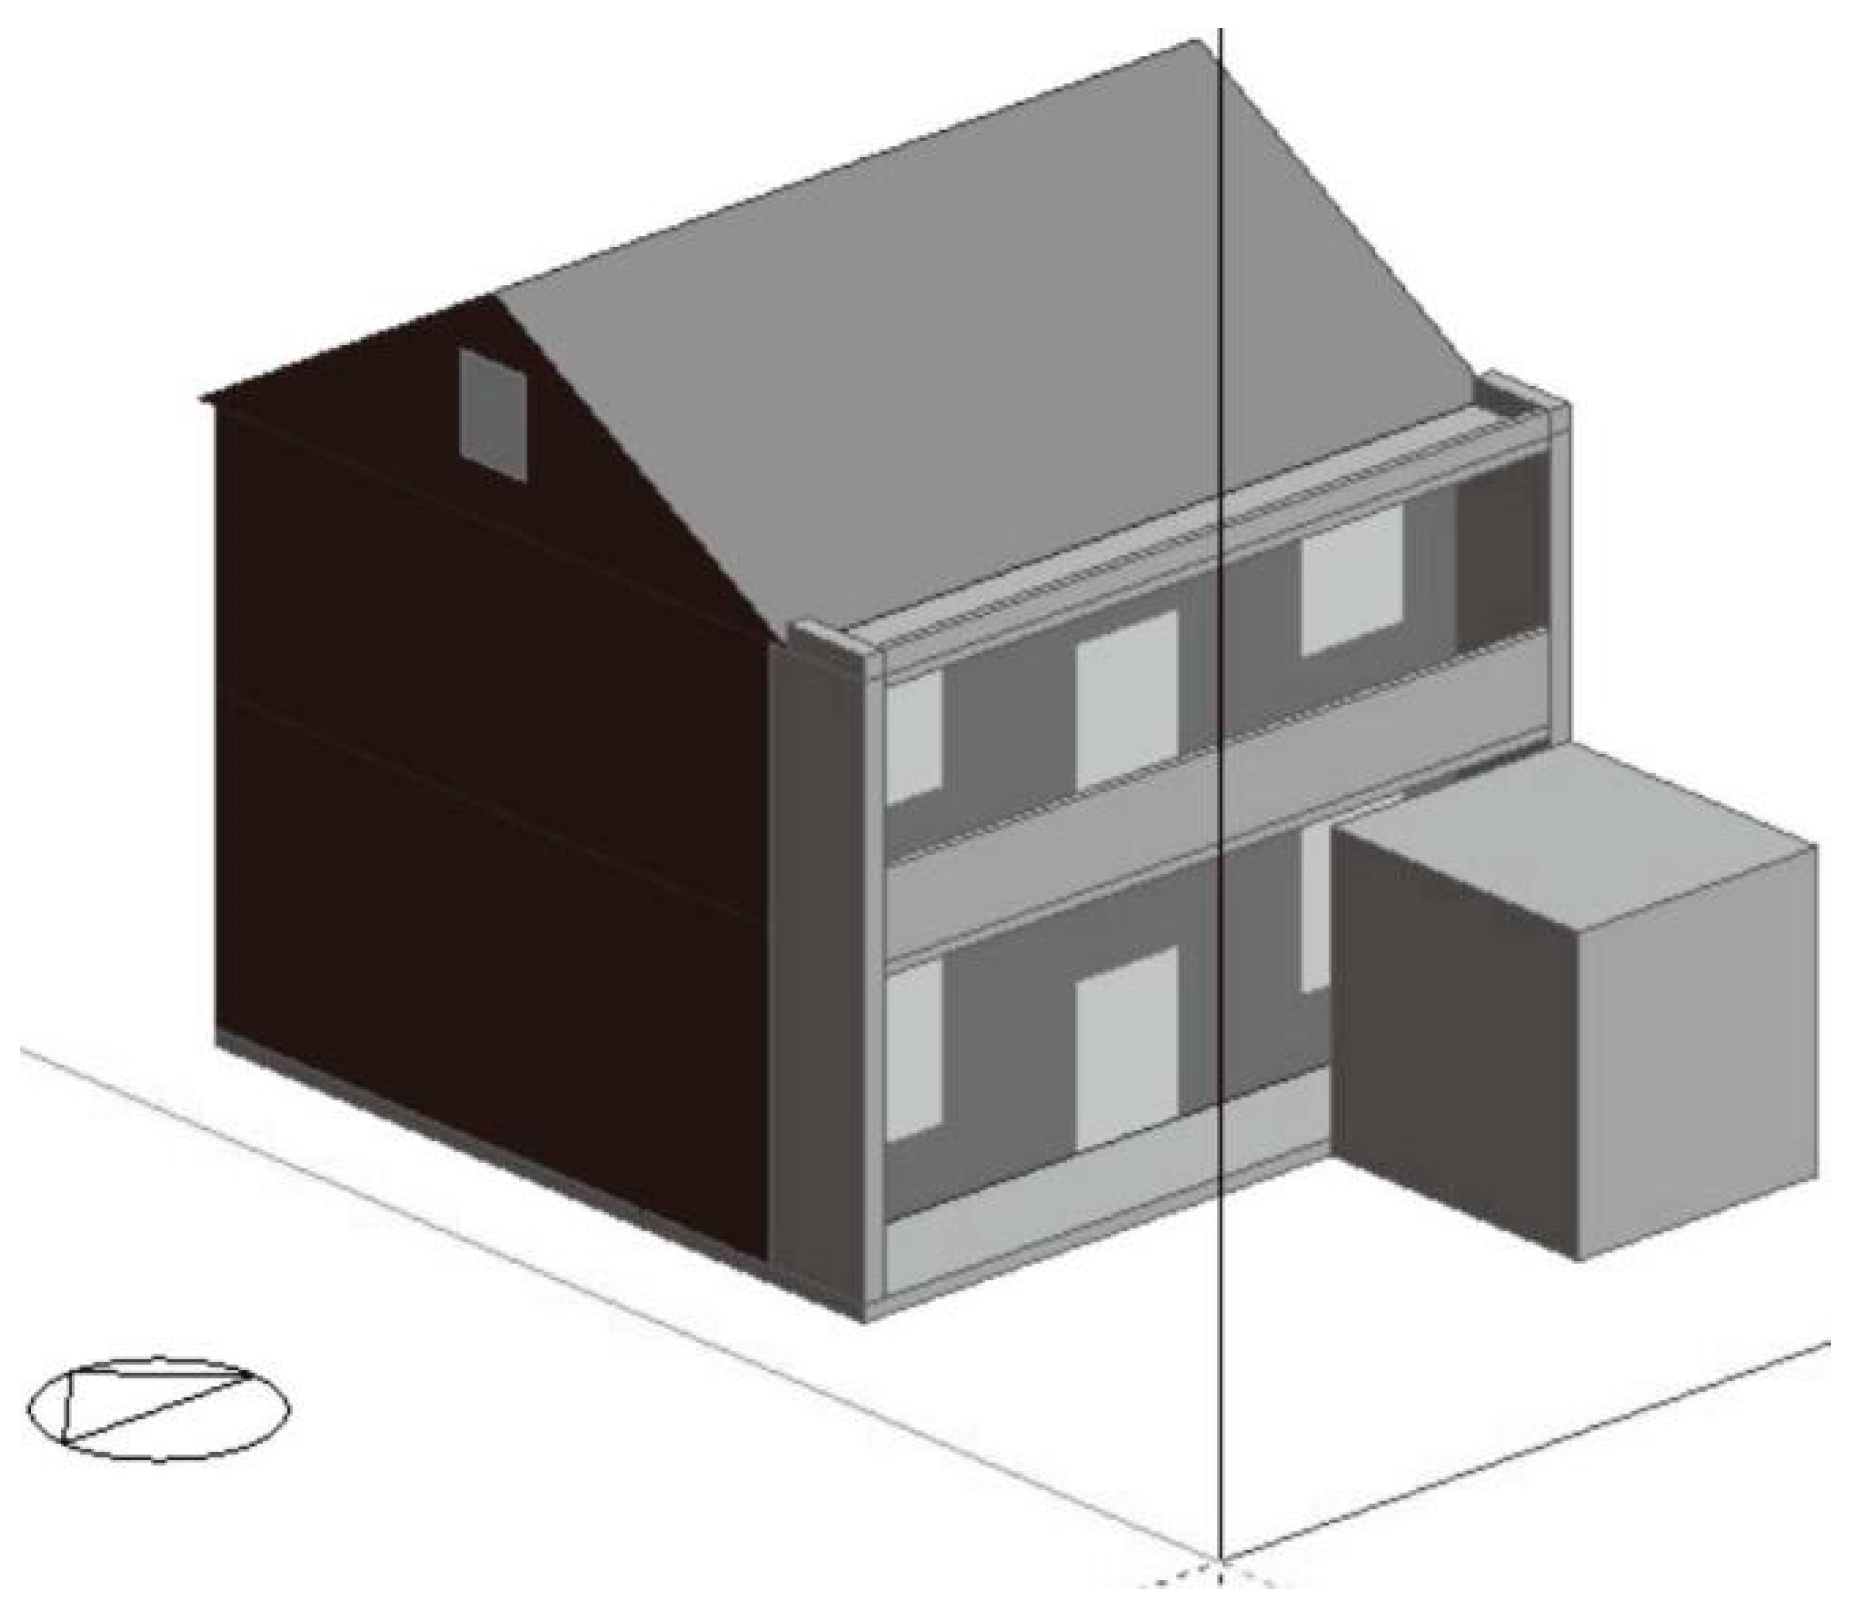
Figure 1. 3D building model.
Sustainability 13 05350 g001
Figure 2. First floor plan.
Sustainability 13 05350 g002
Figure 3. Second floor plan.
Sustainability 13 05350 g003
Figure 4. 1-1 Section plan.
Sustainability 13 05350 g004
Figure 5. Schematic diagram of energy-saving evaluation.
Sustainability 13 05350 g005
Figure 6. Schematic diagram of the thermal comfort evaluation.
Sustainability 13 05350 g006
Figure 7. Retrofit costs of external windows.
Sustainability 13 05350 g007
Figure 8. Energy saving and thermal comfort of the external windows.
Sustainability 13 05350 g008
Figure 9. APMV of the external windows.
Sustainability 13 05350 g009
Figure 10. Retrofit costs of the external walls.
Sustainability 13 05350 g010
Figure 11. Energy saving and thermal comfort of the external walls.
Sustainability 13 05350 g011
Figure 12. APMV of the external walls.
Sustainability 13 05350 g012
Figure 13. Retrofit costs of roofs.
Sustainability 13 05350 g013
Figure 14. Energy saving and thermal comfort of the roofs.
Sustainability 13 05350 g014
Figure 15. APMV of the external roofs.
Sustainability 13 05350 g015
Figure 16. The impact of costs on the energy-saving rate.
Sustainability 13 05350 g016
Figure 17. The impact of costs on the thermal comfort.
Sustainability 13 05350 g017
Figure 18. The impact of costs on the energy saving and thermal comfort of the external window.
Sustainability 13 05350 g018
Figure 19. The impact of costs on energy saving.
Sustainability 13 05350 g019
Figure 20. The impact of costs on the energy saving and thermal comfort of the external wall and thermal comfort of the roof.
Sustainability 13 05350 g020
Figure 21. Proximity values of the external windows.
Sustainability 13 05350 g021
Figure 22. Proximity values of the external walls.
Sustainability 13 05350 g022
Figure 23. Proximity values of the roofs.
Sustainability 13 05350 g023
Table 1. Material settings of reference building envelope.
External Wall (Outside-To-In)Roof (Outside-To-In)External Window
20 mm lime cement mortar
240 mm clay brick
20 mm cement mortar
20 mm concrete tile
35 mm lime cement mortar
5 mm SBS waterproof membrane
120 mm reinforced concrete slab
20 mm cement mortar
6 mm single-layer glass and aluminum window frame
Table 2. Heat transfer coefficients and retrofit costs of external windows.
Window Types 1Uw (W/m2K)C ($/m2) 2
6 mm single layer glass (no break)5.7780
5+6A+5 double insulating glass (no break)3.11541.265
Low-e 6+12A+6 double insulating glass (with thermal break)1.77175.529
6+12A+6 double insulating glass (with thermal break)2.68561.402
6+12A+6+12A+6 three-layer insulating glass (with thermal break)1.75477.574
Low-e 6+12A+6+12A+6 three-layer insulating glass (with thermal break)1.30792.320
1 All window frames are made of aluminum alloy. 2 The cost is construction cost.
Table 3. Heat transfer coefficients and retrofit costs of the external walls and roofs.
Insulation Thickness (mm)Ue (W/m2K)Ur (W/m2K)Costs of External Wall ($/m2) 1Costs of Roof ($/m2) 1
External WallRoof
001.9583.2170.0000.000
5101.7182.2049.001 10.546
10201.531.6769.889 11.913
15301.3791.35210.769 13.281
20401.2551.13311.648 14.649
25501.1520.97512.528 16.017
30601.0650.85613.408 17.384
35700.9890.76314.288 18.752
40800.9240.68815.168 20.120
45900.8670.62616.048 21.488
501000.8160.57516.927 22.855
1 The cost is construction cost.
Table 4. Descriptive statistics of the main indicators.
IndicatorSizeMin.Max.MeanS.D.
J7250.3990.4950.4520.023
ΔS7253608.8514166.2663860.717132.569
C725990.3699047.7166082.6521500.802
Table 5. The fitting equations of the energy-saving rate and retrofit costs.
PositionFitting Equation
External window J = 0.4459 + 4.5466 × 10 6 × C ,   R 2 = 0.6789
External wall J = 0.3481 + 1.7141 × 10 5 × C ,   R 2 = 0.8513
Roof J = 0.3950 + 9.4329 × 10 6 × C ,   R 2 = 0.9157
Table 6. The fitting equations of thermal discomfort degree-hours and retrofit costs.
PositionFitting Equation
External window Δ S = 3905.7751 0.032 × C ,   R 2 = 0.9570
External wall Δ S = 4460.3706 0.0987 × C ,   R 2 = 0.8477
Roof Δ S = 4237.9651 0.062 × C ,   R 2 = 0.9305
Table 7. Entropy analysis of indicators.
IndicatorJΔS (C°·h)C ($)
E0.98920.98880.9884
W0.32180.33280.3454
Table 8. Comparison of the optimal scheme with the benchmark buildings.
Comparison ObjectJΔS (C°·h)C ($)
Benchmark building0.39794185.83400.0000
Optimal scheme0.49263634.57408163.6541
Table 9. The mean proximity values of external windows.
Window Types T i ¯
6 mm single-layer glass (no break)0.4944
5+6A+5 double insulating glass (no break)0.5260
Low-e 6+12A+6 double insulating glass (with thermal break)0.5153
6+12A+6 double insulating glass (with thermal break)0.5071
6+12A+6+12A+6 three-layer insulating glass (with thermal break)0.5119
Low-e 6+12A+6+12A+6 three-layer insulating glass (with thermal break)0.5306
Table 10. Mean proximity values of the external walls and the roofs.
Insulation Thickness (mm) External   Wall   T i ¯ Roof   T i ¯
External WallRoof
000.64440.5322
5100.67330.5535
10200.61930.5360
15300.61930.5230
20400.53370.5134
25500.49930.5067
30600.46940.5020
35700.44320.4990
40800.42020.4974
45900.40020.4967
501000.38210.4970
Publisher’s Note: MDPI stays neutral with regard to jurisdictional claims in published maps and institutional affiliations.