Article

Spatial-Temporal Coupling Coordination Relationship between Urbanization and Green Development in the Coastal Cities of China

1
School of Economics, Ocean University of China, Qingdao 266100, China
2
Marine Development Institute, Ocean University of China, Qingdao 266100, China
*
Author to whom correspondence should be addressed.
Sustainability 2021, 13(10), 5339; https://doi.org/10.3390/su13105339
Submission received: 8 April 2021 / Revised: 7 May 2021 / Accepted: 7 May 2021 / Published: 11 May 2021
(This article belongs to the Section Sustainable Urban and Rural Development)

Abstract

:
With the rapid development of urbanization, coastal cities of China have made significant achievements in economic development. However, the eco-environment of these cities has been under tremendous pressure due to the interference of human activities. Therefore, it is of great significance to find the interrelationship between urbanization and regional development. As an environmental-friendly and social-inclusive way of economic growth, the level of green development (GD) represents the comprehensive status of regional economic, social, and ecological development. As few researchers have studied the relationship between urbanization and GD, especially in the coastal areas, this paper detailed an empirical investigation into the spatio-temporal variations of the coupling and coordination relationship between urbanization and GD in the coastal cities of China. The results showed that: (1) the coupling and coordination relationship is constantly improving, especially in big cities such as Shanghai, Shenzhen, and Guangzhou, all of which have entered into coordination development stage; (2) small prefecture-level cities, mostly agglomerated in the northeast and southwest of China, most of which lagged in urbanization, are still in the maladjusted coordination stage; (3) the contribution to the coordination relationship between urbanization and GD mainly comes from the industrial structure optimization and urbanization. However, at present the eco-environmental protection is not enough to support the coordination development between the two systems. Based on the findings of this paper, a series of policy implications for improving the coordination development between urbanization and GD is proposed.

1. Introduction

Urbanization is a global socioeconomic phenomenon. Due to the accumulation effect of human capital, urbanization provides advanced productivity for economic development, making it the engine of modernization and economic growth [1]. Therefore, urbanization has become one of the important measures to promote economic and social development in many countries. Since the beginning of the 21st century, the world has been in an unprecedent urbanization progress. According to the 2018 Revision of World Urbanization Prospects, global urban population accounted for 55% in 2018, and is expected to reach 68% in 2050, of which more than 90% growth will occur in Asia and Africa, especially in India and China [2]. Meanwhile, the proportion of global urban area in land surface expanded from 0.23% in 1992 to 0.53% in 2013, with the most obvious growth rate in Asia [3]. The expansion of urban population and built-up area brought increasing pressures to the ecological environment. It is urgent for many countries to balance urbanization and regional sustainable development.
Since the reform and opening-up, China’s urbanization has made great progress [4]. The urban population has more than tripled from 1978 to 2016, with the urbanization rate increasing from 17.9% to 57.3% [5]. The rapid development of urbanization has a significant effect on both the socio-economic and ecological systems. Like the urbanization progress in developed countries, China’s urbanization experienced the process of surplus labor transferring from rural areas to urban cities, accelerating the process of urban industrialization and non-agricultural industrial agglomeration. The economic phenomena accompanied by urbanization, such as infrastructure investment, consumption market expansion and modern service system improvement, have a positive impact on China’s economic growth and industrial structure upgrading [6,7]. Obviously, under the promotion of urbanization, China has basically realized the distribution of labor and capital elements through the market mechanism [8]. However, with the expansion of urban population and area, industrial development accelerates, resulting in air and water pollution [9], land use disorder [7], imbalance of regional development [10], and other ecological and social problems. Green development (GD), as the primary model of ecological civilization, aims at the common development of economic, society and ecological systems. It provides guidance for China to resolve the resource and environmental bottleneck and has been listed as one of its five major development goals in its 13th Five-Year Plan to achieve sustainable and high-quality development goals [11]. Obviously, the expansion of urbanization blocks China’s GD, and the coordinating development of urbanization and GD is the main development direction of Chinese cities.
This paper studied the spatial and temporal characteristics of the coupling and coordinating development between urbanization and GD of 53 coastal cities in China in the year of 2006, 2011, and 2016. Firstly, related materials were introduced, after which evaluation index systems were constructed, and adjustment methods were provided. Secondly, spatial-temporal variations of urbanization and GD, together with their interactions at city levels, were presented and analyzed. Thirdly, factors affecting the coordinating development of urbanization and their spatial variation were analyzed based on the geographical weighted model. The discussion, policy recommendation and conclusions were presented in the final part.

2. Literature Review

The need to balance human activities and natural ecology promoted the introduction of sustainable development strategies such as the “21st century agenda”, which has led to the global acceptance of sustainable development concepts. With the abnormal climate change since the 21st century, all countries have taken a collaborative effort to deal with this human crisis. Green economy, green growth, green development, and other concepts gradually appeared as a result with the development mode of most countries increasingly turning green [12,13]. The concept of green economy can be traced back to the 1980s and has received increasing attention since the financial crisis in 2008 [14]. The United Nations Environment Program defines it as “low-carbon, resource efficient and socially inclusive” and “… one that results in improved human well-being and social equity, while significantly reducing environmental risks and ecological scarcities” [15]. In addition, the World Bank emphasizes that green economy has four effects, namely, input effect, efficiency effect, stimulus effect, and innovation effect. The concept of green growth was first presented by the United Nations Economic and Social Commission for Asia and the Pacific in 2005 and is defined as “fostering economic growth and development while ensuring that natural assets continue to provide the resources and environmental services on which our well-being relies” [16]. Unlike the economic growth theory characterized by increase of GDP or social welfare, green growth is more beneficial to the economy, environment, equilibrium, and sustainability [17]. Generally, the concept of GD is regarded as the second generation of sustainable development concept. The World Bank defined GD as an environmentally friendly and socially inclusive growth model that aims to reduce pollution emissions and improve the use efficiency of natural resources [18]. These three concepts are highly similar, and all emphasize the coordinated relationship among economy, society, and environment in development. Among them, GD is most prevalent in China, and has been proposed as a developmental ideology. Scholars have made in-depth theoretical analysis focused on the connotation and spatio-temporal evolution track of GD [19,20]. Also, researchers have investigated some practical issues keen on the influence mechanism, comprehensive development levels, and development efficiency of GD [21,22]. The Chinese government has incorporated “promoting green development and harmonious coexistence between humans and nature” into the 14th five-year plan for national economic and social development and the long-term goal of 2035. In this condition, Wen [23] defined green development as one development status that is aimed at improving the quality of economic development, satisfying people’s multidimensional desires, and creating a clean and beautiful environment. As one guiding concept of national development, GD takes important roles in the urban construction in China. As a comprehensive concept including economic, society, and environment, the sustainable development is usually measured by two paradigms: linear-based synthesis and nonlinear-based synthesis approaches [24]. Compared with the nonlinear-based measures, which mainly rely on data envelopment analysis (DEA) in measuring and evaluating the sustainable development efficiency [25], linear-based synthesis measures such as indicator-based approaches are more prevalent in evaluating the degree of sustainable development as well as GD [21,26,27,28].
Urbanization was conceptualized as a process of change over time in size, density, and heterogeneity of human settlements [29]. It entails a shift in populations scattered in small rural settlements with agriculture as the dominant economic activity towards larger urban settlements supported by industrial and service activities [30]. The rapid urbanization process accelerated the concentration of population in urban areas, and led to a series of problems, such as population concentration, traffic jam, resources shortages, and environmental pollutions [31,32]. Scholars are increasingly aware of the importance of sustainable urban development and have discussed existing problems towards sustainable urbanization as a theoretical framework based on theories such as Parker’s urban ecological theory and Howard’s pastoral city theory [33,34,35]. In the practical approach, Ghorab [36] proposed a plan to develop a new ecological green city for the Egyptian government. Bakirtas [37] provided a reference for policies related to urbanization in global emerging market countries after evaluating the causal relationship between energy consumption, urbanization, and economic growth. In China, the rapid urbanization has seriously aggravated the pressure on the regional sustainable development, making it urgent to reduce the impact of urbanization on the ecological system and achieve regional green development.
Interactions between urbanization and subsystems of GD (socioeconomic and socioecological systems) have been widely researched by scholars. Prior research on the interactions between urbanization and socioeconomic system generally point out that there is a significant positive correlation between the two systems [38]. For example, Spence [39] recognized that urbanization helps upgrading industrial structure and increasing per capital income. Dyson [40] opined that urbanization plays an important role on improving social service and promoting economic development. Deng [41] opined that urbanization makes the upgrading of industrial structures, the change of ecological environment and the realization of scale economy feasible, thus affecting the quality of regional economic growth. Since the excessive urbanization seriously aggravated the sustainable development of society and ecosystems, a growing number of researchers have explored the interactions between the urbanization and socioecological systems. For example, Zinia and Mcshane found [42] that the rapid urbanization in Dhaka, Bangladesh, had a serious impact on the ecosystem, and provided a direction for future development after the comprehensive evaluation of the social, economic, and environmental aspects of urban development. Rashid [43] found that urbanization and sustainable development gradually deviated in Rawalpindi and proposed a series of energy saving measures. Song [44] opined that rapid urbanization gives rise to ecological problems due to the expansion of human activities. Yu [45] found an “N” shaped relationship between urbanization and eco-efficiency in Chinese prefecture-level cities. Particularly, the coupling mechanism of urbanization and ecosystem has received widespread attention from researchers. Liu [46] proposed a framework called Coupling Rubik’s Cube to illustrate the coupling mechanism between urbanization and the ecological system. Tian [47] proposed a conceptual framework of the coupling system between urbanization and ecological service. Since GD puts forward to a synthetical demand for the coordinated development of economic growth and ecological environment, the coupling relationship of urbanization and GD is more complex compared to the interaction with the socioeconomic and socioecological subsystems. Thus, research of the coupling relationship between urbanization and GD is not only an expansion of prior studies, but also a practical demand for the coordination of urbanization and sustainable development.
Factors affecting the interaction between urbanization and socioeconomic systems have been researched by scholars. Zhou [48] found that urban population, investment, and consumption play a critical role in promoting the coupling relationship of urbanization and economic growth in China. Xu [49] opined that economic development, traffic conditions and population agglomeration are the three main factors that determine coupling coordination within the urbanization subsystems. Wang [23] considered that key factors like the urban green space rate, per capital water availability, and industrial emissions forced the interactive relationship between urbanization and ecological environment in China. Zhang [50] found that both social and spatial urbanizations have greatly obstructed the coordination of urbanization and resource security systems. Equally important, the spatial characteristics of influencing factors are verified by spatial econometric model such as spatial Durbin model and spatial autocorrelation analysis in the above studies. Since urbanization process exists in spatial autocorrections [51], local green development is likely to be affected by neighboring urbanizations. Multiple complex components in socioeconomic and socioecological systems are connected and impacted by material, capital, and information flows, making the GD transcend a geographical boundary [52]. Under the premise of realizing the coordinating development of urbanization and regional sustainable development, it is of great significance to clarify the spatial pattern of influencing factors on the coupling and coordinating development between urbanization and GD.

3. Materials and Methods
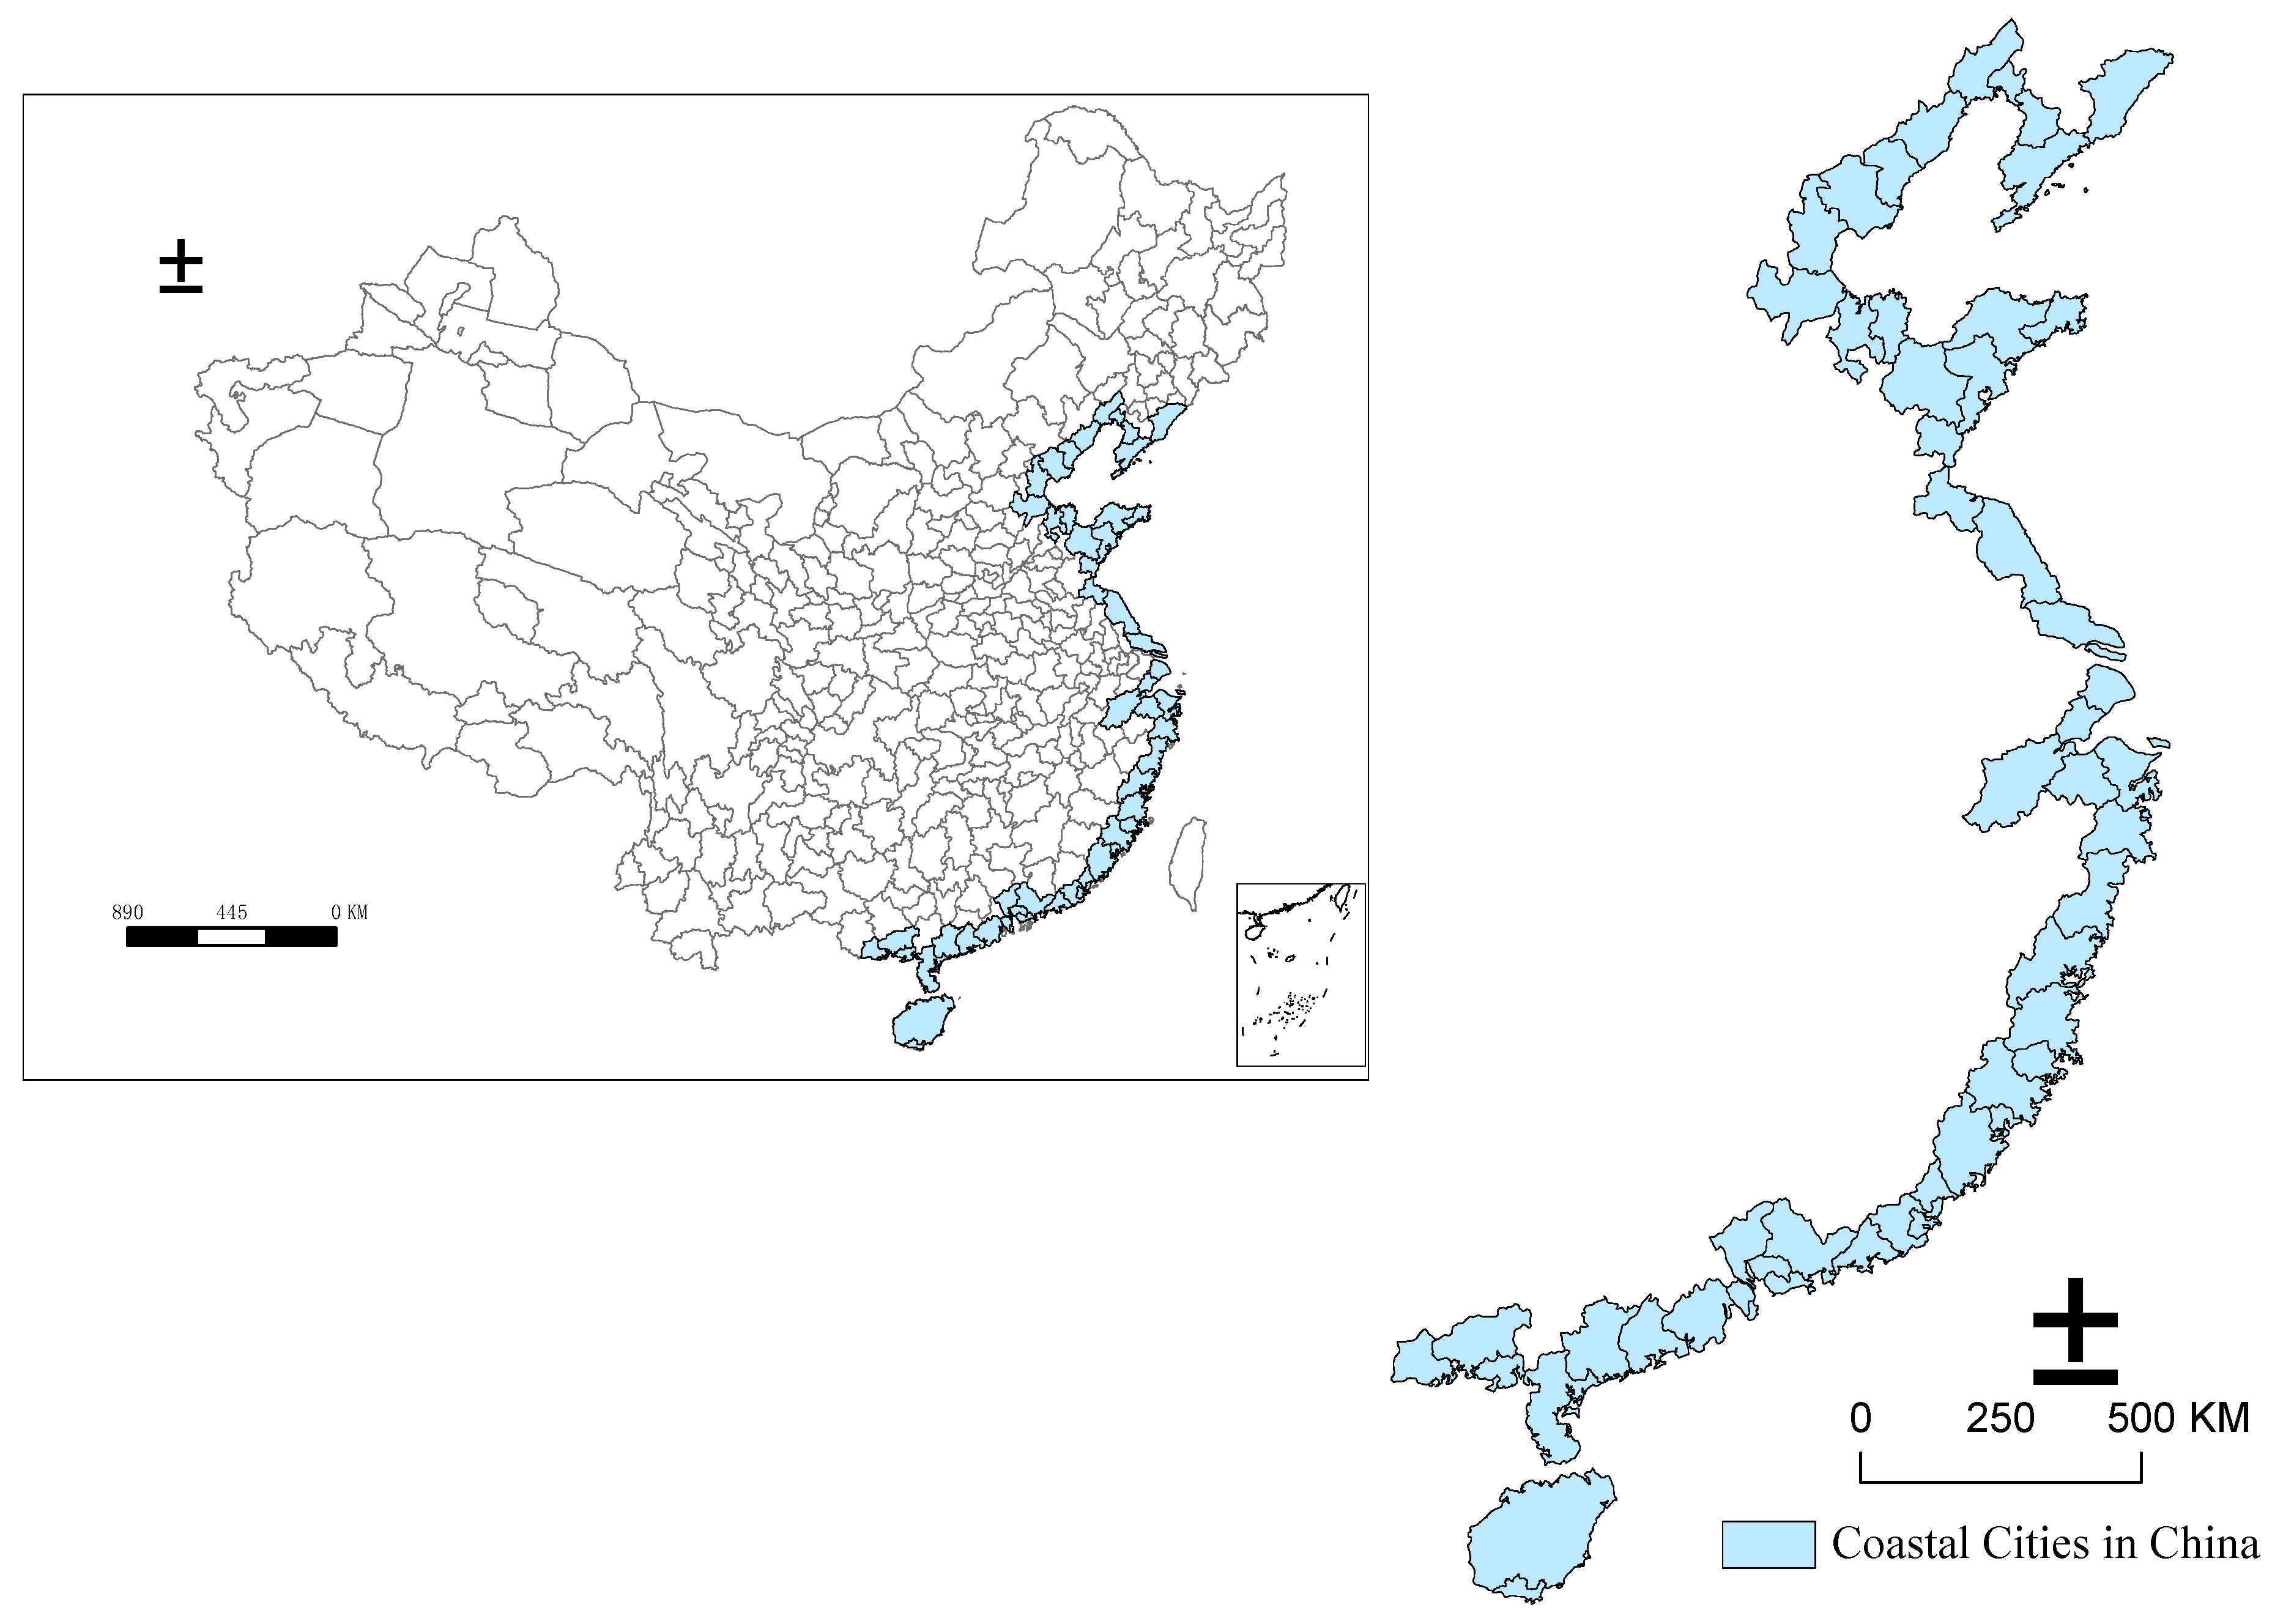
3.1. Study Area

As the pioneer area of China’s reform and opening-up policy, the coastal cities have developed with high degree of openness, strong economic growth, and convenient lifestyle, which has greatly attracted the employment-population from the inland areas of China [53]. With dense population and concentrated economic activities, eastern China is an area with one of the most intense urban expansion in the world [54]. With the rapid development of urbanization and population migration, the ecological environment of the coastal cities has been under great pressure in response to the human activities. There are 53 cities in the coastal zones of China, including 2 municipalities, 7 sub-provincial cities and 44 prefecture-level cities (Figure 1), concentrated in more than 50% of China’s large cities, and accounting for more than 40% of its population. It is accounted for more than 60% of its GDP [55]. The diversified urban scale and human activity intensity of coastal cities make it important examples to understand the impact of urbanization on reginal sustainable development [56]. Based on the above, we chose the 53 coastal cities as the study domain to find the coupling and coordinating relationship of urbanization and GD in China.

3.2. Construction of Indicator System and Data Sources

Generally, scholars believe that urbanization has multiple dimensional implications, including socioeconomic performance enhancement, demographic increase, and landscape expansion in urban areas [57]. Inspired by prior researches, we established a preliminary index system of urbanization (Table 1) based on the principles of scientificity, comprehensiveness, objectivity, and data availability. Referring to the existing literature [23,58], we chose non-agricultural output representing economic urbanization, non-agricultural population representing demographic urbanization, and urban built-up area representing landscape urbanization. Furthermore, the weight of each indicator was determined by the entropy weight method, which is specifically introduced in Section 3.3 in this paper.
Considering GD is a complex process, scholars were committed to establishing an appropriate index system to evaluate, monitor and guide regional development. Estella [59] applied a green growth measurement indicator system, including five dimensions and 12 basic indicators to evaluate green growth in OECD and Korea. Cheng [60] constructed an indicator system covering 21 indicators relating to natural resources, ecological environment, energy consumption and conservation, economic and social sustainability, and human health. Referring to previous literatures [19,61], we constructed a preliminary indicator system including 12 basic indicators, which point to economic development, social progress, ecological protection, and resources consumption (Table 1). Furthermore, the weight of an indicator was also determined by the entropy weight method.
All the data were collected from China City Statistical Yearbook in 2007, 2012, and 2017 and the statistical bulletin of national economic and social development of each city. All the data sets were further normalized through the method of addressing data with extreme differences clarified as formulas (2) and (3) in Section 3.3.1.

3.3. Methods

3.3.1. Entropy Weight Method

As an efficient comprehensive index evaluation method, the entropy weight model (EWM) has been widely applied in sustainable development capacity assessment and eco-environmental vulnerability assessment [28,62]. To discover the coupling coordination development (CCD) of urbanization and GD, we firstly used EWM to assess the urbanization and GD level of the 53 coastal cities. Considering that there are n regions and k variables of the urbanization system, then the urbanization system matrix X can be established as shown in Equation (1).
X = ( x 11 x 1 k x n 1 x n k ) , i = ( 1 , 2 , , n ) , j = ( 1 , 2 , , k )
To eliminate the dimension and unit, we used the method that addresses data with extreme differences, shown as formulas (2) and (3).
Positive indicator:
y i j = x i j min ( X j ) max ( X j ) min ( X j )
Negative indicator:
y i j = max ( X j ) x i j max ( X j ) min ( X j )
The standardized matrix is given in Equation (4).
Y = ( y 11 y 1 k y n 1 y n k ) , i = ( 1 , 2 , , n ) , j = ( 1 , 2 , , k )
Then, the j-th variable’s entropy value can be calculated as formulas (5) and (6).
p i j = y i j i = 1 n y i j
E j = ln ( n ) 1 ( i = 1 n p i j ln ( p i j ) )
In formula (6), to ensure all variables’ entropies can be obtained, we defined lim p i j 0 p i j ln ( p i j ) = 0 when Pij = 0. With each entropy value, the entropy weight of each variable can be calculated as formula (7).
w j = 1 E j j = 1 k ( 1 E j )
The urbanization degree of different cities can be calculated with the standardized data Y and the entropy weight value shown as formula (8). It should be noted that the degree of green development of the 53 cities (Gi)were calculated in the same method.
U i = j = 1 k w j y i j

3.3.2. Relative Development Model

The relative development of urbanization and GD is of vital importance to the coordinating development of the two systems. Considering that the spatio-temporal characteristics of the relative development level of urbanization and GD objectively reflected the development trend of the relationship of the two systems in the coastal cities, we introduced, the relative development model (RDM) to assess the relative development of the two systems [63]. The relative development index of urbanization to the GD is calculated by formula (9).
β i = U i G i
where βi is the relative development degree (RDD). Ui and Gi is the comprehensive development indices of urbanization and GD calculated by the EWM. The relative development level of urbanization and GD was divided into 3 levels, as shown in Table 2.

3.3.3. Coupling and Coordination Model

Based on the capacity coupling system model in physics [64], coupling and coordination model (CCM), which is used to reflect the interdependence and restriction among systems, has been widely applied in social economics, biology, agriculture, ecology, and other fields. Moreover, it has been used in assessing interrelationship between urbanization and eco-environment [65], atmospheric environment [66], energy environment [67], and social economic development [68]. Considering the interdependence and restriction between urbanization and GD, we introduced the CCM to explore their interrelationship [65,66,67,68]. Firstly, the coupling degree is calculated as formula (10).
C = U G ( U + G ) 2
where U represents urbanization and G represents GD; C is the coupling degree between urbanization and GD. The larger the value of C, the better interacted the urbanization and regional green development.
Secondly, the coupling coordinating model is introduced to objectively reflect the coordination relationship between urbanization and green development. The formula is:
D = C ( α U + β G )
where α is the weight coefficient of urbanization and β is the weight coefficient of GD. Considering that urbanization and GD are equally important to the coordination of the two systems, we defined the same weight of the two subsystems (α = β = 0.5) [69]. D represents the coupling coordination degree, the higher the value, the higher the level of the coordination development between the two systems. To better describe the coordination status between urbanization and GD, we classified the coordination degree into 10 status shown as Table 3 [70].

3.3.4. Geographical Weighted Regression Model

Geographically weighted regression model (GWR) is a kind of spatial linear regression model that improves on OLS model by introducing the spatial position of observations into regression parameters. Based on the global regression model, the local regression estimation of each parameter can better describe the non-stationary phenomenon of each parameter in different spatial positions. Thus, the regression results are more accurate in reflecting the influence degree of each variable. The basic form is represented as Equation (12) [71].
Y i = β 0 ( U i , V i ) + β k ( U i , V i ) x i k + ε i
where Yi is the estimated value calculated from the independent variable xik. Ui represents the latitude data and Vi represents the longitude value of a specific location i. βk represents the parameter vector to be estimated and is a function of the geographic location (Ui, Vi). In particular, β0 represents the constant term. εi represents the random error term of the i-th region, which satisfies the assumptions of spherical disturbance terms including zero mean, homoscedasticity, and mutual independence.
The variations of geographical scale and socio-economic development lead to significant differences of urbanization and GD in 53 coastal cities. Considering that there may be spatial variations of the driving factors of the coordinated development of the two systems, we introduced the GWR model to explore the influencing mechanism. We chose per capital GDP, third production ratio, expenditure for science and technology, green area, and urban built-up area to represent EDL (economic development level), IDL (industry development level), TDL (technology development level), EEP (ecology and environmental protection), and URB (urbanization built), respectively, in defining the dependent variables [72]. The formula is shown as:
Y i = β 0 ( U i , V i ) + β 1 ( U i , V i ) E D L + β 2 ( U i , V i ) I D L + β 3 ( U i , V i ) T D L + β 4 ( U i , V i ) E E P + β 5 ( U i , V i ) U R B + ε i
where Yi is the coupling coordination degree of the 53 coastal cities, which was calculated by the CCM; β1(Ui, Vi), β2(Ui, Vi), β3(Ui, Vi), β4(Ui, Vi), and β5(Ui, Vi) represent the regression coefficients of EDL, IDL, TDL, EEP, and URB, respectively. To get the regression coefficients of each variable, this paper operated the GWR model through the Arc GIS software, using the “adaptive” kernel type method to set the AIC bandwidth.

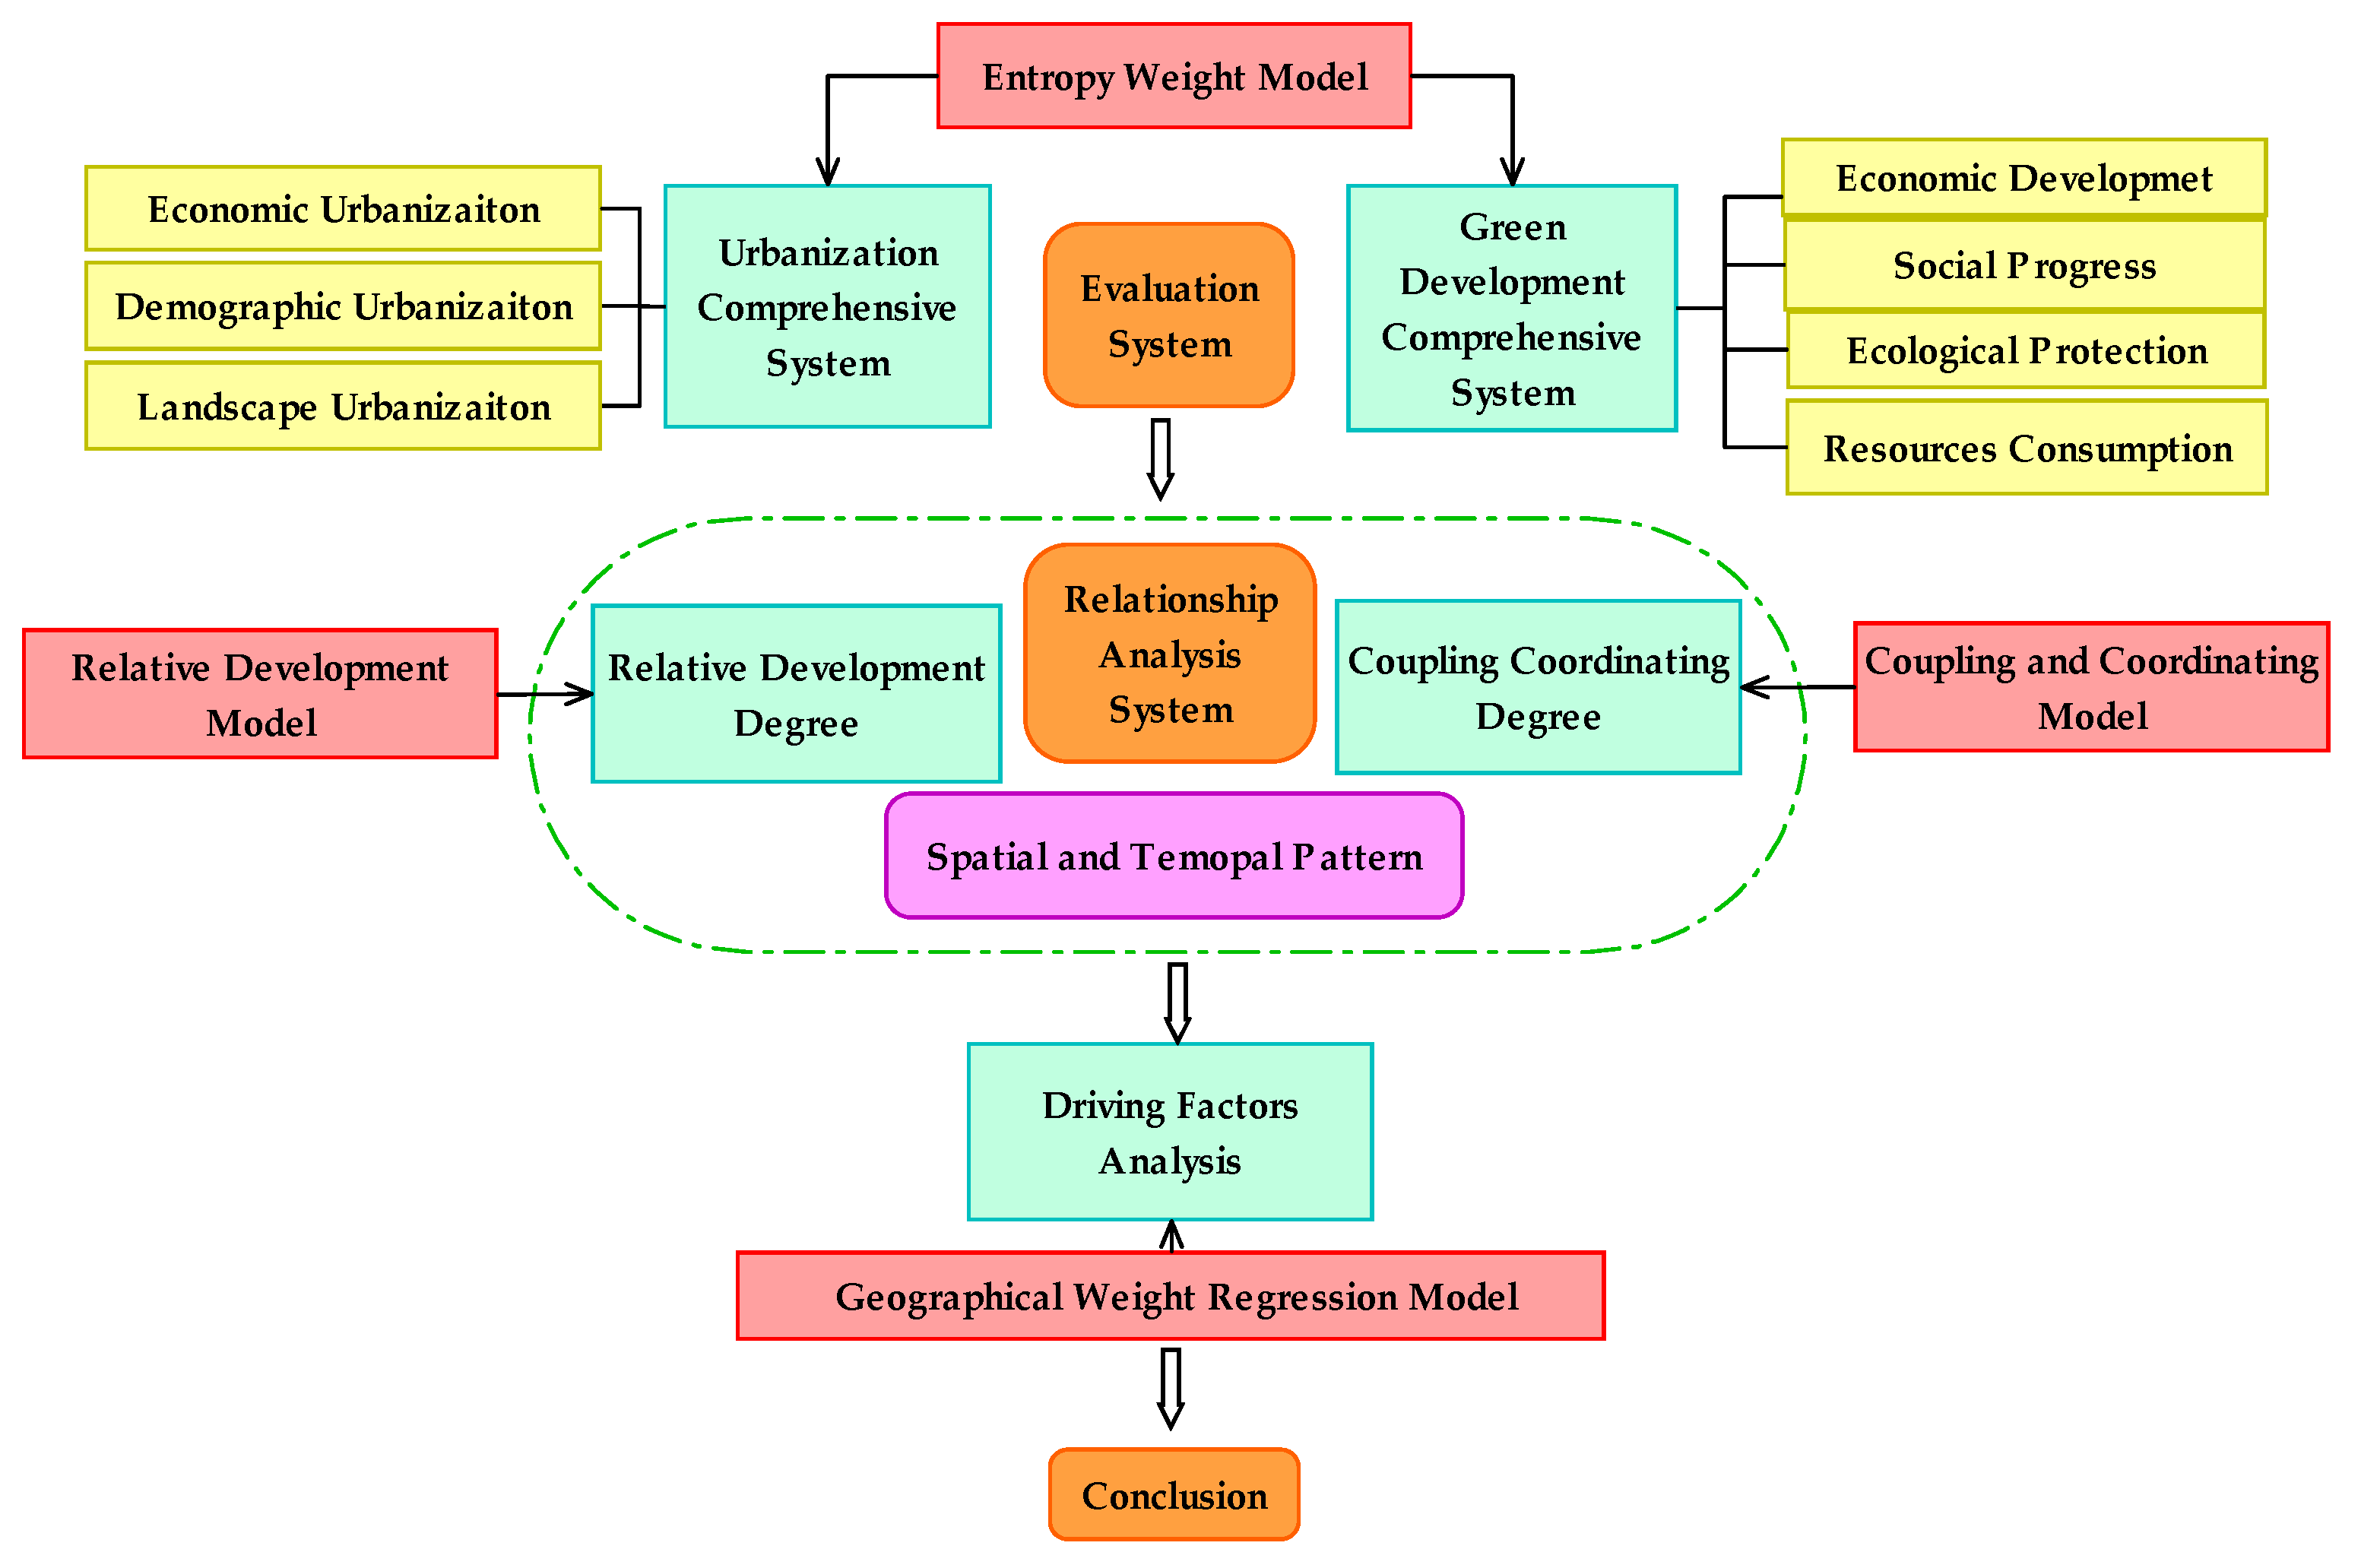
3.4. Research Framework

To determine the quantitative interrelationship between urbanization and GD of the 53 coastal cities in China, we collected data of year 2006, 2011 and 2016 in this paper. Firstly, we constructed an urbanization index system from three aspects (economic urbanization, demographic urbanization, and landscape urbanization) and a GD system from four aspects (economic development, social progress, ecological protection, and resources consumption). Based on the index system, we identified the spatial-temporal characteristic of urbanization and GD of the 53 coastal cities by applying the EWM. Secondly, the relative development degree of urbanization and GD was identified by applying the RDM, and the coupling and coordination degree was identified by applying the CCM. In this section, we focused on the spatial variation of the relative development classification, and the coordination evolution, conditions, and types of urbanization and GD. Thirdly, the factors influencing the coordination of urbanization and GD and their spatial characteristic was identified by applying the GWR model. Finally, we drew the conclusion of the full text and tried to offer scientific suggestions for achieving the coordination development between urbanization and GD. Figure 2 briefly illustrate the framework of this research.

4. Results

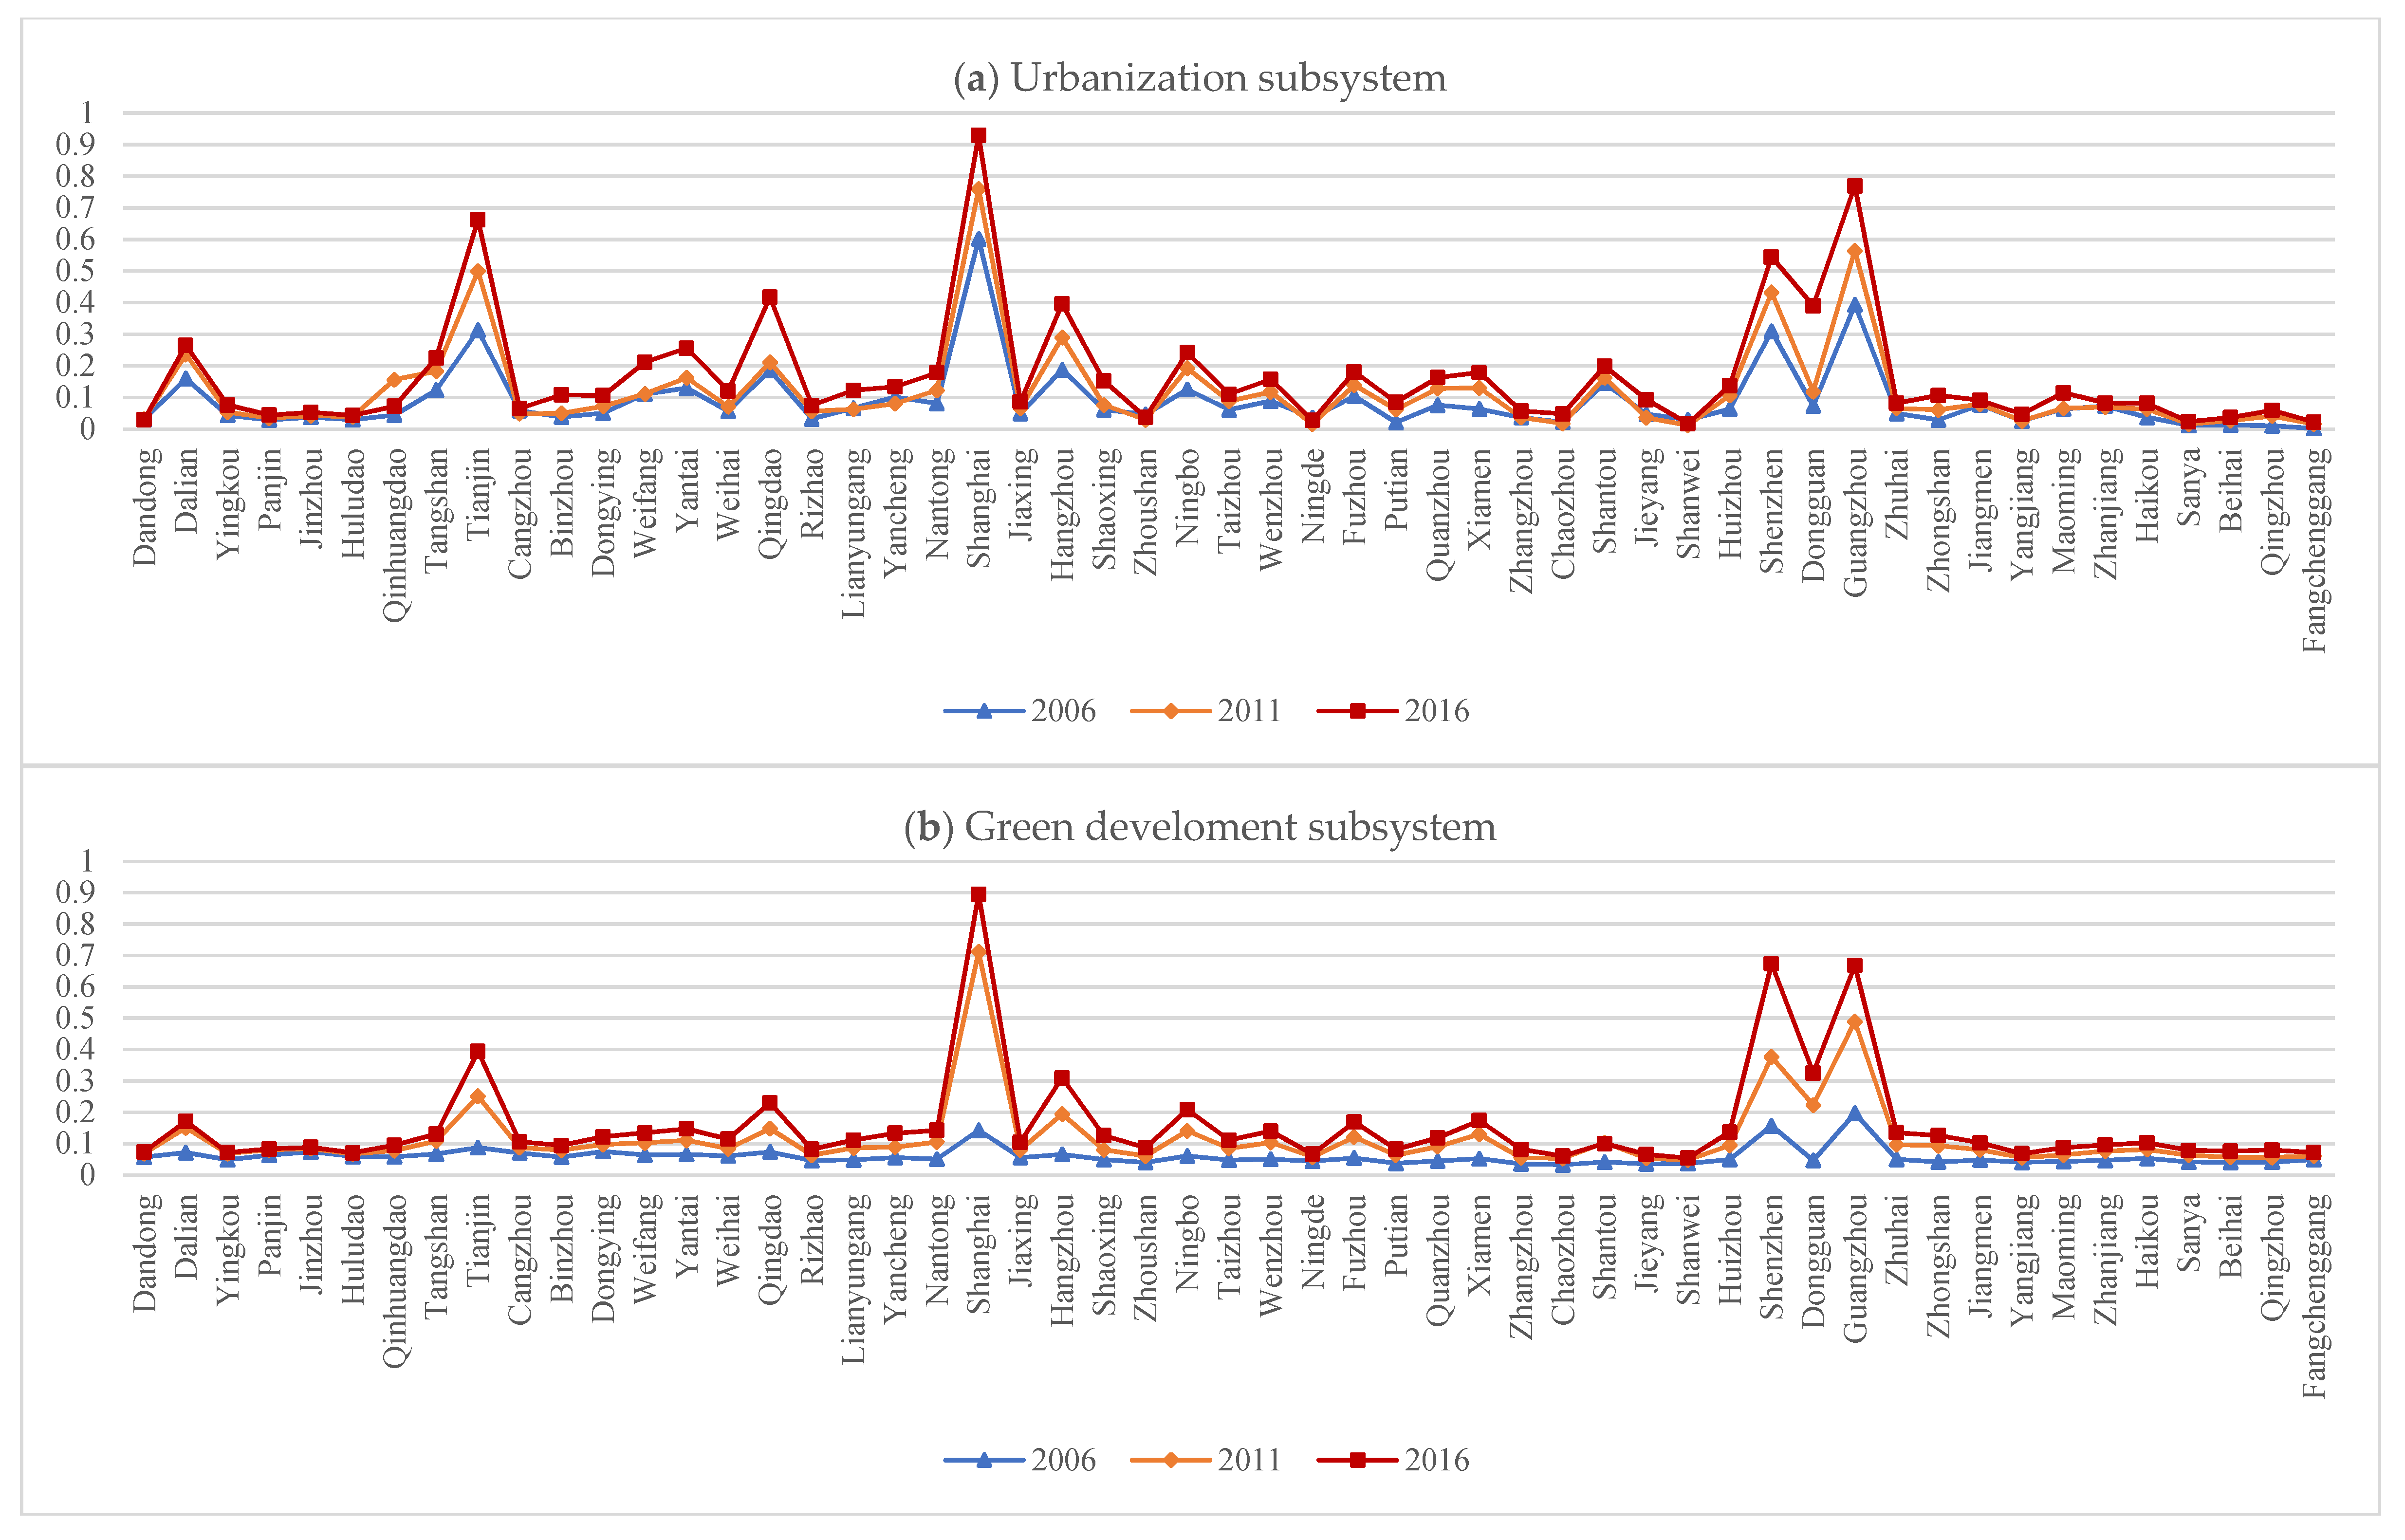
4.1. Spatial-Temporal Characteristics of Urbanization

The calculation results of all dimensions of urbanization presented an upward trend of the 53 coastal cities (Table 4). Among them, economic urbanization (U1) and demographic urbanization (U2) experienced the largest (216.67%) and smallest (31.43%) increases, respectively. Moreover, landscape urbanization (U3) made the greatest contribution to the urbanization degree among all the years, with an increase of 88.89%.
As shown in Figure 3a, the spatial distribution of the urbanization degree of the 53 cities in the study period was basically the same, whereas the spatial distribution of the urbanization degree within the cities was significantly different. The two municipalities (including Shanghai and Tianjin) and six sub-provincial cities (including Guangzhou, Shenzhen, Hangzhou, Qingdao, Dalian, and Ningbo) had the highest degree of urbanization. Some prefecture-level cities, such as Cangzhou, Dandong, and Zhoushan had quite low degree of urbanization, with average values less than 0.1 in all three years. Meanwhile, Shanghai, Tianjin, Guangzhou, and Shenzhen had the largest increase from 2006 to 2016, meaning that, the discrepancy of urbanization degree was enlarging among the coastal cities. Due to the advantages in economic development and governmental policy, municipalities and sub-provincial cities are more attractive to rural labors and resources such as capital and techniques. On the contrary, prefecture-level cities especially these in small size, are quite weak in attracting rural labors. Moreover, limited by production and market size, small cities have quite low level of accommodation for vast population, resulting in the low level of urbanization and growth. The results were preliminary consistent with Li’s [73] findings, that urbanization is spatially correlated with land area, population, and GDP.

4.2. Spatial-Temporal Characteristics of GD

The calculation results of the four dimensions of GD of the 53 coastal cities generally showed an upward trend (Table 4). Among them, economic development (G1) had the highest increase of 333.33%, and ecological protection (G3) had the smallest increase of 47.83%. Ecological protection made the highest contribution to the total degree of GD in 2006, and resources consumption made the highest contribution in 2011 and 2016.
As shown in Figure 3b, the spatial distribution of the degree of GD of the 53 cities in the three years was basically the same. The degree of GD of Shanghai was the highest in the three years, with an average value of 0.584. Guangzhou, Shenzhen, Hangzhou, Qingdao, Dalian, and Ningbo also had quite a high degree of GD in these three years. Some prefecture-level cities, such as Dandong, Huludao, Sanya, Beihai, and Fangchenggang had quite low level of GD, all below 0.1 in these three years. It can be concluded that GD had a quite similar spatial characteristic with the urbanization, in that high value concentrated in municipalities and sub-provincial cities, while low value concentrated in small size prefecture-level cities. Temporally, the degree of GD of the 53 coastal cities all showed a generally upward trend, with big cities such as Shanghai, Guangzhou, and Shenzhen having a higher increase than the other cities. It is indicated that the correlation between GD level and economic development of the coastal cities is generally positive. That is because cities with higher economic development levels, such as Shanghai, Guangzhou, and Shenzhen are better equipped with infrastructure and have stricter environmental regulations. Thus, they performed better in social progress, ecological protection, and resources consumption.

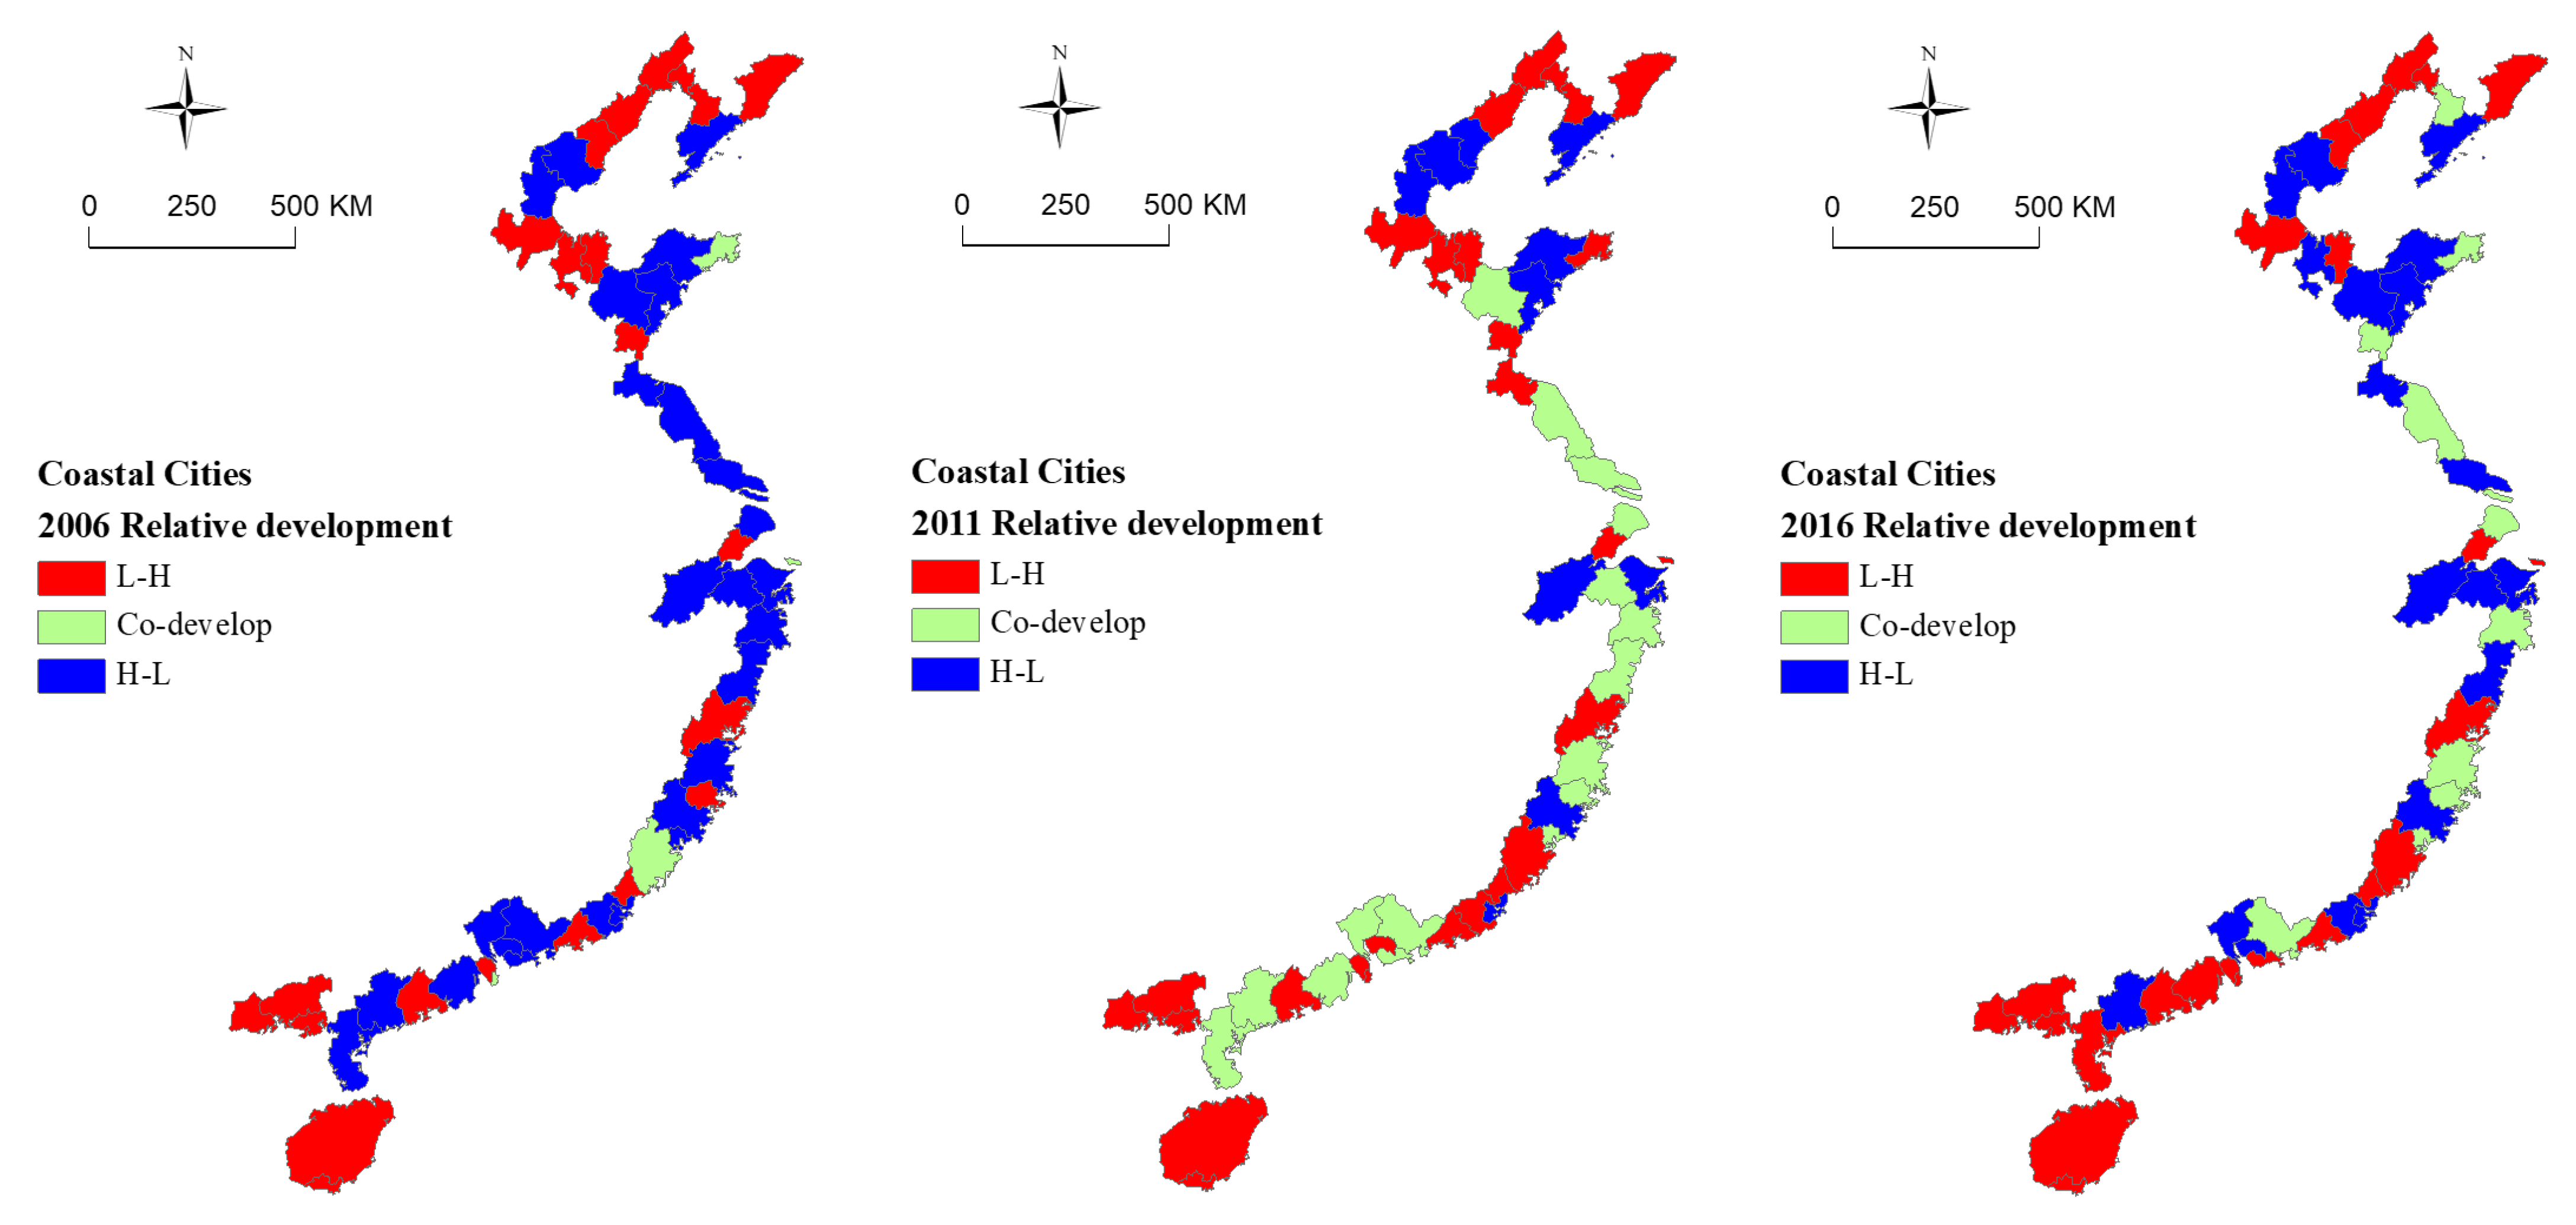
4.3. Spatial-Temporal Relative Development Degree of Urbanization and GD

Figure 4 which shows the spatial-temporal characteristic of the relative development degree of urbanization and GD of the 53 coastal cities, presents significant spatial differentiations in the three years. Specifically, 22 cities, such as Fangchenggang, Qingzhou, and Beihai lagged in urbanization in 2006. The cities with synchronous development were Weihai, Zhuhai, Zhangzhou, and Zhoushan. The remaining cities mostly had larger scale in landscape and population, of which the majority are in advance economic development stages, lagged in green development. These cities entered urbanization accelerated development period in 2006. In contrast, the progress of infrastructure improvement and ecological environment protection was slower, making the degree of GD lag.
In 2011, the relative development of urbanization and GD significantly improved, 16 cities (including Yancheng, Zhanjiang, Shaoxing, Jiangmen, Putian, Xiamen, Maoming, Taizhou, Shanghai, Weifang, Huizhou, Wenzhou, Shenzhen, Fuzhou, Guangzhou, and Nantong) were in the synchronous development period. 27 cities, such as Sanya, Fangchenggang, Ningde, and Chaozhou, most of which were in low degree of urbanization in 2006, lagged in urbanization development. The remaining cities, including municipality (Tianjin), sub-provincial cities (Qingdao, Ningbo, Hangzhou, and Dalian), and prefecture-level cities (Quanzhou, Yantai, Shantou, Tangshan, and Qinhuangdao), lagged in GD. Based on the RDD results in 2006 and 2011, it can be concluded that most cities were slowing down in urbanization progress, and paying more attention to the harmonious development of economic and ecological systems. Spatially, big cities such as Shanghai and Shenzhen improved preferentially, tightly followed by middle-size cities, and small-size cities showed insignificant improvement.
In 2016, 24 cities, mostly agglomerated in northeast and southwest of China, most of which lagged in urbanization in 2006 and 2011, such as Sanya, Fangchenggang, Shanwei, and Dandong still lagged in urbanization. 16 cities (including Rizhao, Taizhou, Yancheng, Huizhou, Xiamen, Shanghai, Putian, Weihai, Yingkou, Fuzhou, Lianyungang, Wenzhou, Guangzhou, Binzhou, Ningbo, and Dongguan) were in the synchronous development period. The remaining 13 cities, including the 10 cities which lagged in GD in 2011, had a high level in urbanization construction. Based on the RDD results in 2011 and 2016, it can be concluded that the spatial characteristic insignificantly changed during this period. Limited by landscape and economic development, the small prefecture-level cities developed slowly in urbanization. For the large and medium-size cities, it still needs time to realize the synchronous development of urbanization and green development. At the same time, it reflects that most cities do not pay enough attention to the collaborative development with GD in the urbanization construction, and corresponding planning and action are needed for further sustainable development.

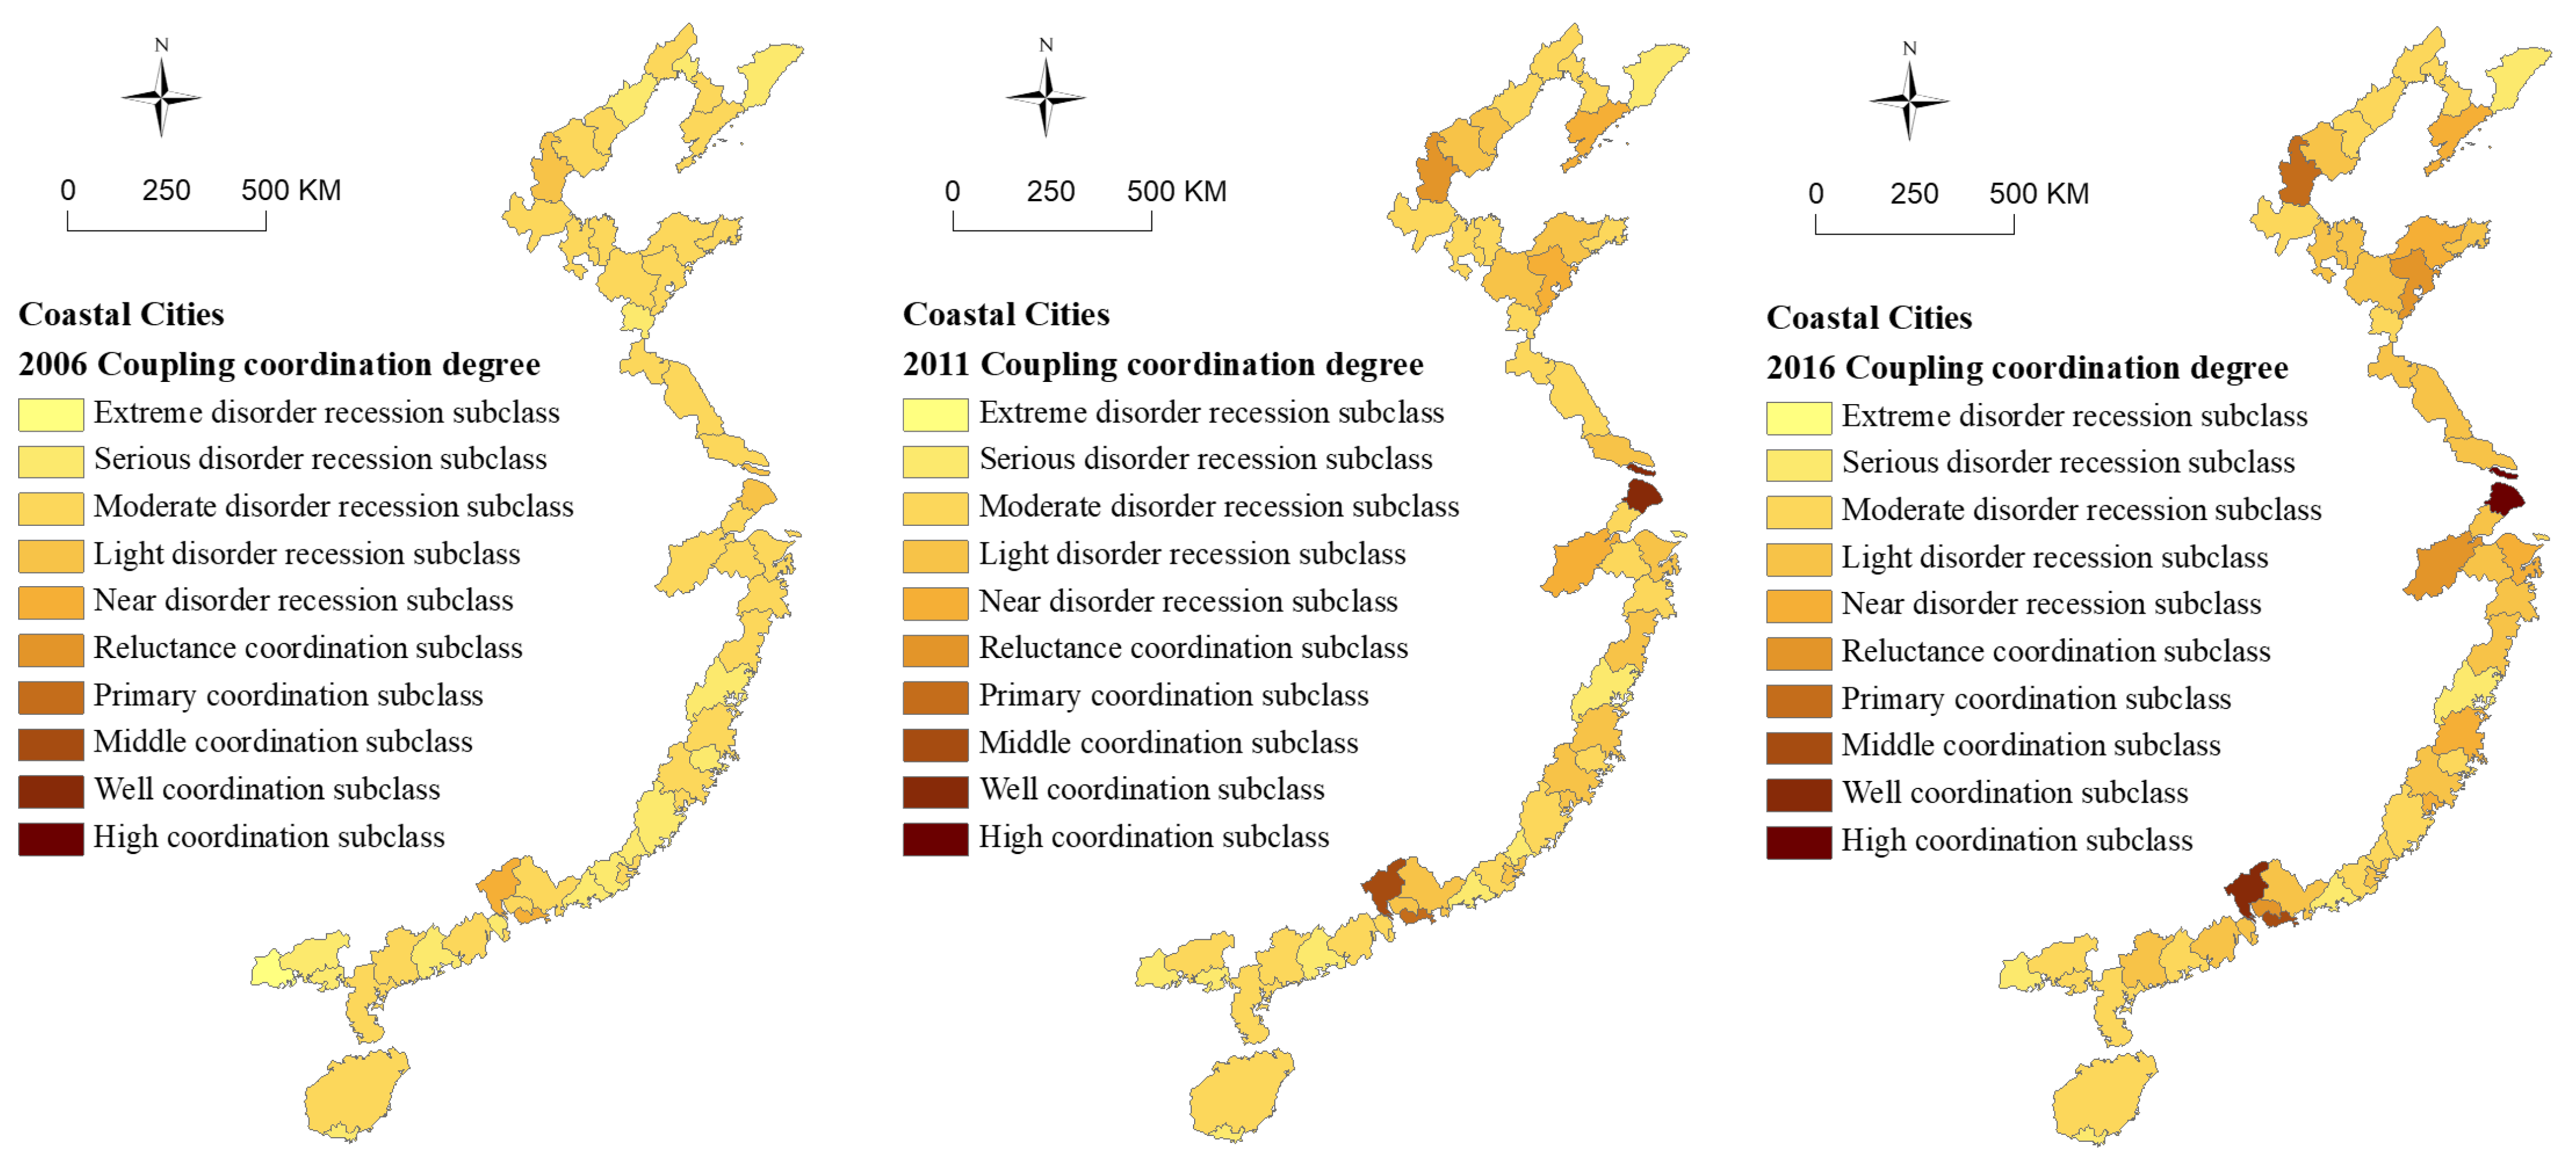
4.4. Spatial-Temporal Coordination Relationship between Urbanization and GD

The calculation results show that the coordination degree of urbanization and GD of 53 coastal cities present a generally upward trend (Figure 5). However, it was still in a state of “low-level equilibrium” with fluctuations, instability, and spatial differentiation. The coordination degree of most cities was below 0.3, on the stage of maladjusted coordination. The average degree of coordination in 2016 increased to 0.365 from 0.229 in 2006, indicating that the overall coordination degree of the two systems turned to light disorder recession. Even though the coordination degree of the coastal cities were not high, it has been slowly improved since most cities gradually took urban ecology and residents’ green living needs into consideration in the process of urbanization.
In 2006, the coordination degree of urbanization and GD of 49 cities was below 0.3, on the stage of maladjusted coordination. Among them, Fangchengang had the lowest level of coordination, belonging to the extreme disorder recession. The rest of the 48 cities were almost evenly divided into the three subclasses: serious, moderate, and slightly disorder recessions. Shenzhen and Guangzhou had the highest coordination degree of urbanization and GD, belonging to the subclass of near disorder recession. Tianjin and Shanghai were also in the transitional stage from maladjustment to coordinated development since their coordination degree was between 0.3 and 0.4. It can be concluded that the spatial characteristic of coordination is highly related with the urbanization and GD of the 53 cities. Big cities, such as Shanghai, Shenzhen, and Guangzhou, performed better not only on the development of urbanization and GD, but also on the coordination of the two systems. This may be due to the effort that big cities made in green urbanization construction, and the inherent advantages big coastal cities have in policy planning and implementation.
In 2011, the coordination degree of the 46 cities were below 0.4, of which 24 cities belonged to the moderate disorder recession subclass. Shanwei had the lowest level of coordination degree, belonging to the serious disorder recession subclass. The coordination degree of urbanization and GD of Qingdao, Dalian, Hangzhou, and Tianjin significantly improved, and they were all on the transition category. Shenzhen, Guangzhou, and Shanghai were the top three cities with the highest coordination degree, all of them entered the category of coordinated development. In particular, the coordination degree of Shanghai was as high as 0.857, making it belong to the well coordination subclass. The fast improvement of coordination development between urbanization and GD in Shanghai was due to the sharp increase of all dimensions of GD in 2011. It can be concluded that the coordinated interrelationship between urbanization and GD of the coastal cities had been greatly improved, with more cities entering the coordinated development category, while the coordination degree of uncoordinated cities had equally improved.
In 2016, four cities (including Shanwei, Fangchengang, Sanya, Ningde) were classified as the serious disorder recession subclass according to their coordination degree of urbanization and GD. Seventeen cities, most of which agglomerated in the northeast and southwest of the coastal zones in China, belonged to the moderate disorder recession subclass, showing a similar spatial characteristic to the RDD.19 cities, most of which agglomerated in the Yangtze River delta, were on the stage of light disorder recession. The coordination interrelationship of Yantai, Fuzhou, Xiamen, and Ningbo significantly improved, making them enter into the transition period from disorder to coordination development. Meanwhile, Dalian, Qingdao, and Ningbo were still in the transitional stage, with the coordination degree of urbanization and GD slightly improved. Tianjin, Shenzhen, Guangzhou, and Shanghai were the four cities which stepped into the coordination development stage. In particular, the coordination degree of Shanghai was as high as 0.955, indicating that it had stepped into the high coordination subclass.
It can be concluded that, the spatial differentiation expanded during the research period. Municipalities and sub-provincial cities performed better in the coordination adjustment between urbanization and GD, and most of them have entered the coordination or transition development category. On the contrary, small prefecture-level cities were quite week in the coordination development between the two systems. On the one hand, the poor urbanization process of these cities insignificantly promoted economic growth and convenient lifestyle construction. On the other hand, the economic development and social progress of these cities were quite low, having less restriction to the urbanization construction. Therefore, the interrelationship between the two systems was quite weak. With the temporally change of coordination degree, it apparently showed that the spatial characteristic of “low value agglomerated in northeast and southwest, while high value agglomerated in Yangtze River delta and Per River delta”.

4.5. Driving-Factors Analysis of Coordinating Development of Urbanization and GD

Table 5 shows the regression results based on the GWR model. Firstly, the R2 value of the regression in 2006, 2011, and 2016 is 0.811, 0.939, and 0.953, respectively, indicating that the GWR model well stimulated the influence degree of each variable on the coordination degree of the urbanization and GD. Secondly, the regression coefficients of most independent variables (including IDL, TDL, EEP, and URB) of the 53 coastal cities are positive in some cities and negative in others, indicating that the impact of these variables on the coordinated development of the two systems is spatially non-stationary. The rank of the regression coefficients of the five independent variables is IDL, URB, EDL, TDL, and EEP, with the average values of 8.881 × 10⁻⁴, 4.019 × 10⁻⁴, 4.547 × 10⁻⁷, 1.167 × 10⁻⁸ and −1.300 × 10⁻⁷, respectively. It can be seen that most independent variables generally had slightly positive correlation with the coordinated development of urbanization and GD of the coastal cities.
Specifically, IDL negatively affected the coordination degree of urbanization and GD of most cities in 2006. However, the coefficient value of IDL turned to be highly positive in 2011, indicating that economic structure of the coastal cities highly promoted the coordination development between the urbanization and GD. This may be due to the efforts coastal cities made to carry out the policy of “Transforming economic growth mode, adjusting industrial structure”, which was made by the Chinese government to satisfy long-run sustainable development’s need during this period. This effect kept in highly positive level in 2016 and showed an upward trend in big cities. Meanwhile, the coefficient value of IDL varied enormously across cities in the three years. This may be due to the size difference among cities. Most cities are too small to maximize the economic effect from the upstream and downstream industrial structure [74,75,76].
The coefficient of URB showed a similar temporal characteristic to IDL in the three years. In 2006, URB of small cities negatively affected their coordination development between urbanization and GD, while it positively affected those of medium and big cities. However, the effect of URB on the coordination degree turned to positive in all cities in 2011 and 2016, indicating that urbanization no longer restricted the coordination of the two systems in small cities. Spatially, the differentiation of effect that URB had on the coordination relationship between the two systems shrank in 2011. This may be due to the effort made by government to balance the development of urbanization and GD, with the urbanization process of big cities slowing down while that of medium and small cities kept improving.
The GWR results show that EDL and TDL had slightly positive correlation with the coordination degree of urbanization and GD during the research period, indicating that cities with higher level of economic development and technical progress performed better in the coordination development between urbanization and GD. Small cities with lower level of economic development usually performed worse in technical progress, so these cities are weaker in the coordination development of the two systems. However, the spatial differentiation of the coefficients of EDL and TDL significantly shrank in 2011 and 2016, meaning that the effect EDL and TDL have on the coordination degree tend to be geographically stationary.
Different from the above independent variables, EEP negatively affected the coordination degree of urbanization and GD in most cities, indicating that the ecological protection potentially threatens the coordination development between the two systems. Temporally, this negative effect tended to be serious since the coefficient of EEP decreased in 2011 and 2016. Spatially, the differentiation tended to be larger since the value of the standard deviation reached the highest in 2016, meaning that ecological friendly cities performed better and better in the coordination development between the two systems, while the others performed on the contrary. It can be concluded that ecological construction is of vital importance to the coordination development between urbanization and GD, especially for cities with lower level of ecological protection. Thus, ecological and environmental protection should be listed as the basic principle in urbanization and regional development in the long run.

5. Discussion

Urbanization is one of the most significant socioeconomical phenomena in China in the past 40 years, and it has received widespread attention from scholars. The spatial pattern of urbanization tended to be unevenly distributed in China. Bai [17] opined that cities in eastern coastal China such as Shenzhen, Beijing, Shanghai, and Guangzhou achieved the highest urbanization level, and spatial agglomeration becoming significant after 2010. The results of this paper also confirm this. Meanwhile, we found that the spatial variation among different types of cities widen due to the differences in urbanization progress. The evaluation results of GD show that the level of green development is highly correlated with the level of economic development and social progress, consistent with the research findings of Huang [75].
The relationship between urbanization and regional development has received widespread attention in recent years. Based on prior researches that focused on the interrelationship between urbanization and ecological system, we introduced the green development concept, and assessed the coupling interactions between urbanization and GD. The results show that urbanization is better coordinated with GD in cities with higher level of economic development, predominantly confirming the conclusions that the relationship between economic growth and urbanization is a benign interaction of prior studies [76]. Meanwhile, the results of this paper show that most cities were still on maladjusted development stage because of the low level of both urbanization and GD, consistent with the conclusions that the level of coordination development between urbanization and subsystems of regional sustainable development such as ecological service [47], agro-ecology [63], and eco-environment [28] is quite low in China.
The booming urban population, rapid industrialization, environmental pollution pushed the development of many areas onto unsustainable trajectory [77]. This paper also confirms that environmental problems are the main reason for the incoordination development between urbanization and GD, which is consistent with Wang’s findings [23]. However, urbanization is the most important engine of urban GD since it helps to improve the urban infrastructure of transportation, education, and medical areas [78]. Meanwhile, Chinese government actively advocates green production ways through industrial restructuring and supply-side reform to alleviate the pressure on the environment and resource. The economic structure optimization in China has been found to improve the win-win ability of environmental protection and economic development during China’s green transition [79]. This has effectively promoted the coordinated development of urbanization and GD of the coastal cities. As an effective support to achieve efficient economic growth by reducing environmental pollution [80], technological innovation played little role in the coordinated development of urbanization and GD of the coastal cities. It is indicated that technological progress of most cities is still in the bottleneck period, and the role it plays on the coordinated development of urbanization and GD has not yet been significant.

6. Conclusions and Policy Implications

6.1. Conclusions

This paper noted the following based on the model of RDM, CCM, and GWR, and by the analysis of the spatial-temporal characteristic of urbanization and GD in 53 coastal cities of China:
(1)
Both the degree of urbanization and GD of the coastal cities show an upward trend during the research period. The spatial characteristic of urbanization and GD had similar patterns, that municipalities and sub-provincial cities were on high level of urbanization and GD, while small prefecture-level cities were on the low levels. It can be concluded that the development of urbanization and GD is positively related with scales of land, population, economy, and other aspects.
(2)
The RDD of urbanization and GD significantly improved in big and medium cities, while small cities, most agglomerated in the northeast and southwest of the study area, are still in “low urbanization and GD” state. Moreover, the relationship of the two systems in these cities has not been seriously considered since the RDD showed insignificantly temporal characteristics, indicating that the development of these two systems has not been together planned. The CCD of urbanization and GD generally improved during the research period, transferring from moderate disorder to light disorder recession. Big cities, such as Shanghai, Shenzhen, and Guangzhou have entered coordinated development period, while small cities are still in maladjusted development period due to the low level of economic development, technical innovation, and industrial structure optimization. Cities with better performance of coordination between urbanization and GD proceeded faster in the improvement of the two systems, making the spatial gap larger.
(3)
During the research period, China’s economic structure optimization played an increasingly significant role in coordinating urbanization and green development of the coastal cities. Meanwhile, the optimal urbanization process was also an important driving force of the coordinated development of the two systems. However, the present level of ecological and environmental protection significantly restricted the coordination development between urbanization and GD. It can be concluded that the role played by technological innovation in improving the coordinated development of urbanization and GD is insignificant. For China and other developing countries, the achievement of economic growth under the condition of ecological protection is still one of the main targets in the future.

6.2. Policy Implications

In terms of the policy implications, this study suggests various policies that can be undertaken to improve the coordination development between urbanization and GD of the coastal cities. The first point to ponder here is that the insufficient ecological protection is the main cause that restricts the coordinated relationship between urbanization and GD. Hence, the coastal cities should levy additional focus on the ecological protection measures such as ecological planning, ecological pollution control, and ecological restoration to improve the quality of urbanization and regional development. Moreover, it is essential to optimize the industrial structure to promote the coordination development between urbanization and GD. Each city should actively seek their own advantageous industries, and encourage forming industry cluster, instead of blindly developing the service industry. In addition, the role of scientific and technological innovation in coordinating the relationship between urbanization and GD has not yet reached the ideal level. Hence, the coastal cities should pay more attention on the development of technological innovation. Specifically, measures such as increasing R&D investment and encouraging innovation incubation should be taken to enhance the role of technological innovation in environmental governance, economic growth, and people’s life improvement.
Our work has potential limitations, which needs to be addressed in future researches. Firstly, limited by the availability of data, the index system constructed although reflecting objectively the level of urbanization and GD, can further be enriched to improve the security of the index system. Secondly, the differences between coastal cities and inland cities in the coupling and coordination of urbanization and GD have not been explored in this paper. Further researches are therefore needed in this field to enhance the scientificity and applicability of relevant studies.

Author Contributions

Conceptualization, Y.S. and S.L.; data curation, Y.S.; methodology, Y.S.; software, Y.S.; writing—original draft preparation, Y.S.; and writing—review and editing, Y.S. and S.L. All authors have read and agreed to the published version of the manuscript.

Funding

This research was funded by Key Research Program of National Social Science Fund of China, grant number 18VSJ067.

Institutional Review Board Statement

Not applicable.

Informed Consent Statement

Not applicable.

Data Availability Statement

No new data were created or analyzed in this study. Data sharing is not applicable to this article.

Conflicts of Interest

The authors declare no conflict of interest.

References

  1. Henderson, V. The urbanization process and economic growth: The so-what question. J. Econ. Growth 2003, 8, 47–71. [Google Scholar] [CrossRef]
  2. Department of Economic and Social Affairs, Population Division. World Urbanization Prospects: The 2018 Revision; United Nations: New York, NY, USA, 2019. [Google Scholar]
  3. Zhou, Y.; Li, X.; Asrar, G.R.; Smith, S.J.; Imhoff, M. A global record of annual urban dynamics (1992–2013) from nighttime lights. Remote Sens. Environ. 2018, 219, 206–220. [Google Scholar] [CrossRef]
  4. Zhai, X.; Reed, R.; Mills, A. Embracing off-site innovation in construction in China to enhance a sustainable built environment in urban housing. Int. J. Constr. Manag. 2014, 14, 123–133. [Google Scholar] [CrossRef]
  5. China National Bureau of Statistics. China Statistical Yearbook 2017; China Statistics Press: Beijing, China, 2017. [Google Scholar]
  6. Chen, M.; Liu, W.; Lu, D. Challenges and the way forward in China’s new-type urbanization. Land Use Policy 2016, 55, 334–339. [Google Scholar] [CrossRef]
  7. He, J.; Wan, Y.; Feng, L.; Ai, J.; Wang, Y. An integrated data envelopment analysis and emergy-based ecological footprint methodology in evaluating sustainable development, a case study of Jiangsu Province, China. Ecol. Indic. 2016, 70, 23–34. [Google Scholar] [CrossRef]
  8. Yu, B. Ecological effects of new-type urbanization in China. Renew. Sust. Energy Rev. 2021, 135, 110239. [Google Scholar] [CrossRef]
  9. Zhu, Y.G. Environmental impacts of rapid urbanization in China: A showcase of recent research developments. Environ. Sci. Pollut. Res. 2012, 19, 1351. [Google Scholar] [CrossRef]
  10. Fang, C.; Liu, X. Temporal and spatial differences and imbalance of China’s urbanization development during 1950–2006. Acta Geogr. Sin. 2009, 19, 719–732. [Google Scholar] [CrossRef]
  11. Song, M.; Wang, S. Measuring Environment-Biased Technological Progress Considering Energy Saving and Emission Reduction. Process Saf. Environ. Prot. 2018, 116, 745–753. [Google Scholar] [CrossRef]
  12. Brand, U. Green economy—The next oxymoron? No lessons learned from failures of implementing sustainable development. GAIA Ecol. Perspect. Sci. Soc. 2012, 21, 28–32. [Google Scholar] [CrossRef] [Green Version]
  13. D’Amato, D.; Droste, N.; Allen, B. Green, circular, bio economy:A comparative analysis of sustainability avenues. J. Clean. Prod. 2017, 168, 716–734. [Google Scholar] [CrossRef]
  14. Mundaca, L.; Neij, L.; Markandya, A. Towards a green energy economy? Assessing policy choices, strategies and transitional pathways. Appl. Energy 2016, 179, 1283–1292. [Google Scholar] [CrossRef]
  15. UNEP. Towards a Green Economy: Pathways to Sustainable Development and Poverty Eradication; A Synthesis for Policy Makers; UNEP: Nairobi, Kenya, 2011. [Google Scholar]
  16. OECD. Towards Green Growth; OECD Publishing: Paris, France, 2011. [Google Scholar]
  17. Luukkanen, J.; Kaivo-oja, J.; Vähäkari, N.; O’Mahony, T.; Korkeakoski, M.; Panula-Ontto, J.; Hogarth, N. Green economic development in Lao PDR: A sustainability window analysis of Green Growth Productivity and the Effificiency Gap. J. Clean. Prod. 2019, 211, 818–829. [Google Scholar] [CrossRef]
  18. World Bank. Inclusive Green Growth: The Pathway to Sustainable Development; World Bank: Washington, DC, USA, 2012. [Google Scholar]
  19. Hu, A.G.; Zhou, S.J. Green development: Functional definition, mechanism analysis and development strategy. China Popul. Resour. Environ. 2014, 24, 14–20. [Google Scholar]
  20. Huang, M.; Ye, Q. The Marxist green development concept and green development in contemporary China: Comment on incompatibility theory between environment and development. Econ. Res. J. 2017, 52, 17–30. [Google Scholar]
  21. Wang, M.X.; Zhao, H.H.; Cui, J.X.; Fan, D.; Lv, B.; Wang, G.; Li, Z.H.; Zhou, G.J. Evaluating green development level of nine cities within the Pearl River Delta. China. J. Clean. Prod. 2017, 174, 315–323. [Google Scholar] [CrossRef]
  22. Wang, Z.B.; Wang, X.M.; Liang, L.W. Green economic effificiency in the Yangtze River Delta: Spatiotemporal evolution and inflfluencing factors. Ecosyst. Health Sustain. 2019, 5, 20–35. [Google Scholar] [CrossRef] [Green Version]
  23. Wang, S.J.; Ma, H.; Zhao, Y.B. Exploring the relationship between urbanization and the eco-environment—A case study of Beijing–Tianjin–Hebei region. Ecol. Indic. 2014, 45, 171–183. [Google Scholar] [CrossRef]
  24. Feng, Y.; Dong, X.; Zhao, X.; Zhu, A. Evaluation of urban green development transformation process for Chinese cities during 2005–2016. J. Clean. Prod. 2020, 266, 121707. [Google Scholar] [CrossRef]
  25. Costanza, R.; Daly, L.; Fioramonti, L. Modelling and measuring sustainable wellbeing in connection with the UN sustainable development goals. Ecol. Econ. 2016, 130, 350–355. [Google Scholar] [CrossRef]
  26. Li, F.; Liu, X.S.; Hu, D.; Wang, R.S. Evaluation method and its application for urban sustainable development. Acta Ecol. Sin. 2007, 27, 4793–4802. [Google Scholar]
  27. Zheng, B.; Bedra, K.B. Recent Sustainability Performance in China: Strength-Weakness Analysis and Ranking ofProvincial Cities. Sustainability 2018, 10, 3063. [Google Scholar] [CrossRef] [Green Version]
  28. Wang, Q.; Yuan, X.; Zhang, J.; Gao, Y.; Hong, J.; Zuo, J.; Liu, W. Assessment of the Sustainable Development Capacity with the Entropy Weight Coefficient Method. Sustainability 2015, 7, 13542–13563. [Google Scholar] [CrossRef] [Green Version]
  29. Cyril, S.; Oldroyd, J.C.; Renzaho, A. Urbanisation, urbanicity, and health: A systematic review of the reliability and validity of urbanicity scales. BMC Public Health 2013, 13, 513. [Google Scholar] [CrossRef] [PubMed] [Green Version]
  30. United Nations Department of Economic and Social Affairs Population Division. World Urbanization Prospects: The 2014 Revision; UNDESA: New York, NY, USA, 2015. [Google Scholar]
  31. Herzele, A.V.; Wiedemann, T. A monitoring tool for the provision of accessible and attractive urban green spaces. Landsc. Urban Plan. 2003, 63, 109–126. [Google Scholar] [CrossRef]
  32. Savard, J.-P.L.; Clergeau, P.; Mennechez, G. Biodiversity concepts and urban ecosystems. Landsc. Urban Plan. 2000, 48, 131–142. [Google Scholar] [CrossRef]
  33. Sharifi, A. From Garden City to Eco-Urbanism:The Quest for Sustainable Neighborhood Development. Sustain. Cities Soc. 2016, 20, 1–16. [Google Scholar] [CrossRef]
  34. Turvey, R.A. Researching Green Development and Sustainable Communities in Small Urban Municipalities. Int. J. Syst. Sci. 2015, 7, 68–86. [Google Scholar] [CrossRef]
  35. Zaidman, M.; Kark, R. Garden Cities in the Jewish Yishuv of Palestine:Zionist Ideology and Practice 1905–1945. Plan. Perspect. 2016, 31, 55–82. [Google Scholar] [CrossRef]
  36. Ghorab, H.K.E.; Shalaby, H.A. Eco and Green cities as new approaches for planning and developing cities in Egypt. Alex. Eng. J. 2016, 55, 495–503. [Google Scholar] [CrossRef]
  37. Bakirtas, T.; Akpolat, A.G. The relationship between energy consumption, urbanization, and economic growth in new emerging-market countries. Energy 2018, 147, 110–121. [Google Scholar] [CrossRef]
  38. Black, D.; Henderson, V. A Theory of Urban Growth. J. Polit. Econ. 1999, 107, 252–284. [Google Scholar] [CrossRef]
  39. Spence, M.; Annez, P.C.; Buckley, R.M. Urbanization and Growth; World Bank Publications: Washington, DC, USA, 2009. [Google Scholar]
  40. Dyson, T. The Role of the Demographic Transition in the Process of Urbanization. Popul. Dev. Rev. 2011, 37, 34–54. [Google Scholar] [CrossRef]
  41. Deng, X.; Huang, J.; Rozelle, S.; Uchida, E. Economic Growth and the Expansion of Urban Land in China. Urban Stud. 2010, 47, 813–843. [Google Scholar] [CrossRef]
  42. Zinia, N.J.; Mcshane, P. Ecosystem services management: An evaluation of green adaptations for urban development in Dhaka, Bangladesh. Landsc. Urban Plan. 2018, 173, 23–32. [Google Scholar] [CrossRef]
  43. Rashid, A.; Irum, A.; Malik, I.A.; Ashraf, A.; Liu, R.; Liu, G.; Ullah, H.; Ali, M.U.; Yousaf, B. Ecological footprint of Rawalpindi; Pakistan’s fifirst footprint analysis from urbanization perspective. J. Clean. Prod. 2017, 170, 362–368. [Google Scholar] [CrossRef]
  44. Song, W.; Deng, X.; Liu, B.; Li, Z.; Jin, G. Impacts of Grain-for-Green and Grain-for-Blue Policies on Valued Ecosystem Services in Shandong Province, China. Adv. Meteorol. 2015, 2015, 213534. [Google Scholar] [CrossRef] [Green Version]
  45. Bai, Y.; Deng, X.; Jiang, S.; Zhang, Q.; Wang, Z. Exploring the relationship between urbanization and urban eco-efficiency: Evidence from prefecture-level cities in China. J. Clean. Prod. 2017, 195, 1487–1496. [Google Scholar] [CrossRef]
  46. Liu, H.; Fang, C.; Li, Y. The Coupled Human and Natural Cube: A conceptual framework for analyzing urbanization and eco-environment interactions. Acta Geogr. Sin. 2019, 74, 1489–1507. [Google Scholar]
  47. Tian, Y.; Zhou, D.; Jiang, G. Conflict or Coordination? Multiscale assessment of the spatio-temporal coupling relationship between urbanization and ecosystem services: The case of the Jingjinji Region, China. Ecol. Indic. 2020, 117, 106543. [Google Scholar] [CrossRef]
  48. Zhou, L.; Che, L.; Sun, D. The Coupling Coordination Development between Urbanization and Economic Growth and Its Influencing Factors in China. Econ. Geogr. 2019, 39, 97–107. [Google Scholar]
  49. Xu, D.; Hou, G. The Spatiotemporal Coupling Characteristics of Regional Urbanization and Its Influencing Factors: Taking the Yangtze River Delta as an Example. Sustainability 2019, 11, 822. [Google Scholar] [CrossRef] [Green Version]
  50. Zhang, K.; Shen, J.; He, R.; Fan, B.; Han, H. Dynamic Analysis of the Coupling Coordination Relationship between Urbanization and Water Resource Security and Its Obstacle Factor. Int. J. Environ. Res. Public Health 2019, 16, 4765. [Google Scholar] [CrossRef] [Green Version]
  51. Liu, F.; Liu, C. Regional disparity, spatial spillover effects of urbanisation and carbon emissions in China. J. Clean. Prod. 2019, 241, 118226. [Google Scholar] [CrossRef]
  52. Yuan, H.; Zhang, T.; Feng, Y.; Liu, Y.; Ye, X. Does financial agglomeration promote the green development in China? A spatial spillover perspective. J. Clean. Prod. 2019, 237, 117808. [Google Scholar] [CrossRef]
  53. Duan, P.; Liu, S.; Peng, Y.; Zhang, H. Spatial-Temporal Coupling Coordination Relationship Between Development Strength and Resource Environmental Bearing Capacity of Coastal Cities in China. Econ. Geogr. 2018, 38, 60–67. [Google Scholar]
  54. Seto, K.C.; Güneralp, B.; Hutyra, L.R. Global forecasts of urban expansion to 2030 and direct impacts on biodiversity and carbon pools. Proc. Natl. Acad. Sci. USA 2012, 109, 16083–16088. [Google Scholar] [CrossRef] [Green Version]
  55. Luo, Y. Sustainability Associated Coastal Eco-environmental Problems and Coastal Science Development in China. Bull. Chin. Acad. Sci. 2016, 31, 1133–1142. [Google Scholar]
  56. Zheng, Z.; Wu, Z.; Chen, Y.; Yang, Z.; Marinello, F. Exploration of eco-environment and urbanization changes in coastal zones: A case study in China over the past 20 years. Ecol. Indic. 2020, 119, 106847. [Google Scholar] [CrossRef]
  57. Zhou, D.; Tian, Y.; Jiang, G. Spatio-temporal investigation of the interactive relationship between urbanization and ecosystem services: Case study of the Jingjinji urban agglomeration, China. Ecol. Indic. 2018, 95, 152–164. [Google Scholar] [CrossRef]
  58. Zhao, Y.; Wang, S.; Zhou, C. Understanding the relation between urbanization and the eco-environment in China’s Yangtze River Delta using an improved EKC model and coupling analysis. Sci. Total Environ. 2016, 571, 862–875. [Google Scholar] [CrossRef]
  59. Kim, S.E.; Kim, H.; Chae, Y. A new approach to measuring green growth: Application to the OECD and Korea. Futures 2014, 63, 37–48. [Google Scholar] [CrossRef]
  60. Cheng, X.; Long, R.; Chen, H.; Li, W. Green competitiveness evaluation of provinces in China based on correlation analysis and fuzzy rough set. Ecol. Indic. 2018, 85, 841–852. [Google Scholar] [CrossRef]
  61. Bartelmus, P. The future we want: Green growth or sustainable development? Environ. Dev. 2013, 7, 165–170. [Google Scholar] [CrossRef]
  62. Zhang, X.; Wang, C.; Li, E.; Xu, C. Assessment model of eco-environmental vulnerability based on improved entropy weight method. Sci. World J. 2014, 2014, 797814. [Google Scholar]
  63. Cai, J.; Li, X.; Liu, L.; Chen, Y.; Wang, X.; Lu, S. Coupling and coordinated development of new urbanization and agro-ecological environment in China. Sci. Total Environ. 2021, 776, 145837. [Google Scholar] [CrossRef]
  64. Solymar, L.; Webb, D.J.; Grunnet-Jepsen, A. The Physics and Applications of Photorefractive Materials; Clarendon Press: Wotton-under-Edge, UK, 1996; Volume 11. [Google Scholar]
  65. Ariken, M.; Zhang, F.; Chan, N.w.; Kung, H.-t. Coupling coordination analysis and spatio-temporal heterogeneity between urbanization and eco-environment along the Silk Road Economic Belt in China. Ecol. Indic. 2021, 121, 107014. [Google Scholar] [CrossRef]
  66. Liu, W.; Jiao, F.; Ren, L.; Xu, X.; Wang, J.; Wang, X. Coupling coordination relationship between urbanization and atmospheric environment security in Jinan City. J. Clean. Prod. 2018, 204, 1–11. [Google Scholar] [CrossRef]
  67. Wang, J.; Wang, S.; Li, S.; Feng, K. Coupling analysis of urbanization and energy-environment efficiency: Evidence from Guangdong province. Appl. Energy 2019, 254, 113650. [Google Scholar] [CrossRef]
  68. Gan, L.; Shi, H.; Hu, Y.; Lev, B.; Lan, H. Coupling coordination degree for urbanization city-industry integration level: Sichuan case. Sustain. Cities Soc. 2020, 58, 102136. [Google Scholar] [CrossRef]
  69. Lv, T.; Wang, L.; Zhang, X.; Xie, H.; Lu, H.; Li, H.; Liu, W.; Zhang, Y. Coupling Coordinated Development and Exploring Its Influencing Factors in Nanchang, China: From the Perspectives of Land Urbanization and Population Urbanization. Land 2019, 8, 178. [Google Scholar] [CrossRef] [Green Version]
  70. Verma, P.; Raghubanshi, A.S. Urban sustainability indicators: Challenges and opportunities. Ecol. Indic. 2018, 93, 282–291. [Google Scholar] [CrossRef]
  71. Brunsdon, C.; Fotheringham, S.; Charlton, M. Geographically Weighted Regression. J. R. Stat. Soc. 1998, 47, 431–443. [Google Scholar] [CrossRef]
  72. Bian, H.; Gao, J.; Wu, J.; Sun, X.; Du, Y. Hierarchical analysis of landscape urbanization and its impacts on regional sustainability: A case study of the Yangtze River Economic Belt of China. J. Clean. Prod. 2021, 279, 123267. [Google Scholar] [CrossRef]
  73. Li, M.; He, B.; Guo, R.; Li, Y.; Chen, Y.; Fan, Y. Study on Population Distribution Pattern at the County Level of China. Sustainability 2018, 10, 3598. [Google Scholar] [CrossRef] [Green Version]
  74. Ke, S.; Yao, Z. Industrial Structure, City Size and Urban Productivity in China. Econ. Res. J. 2014, 49, 76–88. [Google Scholar]
  75. Huang, Y.; Li, L. A comprehensive assessment of green development and its spatial-temporal evolution in urban agglomerations of China. Geogr. Res. 2017, 36, 1309–1322. [Google Scholar]
  76. Alam, S.; Fatima, A.; Butt, M.S. Sustainable development in Pakistan in the context of energy consumption demand and environmental degradation. J. Asian Econ. 2007, 18, 825–837. [Google Scholar] [CrossRef]
  77. Clark, L.P.; Millet, D.B.; Marshall, J.D. Air quality and urban form in U.S. urban areas: Evidence from regulatory monitors. Environ. Sci. Technol. 2011, 45, 7028–7035. [Google Scholar] [CrossRef]
  78. Zeng, C.; Song, Y.; Cai, D.; Hu, P.; Cui, H.; Yang, J.; Zhang, H. Exploration on the spatial spillover effect of infrastructure network on urbanization: A case study in Wuhan urban agglomeration. Sustain. Cities Soc. 2019, 47, 101476. [Google Scholar] [CrossRef]
  79. Miao, W.A.; Chao, F.B. The win-win ability of environmental protection and economic development during China’s transition. Technol. Forecast. Soc. Chang. 2021, 166, 120617. [Google Scholar]
  80. Wang, K.-H.; Umar, M.; Akram, R.; Caglar, E. Is technological innovation making world “Greener”? An evidence from changing growth story of China. Technol. Forecast. Soc. Chang. 2021, 165, 120516. [Google Scholar] [CrossRef]
Figure 1. Study area: 53 coastal cities in China.
Sustainability 13 05339 g001
Figure 2. Overview of research framework.
Sustainability 13 05339 g002
Figure 3. The trend graph of urbanization and GD index of each coastal city in China from 2006 to2016: (a) Urbanization system; (b) Green development system.
Sustainability 13 05339 g003
Figure 4. The spatial-temporal characteristic of relative development of urbanization and GD.
Sustainability 13 05339 g004
Figure 5. The Spatial-temporal characteristic of coupling coordination degree of urbanization and GD.
Sustainability 13 05339 g005
Table 1. Indicators system for urbanization and GD level of coastal cities in China.
System LayerStandard LayerIndicator LayerWeightIndicator Direction
Urbanization systemEconomic urbanization (U1)Nonagricultural output (10,000,000 yuan) (x1)0.368 +
Demographic urbanization (U2)Nonagricultural population (10,000 persons) (x2)0.283 +
Landscape urbanization (U3)Urban built-up area (hectare) (x3)0.349 +
Green development systemEconomic development (G1)Per capital GDP (yuan) (x4)0.036 +
Third production ratio (%) (x5)0.010 +
Expenditure for science and technology (10,000 yuan) (x6)0.241 +
Social progress (G2)Expenditure for education (10,000 yuan) (x7)0.098 +
Number of beds in medical and health institutions (unit) (x8)0.055 +
Disposable income ratio of urban and rural population (%) (x9)0.012 +
Ecological protection (G3)Industrial wastewater discharge (10,000 tons) (x10)0.009
Industrial SO2 emissions (tons) (x11)0.009
Green area (hectare) (x12)0.157 +
Resource consumption (G4)Per capita cultivated land area (hm2/person) (x13)0.033
Per capita water resources (m3/person) (x14)0.179
Per capita electricity consumption resources (kw h/person) (x15)0.160
Table 2. The explanation and classification of relative development degree of urbanization and GD.
β-ValueMeaningClassification
0.00–0.90The urbanization lags behind GDL-H
0.90–1.20Simultaneous developmentCo-development
1.10–+∞The GD lags behind urbanizationH-L
Table 3. The criteria and classes of the coupling and coordination degree of urbanization and GD.
ClassD-ValueSubclass
Maladjustment0.000–0.100Extreme disorder recession
0.101–0.200Serious disorder recession
0.201–0.300Moderate disorder recession
0.301–0.400Light disorder recession
Transition0.401–0.500Near disorder recession
0.501–0.600Reluctance coordination
Coordinated development0.601–0.700Primary coordination
0.701–0.800Middle coordination
0.801–0.900Well coordination
0.901–1.000High coordination
Table 4. Comprehensive level of urbanization and GD of 53 coastal cities in China.
YearU1U2U3UrbanizationG1G2G3G4GD
20060.0180.0350.0360.0900.0090.0140.0230.0120.059
20110.0410.0330.0480.1210.0230.0230.0290.0430.117
20160.0570.0460.0680.1700.0390.0320.0340.0530.158
Table 5. The results of GWR model.
YearVariableMinimum
(×10−6)
Maximum
(×10−6)
Mean
(×10−6)
Median
(×10−6)
Standard Deviation
(×10−6)
AICcR2R2 Adjusted
2006EDL0.3670.9640.6190.4680.246−196.8270.8110.772
IDL−294.495306.412−5.565−142.673219.570
TDL−0.836−0.314−0.488−0.3430.193
EEP−0.4680.7710.3130.5980.456
URB−238.860427.438303.292256.16768.519
2011EDL0.3220.4890.4310.4290.047−176.3420.9390.926
IDL289.3582264.5511390.4241902.953714.321
TDL0.0840.1010.0930.0960.005
EEP−0.6250.391−0.063−0.1590.306
URB394.933516.436464.303486.58147.856
2016EDL0.0520.5640.3140.2250.182−174.6940.9530.944
IDL218.0023305.0811268.2741140.858764.061
TDL0.0500.0660.0590.0630.005
EEP−0.9130.644−0.215−0.3780.616
URB354.996536.691438.178420.60169.372
Publisher’s Note: MDPI stays neutral with regard to jurisdictional claims in published maps and institutional affiliations.

