Abstract
Diesel generators are being used as a source of electricity in different parts of the world. Because of the significant expense in diesels cost and the requirement for a greener domain, such electric generating systems appear not to be efficient and environmentally friendly and should be tended to. This paper explores the attainability of utilizing a sustainable power source based on a cross-breed electric system in the cement factory in Salalah, Oman. The HOMER software that breaks down the system setup was utilized to examine the application and functional limitations of each hybridized plan. The result showed that a renewable-energy (RE)-based system has a lower cost of energy (COE) and net present cost (NPC) compared to diesel generator-based hybrid electric and standalone systems. Although the two pure renewable hybrid energy systems considered in this study displayed evidence of no emissions, lower NPC and COE values are observed in the photovoltaic/battery (PV/B) hybrid energy system compared with photovoltaic/wind turbine/battery (PV/WT/B). The PV/WT/B and PV/B systems have higher electricity production and low NPC and COE values. Moreover, the PV/B has the highest return on investment (ROI) and internal rate of return (IRR), making the system the most economically viable and adjudged to be a better candidate for rural community electrification demands.
1. Introduction
The demand for fossil fuel is increasing and likely to be limited in supply in the coming years due to government policies, environmental pollution, production, and logistical challenges. Although Oman is a petroleum and natural gas exporting nation with estimated reserves of 4.7 billion barrels of oil and 25 trillion cu ft of natural gas, the reserve to production ratios (R/P) are only 15 and 18 years, respectively [1]. As such, an examination of renewable/hybrid energy is warranted. Recently, Oman has adopted the Vision 20–40 plan, including the ninth five-year plan covering the period 2016–2024 [2]. The arrangement is pointed toward decreasing the nation’s dependence on oil and gas creation by broadening the economy in the industrial and financial areas. Another agenda of the Oman Vision 20–40 plan in diversifying the economy is for Oman to invest in renewable energy [3]. Furthermore, due to the demand for a greener environment in the 21st century, there has been a growing demand for renewable energy sources both globally and within Oman [3,4,5,6,7,8]. The availability of renewable energy can not only provide a continuous power supply, but also supply an energy demand balance in the electrical power system [9]. The energy supply can be in the form of single sources or a hybrid system arrangement. In a hybrid energy system, components are incorporated to improve system reliability. A hybrid energy system arrangement is the process of combining one or more energy sources to produce more effective and efficient electrical energy production [10,11]. Through this process, a stable and reliable energy supply can be achieved, and emissions from some of the energy sources reduced. Some of the common components of a hybrid system are photovoltaic (PV) modules, storage batteries, inverters, generators, and power control components that work together with the hybrid energy system. The components arranged in the hybrid energy system can be off-grid or grid-connected systems [12]. PV and wind energy sources are common renewable energy sources incorporated in hybridized energy systems and can also be arranged as a standalone or grid-connected energy source [13,14]. A hybrid energy system arrangement can enhance the availability of the electrical supply as well as support the charging of the battery band that often needs regular maintenance.
Researchers have shown that hybrid systems have a lower net present cost (NPC) and cost of energy (COE) compared to a single system in meeting desired electrical demands [15,16]. Several studies have been undertaken to understand hybrid energy systems in terms of economic, environmental impacts, and reliability [17,18]. Panapakidis et al. [19] appraised the techno-economic feasibility of four hybrid power generation systems used to address the electricity demand of an off-grid residence for 20 years in different geographical regions in Greece. The study reported that the system with minimal total installation cost was set as a criterion for providing an optimal electric solution to the communities. Lorafe et al. [13] carried out an itemized investigation of off-grid island communities utilizing HOMER software, which will be described in more detail in the methodology section. Two situations of hybrid energy systems were examined. The outcome indicated that a hybrid energy system is more practical and effective than a standalone solar system. In another examination, Nandi et al. [14] compared utilizing a mixed energy system vs. an independent generator for rural electrification in a community. Distinctive financial markets were considered in the examination, and the outcomes demonstrated that a mixed energy system has lower COE and NPC contrasted with an independent diesel generator (DG). In a related study, Al-Bad et al. [20] investigated the effect of introducing wind power sources to boost the electric energy demand in an isolated Duqum area in the Sultanate of Oman using HOMER software. The result revealed that the effectiveness of incorporating wind energy sources can only occur when the wind speed exceeds 6 m/s. This criterion can be used to access the availability and feasibility of renewable energy sources in a given area. In the present study, we incorporated the availability of potential renewable energy sources in Salalah and explored the possibility of a configured hybrid energy system that met the electrical needs of a Salalah cement factory.
In terms of economic and techno-economic feasibility, Valente et al. [21] accessed the financial implications of employing a hybrid PV/diesel system over a standalone diesel system for a community in Iran. The result showed that the hybrid PV/diesel system reduced fuel consumption, operation, and maintenance cost benefits over the standalone diesel system. However, ROI analysis and other related economic parameters were not considered in that studies. Several authors have studied the viability of different renewable energy sources with HOMER software [22,23]. HOMER software has extensively been used for off-grid and grid-connected electrification [24,25,26]. It was reported that HOMER is widely used due to its renewable energy-based system and can provide optimization analysis with limited input, making it a potential tool for hybrid energy system feasibility assessment. Chong Li et al. [27] performed a detailed techno-economic feasibility study by considering the independent performance and application of renewable hybrid wind/photovoltaic (PV)/battery power systems in Urumqi, China, using HOMER simulation software. A comparison with a single wind energy source showed that the hybrid energy system had a better performance than the wind energy for their proposed model. Using a similar modeling tool to find the optimal combination of hybrid energy system for the electrical generation needs of a community in India, Rohit Sen et al.’s [28] results revealed that hybrid energy system arrangements can be cost-effective, sustainable, techno-economically viable, and environmentally sensible. Although several hybrid energy systems have been configured and examined for rural electrification, the deployment of different techno-economical parameters and important economic parameters such as ROI and IRR analysis has not been explored in detail for rural and commercial applications. While few researchers have considered the importance of other economic analyses for the feasibility of several applications [24,29,30], few other studies have considered either the IRR or ROI analysis in the techno-economic evaluation of factory applications [19,31,32]. This study seeks to evaluate the effects of these parameters in the configuration of efficient power supply to industrial factories. The parameters can be explored in the techno-economic study of communities that have potential renewable energy sources.
Salalah is endowed with several potential renewable energy sources, specifically solar due to its position [33]. The development and configuration of these renewable energy sources into the hybrid energy system to power the Salalah cement company have never been reported in the literature. This study bridges this gap and promises to be a game-changer in the efforts to provide a sustainable, eco-friendly electric power supply. The present study examines the feasibility and application of a hybrid energy system in the cement factory in Salalah. The novel employment of HOMER software in providing adequate economic analysis and solutions to address the urgent electric power needs of the Salalah cement factory will not only benefit the factory but can be employed by other factories facing similar electric power challenges. A comparison is made between four different hybrid electrical system arrangements. One of the benefits of the study is to help the authority and policymakers decide to replace the existing standalone generator system that contributes to greenhouse emissions with the proposed environmentally friendly renewable energy system. The versatility of the HOMER software enhanced the optimal, sizing, and performance analysis of the proposed hybrid energy system concerning the industry and environmental conditions.
Location of the Study
The cement factory is located in Salalah, Oman. Salalah is the third-largest city in the Sultanate of Oman and situated in the southern part of Oman (17°1′ N, 54°6′ E) as shown in Figure 1.
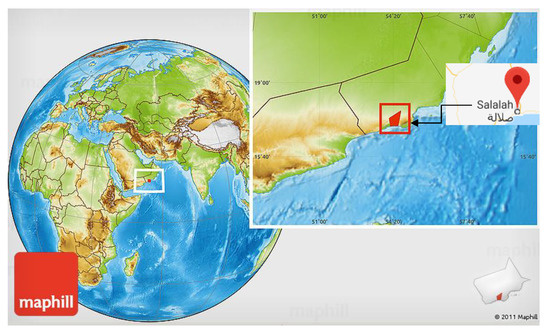
Figure 1.
The geographical location of the Salalah cement factory, edited from [34].
The solar radiation and average annual temperatures at the geographical location of Salalah are relatively high throughout the year, thus making it viable to harness solar energy for this community [33].
2. Methodology
2.1. Homer Software Program
HOMER is a micropower optimization software developed by Mistaya Engineering, Canada, for the National Renewable Energy Laboratory (NREL) in the USA, and was utilized in this examination to rearrange the assignment of assessing the design of both off-grid and grid-connected power system for an assortment of uses. In planning and designing a power system, numerous choices about the setup of the system can be made. Including about the segments to remember for the system configuration, and the size of every segment to utilize. The enormous amount of innovation derived from using HOMER software depends on the accessibility of energy systems and the projects’ objectives. HOMER’s enhancement and sensitivity calculations make it simpler to assess the numerous conceivable system designs [35,36]. HOMER mimics the operation of a system by making energy balance computations and presentats a rundown of configurations, arranged by the net present cost that can be utilized to analyze framework plan. Many resources such as wind turbine (WT), PV array, fuel cells, small hydropower, biomass, converter, batteries, and conventional generators are often modeled in HOMER. This software has been used in the present work to select and size the components of a hybrid power system.
2.2. Description of the System Components
This section presents a summary of the technical details of the photovoltaic (PV) modules, wind turbine (WT), system converter, the batteries (B), and the DG, which were used to run the HOMER simulation. The amount of electricity produced by this arrangement depends on the efficiency and arrangement of the PV system, which is arranged in a parallel panel form. The size of the PV and its output are determined to supply the required peak load demand. Generic flat plate PVs and DG are used in this study and their costs are taken from the manufacturer’s website [37]. In a hybrid energy system, WT performs the function of transforming wind energy into mechanical power, and mechanical power is converted into electric power [18,38]. The average monthly wind speed data of 10 years were obtained from the NASA database based on the selected longitude and latitude of the factory. The technical parameters used for the investigation obtained from the HOMER energy software [39] are shown in Table 1, Table 2 and Table 3.

Table 1.
Wind turbine.
Table 2.
Photovoltaic specification.
Table 3.
System inverter specification.
Table 3 shows the specification of a generic bi-directional converter system that converts the alternating current (AC) loads into direct current (DC). The lifetime of a unit was presumed to be 20 years with an efficiency of 90% [40].
The primary function of the DG whose parameters are shown in Table 4 is to supply steady power that not only charges the battery energy storage system but also supplies the load. The current diesel price of $0.5/liter in Oman was assumed and may increase soon [5].
Table 4.
DG set technical parameters.
In a hybrid configuration, during a low supply of renewable energy sources, energy stored in the battery can support the steady electric energy supply [41]. The battery bank achieves its stored capacity when a maximum state of charge (100%) is reached through the surplus energy generated by renewable and non-renewable energy. In this study, a generic 100 kWh Li-Ion battery of nominal capacity 100 kWh, and the nominal bus voltage of 600 V was used. The economic and technical characteristics of the selected generic 100 kWh Li-Ion battery were obtained from HOMER energy software [39].
2.3. System Description
2.3.1. Factory Load Profile
The first step in load analysis is identifying the load required to be able to provide the option for the load demand. The factory’s loads can vary with time and duration depending on the operation and work process line of the company. However, for a factory that follows steady product line production, the load may not vary significantly as observed in Table 5. HOMER software follows two methods of either day-to-day or step-to-time-step randomness in calculating the load profile [39]. In HOMER software, an algorithm determines the operating hours of the electrical appliances using a probabilistic approach [28,36,42]. The appliances and load consumption for the cement factory are calculated using Equation (1) and are displayed in Table 5.
where: W means wattage per day and h stands for an hour of operation per day.
Table 5.
Estimated electricity load requirement for the present cement factory in Salalah.
2.3.2. Solar Energy Availability
Solar energy is the most promising of the renewable energy sources because of its apparent unlimited potential in Salalah. Globally, the sun radiates its energy at the rate of about 3.8 × 10²³ kW per second and most of the energy is transferred radially as electromagnetic radiation resulting in about 1.5 kW/m2 at the top of the atmosphere. Solar radiation is converted into a renewable energy source by utilizing photovoltaic cells of efficiency between 15–12%. In general, the significant parts of a photovoltaic system incorporate the arrays, which comprise the photovoltaic transformation systems, their interconnections and support, and power conditioning equipment that converts the DC to AC and gives directed yields of voltage and current.
Figure 2 shows the monthly values of solar radiation at the factory location averaged over 20 years. Data is from the NASA surface meteorology and solar energy website (NASA) [43].
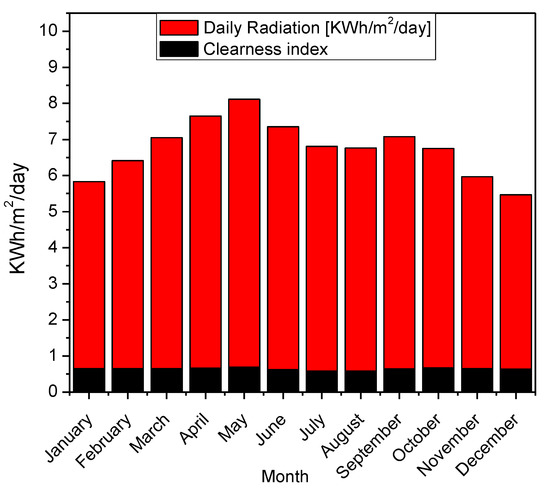
Figure 2.
Average solar radiation data of the Salalah cement factory community.
The clearness index is portrayed as a fraction resulting from solar radiation and is displayed in Figure 2. The radiation in the factory location (17°1′ N, 54°6′ E) varies between (5.69 and 8.21) kWh/m2/d throughout the year. The monthly solar radiation cycle can change during the year due to seasonal change in the sun angle and climate, which are affected by a few factors, for example, downpour, haze, wind, temperature, and daylight [38]. In breaking down the solar radiation of a given load demand, the HOMER software computes the PV cluster in terms of rated kW and expects the solar yield of the PV array to be directly relative to the occurrence radiation [39]. The software utilizes the data from the latitude and longitude position of a plane to obtain the clearness record.
2.3.3. Temperature Profile
The measured temperature profile of the cement factory environment concerning solar radiation is shown in Figure 3. It is known that the functional efficiency of renewable energy sources strongly depends on the predominant environmental conditions [44,45].
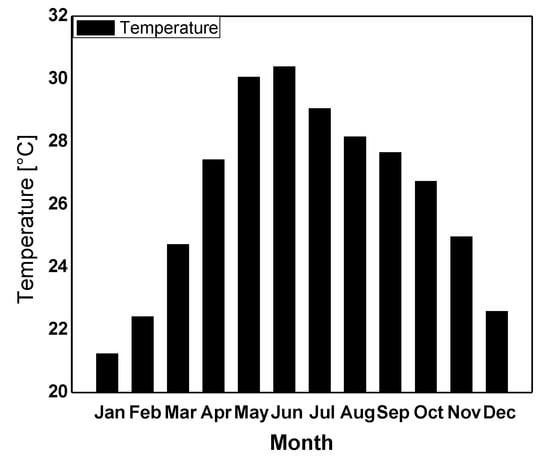
Figure 3.
The monthly temperature in one year.
Temperature ranges from 25 to 30 degrees can be seen between March and November (Figure 4). The HOMER software calculates the average temperature of a location in determining the PV power efficiency [36]. Hence, a clear correlation can be seen between the average solar radiation data shown in Figure 2 and the average daily temperature displayed in Figure 3.
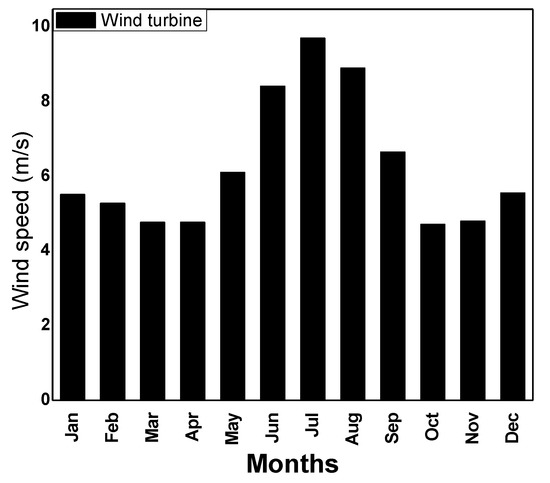
Figure 4.
Average wind profile in the cement factory environment.
2.3.4. Wind Turbine Profile
The monthly average wind speed at the factory location, measured at 50 m above the surface of the earth in the Salalah, Oman factory location from the NASA database (NASA, 2015) is shown in Figure 4. It can also be seen that the wind speed is at a peak between July and August.
Variation in wind speed throughout the year can be attributed to different weather seasons that occur in the community [46]. However, the wind speed must reach a certain threshold to be able to generate significant electricity as shown in Figure 5. The maximum power of 1.1 kW observed in Figure 5 for the wind power may not be enough to power a 2023.250 kWh per day load (Table 4).
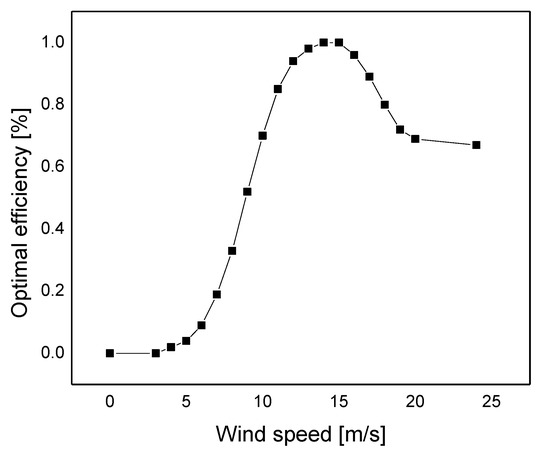
Figure 5.
Wind power vs wind speed plots.
However, the availability of large wind turbines can generate enough electricity to power the cement factory. Nevertheless, from an economic perspective, big turbines can be expensive for the factory to invest in.
2.4. Economic Mathematical Models
The feasibility study of the existing factory was reviewed as part of the project plan and the meteorological data, as well as loads in different locations of the cement factory, were obtained and analyzed. The survey showed that despite the energy supply from the DG used for the company’s power generation, the potential of the prevailing renewable energy sources available in the Salalah region can be used to address the electric energy challenges of the cement factory [47]. Economic consideration and analysis are very crucial in the simulation process. HOMER compares the economics of a wide range of system configurations of renewable and non-renewable sources, which accounts for the capital and operating cost of each energy source [48]. HOMER calculates the operating cost of a hybrid energy system as the yearly value of all costs other than the initial capital cost using Equation (2)
where Cann.tot = the total yearly cost ($/year) and Cann.cap is the total yearly capital cost ($/year).
In optimizing the hybrid energy system, HOMER considers the net present cost (NPC) parameter and generates an optimal system with minimum NPC. The following hybrid energy systems were configured and analyzed. They include PV/DG/WT/B, PV/WT/B, PV/B, and DG. The NPC of a hybrid energy system is used to describe the life cycle cost of a hybrid energy system in HOMER software. The NPC is calculated by subtracting the values of all the revenues earned by a system from the present value of all the costs incurred over the system’s lifetime calculated using Equation (3) [49].
where
TAC = the total yearly cost ($/year), i = the yearly interest rate, N stands for the project lifetime. is the capital recovery factor given as
The COE is the average cost per kilowatt-hour of useful electric energy produced by a renewable or non-renewable energy source. It is calculated by HOMER software using Equation (5) [49].
where
- Eanloadserved = the total yearly load served by the system in kWh.
In performing a feasibility analysis of the systems, alternative economic performance measures such as return on investment (ROI) is considered. In the economic analysis, the feasibility study is also determined by ROI and represented in Equation (6) [50].
where
- Ci,ref = the reference system nominal yearly cash flow
- Ci implies the current system nominal yearly cash flow
- Ccap is the current capital cost and Ccap ref is the reference capital cost.
In this study, the above four basic economic parameters, net present cost (NPC), cost of energy (COE), return on investment (ROI), and initial rate of return (IRR) are used to evaluate the performance of the configured hybrid energy systems. Furthermore, each of the hybrid energy systems was analyzed to understand how each of the systems meets the factory electrical energy demand. This process involves considering some of the financial parameters such as operating cost, NPC, COE, initial capital cost, and replacement cost of each system. Also, CO2 emissions, production of each hybrid energy system, and excess energy are considered in the economic analysis, as these account for the economical and environmentally friendly nature of the selected hybrid energy system.
2.5. Existing and Proposed Energy Power Supply Scenarios
In HOMER, each part of the hybrid renewable energy systems (HRES) that creates, conveys, converts, or saves energy is named as a component. Several components such as generators, wind turbines, and photovoltaic cells are modeled in the software as components that convert electrical energy to other forms of energy. While batteries are used to store energy, other renewable energy sources have been utilized as an energy generator by different authors [51,52].
Figure 6 shows the schematic diagram of the existing and proposed hybrid energy system for the Salalah cement factory. Presently, the factory source of electrical power is from the DG. The emission caused by running the diesel generator for this period in a year can significantly affect the environment if not controlled. In a conventional hybrid energy system, AC/DC power converters are required for power conversion between AC power lines and the DC sides of the system as shown in Figure 7b. However, for the AC supply, power conversion is not involved, as electrical power is supplied directly to load.
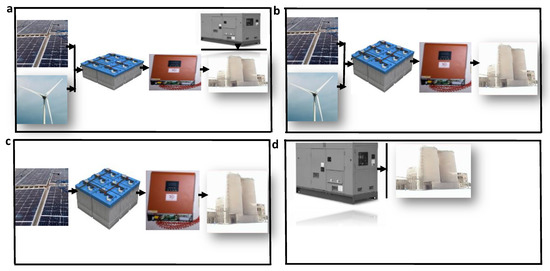
Figure 6.
Schematic diagram of the (a) photovoltaic (PV)/diesel generator (DG)/wind turbine (WT)/battery (B) (b) PV/WT/B (c) PV/B, (d) DG hybrid energy arrangements.
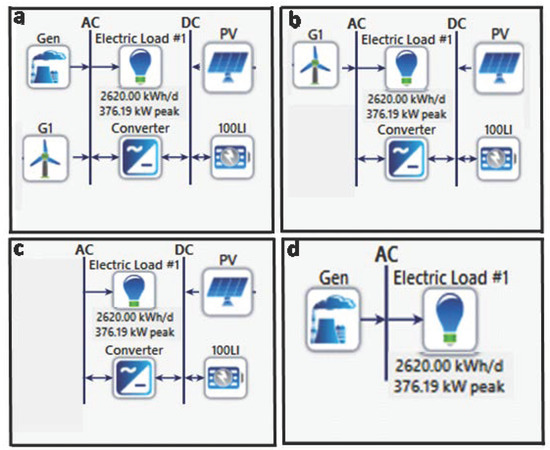
Figure 7.
Schematic diagram of the hybridized (a) PV/DG/WT/B (b) PV/WT/B (c) PV/B and (d) DG systems.
Figure 6 displays the components of each hybrid system and shows the set of all possible variables in the system configuration. HOMER simulates all possible configurations and simulates solar and wind as renewable resources. HOMER also checks for emissions, system control variables, economics, and restraints concerning the hybrid arrangement (Figure 6).
3. Hybrid System Optimization and Modeling
The hybrid energy system comprises two or more energy sources or storage systems combined to produce a more efficient source of power than individual energy sources. By combining different electric energy sources, the disadvantages of each of the components can be minimized [53,54]. In the arrangement, a converter is employed to convert the DC power outputs from the renewable energy sources to AC power for feeding the factory electrical load. Incorporation of the battery into the hybrid energy system ensures that the excess electricity produced by the PV or wind sources is stored in the battery [55]. The specifications of these components account for the system cost, design, and efficiency. The configuration of hybrid systems considered in this study is shown in Figure 7.
The present study system consists of PV, WT, and DG, with the battery as a backup and storage system as shown in Table 6.
Table 6.
System component cost.
Each of the sources has its own merits and demerits, and the application of each source depends on the use and economic viability. HOMER performs the size optimization of the system components with an aim of finding a system that displays the minimum net present cost (NPC) or levelized cost of energy (COE) [56]. The annualized cost includes capital cost, operation, and maintenance (O&M) cost, and replacement minus any miscellaneous expenses such as CO2 emission [35]. The simulation utilizing HOMER was performed to obtain the optimal power requirement that meets the electrical load needs of the factory under consideration.
4. Results and Discussion
The main objective of this study was to assess the feasibility and economic viability of utilizing the most effective hybrid energy system to meet the electrical demands of a cement factory located in Salalah, Oman. In obtaining the best possible economic scenarios, HOMER calculated an hourly time series simulation for each possible hybrid energy system to assess the characteristics and economic feasibility. The simulation results for the various hybrid energy systems are discussed in the subsequent sections.
4.1. Average Yearly Electricity Production and Usage
Figure 8 displays the yearly average electricity production, consumption, and excess of the proposed hybrid energy systems. For the PV/DG/WT/B hybrid system, 35.7%, 64.2%, and 0.012% of the electric production is supplied by the DG, PV, and WT components, respectively. Figure 8 shows that for the PV/B hybrid energy system, 100% of the electric production is supplied by PV components. For the standalone DG system, 100% of the electricity is produced by the DG. The comparison of electric generation for the four hybrid energy systems shows that the PV/DG/WT/B, PV/WT/B, PV/B, and DG hybrid energy systems generate total electricity of 1,160,945 kWh/year, 1,159,958 kWh/year, 994,252 kWh/year, and 1,261,794 kWh/year, respectively, which are used to charge the battery as well as supply the electrical load. Among the generated total energy, PV contributed 64.2%, 100%, 100%, and 0% electricity for the PV/DG/WT/B, PV/WT/B, PV/B, and DG hybrid energy systems, respectively. The analysis showed that 0, 3.75, 3.83, and 0% of the electric load was in excess for the respective PV/DG/WT/B, PV/WT/B, PV/B, and DG hybrid energy systems.
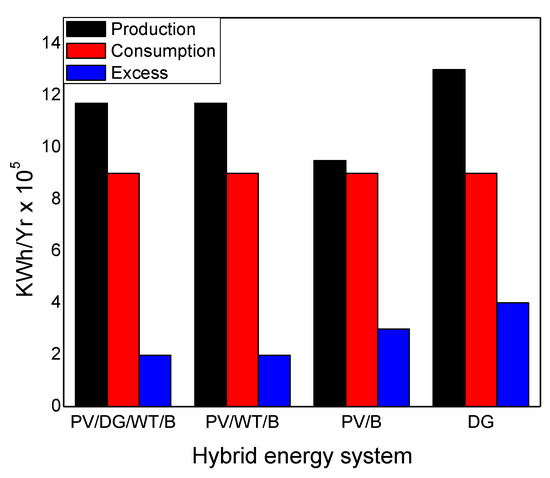
Figure 8.
Comparison of energy production, consumption, and excess by the four hybrid energy systems.
Figure 8 shows that the PV/DG/WT/B, PV/WT/B, PV/B, and DG systems have electrical load consumptions of 933,898, 956,300, 956,300, and 933,974 kWh/year, respectively. The energy consumption can be attributed to the average annual load demand in the factory systems. When the electrical power produced by the PV modules exceeds the load demand, the excess electrical power is stored in the battery for use during low supply from the other electric sources.
4.2. Hybrid Energy System Cost Analysis
The HOMER software optimizes the designed hybrid energy system configuration according to the load profile, and the result is presented in Table 7. Table 7 shows that the capital costs for the PV/DG/WT/B system are the highest and are attributed to the high capital conglomerate of the hybrid components that make up the hybrid energy system. While the PV/DG/WT/B and DG have high fuel consumption, the two renewable bases hybrid energy systems have the lowest replacement cost and are zero-emission, making the renewable energy system more viable to operate (Table 7).
Table 7.
Detailed costs of the hybrid energy systems (HESs).
As highlighted earlier, the cost of energy (COE) and net present cost (NPC) are essential economic criteria used to investigate the economic feasibility of a given hybrid energy system [57]. It was reported that the NPC and COE are considered to be appropriate indicators to appraise the optimal plan for a renewable energy system as compared to a non-renewable energy system [58]. While the COE is expressed as the ratio of system components’ annual cost divided by the total energy generated, the NPC is calculated as the current value of all the initial capital costs, costs of the replacement, cost incurred in operating and maintenance (O & M), and fuel costs minus the current value of all the revenues [38].
Figure 9 shows the comparative cost analysis of the system components in terms of the NPC and COE for the four hybrid energy systems. In this study, the NPC and COE are calculated for the entire system based on an expected life of 20 years.
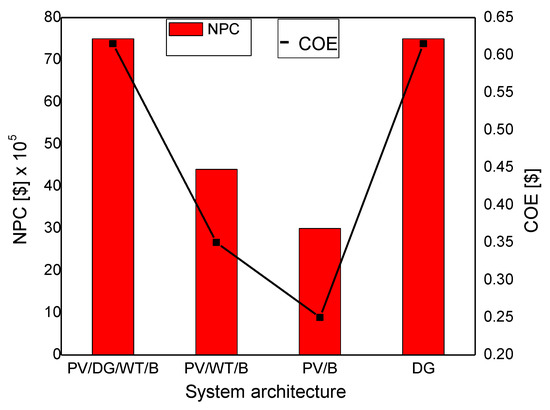
Figure 9.
System cost comparison in terms of the net present cost (NPC) and cost of energy (COE).
From Figure 9, the two renewable-energy-based hybrid energy systems (PV/B and PV/TW/B) have the lowest NPC and COE, followed by the non-renewable-energy-based systems. The lower NPC and COE also observed in the renewable-energy-based systems can be ascribed to the direct relationship between solar radiation and the NPC and COE. The higher the solar radiation, the more energy is generated through the renewable energy sources, the lower the NPC and COE values. Despite the fact that the PV/DG/WT/B and DG systems have a high capital cost, the amount of carbon emission from these two systems is considerably high, compared to the other purely renewable energy systems (PV/WT/B and PV/B). Furthermore, considering prevailing power generation practices involving the environment, the DG system may not be a better option for the cement factory. Notwithstanding the two renewable hybrid energy systems having low NPC and COE values, the PV/B system has NPC and COE values of $3,062,360 and $0.2505 respectively, compared to the PV/WT/B system, which has NPC and COE values of $4,350,338 and $0.3559 respectively, making the PV/B system the preferred choice to meet the cement factory’s electricity demand.
4.3. System Pollutant and Emission
The greenhouse (GHG) emissions statistics in the four hybrid energy systems are shown in Table 8. The renewable energy hybrid systems can significantly reduce the GHE by producing little or no pollution gases as evidenced in Table 8.
Table 8.
Emissions from the four renewable energy systems.
A high amount of carbon emission and other related particles experienced in PV/DG/WT/B and DG hybrid energy systems is associated with the number of liters of diesel consumed by the generator per year [59]. While the PV/DG/WT/B and DG hybrid energy systems display different levels of emission particles, the renewable energy systems show no emission (Table 7). More so, the PV/WT/B and PV/B hybrid energy system configuration provides greater savings in terms of CO2, CO, and SO2 emission, compared to the other systems. Furthermore, renewable energy systems are environmentally friendly and therefore can be promising as an alternative energy source for the cement factory compared to diesel engines. Comparatively, although the two pure renewable hybrid energy systems considered in this study displayed evidence of no emission, the lower NPC and COE values observed in the PV/B hybrid energy system compared with PV/WT/B may provide a better choice for application of the PV/B system to meet the electrical load demand of the mini-factory in Salalah.
4.4. Return on Investment (ROI) and Internal Rate of Return (IRR) Analysis
Further analysis is required to understand the economic viability of investing in any of the proposed hybrid systems for the cement factory in Salalah. Economic parameters such as ROI and IRR are often performed to understand the viability and sustainability of a given project [60]. While ROI analysis is used to processes the gain or loss produced on a project investment compared to the amount of money financed, IRR is used to estimate the profitability of potential investments. Figure 10 shows the ROI and IRR results of the four hybrid energy systems under consideration.
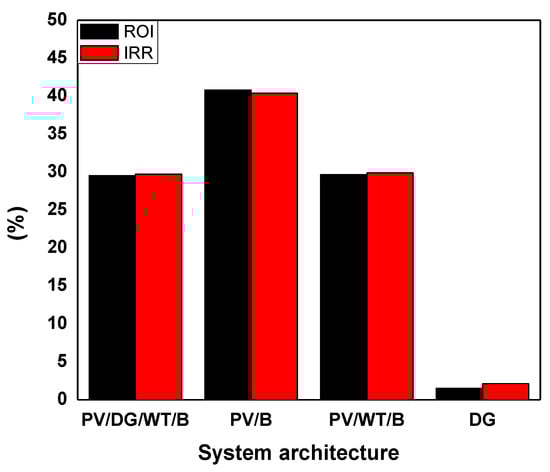
Figure 10.
Return on investment (ROI) and internal rate of return (IRR) analysis.
It can be observed that the PV/WT/B and PV/B hybrid energy systems have higher ROI and IRR values compared to the PV/DG/WT/B and DG hybrid energy systems. As seen in Figure 10, while the two renewable hybrid energy systems (PV/WT/B and PV/B hybrid) have high ROI and IRR values, the PV/B hybrid energy system has the highest ROI and IRR values of 40.8% and 40.36%, making the system the best option for the Salalah mini-factory electricity source of power. The highest ROI and IRR for the PV/B system can be ascribed to the efficiency of the system and the potential of providing profit throughout the project life cycle.
5. Conclusion
Diesel generators still dominate the electricity generator market for off-grid remote areas and have contributed to greenhouse emissions (GHE). The utilization of renewable energy technologies in off-grid hybrid energy systems has led to increasing electrical energy production and consumption. In this study, a standalone DG system that was able to cover the energy demand of a cement factory was investigated, and alternative renewable energy sources were designed, evaluated, and optimized using HOMER Pro software.
HOMER joins both economical and electrical features while calculating the optimal power system setup. Since the output of the power system simulation from HOMER programming relies on the input data, special attention was focused on the market price and energy-consuming equipment. Although HOMER represents reliable software, it has its constraints and limitations. At the point when the electrical load is not constant throughout the year, HOMER will severely calculate and present peak load, the autonomy of battery bank, and expected battery life computed. Likewise, HOMER does not consider losses on the AC bus, and it advances the activity of the fossil fuel generator. Also, HOMER combines factors such as cloudiness, rain, fog, etc. in calculating the efficiency of the components. Notwithstanding, these constraints have no effect on the simulation results [42].
Our results show that the renewable-based systems have lower NPC and COE compared to the DG and DG-based hybrid energy systems. While the two renewable-energy-based hybrid energy systems (PV/B and PV/TW/B) displayed low NPC and COE, the PV/B showed the lowest values for NPC and COE, making the PV/B the preferred choice for the cement factory. The PV/DG/WT/B and DG systems have significant pollution emission compared with the PV/WT/B and PV/B, making the system non-environmentally friendly. In terms of investment prospects, our findings show that despite no emission of the renewable systems, the renewable PV/B energy systems have the highest ROI and IRR values, making the renewable energy hybrid system the preferred choice to fulfill the factory electricity demand. Despite Oman being oil and natural gas “rich”, the R/P ratios of those non-renewable fuels suggest that Oman needs to either begin shifting to renewable energy sources, or to direct current energy exports to domestic use [61].
Author Contributions
Conceptualization, W.H.B. and O.A.; Formal analysis, P.C.O. and W.H.B.; Methodology, W.H.B. and F.A.H.; Software, P.C.O.; Writing—original draft, P.C.O. and W.A.; Writing—review and editing, P.C.O. and W.H.B. All authors have read and agreed to the published version of the manuscript.
Funding
This research received no external funding.
Institutional Review Board Statement
Not applicable.
Informed Consent Statement
Not applicable.
Data Availability Statement
Data available on request due to restrictions e.g., privacy or ethical.
Conflicts of Interest
The authors declare no conflict of interest.
References
- Dudley, B. BP statistical review of world energy. BP Stat. Rev. 2018, 6, 2018. [Google Scholar]
- Safinia, S.; Al-Hinai, Z.; Yahia, H.A.; Abushammala, M.F. Sustainable construction in sultanate of Oman: Factors effecting materials utilization. Procedia Eng. 2017, 196, 980–987. [Google Scholar] [CrossRef]
- Azam, M.H.; Abushammala, M. Assessing the Effectiveness of Solar and Wind Energy in Sultanate of Oman. J. Stud. Res. 2017. [Google Scholar] [CrossRef]
- Kazem, H.A. Renewable energy in Oman: Status and future prospects. Renew. Sustain. Energy Rev. 2011, 15, 3465–3469. [Google Scholar] [CrossRef]
- Albadi, M.; El-Saadany, E.; Albadi, H. Wind to power a new city in Oman. Energy 2009, 34, 1579–1586. [Google Scholar] [CrossRef]
- Umar, T.; Wamuziri, S. Briefing: Conventional, wind and solar energy resources in Oman. Proc. Inst. Civ. Eng. Energy 2016, 169, 143–147. [Google Scholar] [CrossRef]
- Al-Badi, A.; Albadi, M.; Al-Lawati, A.; Malik, A. Economic perspective of PV electricity in Oman. Energy 2011, 36, 226–232. [Google Scholar] [CrossRef]
- Panwar, N.; Kaushik, S.; Kothari, S. Role of renewable energy sources in environmental protection: A review. Renew. Sustain. Energy Rev. 2011, 15, 1513–1524. [Google Scholar] [CrossRef]
- Liserre, M.; Sauter, T.; Hung, J.Y. Future energy systems: Integrating renewable energy sources into the smart power grid through industrial electronics. IEEE Ind. Electron. Mag. 2010, 4, 18–37. [Google Scholar] [CrossRef]
- Bajpai, P.; Dash, V. Hybrid renewable energy systems for power generation in stand-alone applications: A review. Renew. Sustain. Energy Rev. 2012, 16, 2926–2939. [Google Scholar] [CrossRef]
- Ashok, S. Optimised model for community-based hybrid energy system. Renew. Energy 2007, 32, 1155–1164. [Google Scholar] [CrossRef]
- Belhaouas, N.; Cheikh, M.-S.A.; Agathoklis, P.; Oularbi, M.-R.; Amrouche, B.; Sedraoui, K.; Djilali, N. PV array power output maximization under partial shading using new shifted PV array arrangements. Appl. Energy 2017, 187, 326–337. [Google Scholar] [CrossRef]
- Jacobson, M.Z.; Delucchi, M.A. Providing all global energy with wind, water, and solar power, Part I: Technologies, energy resources, quantities and areas of infrastructure, and materials. Energy Policy 2011, 39, 1154–1169. [Google Scholar] [CrossRef]
- Lewis, J.I.; Wiser, R.H. Fostering a renewable energy technology industry: An international comparison of wind industry policy support mechanisms. Energy Policy 2007, 35, 1844–1857. [Google Scholar] [CrossRef]
- Peterseim, J.H.; White, S.; Tadros, A.; Hellwig, U. Concentrating solar power hybrid plants–Enabling cost effective synergies. Renew. Energy 2014, 67, 178–185. [Google Scholar] [CrossRef]
- Lajunen, A. Energy consumption and cost-benefit analysis of hybrid and electric city buses. Transp. Res. Part C Emerg. Technol. 2014, 38, 1–15. [Google Scholar] [CrossRef]
- Al-Falahi, M.D.; Jayasinghe, S.; Enshaei, H. A review on recent size optimization methodologies for standalone solar and wind hybrid renewable energy system. Energy Convers. Manag. 2017, 143, 252–274. [Google Scholar] [CrossRef]
- Sawle, Y.; Gupta, S.; Bohre, A.K. Review of hybrid renewable energy systems with comparative analysis of off-grid hybrid system. Renew. Sustain. Energy Rev. 2018, 81, 2217–2235. [Google Scholar] [CrossRef]
- Panapakidis, I.P.; Sarafianos, D.N.; Alexiadis, M.C. Comparative analysis of different grid-independent hybrid power generation systems for a residential load. Renew. Sustain. Energy Rev. 2012, 16, 551–563. [Google Scholar] [CrossRef]
- Al-Badi, A.H.; Bourdoucen, H. Economic analysis of hybrid power system for rural electrification in Oman. In Proceedings of the 2009 2nd International Conference on Adaptive Science & Technology (ICAST), Accra, Ghana, 14–16 January 2009; pp. 284–289. [Google Scholar]
- Valente, L.C.G.; de Almeida, S.C.A.b. Economic analysis of a diesel/photovoltaic hybrid system for decentralized power generation in northern Brazil. Energy 1998, 23, 317–323. [Google Scholar] [CrossRef]
- Ramli, M.A.; Hiendro, A.; Twaha, S. Economic analysis of PV/diesel hybrid system with flywheel energy storage. Renew. Energy 2015, 78, 398–405. [Google Scholar] [CrossRef]
- Fazelpour, F.; Soltani, N.; Rosen, M.A. Economic analysis of standalone hybrid energy systems for application in Tehran, Iran. Int. J. Hydrogen Energy 2016, 41, 7732–7743. [Google Scholar] [CrossRef]
- Amutha, W.M.; Rajini, V. Cost benefit and technical analysis of rural electrification alternatives in southern India using HOMER. Renew. Sustain. Energy Rev. 2016, 62, 236–246. [Google Scholar] [CrossRef]
- Rajbongshi, R.; Borgohain, D.; Mahapatra, S. Optimization of PV-biomass-diesel and grid base hybrid energy systems for rural electrification by using HOMER. Energy 2017, 126, 461–474. [Google Scholar] [CrossRef]
- Shahzad, M.K.; Zahid, A.; ur Rashid, T.; Rehan, M.A.; Ali, M.; Ahmad, M. Techno-economic feasibility analysis of a solar-biomass off grid system for the electrification of remote rural areas in Pakistan using HOMER software. Renew. Energy 2017, 106, 264–273. [Google Scholar] [CrossRef]
- Li, C.; Ge, X.; Zheng, Y.; Xu, C.; Ren, Y.; Song, C.; Yang, C. Techno-economic feasibility study of autonomous hybrid wind/PV/battery power system for a household in Urumqi, China. Energy 2013, 55, 263–272. [Google Scholar] [CrossRef]
- Sen, R.; Bhattacharyya, S.C. Off-grid electricity generation with renewable energy technologies in India: An application of HOMER. Renew. Energy 2014, 62, 388–398. [Google Scholar] [CrossRef]
- Das, H.S.; Tan, C.W.; Yatim, A.; Lau, K.Y. Feasibility analysis of hybrid photovoltaic/battery/fuel cell energy system for an indigenous residence in East Malaysia. Renew. Sustain. Energy Rev. 2017, 76, 1332–1347. [Google Scholar] [CrossRef]
- Mandal, S.; Das, B.K.; Hoque, N. Optimum sizing of a stand-alone hybrid energy system for rural electrification in Bangladesh. J. Clean. Prod. 2018, 200, 12–27. [Google Scholar] [CrossRef]
- Lozano, L.; Querikiol, E.M.; Abundo, M.L.S.; Bellotindos, L.M. Techno-economic Analysis of a Cost-effective Power Generation System for Off-grid Island Communities: A Case Study of Gilutongan Island, Cordova, Cebu, Philippines. Renew. Energy 2019, 140, 905–911. [Google Scholar] [CrossRef]
- Olatomiwa, L.; Mekhilef, S.; Huda, A.; Ohunakin, O.S. Economic evaluation of hybrid energy systems for rural electrification in six geo-political zones of Nigeria. Renew. Energy 2015, 83, 435–446. [Google Scholar] [CrossRef]
- Chaichan, M.T.; Kazem, H.A.; Mahdy, A.M.; Al-Waeely, A.A. Optimal sizing of a hybrid system of renewable energy for lighting street in Salalah-Oman using Homer software. Int. J. Sci. Eng. Appl. Sci. (IJSEAS) 2016, 2, 157–164. [Google Scholar]
- Okonkwo, P.C.; Barhoumi, E.M.; Murugan, S.; Zghaibeh, M.; Otor, C.; Abo-Khalil, A.G.; Amer Mohamed, A.M. Economic analysis of cross-breed power arrangement for Salalah region in the Al-Khareef season. Int. J. Sustain. Energy 2020, 1–19. [Google Scholar] [CrossRef]
- Ajao, K.; Oladosu, O.; Popoola, O. Using HOMER power optimization software for cost benefit analysis of hybrid-solar power generation relative to utility cost in Nigeria. Int. J. Res. Rev. Appl. Sci. 2011, 7, 96–102. [Google Scholar]
- Givler, T.; Lilienthal, P. Using HOMER Software, NREL’s Micropower Optimization Model., to Explore the Role of Gen.-Sets in Small Solar Power Systems; Case Study: Sri Lanka; National Renewable Energy Lab: Golden, CO, USA, 2005.
- Solar Choice. 5 kW solar systems: Pricing, output, and returns. In Solar Choice Solar PV Energy System Installation Brokers 5 kW Solar Systems Pricing Output and Returns Comments; Available online: https://www.solarchoice.net.au/blog/5kw-solar-system-price-output-return/ (accessed on 22 December 2020).
- Baneshi, M.; Hadianfard, F. Techno-economic feasibility of hybrid diesel/PV/wind/battery electricity generation systems for non-residential large electricity consumers under southern Iran climate conditions. Energy Convers. Manag. 2016, 127, 233–244. [Google Scholar] [CrossRef]
- Energy, H. Homer Pro Version 3.7 User Manual; HOMER Energy: Boulder, CO, USA, 2016. [Google Scholar]
- Mirhassani, S.; Ong, H.C.; Chong, W.; Leong, K. Advances and challenges in grid tied photovoltaic systems. Renew. Sustain. Energy Rev. 2015, 49, 121–131. [Google Scholar] [CrossRef]
- Divya, K.; Østergaard, J. Battery energy storage technology for power systems—An overview. Electr. Power Syst. Res. 2009, 79, 511–520. [Google Scholar] [CrossRef]
- Bahramara, S.; Moghaddam, M.P.; Haghifam, M. Optimal planning of hybrid renewable energy systems using HOMER: A review. Renew. Sustain. Energy Rev. 2016, 62, 609–620. [Google Scholar] [CrossRef]
- Abdul-Wahab, S.; Charabi, Y.; Al-Mahruqi, A.M.; Osman, I.; Osman, S. Selection of the best solar photovoltaic (PV) for Oman. Sol. Energy 2019, 188, 1156–1168. [Google Scholar] [CrossRef]
- Al-Habsi, M.; Gunawardhana, L.; Al-Rawas, G. Trend analysis of climate variability in Salalah, Oman. Int. J. Stud. Res. Technol. Manag. 2014, 2, 168–171. [Google Scholar]
- Al Charabi, Y.; Al-Yahyai, S. Projection of future changes in rainfall and temperature patterns in Oman. J. Earth Sci. Clim. Chang. 2013, 4, 1–8. [Google Scholar] [CrossRef]
- Efe, S.; Ogban, F.; Horsfall, M.J.; Akporhonor, E. Seasonal variations of physico-chemical characteristics in water resources quality in western Niger Delta region, Nigeria. J. Appl. Sci. Environ. Manag. 2005, 9, 191–195. [Google Scholar]
- Dufo-López, R.; Bernal-Agustín, J.L.; Yusta-Loyo, J.M.; Domínguez-Navarro, J.A.; Ramírez-Rosado, I.J.; Lujano, J.; Aso, I. Multi-objective optimization minimizing cost and life cycle emissions of stand-alone PV–wind–diesel systems with batteries storage. Appl. Energy 2011, 88, 4033–4041. [Google Scholar] [CrossRef]
- Liu, G.; Rasul, M.; Amanullah, M.; Khan, M.M.K. Feasibility study of stand-alone PV-wind-biomass hybrid energy system in Australia. In Proceedings of the 2011 Asia-Pacific Power and Energy Engineering Conference, Wuhan, China, 25–28 March 2011; pp. 1–6. [Google Scholar]
- Das, B.K.; Hoque, N.; Mandal, S.; Pal, T.K.; Raihan, M.A. A techno-economic feasibility of a stand-alone hybrid power generation for remote area application in Bangladesh. Energy 2017, 134, 775–788. [Google Scholar] [CrossRef]
- Reddy, K.Y. Economic analysis of trickle irrigation system considering planting geometry. Agric. Water Manag. 1997, 34, 195–206. [Google Scholar]
- Shinnar, R. The hydrogen economy, fuel cells, and electric cars. Technol. Soc. 2003, 25, 455–476. [Google Scholar] [CrossRef]
- Sorensen, B. Hydrogen and Fuel Cells: Emerging Technologies and Applications; Elsevier Academic Press: Amsterdam, The Netherlands, 2005. [Google Scholar]
- Nelson, D.; Nehrir, M.; Wang, C. Unit sizing and cost analysis of stand-alone hybrid wind/PV/fuel cell power generation systems. Renew. Energy 2006, 31, 1641–1656. [Google Scholar] [CrossRef]
- Zhou, W.; Lou, C.; Li, Z.; Lu, L.; Yang, H. Current status of research on optimum sizing of stand-alone hybrid solar–wind power generation systems. Appl. Energy 2010, 87, 380–389. [Google Scholar] [CrossRef]
- Dolatabadi, A.; Ebadi, R.; Mohammadi-Ivatloo, B. A two-stage stochastic programming model for the optimal sizing of hybrid PV/diesel/battery in hybrid electric ship system. J.Oper. Autom. Power Eng. 2019, 7, 16–26. [Google Scholar]
- Shiroudi, A.; Rashidi, R.; Gharehpetian, G.; Mousavifar, S.; Akbari Foroud, A. Case study: Simulation and optimization of photovoltaic-wind-battery hybrid energy system in Taleghan-Iran using homer software. J. Renew. Sustain. Energy 2012, 4, 053111. [Google Scholar] [CrossRef]
- Kusakana, K.; Vermaak, H. Cost and performance evaluation of hydrokinetic-diesel hybrid systems. Energy Procedia 2014, 61, 2439–2442. [Google Scholar] [CrossRef][Green Version]
- Acar, C.; Dincer, I. Comparative assessment of hydrogen production methods from renewable and non-renewable sources. Int. J. Hydrogen Energy 2014, 39, 1–12. [Google Scholar] [CrossRef]
- Szabo, S.; Bódis, K.; Huld, T.; Moner-Girona, M. Energy solutions in rural Africa: Mapping electrification costs of distributed solar and diesel generation versus grid extension. Environ. Res. Lett. 2011, 6, 034002. [Google Scholar] [CrossRef]
- Brockway, P.E.; Owen, A.; Brand-Correa, L.I.; Hardt, L. Estimation of global final-stage energy-return-on-investment for fossil fuels with comparison to renewable energy sources. Nat. Energy 2019, 4, 612–621. [Google Scholar] [CrossRef]
- Warner, K.J.; Jones, G.A. Energy and population in sub-Saharan Africa: Energy for four billion? Environments 2018, 5, 107. [Google Scholar] [CrossRef]


Publisher’s Note: MDPI stays neutral with regard to jurisdictional claims in published maps and institutional affiliations. |
© 2020 by the authors. Licensee MDPI, Basel, Switzerland. This article is an open access article distributed under the terms and conditions of the Creative Commons Attribution (CC BY) license (http://creativecommons.org/licenses/by/4.0/).