Abstract
An important component in improving the quality of forests is to study the interference intensity of forest fires, in order to describe the intensity of the forest fire and the vegetation recovery, and to improve the monitoring ability of the dynamic change of the forest. Using a forest fire event in Bilahe, Inner Monglia in 2017 as a case study, this study extracted the burned area based on the BAIS2 index of Sentinel-2 data for 2016–2018. The leaf area index (LAI) and fractional vegetation cover (FVC), which are more suitable for monitoring vegetation dynamic changes of a burned area, were calculated by comparing the biophysical and spectral indices. The results showed that patterns of change of LAI and FVC of various land cover types were similar post-fire. The LAI and FVC of forest and grassland were high during the pre-fire and post-fire years. During the fire year, from the fire month (May) through the next 4 months (September), the order of areas of different fire severity in terms of values of LAI and FVC was: low > moderate > high severity. During the post fire year, LAI and FVC increased rapidly in areas of different fire severity, and the ranking of areas of different fire severity in terms of values LAI and FVC was consistent with the trend observed during the pre-fire year. The results of this study can improve the understanding of the mechanisms involved in post-fire vegetation change. By using quantitative inversion, the health trajectory of the ecosystem can be rapidly determined, and therefore this method can play an irreplaceable role in the realization of sustainable development in the study area. Therefore, it is of great scientific significance to quantitatively retrieve vegetation variables by remote sensing.
1. Introduction
Fires can influence the global carbon cycle and act as important disruptors of forest ecosystems by damaging large numbers of trees, changing tree species composition, reducing biomass and changing the surface landscape [1,2]. On the other hand, the succession resulting from forest fires plays an important role in adjusting the structure of the plant community and maintaining species diversity, which is an indispensable driving force for the development of the forest ecosystem plant community [3]. The severity of a forest fire relates to the degree of damage inflicted by the fire on the forest ecosystem, including to vegetation, soil nutrients and physical and chemical characteristics of the soil [4,5]. The fire severity refers to the loss or decomposition of organic matter aboveground and belowground. Metrics for this parameter vary with the ecosystem. [6]. The traditional method of calculating the forest fire severity according to the specific investigation technical standard includes observing and recording forest type, height, diameter at breast height and number of dead and surviving trees. The commonly used methods of evaluating forest fire severity include the following steps: (1) selecting a remote sensing spectral index; (2) combining the spectral index results with field investigation data; (3) conducting a regression analysis and establishing a quantitative equation [7,8]. Remote sensing information technology has become an important tool for monitoring vegetation growth as information is obtained rapidly and at large spatial scales [9]. In addition, remote sensing data are widely used in forest fire monitoring and assessment because of the large spatial areas that can be converted and the high temporal resolution and low cost of the data [10,11,12]. In this way, the technology allows for rapid analysis of damage to vegetation during the early post-fire stage as well as monitoring of vegetation succession over the long term. At present, the most widely used indices are the normalized burn ratio (NBR) and delta NBR (dNBR). The dNBR index is considered more suitable among the spectral indices for describing fire severity in dry Mediterranean climates [13]. Quantitative evaluation of forest fire severity is helpful for revealing the development and change in various ecological processes and the mechanisms responsible for forest vegetation succession after forest fires [14,15]. Quantitative evaluation can also be used to estimate loss in biomass resulting from a forest fire and can provide a reference for the study of vegetation recovery and the global carbon balance [16].
Research on fire severity has becoming increasingly popular in recent years. The traditional plot survey method is based on the composite burn index (CBI), which is a ground-based measure proposed by Key and Benson [13] in 2006. CBI remains the standard index used in field investigations and evaluations of forest fire severity within the United States Forest Service. The normalized burn index (NBR) was first proposed by Garcia and Lopez [17] as an alternative to the Normalized Difference Vegetation Index (NDVI), in which the red (R) band in the NDVI calculation formula is replaced by the short-wave infrared (SWIR) band. Further studies have shown that the dNBR is able to better represent the spatial distribution of forest fire severity compared to the NBR [7,18,19]. Previous studies have shown that the NBR index is more sensitive to changes in chlorophyll and vegetation water content, and have concluded that this index is the most valuable remote sensing method for assessing fire severity [8,20,21]. Most past studies of fire severity using remote sensing data are based on the red (R), near infrared (NIR) and short-wave infrared (SWIR) spectral regions [22]. However, few studies have to date linked the red-edge spectral domain to fire severity. Filipponi [23] in 2018 proposed the burned area index for Sentinel-2 (BAIS2) based on the Sentinel-2 red-edge spectral band. A study by Fernández-Manso et al. [24] of fires in Sierra de Gata, mid-western Spain in 2015 found that the red-edge band of Sentinel-2 data is very helpful for estimating the extent of damage caused by fire and for monitoring post-fire reconstruction.
Forest fires result in large-scale destruction of surface vegetation in forest ecosystems, which manifests in remote sensing images as a decrease and increase in the reflectance of the NIR and SWIR bands, respectively [25,26]. Vegetation recovery of a burned area is a function of various ecosystem factors. At present, medium and low-resolution remote sensing data are widely used for monitoring of vegetation recovery, including Landsat, Moderate Resolution Imaging Spectroradiometer (MODIS) and Advanced Very-High-Resolution Radiometer (AVHRR) data. Caselles et al. [27] in 1991 used the NIR and SWIR bands of thematic mapper (TM) images to conduct a disaster assessment following forest fires in Valencia, Spain, and to monitor vegetation regeneration within the burned area. Wimberly and Reilly [26] used TM images and the NBR to study the relationship between forest fire damage and local biodiversity in the southern Appalachian Mountains. Zhu [28] used multi-spectral and infrared data from satellites to map and classify the extent and severity of fires in fire-prone areas such as An Ning City, Yunnan Province. MODIS and Landsat TM/Enhanced Thematic Mapper (ETM+) (NASA, America) time series data are often used to conduct research on annual vegetation recovery. The NDVI is related to vegetation growth and coverage, and is generally used as an index to monitor dynamic changes in forest vegetation after a fire [29,30,31]. For example, Lanorte et al. [32] and Pena et al. [33] used NDVI to study vegetation recovery after fires of different severity. Xiao et al. [34] studied the impact of forest fires on vegetation and monitored recovery based on leaf area index (LAI), NDVI, enhanced vegetation index (EVI), land surface water index (LSWI) and other vegetation biophysical variables. Most of these studies were based on individual sources of remote sensing data, using one or several vegetation indices. However, there has, to date, not been a comparison between spectral indices and biophysical indices using high-resolution satellite optical data. This comparison is relevant as it can increase understanding of the mechanisms involved in post-fire vegetation recovery. The Sentinel-2 Multi-Spectral imager (MSI) sensor (ESA) provides opportunities to access open data characterized by a trade-off in spatiotemporal resolution (10–60 m pixel size and a 5-day temporal resolution) and to improve research on post-fire vegetation recovery [35]. Fernández-Manso et al. [24] and Navarro et al. [36] successfully evaluated fire severity based on Sentinel-2 MSI data.
In addition, recent studies [37,38] have demonstrated the applicability and even superiority of Sentinel-2 MSI data for natural resource applications. Biophysical indices are the variables related to the forest ecosystem, and those extracted from remote sensing data are mainly related to biophysical variables used in the study of the terrestrial ecosystem, including LAI, photosynthetic effective radiation absorption rate (FAPAR), fractional vegetation cover (FVC), canopy water content (CWC) and chlorophyll content in the leaf (CCL). These five variables represent essential climate variables (ECV) recognized by the Global Climate Observation System (GCOS) and the Global Terrestrial Observation System (GTOS) [39]. The advantages of the newly developed algorithm for Sentinel-2 imagery are two aspects in comparison with other (e.g., look-up table [40], the empirical relationship between biophysical variables and vegetation indices [41], etc.) derived biophysical variables methods. First, the algorithm is generic with no need for input of the specific land cover type and could be easily extended to the retrieval of vegetation biophysical variables at the global scale. Second, the algorithm has been integrated into SNAP software as a Simplified Level 2 Product Prototype Processor (SL2P) (ESA) tool that can be used by the public community to produce biophysical products [42,43]. That is, we can easily use the SL2P tool to estimate biophysics from a regional level to a global level. Therefore, the Sentinel-2 biophysical estimated by this algorithm will be widely used in ecological environments, even in various fields [43].
To date, there has not been a comparison between spectral indices and biological indices using high-resolution satellite optical data. The aim of this study was to quantify the short-term dynamic changes of vegetation post-fire. The burned area resulting from a mega forest fire in Bilahe in 2017 was used as a case study, and vegetation short-term dynamic changes after fires of different fire severity was studied using biophysical variables such as LAI and FVC generated from Sentinel-2 satellite data. The specific objectives of the present study were to: (1) extract the burned area and classify the severity of the fire using the BAIS2 index [23], and to verify these results against the NBR; (2) compare spectral indices with biophysical variables to identify biophysical variables that are more suitable for evaluating fire severity; (3) use biophysical indices to quantitatively measure vegetation changes of various land cover types in response to forest fires.
2. Materials and Methods
2.1. Research Data
2.1.1. Study Area
The present study investigated the area burnt by the 2017 Bilahe “5.02” mega forest fire. This huge forest fire occurred on 2 May 2017 in the Beidahe Forest Farm of the Bilahe Forestry Bureau, all open fire was finally put out at 10:30 on May 5, resulting in damage to 82.82 km2 of forest out of a total forest area of 115 km2 [44]. To select image the closest to occurrence time of fire, we used the Sentinel-2A image data (remote sensing data in Section 2.1.2) for 25 May 2017 in this study. Figure 1a is a false-color image of the burned area of Bilahe, based on Sentinel-2A remote sensing data and ArcGIS 10.6 software. There are some thin clouds in the west part of this image that for not to affects the accuracy of to extract the burned area, we remove this area completely. Figure 1b is a land cover classification map of burned area in the Bilahe, the dataset about land use is provided by the Finer Resolution Observation and Monitoring of Global Land Cover (FROM-GLC) (Tsinghua University) product in 2017, which is the world’s first set of Global Land Cover products with a resolution of 10 m [45] (http://data.ess.tsinghua.edu.cn). The land covers an area of 83.11 km2 included 42.81 km2 of Grassland (51.51%), 38.30 km2 of Forest (46.08%), 0.42 km2 of Cropland (0.50%), 0.0003 km2 of Shrubland (0.003%), 0.27 km2 of Wetland (0.33%), 1.08 km2 of Water (1.30%), 0.23 km2 of Impervious surface (0.27%) and 0.01 km2 of Bareland (0.01%). The Bilahe forestry bureau is located in the southeast slope of the Daxing’anling Mountains, which falls under the administrative rule of the Oroqen Autonomous Banner of Inner Mongolia, and has a geographic coordinate range of 122°40′36″–123°55′00″ E, 49°00′37″–49°54′49″ N and a total area of 4716.46 km2. The terrain of the forest area is relatively gentle with only small variations in elevation, and is generally high in the southwest and low in the northeast. The dimensions of the forest are ~84 km long in the north and south and ~45 km wide in the east and west, with a slope of ~15° and an altitude of 268 m–1235 m. The zonal soil includes meadow soil, dark brown soil and chernozem; whereas the non-zonal soils include meadow soil and swamp soil. This study area falls within the cold temperate zone and has a continental monsoon climate. The region has cold and long winter, short and rainy summers, with a high variation in temperature difference between day and night over the four seasons. The annual average temperature and precipitation is 1.1 °C and 479.4 mm, respectively, and the rainy season extends from July to August, accounting for 50–60% of total annual precipitation. The vegetation of the area is dominated by flora of Eastern Siberian, Mongolian, and East Asian. Some common plant/tree species include Larix gmelini Rupr., Betula platyphylla Suk., Betula davurica Pall., Populus davidiana Dode. The more scattered species include Phellodendron amurense Rupr., fraxinus mandshurica Rupr. and Tilia amurensis Rupr. The area has a rich diversity of undergrowth herbs [46].
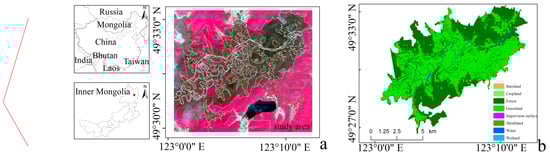
Figure 1.
Location of the study area. (a) False color image of the burned area of Bilahe (post-fire: 25 May 2017); (b) land cover classification map of burned land in the Bilahe Forest Bureau (pre-fire).
2.1.2. Remote Sensing Data
The use of Sentinel-2 data can further improve environmental monitoring capability and the disaster response rate. Real-time dynamic monitoring can be achieved by combining Sentinel-2 remote sensing data with that of other countries. Sentinel-2A was the second satellite to be launched, and together with Sentinel-2B, was able to cover the surface of the Earth every 5 days. Sentinel-2A represents novel satellite technology with a high spatial resolution and multi-spectral imaging, and is mainly used for emergency rescue services and for global land observation such as land vegetation, soil and water resources, inland waterways and coastal areas [47]. In the current study, only good quality remote sensing data collected during cloudless cover were used, with only 32 images (16 periods (Sensor flight time) with two images per period) found to meet these requirements over the entire study period of 2016–2018. Table 1 shows the dates during which were taken over the 16 periods. The Sentinel-2A satellite L1C remote sensing data were downloaded from the Copernicus SciHub website (https://scihub.copernicus.eu/dh us/#/home, last accessed 13 April 2019).

Table 1.
Dates for which Sentinel-2A satellites images for the study area were used over the 16 date (fire time: 2–5 May 2017).
2.2. Method
2.2.1. Preprocessing of Remote Sensing Data
The L1C (Level-1 C) level data and Sentinel-2 Toolbox (SNAP software toolbox, ESA) were used for data processing and completion according to the Sentinel-2A user manual issued by the ESA. L1C level data were generated by geometric resampling, georeferencing, radiometric calibration and, top of atmosphere (TOA) processing. L1C are the user data released by the ESA and L2A (Level-2 A) are the L1C data processed through the software SNAP. The ESA specially developed various processing modules in SNAP to facilitate the use, exploration and promotion of Sentinel data series among researchers, such as the Sen2cor module (Sentinel-2 SEN2COR Processor). Other processing modules can also be selectively installed according to different research fields and data types, such as the Sentinel-2 Toolbox Kit Module and SMOS-box Kit Module. The main function of the Sen2cor module is to calibrate the L1C data of Sentinel-2 for the atmospheric underlying surface and to create a corresponding L2A data file [48]. Resampling is a gray processing method in the image data reorganization. Specifically, the existing data are further processed in accordance with the application requirements to make them more in line with the needs. In addition, it has the characteristics of simplicity and fast calculation, and can retain the gray value of the original image, which can meet the application purpose of this study. Therefore, we resampled the atmospheric corrected Sentinel-2A data (three resolutions of 10 m, 20 m and 60 m), and the resolution of all bands is unified to 10 m, using the bilinear interpolation. Image mosaic: In order to enable remote sensing images to completely cover the study area, two or more images need to be stitched together to obtain a larger image map. Image subset: In order to obtain an accurate range of remote sensing images, it is necessary to subset the image in conjunction with the boundary of the study area. In a word, this study carried out atmospheric correction, resampling, image mosaic and subset of several Sentinel-2A images to obtain the remote sensing image map of Bilahe burned area.
2.2.2. Extraction of Burned Area and Classification of Fire Severity
The current study used the Sentinel-2A image data for 25 May 2017 and the BAIS2 index [23] to calculate the area of burning and to categorize the severity of burning within the study area. The BAIS2 index defined in Equation (1), which detects the radiation response of SWIR, has been shown to represent the burned area, and incorporates a red-edge spectral-domain band ratio to describe vegetation characteristics [24]. In the current study, the “band math” tool of the ENVI 5.3 software platform was used to process the R, NIR and SWIR of Sentinel-2A images, which were then substituted into Equation (1) to obtain the BAIS2 value. Filipponi [23] found the range of BAIS2 to be 0.75–1.25 and a positive correlation between BAIS2 and fire severity was identified. The current study combined the classification of forest fire severity with NBR to calculate the burned area and classify fire severity. The measurement of fire severity based on remote sensing is usually achieved using a specific spectral index. Finally, the ranges of fire severity of different parts of the study area were determined, combined with the classification results of fire severity in the study area of Liu et al. [49], following which fire severity was categorized into three grades, namely low, moderate and high. Table 2 is fire severity classification rules of BAIS2 and NBR index in this study combined with the classification results of fire severity in the study area of Liu et al. [49]. The results showed that BAIS2 ranged from 0.73 to 1.23, similar to the results obtained by Filipponi [23], and the NBR ranged from −0.53 to 0.
Table 2.
Fire severity classification rule.
In Equation (1), B6, B7, B8A and B12 are the corresponding bands of Sentinel-2 images.
2.2.3. A Comparison of Results Obtained from the BAIS2 Index with Those from Using the NBR
The current study used NBR to evaluate the fire severity and the result of BAIS2 index classification. The study by Garcia and Caselles [17] was the first to replace the R band in the NDVI formula with the SWIR band, i.e., (NIR−SWIR)/(NIR+SWIR), to map burned area in Spain. This index was formally named the normalized burn index (NBR) in 1999 [17]. The current study used the band math tool of the ENVI 5.3 software platform along with Equation (2) to calculate the NBR of the NIR and the SWIR for Sentinel-2A image data for 25 May 2017. The theoretical range of NBR is −1.0–1.0, and it is negatively correlated with fire severity. Liu et al. [49] calculated the dNBR of Landsat 8 satellite images before and after a fire and constructed a fire severity grading index by a combination of visual interpretation and mathematical statistics. Using this index, Liu et al. [49] quantitatively evaluated burned area fire severity, and using field measured GPS data and GF-2 data, verified the accuracy of the index-based evaluation to be 86.39%. Therefore, the current study used the NBR index to evaluate burned area fire severity for the study area. The range of fire severity within the study area was then determined, and fire severity was categorized into three grades; namely, low, moderate and high (Table 2). Finally, the classification of the fire severity damage of the typical vegetation (forest and grassland) in the BAIS2 index burned area was verified by comparing the results of the extraction and the fire severity classification of NBR and BAIS2 according to the various land cover types of the Bilahe Forest Farm.
In Equation (2), B8 and B12 are the corresponding bands of Sentinel-2 images.
2.2.4. Evaluation Metrics
To assess the similarity between BAIS2 and NBR, we computed the Sorensen–Dice similarity index. Let a be the number of pixels that have been identified at the same severity level from both indices, b the number of pixels that have been identified at the severity level from BAIS2 only and c the number of pixels identified at the severity level from NBR only. Sorensen similarity index is defined as follow:
The SD index ranges from 0 to 1, where 1 means perfect similarity and 0 no similarity between the examined indices [50,51].
The coefficient of determination R2 was used to quantify the strength of relationship between spectral indices and biophysical variables. R2 was used to quantify the accuracy of the correlation since the correlation between the coefficient of determination and the spectral indices and biophysical variables is proportional.
2.2.5. Calculation of Vegetation Biophysical Variables
In the L2A level data product, five important indices, namely, LAI, FAPAR, CCL, CWC and FVC, can be generated for a large area using the Biophysical Processor module of SNAP software through processing the variables zenith angle, solar altitude angle and relative azimuth angle of a specific band. The module uses the PROSPECT+SAIL radiative transfer model to calculate inversion. First, data training is conducted according to the vegetation characteristics of the study area, following which the canopy characteristics of each grid pixel are analyzed and calculated by using a neural network. The construction of the neural network model consists of 11 explicit input layer variables, namely band 3, band 4, band 5, band 6, band 7, band 8A, band 11, band 12, zenith angle cosine value, solar height angle cosine value and relative azimuth angle cosine value, and five implicit neuron variables with a tangent S-shaped curve (sigmoid) transfer function are composed. This algorithm can calculate the relationship between the vegetation characteristics of each pixel and the apparent reflectance of the canopy from the macro area, can ensure the optimal simulation accuracy of remote sensing inversion through the self-verification function of the model, and can generate effective data products with a resolution of 10 m through resampling. The accuracy of the data produced is greatly improved compared with previous remote sensing data, providing strong quantitative remote sensing analysis for the regional vegetation environment [47]. A total of 32 images need to be invoked by the Sen2cor model for L2A level data processing, following which the biophysical indices for each scene data are retrieved separately using the Biophysical Processor and L2A level data under SNAP 5.0 software. After mosaicking, the resampling and the subset modules in SNAP 5.0 software were used to splice, crop and process the 32 images to obtain the biophysical indices data of the burned area with a spatial resolution of 10 m [52]. Finally, the five biophysical indices LAI, FAPAR, CCL, CWC and FVC were imported into ArcGIS 10.3 software for quantitative analysis.
LAI represents the sum of the leaf area of plants above the unit surface area [36], and this variable can effectively represent the canopy structure of vegetation, which is often a key variable in the global carbon cycle and water cycle model [53]. The range of LAI used in the present study was (0, 2.5). FAPAR is the ratio of photosynthetically active radiation (PAR) absorbed by vegetation incident to solar radiation and represents the ability of the canopy to absorb PAR energy. FAPAR is therefore an important remote sensing variable for estimating the productivity (NPP) of vegetation and is also used to describe basic physiological variables involved in the material energy exchange processes related to vegetation structure [54]. In the present study, the range of FAPAR used was (0,1). FVC represents the percentage of the vertical projection of vegetation in the statistic area of land surface and is a measure of surface vegetation coverage and regional growth and an important indicator of ecological health [55,56]. The range of FVC used in the current study was (0,1). CWC can be used to effectively evaluate the growth and soil environment conditions of vegetation and is therefore useful for drought monitoring and the improvement of ecological environments [53]. The range of CWC used in the present study was (0, 0.08). CCL can effectively represent the growth and nutrition status of vegetation, regional photosynthesis capacity and the health of the natural environment and is therefore of great significance for predicting crop maturity and for the monitoring of crop growth and crop pests [57]. The range of CCL used in the present study was (0, 180).
2.2.6. Principal Component Analysis
The five biophysical indices LAI, FAPAR, CCL, CWC and FVC can represent certain indicative effects on the distribution of regional vegetation characteristics. To select the optimal biological variables, principal component analysis (PCA) was used to select the typical vegetation type variables. PCA can transform several related indices into fewer independent comprehensive indices on the premise of with minimum information loss. The advantages of PCA include the objective simplification of a large number of factors while avoiding human error [58,59]. The steps taken within the PCA in the current study were: (1) vegetation biophysical variables calculated from Sentinel-2 image data were standardized; (2) the correlation coefficient matrix R of each index was established; (3) the eigenvalue λ and corresponding eigenvector l of R were calculated; (4) the variance contribution rate was calculated and the number of principal components K was determined. Selecting more suitable biophysical parameters based on PCA.
3. Results
3.1. Extraction of Burned Area and Classification of Fire Severity
3.1.1. Subsubsection Extraction of Burned Area and Classification of Fire Severity Based on BAIS2
To extract the burned area in the study area, we used the Sentinel-2A image data for 25 May 2017, the fire severity classification rule of BAIS2 index in Table 2 and ENVI 5.1 software. Figure 2a is a classification of fire severity and Table 3 represents the area percentages of burned area in grassland and forest with different fire severity based on BAIS2 index. It was found to be 61.39 km2, of which forest, grassland and remaining burned areas were 23.89 km2, 36.18 km2 and 1.32 km2, respectively, accounting for 38.92%, 58.93% and 2.15% of the total burned area, respectively. The shape of the burned area followed the prevailing wind direction, extending from southwest to northeast. The fire severity classification rules shown in Table 2 were used to classify fire severity in the study area (Figure 2a). In Figure 2a, red, orange and green represent high, moderate and low fire severity areas, respectively. The area of moderate fire severity was the largest in the study area. Low fire severity burned area covered the second largest area. The high fire severity area covered the smallest area.
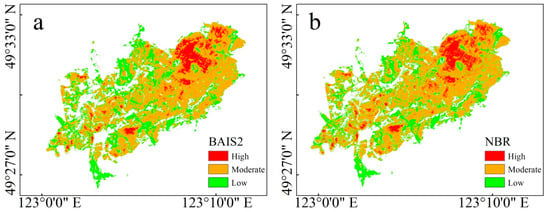
Figure 2.
Classification of fire severity (a). BAIS2; (b) normalized burn index (NBR).
Table 3.
The distribution of the burned area.
3.1.2. Extraction of Burned Area and Classification of Fire Severity by NBR
To extract the burned area within the study area, we used the Sentinel-2A image data for 25 May 2017, the fire severity classification rule of the NBR index in Table 2 and ENVI 5.1 software. Figure 2b is a classification of fire severity and Table 3 represents the area percentages of burned area in grassland and forest with different fire severity NBR index. The results showed that the total burned area was 62.86 km2, in which forest, grassland and other burned areas were 24.52 km2, 36.88 km2 and 1.46 km2, respectively, accounting for 39.03%, 58.67% and 2.30% of the total burned area, respectively. The shape of the burned area followed that of the prevailing wind direction, extending from southwest to northeast. The fire severity classification rules shown in Table 2 were used to classify the fire severity in the study area (Figure 2b). In Figure 2b, red, orange and green represent high, moderate and low fire severity areas, respectively. In the study area, moderate fire severity covered the largest area. The low fire severity area covered the second largest area. The high fire severity area covered the smallest area.
3.2. Analysis of the Results of Fire Severity Classification
The results (Table 3) showed that burned area according to NBR was 62.86 km2, and was selected to compared the results of the spectral index BAIS2 based on the red edge band, including 24.52 km2 and 36.88 km2 of forest and grassland, respectively. In contrast, burned area according to BAIS2 was 61.39 km2, and had a 97.66% similarity to the result of NBR, including 23.89 km2 and 36.18 km2 of forest and grassland, respectively, with a 97.43% and 98.10% similarity to the NBR results, respectively. Burned areas in the low, moderate and high classes according to NBR were 20.85 km2, 36.91 km2 and 5.10 km2, respectively, of which 6.85 km2, 14.14 km2 and 3.53 km2 were forest, respectively, and 13.04 km2, 22.41 km2 and 1.43 km2 were grassland, respectively. In contrast, burned areas in the low, moderate and high classes according to BAIS2 were 21.15 km2, 35.36 km2 and 4.88 km2, respectively, achieving a similarity to NBR results of 98.56%, 95.8% and 95.69% respectively. Among the three fire severity classes of low, moderate and high, BAIS2 found forest to occupy 6.62 km2, 13.56 km2 and 3.71 km2, respectively, with a similarity to the NBR results of 96.53%, 95.72% and 95.15%, respectively, whereas grassland occupied 13.72 km2, 21.33 km2 and 1.13 km2, respectively, with a similarity to NBR results of 95.04%, 95.72% and 73.45%, respectively. In addition, the results of fire severity classification by BAIS2 and NBR were very similar.
Within the NBR classification results, all of the pixels value for each fire severity category for forest and grassland, and the corresponding values were extracted from the results of BAIS2. Table 4 shows the SD index of comparison between the results of BAIS2 and NBR (Table 3). In both forested and grassland coverage areas, the moderate severity presented the highest similarity with 0.89 for both cover types. The lowest similarity observed in low severity class with 0.81 and 0.71 forest and grassland respectively. Finally, the high severity class had a similarity index of 0.86 and 0.84 for forest and grassland respectively. From the similarity table, it can be concluded that both indices have a similar performance in fire severity classification. The difference between groups in the results of BAIS2 and NBR was caused by the subjectivity of the threshold level.
Table 4.
Similarity results of classification level for forest fire severity.
3.3. Relationship between BAIS2 and Vegetation Biophysical Indices
3.3.1. Relationship between BAIS2 and Vegetation Biophysical Indices for Grassland
Based on the fire severity classification results (Figure 2) of Sentinel-2A image data on May 25 2017, the BAIS2 and its corresponding biophysical variable values (LAI, fAPAR, CCL, CWC and FVC in Section 2.2.5) of each pixel were calculated. Finally, the relationship between the BAIS2 index and the biophysical variable values for the different fire severity of grassland was calculated by R software (as shown in Figure 3). The a, b, c, and d figures represent total burned areas, and low, moderate and high fire severity, respectively. In the figure, the diagonals show the distribution map, the lower left shows the bivariate scatter map with fitting lines, and the upper right shows the correlation coefficient and significance level. The correlation coefficients r between the BAIS2 index and LAI in the low, moderate and high fire severity areas were −0.84, −0.72 and −0.49, respectively, and all correlations were significantly negative. The correlation coefficients r between the BAIS2 index and FAPAR in the low, moderate and high fire severity areas were −0.81, −0.89 and −0.78, respectively, with all correlations being significantly negative. The correlation coefficients r between the BAIS2 index and CCL in the low, moderate and high fire severity areas were −0.37, −0.17 and −0.47, respectively, with all correlations being significantly negative. The correlation coefficients r between the BAIS2 index and CWC in the low, moderate and high fire severity areas were −0.76, −0.58 and −0.31, respectively, with all correlations being significantly negative. The correlation coefficients r between the BAIS2 index and FVC were −0.75, −0.85 and −0.89 in the low, moderate and high fire severity areas, respectively, and were significantly negatively correlated. The correlation coefficients r between the BAIS2 index and LAI, FAPAR, CCL, CWC, and FVC in the total burned areas were −0.93, −0.94, −0.54, −0.87 and −0.93, respectively, with all correlations being significantly negative. All indicators had significant negative correlations with BAIS2, and scatterplots plotting BAIS2 against the biophysical variables are almost linear, with high correlations. The biophysical variables showed downward trends with increasing BAIS2, i.e., with increasing fire severity, damage to vegetation increased. These five biophysical variables have certain indicative effects on the distribution of regional vegetation characteristics. In general, LAI and FVC showed high correlations with BAIS2; therefore, they were selected as the key vegetation biophysical variables in the current study.
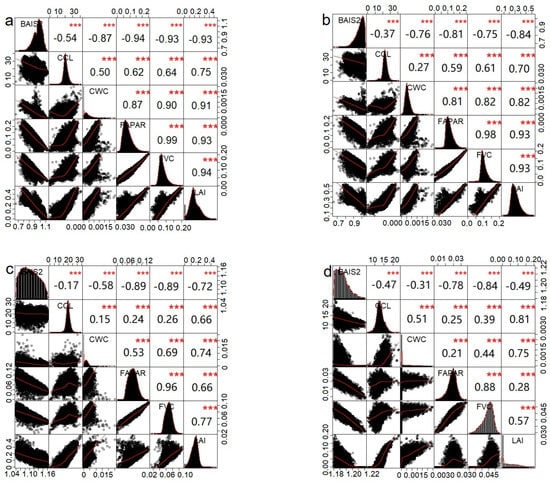
Figure 3.
Relationship between the BAIS2 index and biophysical variables for different fire severity categories for grassland (*** Significant correlation at the 0.001 level; the (a–d) represent total burned areas, low, moderate and high fire severity, respectively).
3.3.2. Relationship between BAIS2 and Vegetation Biophysical Indices for Forest
Based on the fire severity classification results (Figure 2) of Sentinel-2A image data on May 25 2017, the BAIS2 value and its corresponding biophysical variable values (LAI, fAPAR, CCL, CWC and FVC in Section 2.2.5) of each pixel were calculated, finally the relationship between the BAIS2 index and biophysical variable values for the different fire severity of forest was calculated by R software (as shown in Figure 4). The a, b, c, and d figures represent total burned areas, and low, moderate and high fire severity, respectively. In the figure, the diagonals show the distribution map, the lower left shows the bivariate scatter map with fitting lines and the upper right shows the correlation coefficient and significance level. The correlation coefficients r between the BAIS2 index and LAI in the low, moderate and high fire severity areas were −0.86, −0.93 and −0.70, respectively, with extremely significant negative correlations. The correlation coefficients r between the BAIS2 index and FAPAR in the low, moderate and high fire severity areas were −0.84, −0.94 and −0.80, respectively, with extremely significant negative correlations. The correlation coefficients r between the BAIS2 index and CCL in the low, moderate and high fire severity areas were −0.58, −0.38 and −0.33, respectively, with extremely significant negative correlations. The correlation coefficients r between BAIS2 index and CWC in the low, moderate and high fire severity areas were −0.81, −0.76 and −0.41, respectively, with extremely significant negative correlations. The correlation coefficients r between the BAIS2 index and FVC were −0.88, −0.78 and −0.45 in low, moderate and high fire severity areas, respectively, with extremely significant negative correlations. The correlation coefficients r between the BAIS2 index and LAI, FAPAR, CCL, CWC and FVC in the total burned areas were −0.97, −0.96, −0.72, −0.93 and −0.95, respectively, with all correlations being significantly negative. All indicators showed extremely significant negative correlations with BAIS2, and scatterplots of BAIS2 plotted against the biophysical variables were almost linear, displaying high correlations. The biophysical variables showed a downward trend with increasing BAIS2 index, indicating that an increase in fire severity resulted in more serious damage to vegetation. These five biophysical variables have certain indicative effects on the distribution of regional vegetation characteristics. In general, LAI and FVC showed high correlations with BAIS2, and therefore they were selected as the key vegetation biophysical variables in the current study. From the distribution map, LAI and FVC have different intensity of response to the changes of fire severity and various land cover types. At low, moderate and high fire severity, the range of FVC and LAI in grassland was 0–0.20, 0–0.12 and 0–0.05; and 0–0.60, 0–0.50 and 0–0.20, respectively; FVC and LAI of forest were 0–0.60, 0–0.50 and 0–0.20; and 0–0.30, 0–0.14 and 0–0.05, respectively; it was found that the range of FVC and LAI decreased with the increase of fire severity. This paper attempts to use FVC = 0.2 and LAI = 0.3 as boundary values for forest and grassland burned area, but the applicability of FVC and LAI needs further study to more fully evaluate fire severity for various land cover types.
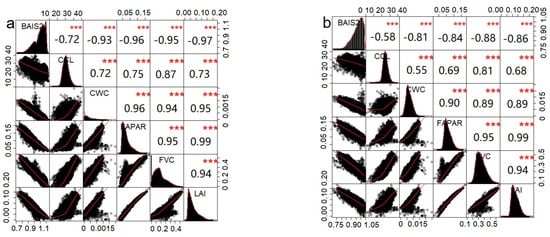
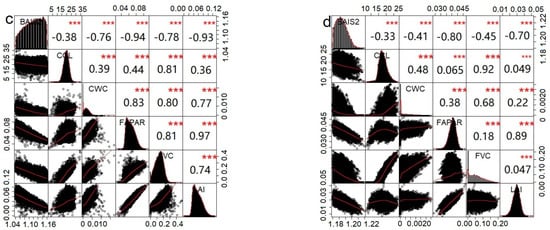
Figure 4.
Relationship between the BAIS2 index and biophysical variables for different fire severity in forest (*** Significant correlation at the 0.001 level; the (a–d) represent total burned areas, low, moderate and high fire severity, respectively).
3.3.3. Selection of Suitable Vegetation Biophysical Variables to Evaluate fire Severity
SPSS software was used to summarize the five indices, calculate the correlation coefficient matrix and variance contribution rate according to PCA, and taking the cumulative contribution rate of 80% as the threshold value, selected the first k characteristic roots as the principal component of the final comprehensive score. Table 5 is the principal component analysis of the five indicators, and demonstrates that in the first principal component (PC1) of both forest and grassland, FVC and LAI were the indexes with a larger coefficient, respectively. Therefore, from the results of PCA, it can be concluded that LAI and FVC can represent vegetation biophysical variables, finally LAI and FVC were selected as the priority biophysical variables.
Table 5.
The contribution rates and characteristic values of principal components.
3.4. Dynamic Changes in Vegetation LAI and FVC with Different Fire Severity
LAI and FVC were selected as the key biophysical variables in the current study. The all-pixels average value of LAI and FVC for the various land cover types were extracted for burned areas of different fire severity within the study area from 2016 to 2018 in 16 different periods, as shown in Figure 5 and Figure 6, and the changes in the study area pre-fire and post-fire were observed. After the fire, vegetation LAI and FVC decreased significantly, although differences in LAI and FVC according to the severity of the fire were evident.
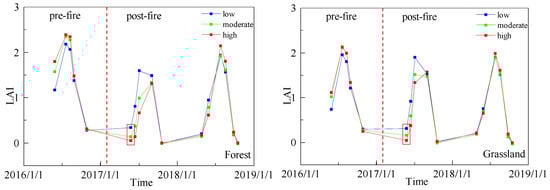
Figure 5.
Time variation of leaf area index (LAI) for various land cover types under different fire severity (the red dotted line represents the time dividing line pre-fire and post-fire, and the red box represents the fire month).
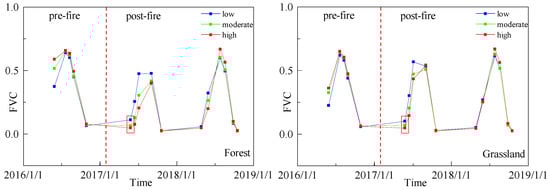
Figure 6.
Time variation of fractional vegetation cover (FVC) for various land cover types under different fire severity (the red dotted line represents the time dividing line pre-fire and post-fire, and the red box represents the fire month).
The patterns of change in LAI and FVC after the fire were similar for the various land cover types. The results showed that the distribution of LAI and FVC for forest and grassland across the burned areas of different fire severity in the year before the fire were ranked as high > moderate > low, with the same pattern evident in the year after the fire. LAI and FVC increased rapidly in the high, moderate and low fire severity areas in the year after the fire, reaching the same patterns seen during the year before the fire. LAI and FVC showed the most rapid and most significant growth in the high fire severity area, followed by moderate and low fire severity areas. The fluctuations of the standard deviations of LAI and FVC were similar to that of their growth, ranking among the fire severity categories as high > moderate > low. From May to September in the fire year, the values of LAI and FVC ranked according to burned areas of different severity were: low > moderate > high. The LAI and FVC values of forest and grassland in the high fire severity area were significantly lower than those of the moderate and low fire severity areas, and likewise those of the moderate fire severity area were significantly lower than those of the low fire severity area. Whereas LAI and FVC in the high fire severity area in October gradually exceeded those in the moderate and low fire severity areas.
From 2016 to 2018, the growth trends of LAI and FVC in various land cover types according to the category of fire severity had some differences. It was found that the maximum LAI and FVC values for forest were higher than those of grassland, and the standard deviation of LAI and FVC of forest was higher than that of grassland. In general, similar FVC values of forest and grassland were evident in the years both before and after the fire; however, the FVC value of forest during the fire year was smaller than that of grassland. The LAI of forest was larger than that of grassland in the year before and after the fire but smaller than that of grassland in the fire year. Table 6 shows the correlation between leaf area index (LAI) and fractional vegetation cover (FVC) for various land cover types in burned areas of the same category of severity. Table 6 shows that good correlations between FVC and LAI were obtained for various land cover types in the same category of severity of burned area. It is evident that LAI increased in parallel with FVC, although LAI increased at a faster rate. The growth patterns of LAI and FVC over 2016–2018 for the burned areas of different severity were the same for the same land cover types, but it is clear that LAI increased at a greater rate than FVC. One post-fire year, the LAI and FVC showed obvious improvement of the burned area, and the LAI at the post-fire year is greater than at the pre-fire year in some areas. It can be seen that the vegetation was recovered.
Table 6.
Correlation between leaf area index (LAI) and fractional vegetation cover (FVC) for various land cover types in burned areas of the same category of severity.
The spatial distributions of LAI and FVC were extracted for various land cover types of different fire severity within the study area during the period 2016–2018, the month of the fire occurrence, and the corresponding month the year before and after fire by ArcGIS 10.6 software, as shown in Figure 7 and Figure 8. In Figure 7 and Figure 8, the two indicators LAI and FVC are shown, with the color scale bar of each shown on the right. It was found that the rank of values of LAI and FVC of grassland in the high fire severity area according to the year was: post-fire year > pre-fire year > fire year, with a small distribution area, mainly concentrated in the southwest of the study area and in the high fire severity area around forest in the burned area. The rank of values of LAI and FVC of grassland in the moderate fire severity area according to the year was: post-fire year > pre-fire year > fire year, and LAI and FVC were distributed in the middle part of the study area extending from southeast to northwest. The rank of values of LAI and FVC of grassland in the low fire severity area according to year was: post-fire year > pre-fire year > fire year, and LAI and FVC of grassland were randomly distributed across the study area. The rank of values of LAI and FVC of forest in the high fire severity area according to year was: pre-fire year > post-fire year > fire year, with a relatively small distribution area, mainly concentrated in the northeast part of the study area. The rank of values of LAI and FVC of forest in the moderate fire severity area according to year was: pre-fire year > post-fire year > fire year, and these values showed a restricted distribution. The rank of values of LAI and FVC of forest in the low fire severity area according to year was: pre-fire year > post-fire year > fire year, with a scattered distribution.
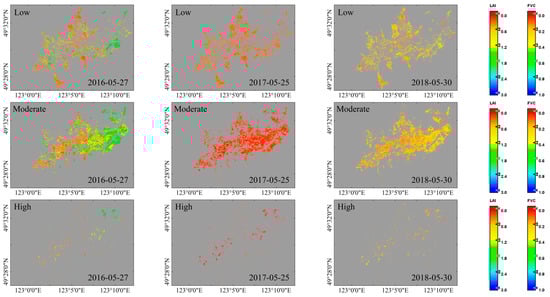
Figure 7.
Changes in leaf area index (LAI) and fractional vegetation cover (FVC) of grassland for burned areas of different severity in the month of the fire occurrence and corresponding month the year before and after fire.
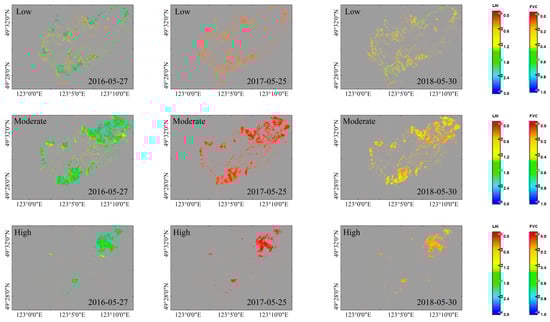
Figure 8.
Changes in leaf area index (LAI) and fractional vegetation cover (FVC) of forest for burned areas of different severity in the month of the fire occurrence and corresponding month the year before and after fire.
LAI and FVC can, to some extent, act as indicators of the damage to and recovery of forest vegetation after a fire. After a forest fire, LAI and FVC in the burned area showed a pattern of initial decline to the minimum value with some seasonal variation, followed by a slow recovery, with the ranges of decline in LAI and FVC according to the severity of the burned area being high > moderate > low. The higher the severity of a fire, the greater the damage to vegetation and the faster the recovery rate in the year following the fire. The extent of the burned area also affects the degree of vegetation damage and the time required for vegetation recovery. In general, the vegetation biophysical variables in the study area investigated in the current study recovered rapidly in the year after the fire, requiring only 2 years in total to recover, which is related to the small area of fire damage, a discrete distribution and the growth of the original vegetation in the study area.
4. Discussion
The present study used the BAIS2 index to extract the burned area, classify the severity of the fire damage and verified the results using the NBR. NBR has become the established remote sensing spectral index for research into the identification of burned area as it is more suited for reflecting fire severity than other indices [60,61]. BAIS2 used the inter-band ratio of the red band spectral domain to detect the burned area and to monitor changes in vegetation after the fire. The BAIS2 index combined with the band ratio to detect radiation response in the SWIR band is considered to be an effective method of determining the burned area [23]. Morresi et al. [31] similarly showed that a spectral vegetation index based on the SWIR band is highly sensitive to fire damage to forest cover and subsequent restoration of forest structure.
LAI and FVC were selected as the key biophysical variables to examine in the present study. FVC is an important variable for the study of the ecological effects of vegetation at large spatial scales [62,63]. Ecological effect can be defined as the degree of impact on the quality of an ecological environment [64]. The increase of FVC in the study area was found to have a significant ecological effect. Nowadays, LAI has become an important variable to measure urban ecological benefits and has been widely used in urban green space planning.
Changes in green vegetation cover can be said to be one of the clearest and most ecologically significant effects of fires [65]. Vegetation cover and leaf state/color change are key inputs to CBI [5] and have made significant contributions to dNBR of remote sensing [38,66,67], such as the recent research results of Chuvieco et al. [22]. From a spectral point of view, the use of LAI to quantify burn severity is reasonable. LAI is more directly related to other key aspects of forest management compared to NBR. By measuring combustion severity as the change in LAI, fire impact data and other ecological information can be more effectively integrated, and forest landscapes at risk to fires can be managed scientifically [19]. FVC as an index is a continuous scale of the proportion of green vegetation in the landscape [56] and is a promising index for the evaluation of vegetation recovery after a fire [68]. A recent study [69] used an FVC Landsat time series to successfully demonstrate different approaches to forest recovery after a fire in a Siberian Larch forest. However, at the pixel level, BAIS2 is highly correlated with LAI and FVC, and part of the scattering may reflect the ability of BAIS2 to detect fire effects rather than the loss of canopy leaves, such as changes in plant water content and carbonization of soil surfaces. In general, LAI and FVC have high correlations with BAIS2 as well as to other biophysical variables. The use of satellite time-series NDVI data and derived pheno-metric indicators show the potential for tracking the dynamics of vegetation cover and continuous changes to wildfire interference and forest restoration processes [70]. By using quantitative inversion, the health trajectory of the ecosystem can be rapidly determined, and therefore this method can play an irreplaceable role in the realization of sustainable development in the study area. Therefore, it is of great scientific significance to quantitatively retrieve vegetation variables by remote sensing [71].
The spatial distributions of the LAI and FVC area were extracted for various land cover types of burned area of different fire severity within the study area during the period 2016–2018 for the years before and after the fire during the month of the fire. Although no field survey data were used to verify the threshold of the burn severity level in BAIS2 in the present study, the difference in the short-term dynamic changes of biophysical variables post-fire is obvious when the burn severity increases. Since it is great that changes have taken place so that forest fires can result in a change in vegetation, the increase or decrease of biophysical variables can reflect the severity of a forest fire. Vegetation type and fire severity have a significant influence on the recovery of the burned area, and the impact of fire severity on vegetation recovery after a fire is critical; however, the interaction between fire severity and vegetation type is not significant [32]. It was found that the rates of growth of LAI and FVC were fastest and most significant in the severely burned area in the year after the fire. During the early stage after a severe fire, the canopy density of the forest was low, resulting in sufficient light falling to the floor of the forest to allow prolific growth of the shrub and grass layer [3]. Shi et al. [72] found that severe fire can promote an increase in biomass of undergrowth vegetation during the early stage of recovery. The LAI and FVC values of the low fire severity area were higher than those of the moderate and high fire severity areas in May and September of the fire year. This may have been due increased opportunities for seeds to establish in soil, which is conducive to regeneration of coniferous forests [73], and good natural regeneration and vegetation recovery was observed in the low fire severity area [74]. Carter et al. [75] found that fires of moderate severity are beneficial for the development of the shrub and herb layers and can promote carbon storage of vegetation. The LAI of forest was larger than that of grassland in the year before and after the fire, whereas during the fire year, the LAI of forest was smaller than that of grassland. The effect of fire severity on forest recovery after a fire was greater than that on shrub, grassland and swamp vegetation types, and fire severity also has a significant effect on the vertical structure of the forest community.
Research into understanding the relationship between the burned area and vegetation’s short-term dynamic change characteristics is of great importance for estimating hydrogeological risks, such as triggered debris flow due to heavy rain. Abbate et al. [76] attempted to quantitatively explain the influence of wildfire on terrain characteristics by simulating the key variables, although they did not address the dynamics of the two debris flow events in a more quantitative and targeted approach. The use of Sentinel-2 remote sensing data provides a large amount of data for rather isolated zones that cannot be studied by conventional on-site monitoring. Therefore, the present work can be of great importance for the quantification of wildfire on terrain characteristics, and particularly on the influence of wildfire in hydrogeological modeling.
5. Conclusions
The current study compared biophysical indices to the spectral index obtained by the Sentinel-2 satellite and selected the appropriate index to monitoring vegetation short-term dynamic changes in burned area by a fire. We used the BAIS2 index to extract the burned area and to classify fire severity with relative accuracy. All indicators had significant negative correlations with BAIS2. From 2016 to 2018, the growth trends of LAI and FVC in various land cover types according to the category of fire severity had some different. In general, the ranking of LAI and FVC according to the burned areas of different severity in the pre-fire year was: high > moderate > low. The LAI of forest was greater than that of grassland in the pre-fire and post-fire year, whereas the LAI of forest in the fire year was smaller than that of grassland. The results of the present study are valuable for assessment of vegetation dynamics change using biophysical indices of different vegetation types. The current study has not considered the influence of vegetation, topography and other factors on the heterogeneity of the spatial distribution of fire severity. Future studies could determine the spatial dynamics change and constraints of fire behavior for the development of fire-fighting strategies. The present work can be of great importance for the quantification of wildfire on terrain characteristics, and particularly on the influence of wildfire in hydrogeological modeling.
Author Contributions
All authors contributed meaningfully to this study. A.H., Y.B. (Yongbin Bao) and J.Z. conceived the research topic. S.Q., X.L. and C.W. designed the methodology, data acquisition and analysis. Y.B. (Yuhai Bao) and L.N. provided methodology support, continuous follow up of the research process, and A.H. drafted the manuscript. All authors have read and agreed to the published version of the manuscript.
Funding
This study was financially supported by the International (Regional) Cooperation and Exchange Programs of National Natural Science Foundation of China (41961144019); The Jilin Provincial Department of Education (JJKH20190285KJ).
Acknowledgments
The authors would like to thank the ESA Sentinels Scientific Data Hub for providing Sentinel-2 MSI data, the authors are grateful to the many individuals working on the development of free and open-source software for supporting the sharing of knowledge.
Conflicts of Interest
The authors declare no conflict of interest.
References
- Hu, H.Q. Forest Ecology and Management; China Forestry Publishing House: Beijing, China, 2005. [Google Scholar]
- Morisette, J.T.; Giglio, L.; Csiszar, I.; Setzer, A.; Schroeder, W.; Morton, D. Validation of MODIS Active Fire Detection Products Derived from Two Algorithms. Earth Int. 2005, 9, 305–319. [Google Scholar] [CrossRef]
- Reis, S.M.; Lenza, E.; Marimon, B.S.; Gomes, L.; Forsthofer, M.; Morandi, P.S.; Junio, B.H.M.; Feldpausch, T.R.; Elias, F. Post-fire dynamics of the woody vegetation of a savanna forest (Cerradão) in the Cerrado-Amazon transition zone. Acta Bot. Bras. 2015, 3, 408–416. [Google Scholar] [CrossRef]
- Lentile, L.B.; Smith, F.W.; Shepperd, W.D. Influence of topography and forest structure on patterns of mixed severity fire in ponderosa pine forests of the South Dakota Black Hills, USA. Int. J. Wildland Fire 2006, 15, 557. [Google Scholar] [CrossRef]
- Key, C.; Benson, N. Landscape Assessment: Ground Measure of Severity, the Composite Burn Index and Remote Sensing of Severity, the Normalized Burn Ratio. In FIREMON: Fire Effects Monitoring and Inventory System; Gen. Tech. Rep. RMRS-GTR-164-CD; US Department of Agriculture, Forest Service, Rocky Mountain Research Station: Fort Collins, CO, USA, 2006; pp. 219–279. [Google Scholar]
- Keeley, J.E. Fire intensity, fire severity and burn severity: A brief review and suggested usage. Int. J. Wildland Fire 2009, 18, 116–126. [Google Scholar] [CrossRef]
- Van Wagtendonk, J.W.; Root, R.R.; Key, C.H. Comparison of AVIRIS and Landsat ETM+ detection capabilities for burn severity. Remote Sens. Environ. 2004, 92, 397–408. [Google Scholar] [CrossRef]
- Roy, D.P.; Boschetti, L.; Trigg, S.N. Remote sensing of fire severity assessing the performance of the normalized burn ratio. IEEE Geosci. Remote Sens. Lett. 2006, 3, 112–117. [Google Scholar] [CrossRef]
- Chen, Z.M.; Babiker, I.S.; Chen, Z.X.; Komaki, K.; Mohamed, M.A.A.; Kato, K. Estimation of interannual variation in productivity of global vegetation using NDVI data. Int. J. Remote Sens. 2004, 25, 3139–3159. [Google Scholar] [CrossRef]
- Cui, X.; Wang, L.; Zhou, M.; Guo, G.; Wang, K. Retrieval Sub-pixel Fire Area with MODIS and ASTER Data. J. Arid Land Resour. Environ. 2008, 22, 198–201. (In Chinese) [Google Scholar] [CrossRef]
- Szpakowski, D.M.; Jensen, J.L.R. A Review of the Applications of Remote Sensing in Fire Ecology. Remote Sens. 2019, 11, 2638. [Google Scholar] [CrossRef]
- Miller, J.D.; Knapp, E.E.; Key, C.H.; Skinner, C.N.; Isbell, C.J.; Creasy, R.M.; Sherlock, J.W. Calibration and validation of the relative differenced normalized burn ratio (RdNBR) to three measures of fire severity in the Sierra Nevada and Klamath Mountains, California, USA. Remote Sens. Environ. 2009, 113, 645–656. [Google Scholar] [CrossRef]
- Miller, J.D.; Thode, A.E. Quantifying burn severity in a heterogeneous landscape with a relative version of the delta Normalized Burn Ratio (dNBR). Remote Sens. Environ. 2007, 109, 66–80. [Google Scholar] [CrossRef]
- Chang, Y.; Chen, H.; Hu, Y.; Feng, Y.; Li, Y. Advances in the assessment of forest fire severity and its spatial heterogeneity (in Chinese). J. Natur. Disasters 2012, 21, 28–34. [Google Scholar]
- Hoy, E.E.; French, N.H.F.; Turetsky, M.R.; Trigg, S.N.; Kasischke, E.S. Evaluating the potential of Landsat TM/ETM+ imagery for assessing fire severity in Alaskan black spruce forests. Int. J. Wildland Fire 2008, 17, 500. [Google Scholar] [CrossRef]
- Lei, C.L. Estimating Burned Severity with Multiple Methods in Da Hinggan Mountains. Ph.D. Thesis, Northeast Forestry University, Harbin, China, 2012. (In Chinese). [Google Scholar]
- Lopez-Garcia, M.J.; Caselles, V. Taylor & francis online: Mapping burns and natural reforestation using Thematic Mapper data. Geocarto Int. 1991, 6, 31–37. [Google Scholar]
- Tan, L.; Zeng, Y.; Zheng, Z. An adaptability analysis of remote sensing indices in evaluating fire severity. Remote Sens. Land Resour. 2016, 28, 84–90. (In Chinese) [Google Scholar] [CrossRef]
- Allen, J.; Sorbel, B. Assessing the differenced Normalized Burn Ratio’s ability to map burn severity in the boreal forest and tundra ecosystems of Alaska’s national parks. Int. J. Wildland Fire 2008, 17, 463–475. [Google Scholar] [CrossRef]
- Carvalheiro, L.C.; Bernardo, S.O.; Orgaz, M.; Yamazaki, Y. Forest fires mapping and monitoring of current and past forest fire activity from Meteosat Second Generation Data. Environ. Modeling Softw. 2010, 25, 1909–1914. [Google Scholar] [CrossRef]
- Meng, Q.; Meentemeyer, R.K. Modeling of multi-strata forest fire severity using Landsat TM data. Int. J. Appl. Earth. Obs. Geoinf. 2011, 13, 120–126. [Google Scholar] [CrossRef]
- Chuvieco, E.; Riano, D.; Danson, F.M.; Martin, P. Use of a radiative transfer model to simulate the postfire spectral response to burn severity. J. Geophys. Res.-Biogeo. 2006, 111. [Google Scholar] [CrossRef]
- Filipponi, F. BAIS2: Burned Area Index for Sentinel-2. Proceedings 2018, 2, 364. [Google Scholar] [CrossRef]
- Fernández-Manso, A.; Fernández-Manso, O.; Quintano, C. Sentinel-2A red-edge spectral indices suitability for discriminating fire severity. Int. J. Appl. Earth. Obs. Geoinf. 2016, 50, 170–175. [Google Scholar] [CrossRef]
- Verbyla, D.L.; Kasischke, E.S.; Hoy, E.E. Seasonal and topographic effects on estimating fire severity from Landsat TM/ETM+ data. Int. J. Wildland Fire 2008, 17, 527. [Google Scholar] [CrossRef]
- Wimberly, M.C.; Reilly, M.J. Assessment of fire severity and species diversity in the southern Appalachians using Landsat TM and ETM+ imagery. Remote Sens. Environ. 2007, 108, 189–197. [Google Scholar] [CrossRef]
- Caselles, V.; López García, M.J.; Meliá, J.; Pérez Cueva, A.J. Analysis of the heat-island effect of the city of Valencia, Spain, through air temperature transects and NOAA satellite data. Theor. Appl. Climatol. 1991, 43. [Google Scholar] [CrossRef]
- Zhu, X. Study on Forest Fire Damage Monitoring Method Based on HJ-1 Satellite Data. Master’s Thesis, Chinese Academy of Forestry, Beijing, China, June 2013. (In Chinese). [Google Scholar]
- Idris, M.H.; Kuraji, K.; Suzuki, M. Evaluating Vegetation Recovery Following Large—Scale Forest Fires in Borneo and North-eastern China Using Multi-Temporal NOAA/AVHRR Images. J. For. Res. 2005, 10, 101–111. [Google Scholar] [CrossRef]
- Viedma, O.; Melia, J.; Segarra, D.; Garcia-Haro, J. Modeling rates of ecosystem recovery after fires by using Landsat TM data. Remote Sens. Environ. 1997, 61, 383–398. [Google Scholar] [CrossRef]
- Morresi, D.; Vitali, A.; Urbinati, C.; Garbarino, M. Forest Spectral Recovery and Regeneration Dynamics in Stand-Replacing Wildfires of Central Apennines Derived from Landsat Time Series. Remote Sens. 2019, 11, 308. [Google Scholar] [CrossRef]
- Lanorte, A.; Lasaponara, R.; Lovallo, M.; Telesca, L. Fisher–Shannon information plane analysis of SPOT/Vegetation Normalized Difference Vegetation Index (NDVI) time series to characterize vegetation recovery after fire disturbance. Int. J. Appl. Earth Obs. Geoinf. 2014, 26, 441–446. [Google Scholar] [CrossRef]
- Pena, M.A.; Ulloa, J. Mapping the post-fire vegetation recovery by NDVI time series. In Proceedings of the 2017 First IEEE International Symposium of Geoscience and Remote Sensing (GRSS-CHILE), Valdivia, Chile, 15–16 June 2017. [Google Scholar] [CrossRef]
- Xiao, X.; Wang, Y.; Chen, Z. Dynamics of Primary Productivity and Soil Organic Matter of Typical Steppe in the XiLin River Basin of Inner Mongolia and Their Response to Climate Change. Acta Bot. Sin. 1996, 38, 45–52. (In Chinese) [Google Scholar]
- Filipponi, F.; Manfron, G. Observing Post-Fire Vegetation Regeneration Dynamics Exploiting High-Resolution Sentinel-2 Data. Proceedings 2019, 18, 10. [Google Scholar] [CrossRef]
- Navarroa, G.; Caballero, I.; Silva, G.; Parrac, P.; Vázquez, A.; Caldeira, R. Evaluation of forest fire on Madeira Island using Sentinel-2A MSI imagery. Int. J. Appl. Earth Obs. Geoinf. 2017, 58, 97–106. [Google Scholar] [CrossRef]
- Shoko, C.; Mutanga, O. Examining the strength of the newly-launched Sentinel 2 MSI sensor in detecting and discriminating subtle differences between C3 and C4 grass species. ISPRS J. Photogramm. Remote Sens. 2017, 129, 32–40. [Google Scholar] [CrossRef]
- Harald, V.D.; Freek, V.D.M. Sentinel-2A MSI and Landsat 8 OLI Provide Data Continuity for Geological Remote Sensing. Remote Sens. 2016, 8, 883. [Google Scholar] [CrossRef]
- Gu, F. Dynamic Monitoring of Vegetation Participants in Typical Oasis Based on Sentinel-2 Data. Master’s Thesis, Xinjiang University, Urumqi, China, June 2018. (In Chinese). [Google Scholar]
- Ganguly, S.; Nemani, R.R.; Zhang, G.; Hashimoto, H.; Milesi, C.; Michaelis, A.; Wang, W.; Votava, P.; Samanta, A.; Melton, F.; et al. Generating global leaf area index from Landsat: Algorithm formulation and demonstration. Remote Sens. Environ. 2012, 122, 185–202. [Google Scholar] [CrossRef]
- Chen, J.M.; Pavlic, G.; Brown, L.; Cihlar, J.; Leblanc, S.G.; White, H.P.; Hall, R.J.; Peddle, D.R.; King, D.J.; Trofymow, J.A.; et al. Derivation and validation of Canada-wide coarse-resolution leaf area index maps using high-resolution satellite imagery and ground measurements. Remote Sens. Environ. 2002, 80, 165–184. [Google Scholar] [CrossRef]
- Djamai, N.; Zhong, D.; Fernandes, R.; Zhou, F. Evaluation of vegetation biophysical variables time series derived from synthetic Sentinel-2 images. Remote Sens. 2019, 11, 1547. [Google Scholar] [CrossRef]
- Djamai, N.; Fernandes, R.; Weiss, M.; McNairn, H.; Goïta, K. Validation of the Sentinel Simplified Level 2 Product Prototype Processor (SL2P) for mapping cropland biophysical variables using Sentinel-2/MSI and Landsat-8/OLI data. Remote Sens. Environ. 2019, 225, 416–430. [Google Scholar] [CrossRef]
- De Santis, A.; Chuvieco, E. Burn severity estimation from remotely sensed data: Performance of simulation versus empirical models. Remote Sens. Environ. 2007, 108, 422–435. [Google Scholar] [CrossRef]
- Peng, G.; Han, L.; Zhang, M.; Li, C.; Wang, J.; Huang, H.; Nicholas, C.; Ji, L.; Li, W.; Bai, Y.; et al. Stable classification with limited sample: Transferring a 30-m resolution sample set collected in 2015 to mapping 10-m resolution global land cover in 2017. Sci. Bull. 2019, 64, 370–373. [Google Scholar] [CrossRef]
- Zhang, L. The Present Situation and Distribution of Forest Resource of the Bilahe Bureau in Inner Mongolia. Inn. Mong. For. Invest. Design. 2013, 57–59. (In Chinese) [Google Scholar]
- Novelli, A.; Aguilar, M.A.; Nemmaoui, A.; Aguilar, F.J.; Tarantino, E. Performance evaluation of object based greenhouse detection from Sentinel-2 MSI and landsat 8 OLI data: A case study from Almería (Spain). Int. J. Appl. Earth Obs. Geoinf. 2016, 52, 403–411. [Google Scholar] [CrossRef]
- Müller-Wilm, U. Sen2Cor Configuration and User Manual; European Space Agency: Paris, France, 2016. [Google Scholar]
- Liu, S.; Chen, X.; Qin, X.; Sun, X.; Li, X. Remote Sensing Assessment of Forest Fire Damage Degree in Bilahe Forest Farm, Inner Mongolia. For. Resour. Manag. 2018, 1, 013. (In Chinese) [Google Scholar] [CrossRef]
- Sørensen, T.A. A method of establishing groups of equal amplitude in plant sociology based on similarity of species and its application to analyses of the vegetation on Danish commons. Biol. Skr. K. Danskc Vidensk. Selsk. 1948, 5, 1–34. [Google Scholar]
- Dice, L.R. Measures of the amount of ecologic association between species. Ecology 1945, 26, 297–302. [Google Scholar] [CrossRef]
- Curran, P.J.; Dungan, J.L.; Gholz, H.L. Exploring the relationship between reflectance red edge and chlorophyll content in slash pine. Tree Physiol. 1990, 7, 33–48. [Google Scholar] [CrossRef]
- Iio, A.; Hikosaka, K.; Anten, N.P.R.; Nakagawa, Y.; Ito, A. Global dependence of field-observed leaf area index in woody species on climate: A systematic review. Glob. Ecol. Biogeogr. 2014, 23, 274–285. [Google Scholar] [CrossRef]
- Hall, F.G.; Huemmrich, K.F.; Goward, S.N. Use of narrow-band spectra to estimate the fraction of absorbed photosynthetically active radiation. Remote Sens. Environ. 1990, 32, 47–54. [Google Scholar] [CrossRef]
- Gitelson, A.A.; Kaufman, Y.J.; Stark, R.; Rundquist, D. Novel algorithms for remote estimation of vegetation fraction. Remote Sens. Environ. 2002, 80, 76–87. [Google Scholar] [CrossRef]
- Tang, L.; He, M.; Li, X. Verification of Fractional Vegetation Coverage and NDVI of Desert Vegetation via UAVRS Technology. Remote Sens. 2020, 12, 1742. [Google Scholar] [CrossRef]
- Kariya, K.; Matsuzaki, A.; Machida, H. Distribution of chlorophyll content in leaf blade of rice plant. Jpn. J. Crop Sci. 1982, 51, 134–135. [Google Scholar] [CrossRef]
- Ault, J.S.; Luo, J. A reliable game fish weight estimation model for atlantic tarpon (megalops atlanticus). Fish. Res. 2013, 139, 110–117. [Google Scholar] [CrossRef]
- Gottumukkal, R.; Asari, V.K. An improved face recognition technique based on modular PCA approach. Pattern Recognit. Lett. 2004, 25, 429–436. [Google Scholar] [CrossRef]
- Key, C.H.; Benson, N.C. The Normalized Burn Ratio (NBR): A Landsat TM Radiometric Measure of Burn Severity; United States Geological Survey: Reston, VA, USA, 1999.
- Key, C.H.; Benson, N.C. Measuring and Remote Sensing of Burn Severity; US Geological Survey: Washington DC, USA, 2002.
- Iizuka, K.; Kato, T.; Silsigia, S.; Soufiningrum, A.Y.; Kozan, O. Estimating and Examining the Sensitivity of Different Vegetation Indices to Fractions of Vegetation Cover at Different Scaling Grids for Early Stage Acacia Plantation Forests Using a Fixed-Wing UAS. Remote Sens. 2019, 11, 1816. [Google Scholar] [CrossRef]
- Iizuka, K.; Tateishi, R. Estimation of CO2 Sequestration by the Forests in Japan by Discriminating Precise Tree Age Category using Remote Sensing Techniques. Remote Sens. 2015, 7, 15082–15113. [Google Scholar] [CrossRef]
- Zhang, X.; Li, Z.; Wang, J. Gravity index fomula of eco-environment quality evalution based on normalized index values. Environ. Eng. 2014, 32, S1. [Google Scholar]
- DeBano, L.F.; Neary, D.G.; Ffolliott, P.F. Soil physical properties. In Wildland Fire in Ecosystems: Effects of Fire on Soil and Water; Neary, D.G., Ryan, K.C., DeBano, L.F., Eds.; Gen. Tech. Rep. RMRS-GTR-42; US Department of Agriculture, Forest Service, Rocky Mountain Research Station: Fort Collins, CO, USA, 1999; Volume 4, pp. 29–51. [Google Scholar]
- Kokaly, R.F.; Rockwell, B.W.; Haire, S.L.; King, T.V.V. Characterization of post-fire surface cover, soils, and burn severity at the Cerro Grande Fire, New Mexico, using hyper-spectral and multispectral remote sensing. Remote Sens. Environ. 2007, 106, 305–325. [Google Scholar] [CrossRef]
- Robichaud, P.R.; Lewis, S.A.; Laes, D.Y.M.; Hudak, A.T.; Kokaly, R.F.; Zamudio, J.A. Postfire soil burn severity mapping with hyperspectral image unmixing. Remote Sens. Environ. 2007, 108, 467–480. [Google Scholar] [CrossRef]
- Vila, J.P.S.; Barbosa, P. Post-fire vegetation regrowth detection in the Deiva Marina region (Liguria-Italy) using Landsat TM and ETM+ data. Ecol. Model. 2010, 221, 75–84. [Google Scholar] [CrossRef]
- Chu, T.; Guo, X.; Takeda, K. Remote sensing approach to detect post-fire vegetation regrowth in Siberian boreal larch forest. Ecol. Indic. 2016, 62, 32–46. [Google Scholar] [CrossRef]
- Van Leeuwen, W.J.D. Monitoring the Effects of Forest Restoration Treatments on Post-Fire Vegetation Recovery with MODIS Multitemporal Data. Sensors 2008, 8, 2017–2042. [Google Scholar] [CrossRef] [PubMed]
- Chávez, R.O. Assessing Water Stress of Desert Vegetation Using Remote Sensing: The Case of the Tamarugo Forest in the Atacama Desert (Northern Chile). Ph.D. Thesis, Wageningen University, Wageningen, The Netherlands, 2014. [Google Scholar]
- Shi, L.; Zhou, M.; Wang, D.; Ge, P.; Qin, K.; Zhao, P.; Wang, Q. Effects of Forest Fire on Understory Vegetation Diversity and Biomass of Larix gmelini Forest. J. Northeast For. U. 2016, 44, 44–47. (In Chinese) [Google Scholar] [CrossRef]
- Shang, Y. Study on vegetation regeneration of burned land in Xiaoxing’an Mountains. Guide Sci. Tech. 2012, 2, 272. (In Chinese) [Google Scholar]
- Zhao, F.; Wang, L.; Chen, P.; Shu, L. Review on the Recovery after the Catastrophic Forest Fire in Daxing’anling Mountains. For. Resour. Manag. 2013, 2, 125–129. (In Chinese) [Google Scholar] [CrossRef]
- Carter, M.C.; Foster, C.D. Prescribed burning and productivity in southern pine forests: A review. For. Ecol. Manag. 2004, 191, 93–109. [Google Scholar] [CrossRef]
- Abbate, A.; Longoni, L.; Ivanov, V.I.; Papini, M. Wildfire Impacts on Slope Stability Triggering in Mountain Areas. Geosciences 2019, 9, 417. [Google Scholar] [CrossRef]
Publisher’s Note: MDPI stays neutral with regard to jurisdictional claims in published maps and institutional affiliations. |
© 2021 by the authors. Licensee MDPI, Basel, Switzerland. This article is an open access article distributed under the terms and conditions of the Creative Commons Attribution (CC BY) license (http://creativecommons.org/licenses/by/4.0/).