Article

Dynamic Accessibility Analysis of Urban Road-to-Freeway Interchanges Based on Navigation Map Paths

School of Civil Engineering, Zhengzhou University, Zhengzhou 450001, China
*
Author to whom correspondence should be addressed.
Sustainability 2021, 13(1), 372; https://doi.org/10.3390/su13010372
Submission received: 2 December 2020 / Revised: 25 December 2020 / Accepted: 30 December 2020 / Published: 3 January 2021

Abstract

:
Accessibility is important for road network planning and design, especially the accessibility of freeway entrances and exits, which reflects the convenience of travelers using freeways and the rationality of the connection between urban roads and freeways. Based on the path information of navigation map software, a new comprehensive travel impedance model to dynamically analyze the accessibility of freeway entrances and exits was proposed. The dynamic accessibility of freeway entrances and exits in Zhengzhou was studied using the proposed comprehensive impedance model, and the calculation results were analyzed. The accessibility of freeway entrances and exits is characterized by dynamic changes; the accessibility during the off-peak evening period is the highest, while that during the morning peak period and evening peak period is lower. The results of the comprehensive impedance model are roughly consistent with reality. From a location perspective, regardless of the period of time, the accessibility of freeway entrances and exits in the central and surrounding areas of Zhengzhou is always at a lower level, and during the off-peak afternoon period, the accessibility of the eastern part of the city is notably higher than that of the western part. Additionally, the accessibility of freeway entrances and exits is closely related to the traffic status of the road network and the characteristics of regional land use. The information can provide feedback for planning road networks and provide a reference for road network planning and traffic facility design.

1. Introduction

Freeways are corridors of national importance that provide long-distance travel between cities [1]. Accessibility has been recognized as a key concept in the field of transportation [2,3] and an important indicator of transportation system performance, the foundation of urban planning and road network construction [3,4]. Accessibility to an external freeway network from an urban road network is important for long-distance travel. Accessibility is a measure of people’s opportunities or ease of access to freeway resources they wish to utilize. The national “Planning Standard for Urban Comprehensive Transport System Planning” in China provides general guidelines for the accessibility of freeways and urban freeways (GB/T 51328-2018) [5]. Important functional areas and major traffic distribution points in cities with a planned population of 1 million and above and cities with a planned population of 500,000 to 1 million should be able to reach a freeway or freeway network within 15 min (GB/T 51328-2018) [5]. However, specific quantitative analysis methods are not given in the standard. Although a large number of studies have explored accessibility from various perspectives [3], none has presented an accessibility analysis of a freeway network. Evaluating spatial accessibility is helpful for effectively identifying areas where it is inconvenient to use the external freeway network and spatial barriers.
Interchanges are essential components for providing reasonable access and mobility [6]. Hence, accessibility to a freeway network can be reflected by accessibility to urban road-to-freeway interchanges, i.e., freeway entrances and exits. For a person traveling long distances between cities, the whole travel process includes reaching the freeway entrance from an urban road, completing a fast and long drive on the freeway, and exiting the freeway to an urban road. The location of urban freeway interchanges has a considerable effect on the connection between the urban road network and the freeway network. It is critical to quickly concentrate traffic flows from urban areas and distribute them across the highway network; this is a topic for which little research has been published. Our objective is to extend the scope of research on accessibility. In addition, although considerable research has considered measurement models and methods of accessibility [3,7,8], the existing studies still have limitations. For example, actual traffic conditions that affect travel time (e.g., turn restrictions and the number of traffic lights) and people’s perceptions of factors influencing accessibility are often neglected as accessibility indicators. With the development of information technology, big data have raised not only many options for accessibility analyses but also methodological challenges due to the characteristics of these data sources [8,9].
Hence, this paper presents a dynamic accessibility analysis method of urban road-to-freeway interchanges based on navigation map path data to provide a clear understanding of the impact of the location of urban road-to-freeway interchanges. The contributions are as follows: (1) The parameters from the path data, including the travel time, travel distance and number of traffic lights, are used in the travel impedance formulation, which has the characteristics of easy access and diverse information. (2) A comprehensive impedance model is constructed and used to calculate the accessibility indicator of the urban road-to-freeway interchange.
The remainder of this paper is structured as follows. Section 2 presents a literature review on accessibility in transport networks. Section 3 reports factors involved in travel impedance through an online survey, and Section 4 proposes the accessibility analysis method. Then, Section 5 conducts a case study, and Section 6 concludes with a summary of the results and directions for future work.

2. Literature Review

Accessibility has been widely adopted in transportation planning [3,10,11]. Several review studies have focused on transport accessibility in recent years. Páez et al. (2012) conducted a review of various commonly used measures of accessibility. A number of indicators of accessibility, defined as the potential to reach spatially dispersed opportunities, have been proposed and used to address various substantive planning and policy questions [7]. Three broad classes of indicators, including cumulative opportunities, gravity-based, and utility-based indicators, have been identified in previous typologies of accessibility measures [7,12,13]. Accessibility measures are usually composed of two components, namely opportunities and travel costs [7,14]. These two components can be deployed in a number of different ways to produce location-based indicators of accessibility, a distinction that depends to a large extent on the degree of detail available concerning the situation of the network, different modes of transportation, and inherent differences in the mobility of individuals [7]. Wee [8] proposed avenues for future research focusing on indicators to express accessibility and evaluation, including the impact of information and communications technology on accessibility; the inclusion of the robustness of the transport system in the indicators; comparing perceptions of accessibility and traditional accessibility indicators; the option value; and indicators of accessibility for goods transport, air transport, and slow transport modes [8]. Shi et al. [3] reviewed two decades of publications (2000–2019) and determined the evolutionary pathway of accessibility-related studies. According to the keyword distribution and the output from a citation network analysis, current accessibility studies can be divided into two main categories: new indicator development and accessibility-based applications [3]. Rong et al. [15] classified indicators into place-based accessibility and individual-based accessibility indicators and categorized the research methods into four main types: ratio method, nearest distance method, methods based on cumulative opportunities, and methods based on spatial interaction. Certain locations are commonly desired destinations, such as shops, schools, parks and green spaces, medical services, workplaces, and transportation facilities, including bus stops and subway stations [8,15,16].
Accessibility focuses on the importance of reaching desired destinations [16], and travel time is one of the most important factors [2,17]. As shown in Table 1, most of the impedance functions consider travel time or distance separately. In addition to the travel time, people also often attach great importance to travel distance. Moreover, delays due to the number of traffic lights and turn restrictions are ignored. Besides the increase in travel time, an increase in the number of traffic lights on a path also increases its disutility association with the discomfort and frustration for a driver.
In recent years, integrating emerging sources of data, such as mobile phone data, GPS data, and navigation map data, with the current models has become a trending research area. Abundant data can easily be obtained for accessibility research. Xia et al. [4] utilized the Google Maps API to acquire travel costs at the grid level for the gravity-radiation model. Rong et al. [15] used the Internet map navigation service and GIS spatial analysis technology platform to study the spatial accessibility and equity of the medical treatment of residential buildings in the main urban area of Zhengzhou. Meire and Derudder [22] discussed some of the major strengths and limitations of a Google Maps (API)-based approach to studying accessibility in transport networks. With the development of big data technology, dynamic accessibility that captures the temporal variations of accessibility has also become an important research focus [19]. García-Albertos et al. [2] conducted a dynamic analysis of urban accessibility considering two main components, namely travel times and the attractiveness of destinations, using the Google Maps API and origin and destination (OD) travel matrices from mobile phone records. Guan et al. [19] presented a dynamic modal accessibility gap index, which used taxi and metro travel data and POI data. The index was a dynamic accessibility indicator based on residents’ real-travel covered areas.
Few accessibility analyses of urban road-to-freeway interchanges have been reported. Based on the above literature review and to analyze the spatial accessibility of urban road-to-freeway interchanges in Zhengzhou city, we concentrate on two perspectives: (1) improvement to cumulative measures, in particular, travel impedance and (2) factors associated with the travel impedance obtained from the navigation app Baidu Map.

3. Factors Associated with Travel Impedance

An online questionnaire survey about which factors are important for accessibility was conducted in Zhengzhou city. A total of 270 questionnaires were collected. The respondents consisted of 185 males and 85 females. Most of the respondents were enterprise staff, teachers, and doctors. The proportion of respondents who used navigation during travel was 98.15%, as shown in Figure 1; 25.56% of the respondents always used navigation during travel, and 47.78% of the respondents used it frequently. Furthermore, 63.76% of travelers responded that they preferred to choose the path recommended by the navigation map as the travel path. Especially when the travelers were unfamiliar with the traffic conditions, the proportion was as high as 97.41%.
According to travel time, travel by car was divided into three types: short-distance travel (travel time less than 15 min), medium-distance travel (travel time more than 15 min and less than 30 min), and long-distance travel (travel time more than 30 min). Figure 2, Figure 3 and Figure 4 show the factors preference for different age groups. For the three types of travel, in addition to congestion, the travel time, travel distance, and the number of lights were the top three important factors. There was no substantial difference about the preferred factors between age groups. The impact of traffic congestion on travel path impedance was reflected in the travel time. In addition, for a specific road segment, the estimated travel time in the navigation app was related to the grade of the road and the speed limit. Information about the recommended travel path in the navigation app consisted of the travel time, travel distance, and the number of lights, as shown in Figure 5.
Moreover, a survey on the preferences of travelers with respect to time and distance factors was also conducted. As shown in Figure 6, 71.48% of the respondents believed that the time factor was most important, 7.04% of the respondents thought the distance factor was most important, and the rest of the respondents thought the two factors were equally important. These results were used to determine the weight coefficient of the comprehensive travel impedance model described in the following section.

4. Accessibility Analysis Methodology

4.1. Comprehensive Travel Impedance Model

Accessibility to urban road-to-freeway interchanges (i.e., freeway entrances and exits) is representative to assess the accessibility to a freeway network. It should be noted that this study focused on car travelers. Accessibility, from the perspective of travel impedance, represents the objective ability to reach freeway entrances and exits via the urban road system. Travel time, travel distance, and the number of traffic lights were comprehensively considered to measure the comprehensive travel impedance.
From an overall perspective, the accessibility of freeway entrances and exits represents the convenience for travelers to reach a freeway network via the urban traffic system. Therefore, the accessibility of freeway entrances and exits was defined as the overall difficulty of reaching all freeway entrances and exits in the central urban area from a travel hotspot through the urban traffic system. Then, comprehensive travel impedance, which consists of travel time impedance and travel distance impedance, was used to measure accessibility.
The navigation map software Baidu Map was utilized to calibrate the OD points and plan the path. The set of travel hotspots in the city is denoted by O, and the set of freeway entrances and exits is represented by D. For each i ( i O ) and j ( j D ), the travel path can be provided by the navigation map software. If several path options are given, it is assumed the first recommended path is chosen by travelers, which is usually the path with the shortest estimated travel time.
Navigation maps provide information including travel time, travel distance, and the number of traffic lights. As drivers need to be more focused while driving in stop-and-go traffic (e.g., traffic light), it results in an elevated discomfort and frustration level among them [23,24]. Drivers tend to avoid travelling on paths where stop-and-go conditions are prevalent [25]. Hence, besides the increase in travel time, an increase in the number of traffic lights on a path also increases its disutility association with the discomfort and frustration for a driver. Saxena et al. (2019) [25] also found that the amount of stop-and-go traffic (along with time spent in stop-and-go traffic) contributed towards the disutility for a given path. Therefore, the travel time impedance was obtained after considering the travel time estimated by the navigation map and the impairment effect of traffic lights.
c i j T = T i j + G i j ξ
where c i j T is the travel time impedance between i and j; T i j denotes the estimated travel time provided by the navigation map software; G i j represents the number of traffic lights on the path; and ξ represents the derogation utility of a single traffic light. Equation (1) accounts for both delay (i.e., additional travel time) and discomfort (expressed as the number of traffic lights experienced).
Then c i j T * can be obtained using the min–max normalization method, shown as follows:
c i j T * = c i j T min max min
where min is the minimum value of c i j T (j = 1, 2, …, n); max is the maximum value of c i j T (j = 1, 2, …, n); and n is the number of freeway entrances and exits.
Travel distance c i j L is another factor influencing accessibility between travel hotspot i and freeway entrance and exit j. Similarly, using the min–max normalization method, c i j L can be normalized and c i j L * obtained.
According to the above analysis, the following comprehensive travel impedance model can be proposed by comprehensively considering the travel time, travel distance, and number of traffic lights. As shown in Equation (3), the comprehensive travel impedance is expressed as a linear combination of travel time impedance and travel distance impedance after standardization.
c i j = γ 1 c i j T * + γ 2 c i j L *
where c i j is the comprehensive travel impedance; c i j T * and c i j L * represent the standardized travel time impedance and travel distance impedance, respectively; γ 1 and γ 2 denote the weight coefficients of the two impedances, respectively; and γ 1 + γ 2 = 1 .
The average comprehensive travel impedance is a measure of the overall travel impedance from a hotspot i in the city to all available freeway entrances and exits.
C i = j = 1 n c i j / n
where C i denotes the average comprehensive travel impedance from hotspot i as the starting point to all freeway entrances and exits; n is the total number of freeway entrances and exits.
Accessibility is a measure of the degree of difficulty of travel, and the degree of difficulty can be quantified by travel impedance. A comprehensive travel impedance model can thus be formulated to measure accessibility:
A i = 1 / C i
where A i  denotes the accessibility of freeway entrances and exits for hotspot i.

4.2. Dynamic Analysis Method
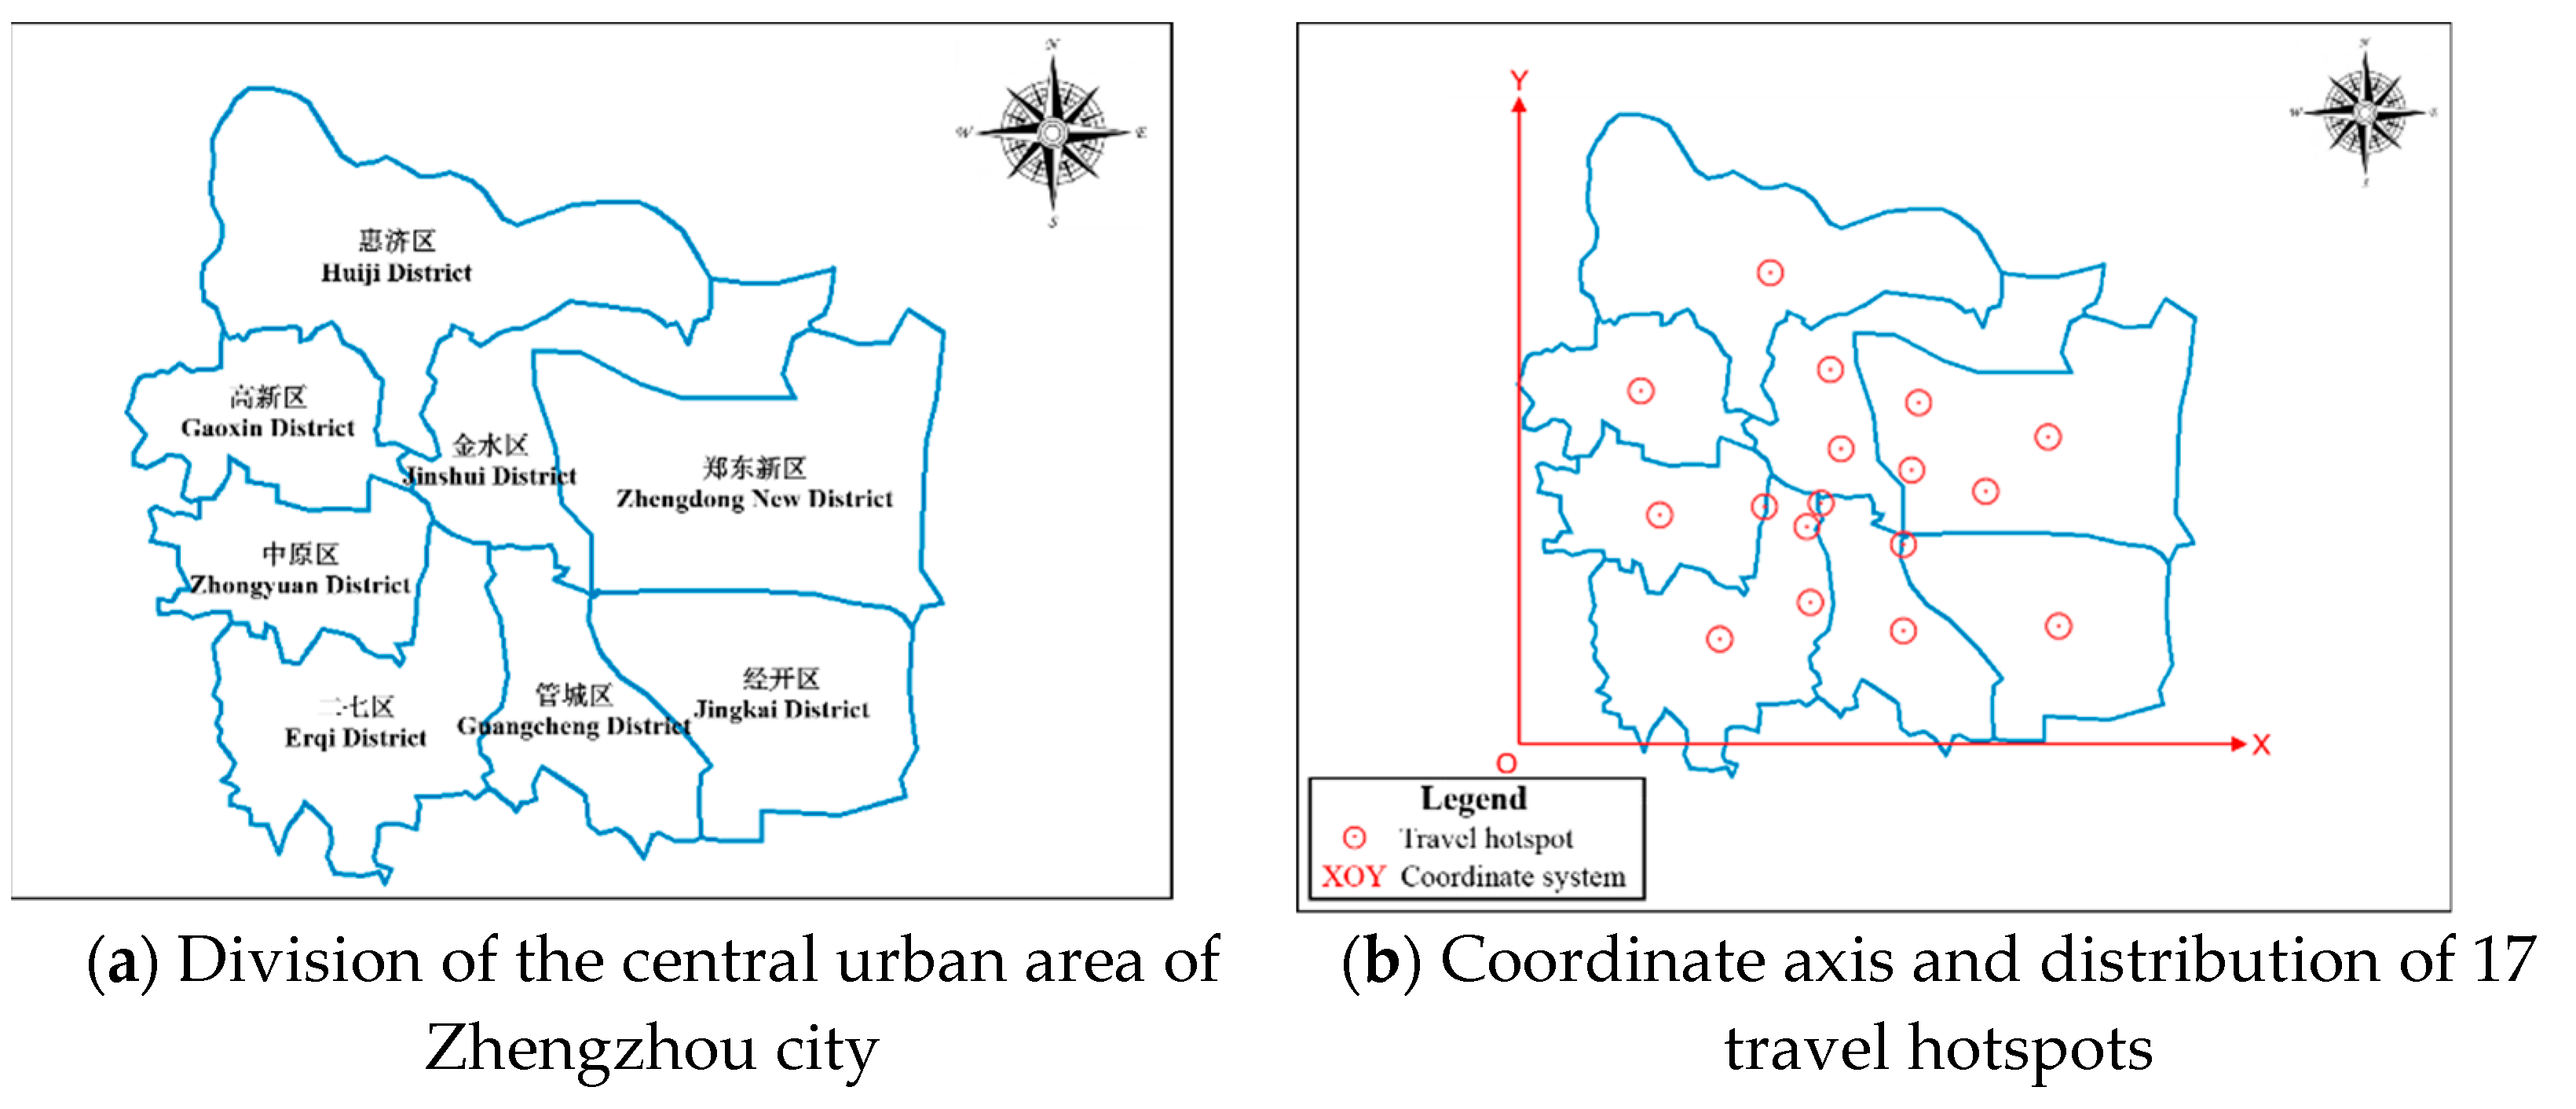
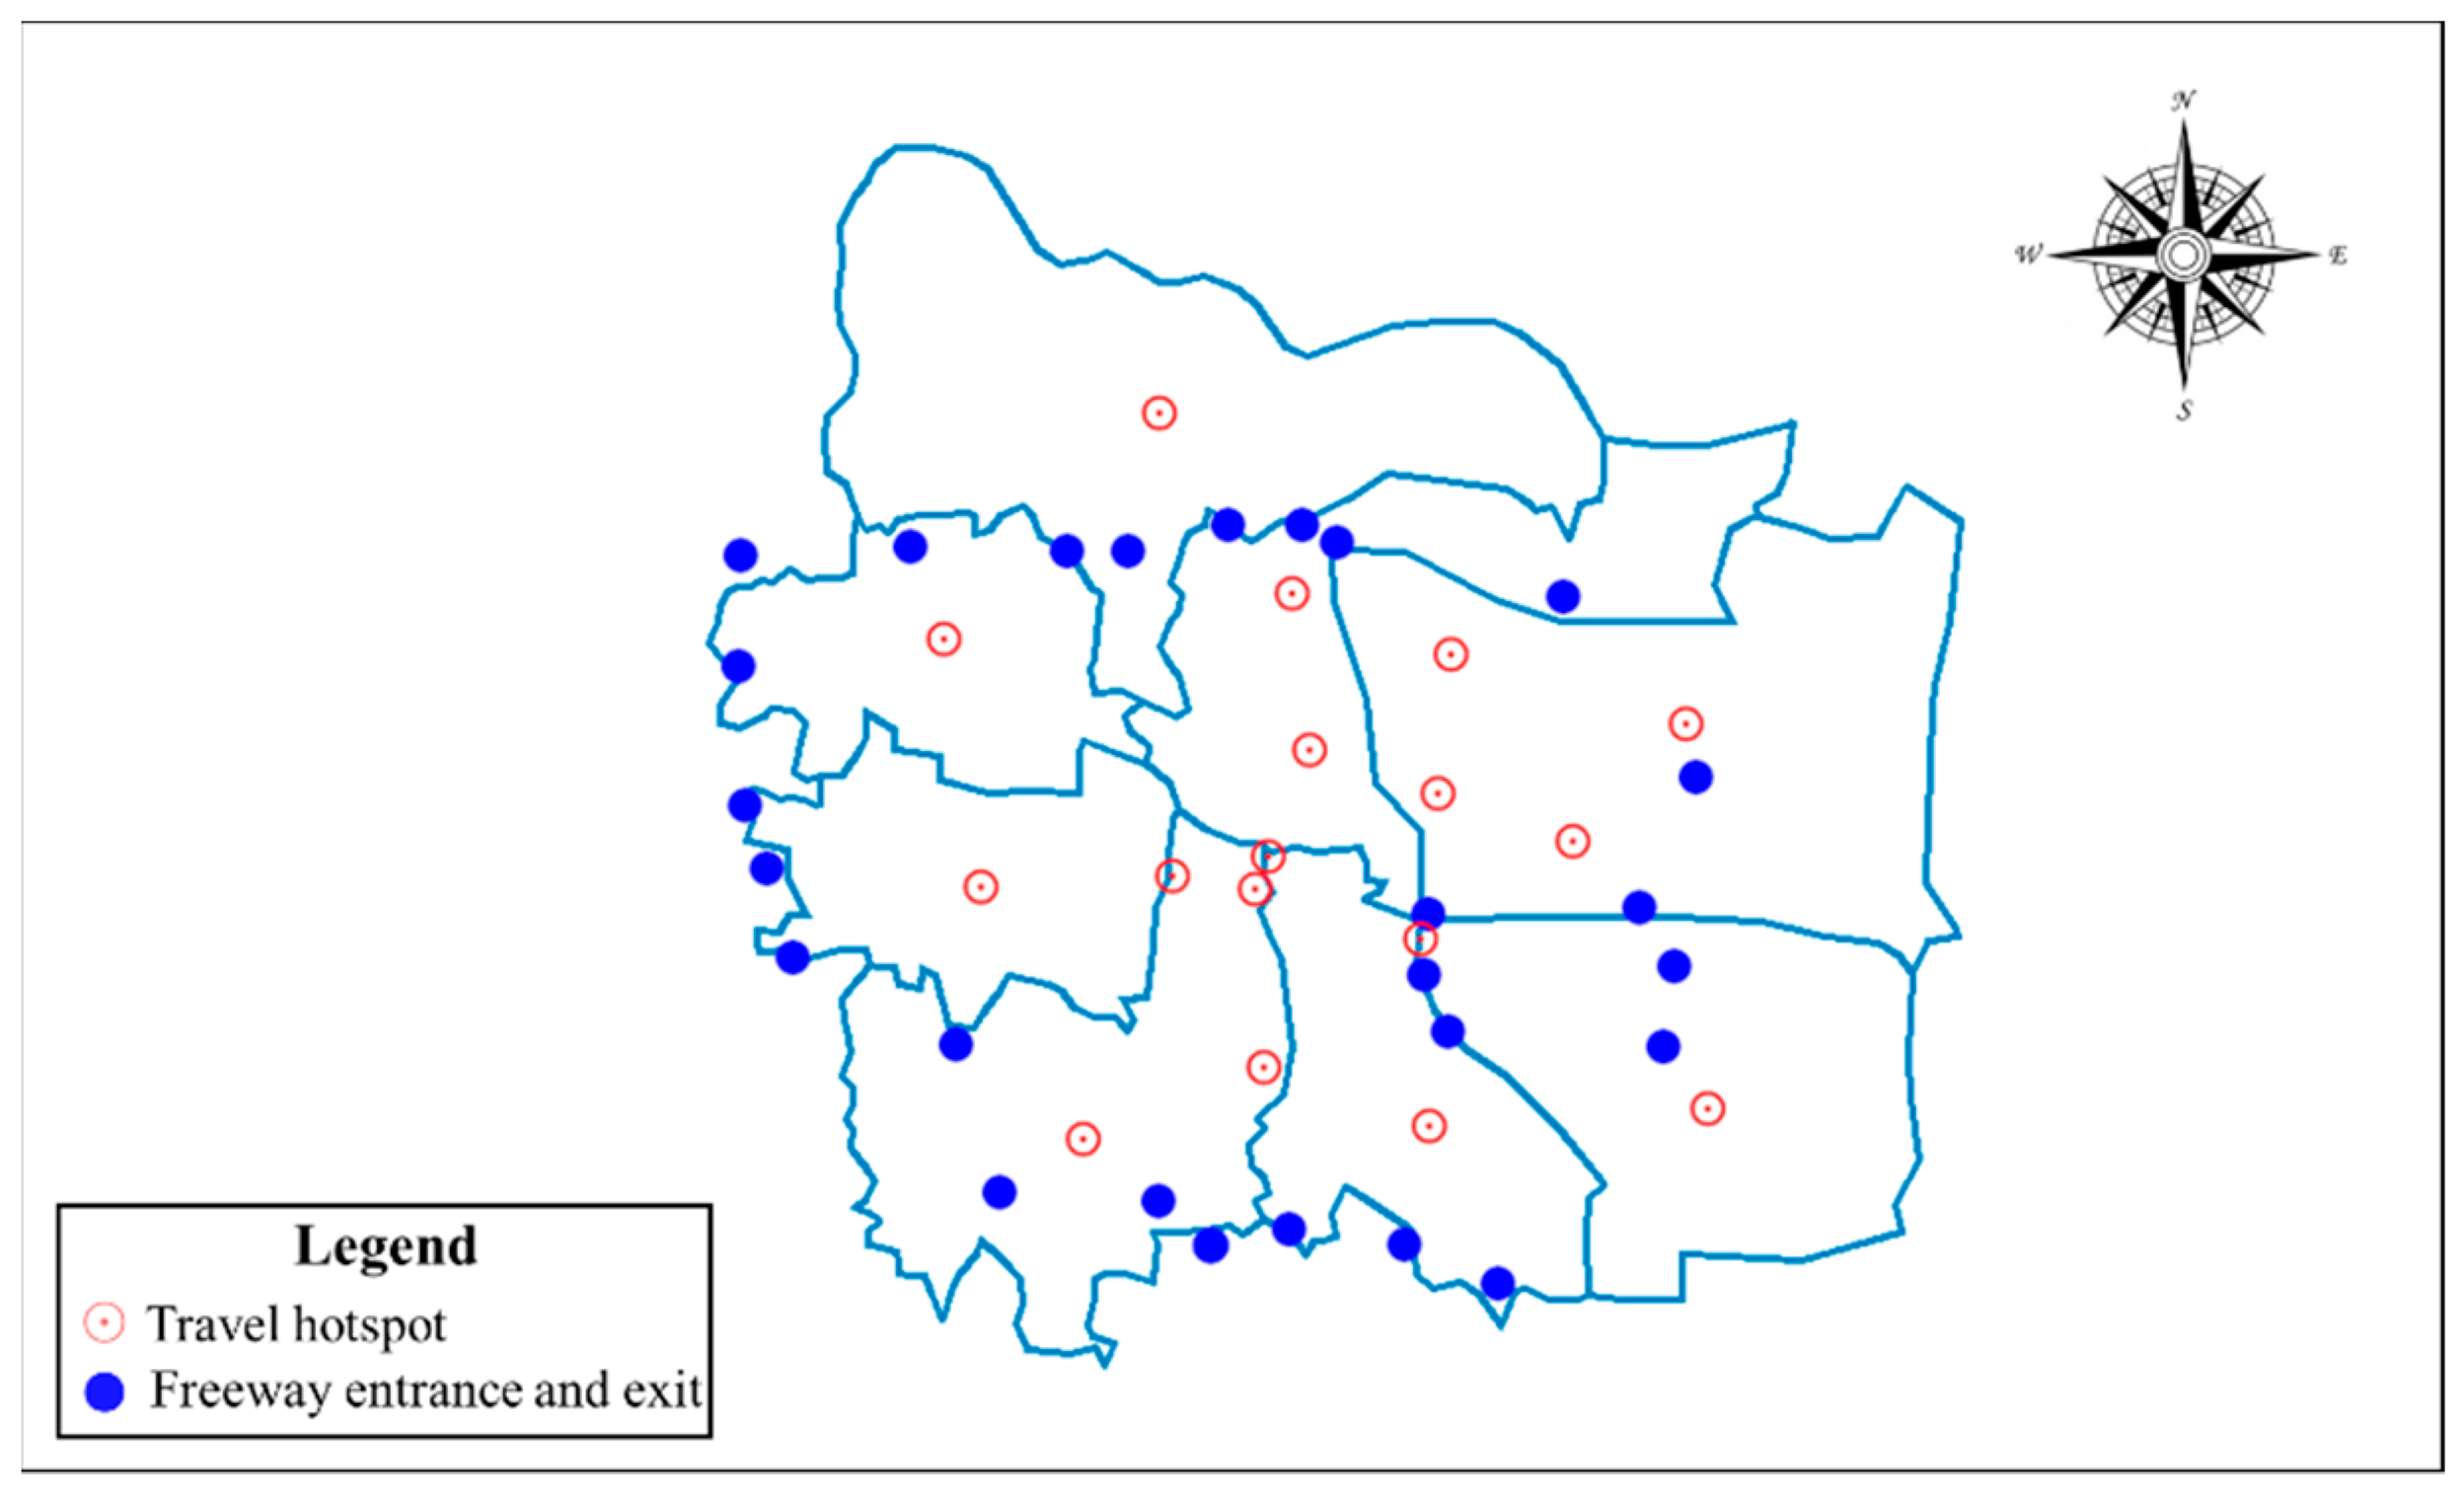
The obtained data based on navigation maps changes over the time, which thus provides the possibility for dynamic accessibility analysis. This study selected four different time periods to conduct a dynamic accessibility analysis of freeway entrances and exits, i.e., morning peak period (MPP), off-peak afternoon period (OPAP), evening peak period (EPP), and off-peak evening period (OPEP). By applying the proposed model to different time periods, the dynamic trends of accessibility could be captured.

5. Case Study

Zhengzhou covers an area of 7446 square kilometers. The ring freeway in the central city of Zhengzhou is composed of the Zhengzhou Ring Expressway, Beijing-Hong Kong-Macao Freeway, and Lianhuo Freeway et al. As shown in Figure 7, twenty-six freeway entrances and exits are closely distributed on the Zhengzhou ring freeway. A schematic diagram of the freeway entrances and exits is shown in Figure 8, and names of the freeway entrances and exits are shown in Table 2.
According to “Fifth Comprehensive Urban Traffic Survey of Zhengzhou (2018)”, the central urban area of Zhengzhou is divided into eight districts: Huiji, Gaoxin, Jinshui, Zhengdong New, Zhongyuan, Erqi, Guancheng, and Jingkai Districts, as shown in Figure 9. Centroid points of these eight districts were selected as travel hotspots. Then two principles were set for selecting other travel hotspots, i.e., main centers and subcenters of cities and traffic distribution centers. Seventeen travel hotspots were finally selected for accessibility analysis of freeway entrances and exits, as shown in Figure 9, and information about the hotspots is shown in Table 3.
The 26 freeway entrances and exits and 17 travel hotspots are integrated and shown in Figure 10.

5.1. Data

This study focused on 17 travel hotspots and 26 freeway entrances and exits. Using Baidu Map navigation software as a data acquisition tool for a specified time period, the travel path from a certain travel hotspot to any one of the 26 freeway entrances and exits within the study area could be obtained by calibrating the OD points. By means of the path planning data provided by Baidu Map, the source data of the recommended path, estimated travel time, travel distance, and the number of traffic lights on path could be obtained. These information were in real-time and change over the time. It was assumed that travelers always prefer to choose the recommended path as the travel path, i.e., they change the path choice according to the recommended path over the time. A total of 442 sets of basic data were extracted.
The two weight coefficients were determined according to the survey on the preferences of travelers with respect to time and distance factors. Results showed that 71.48% of the respondents believed that the time factor was most important, 7.04% of the respondents thought the distance factor was most important, and the rest of the respondents thought the two factors were equally important. Hence, the set was γ 1 = 71.48 % + ( 1 71.48 % 7.04 % ) / 2 = 0.8222 and γ 2 = 1 0.8222 = 0.1778 . The two values are acceptable in practical applications, since when choosing a path, the first subjective reaction of travelers is to pay attention to travel time. The impairment effect caused by a traffic light is equivalent to a travel time of 20 s, referring to Fosgerau et al. [26]. Moreover, the estimated travel time changes over the time of day, so the dynamic analysis of comprehensive travel impedance needs to be discussed in different time periods.

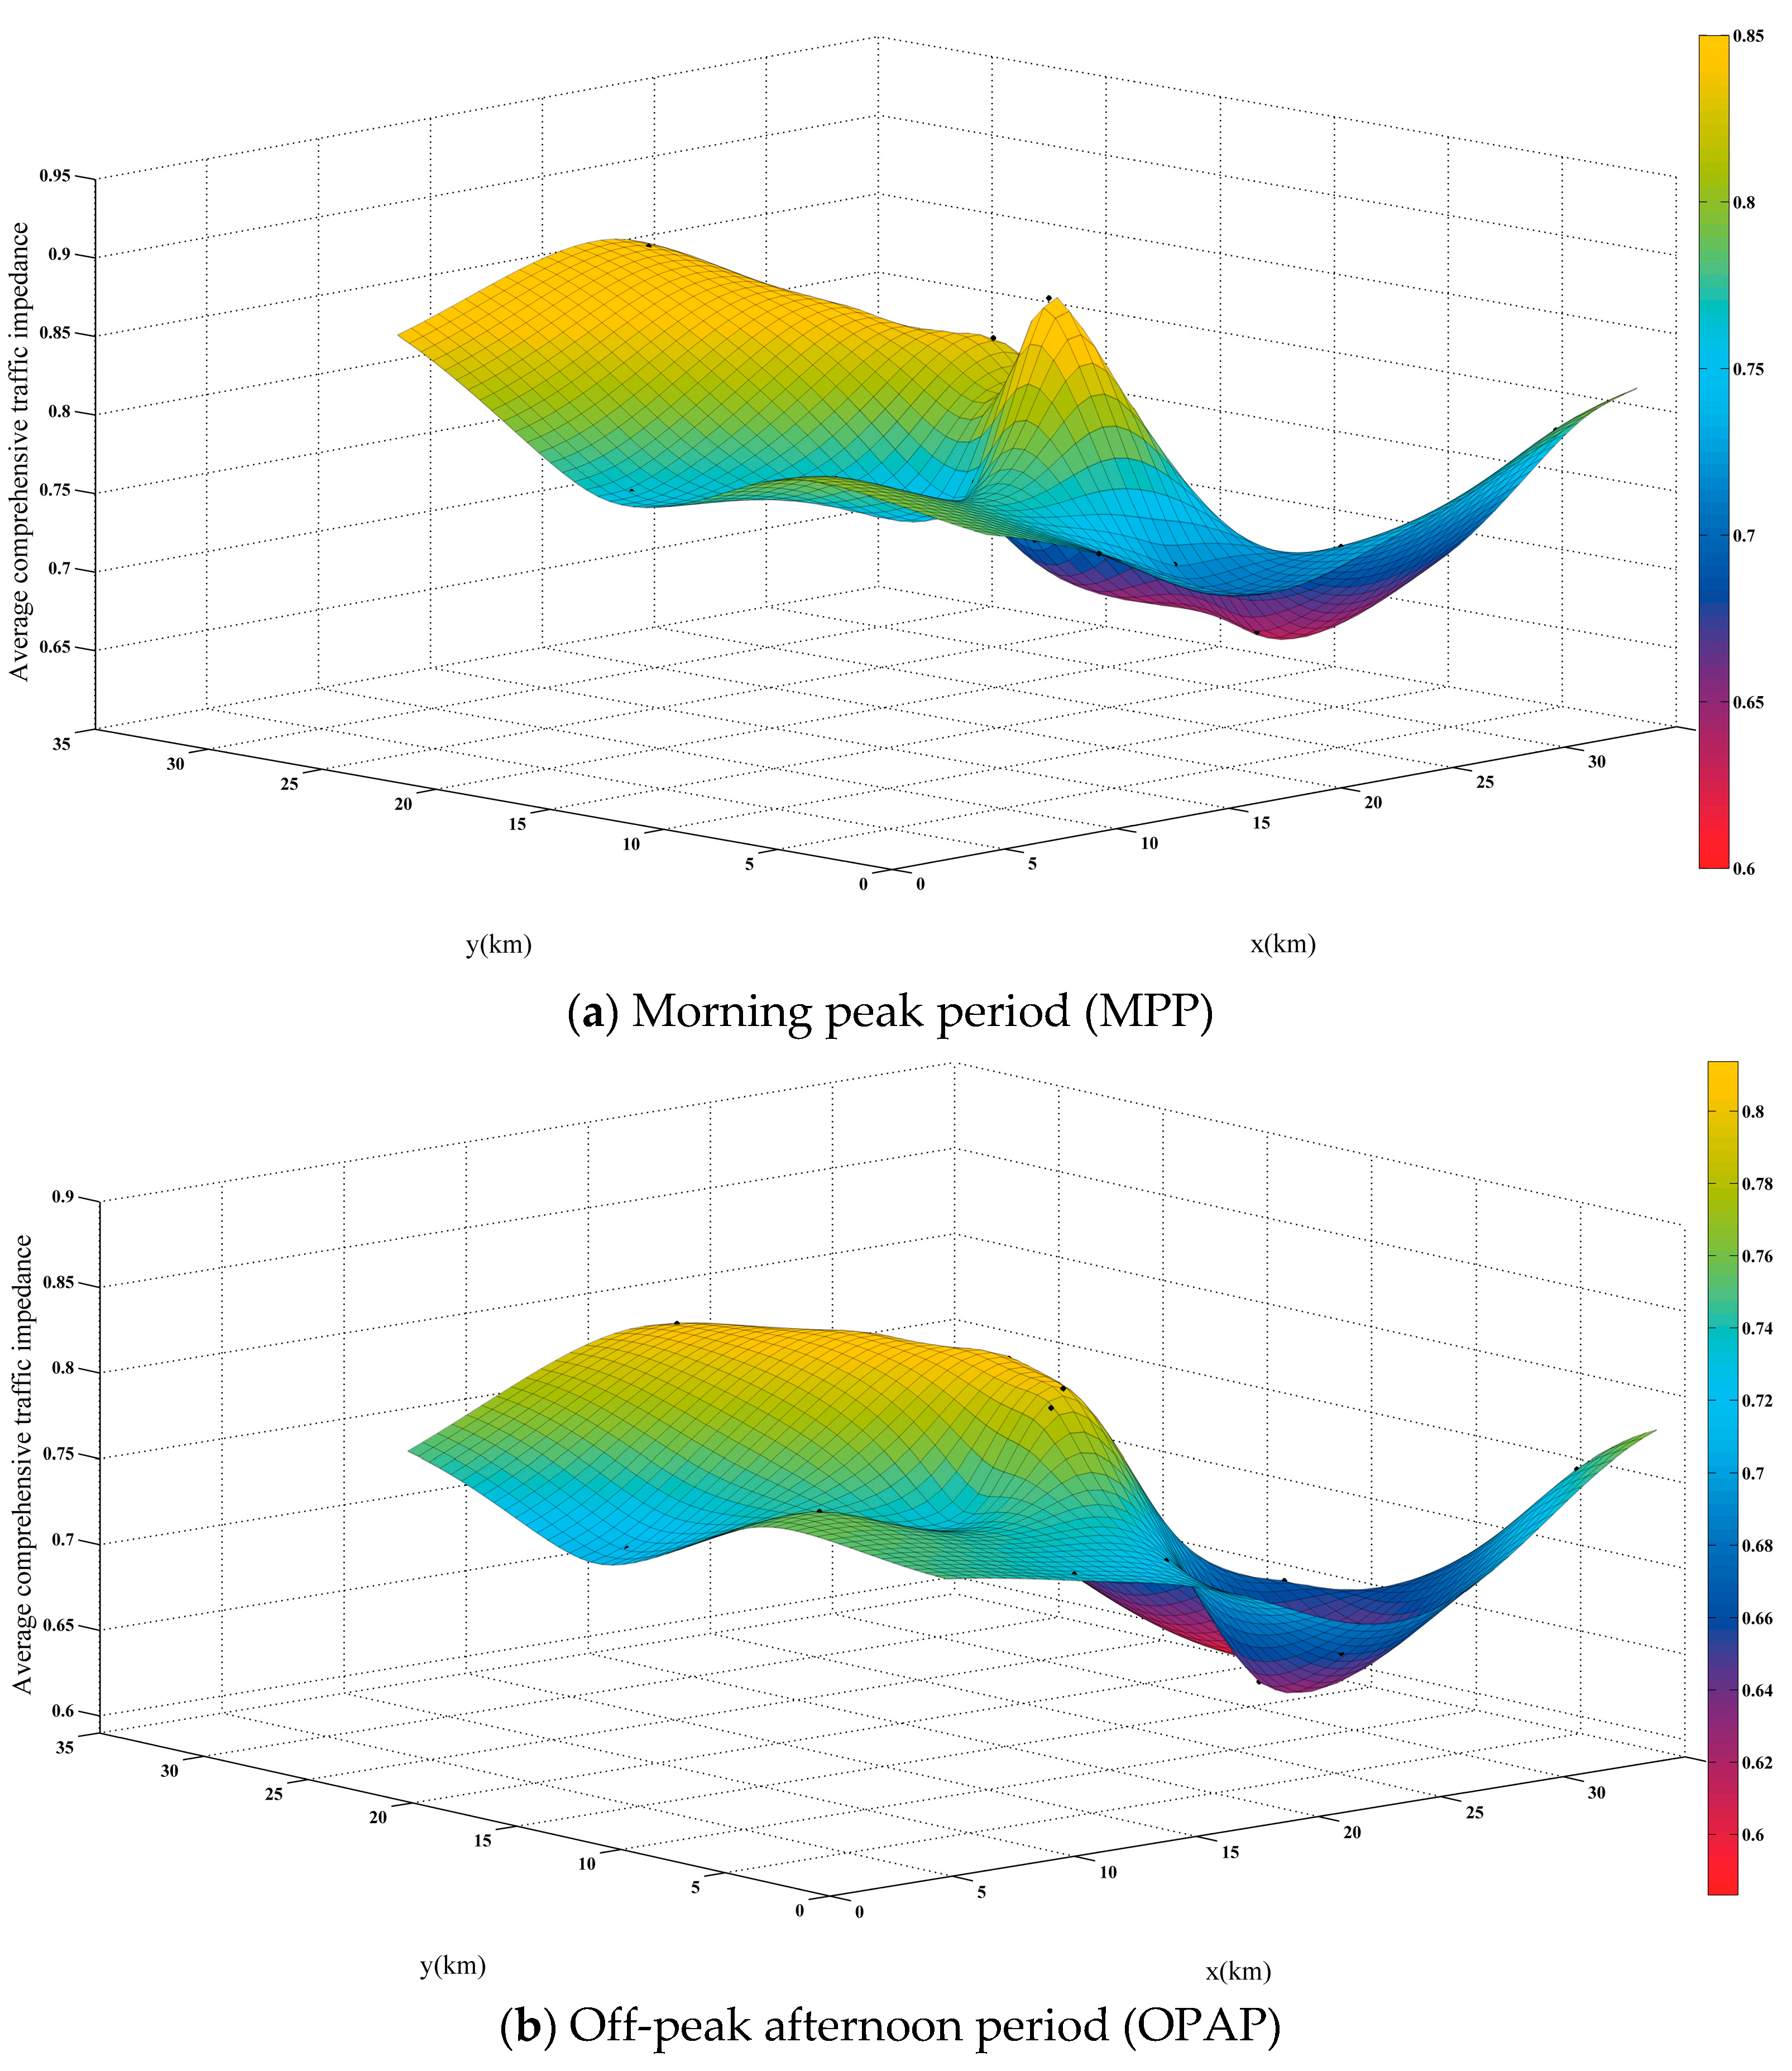
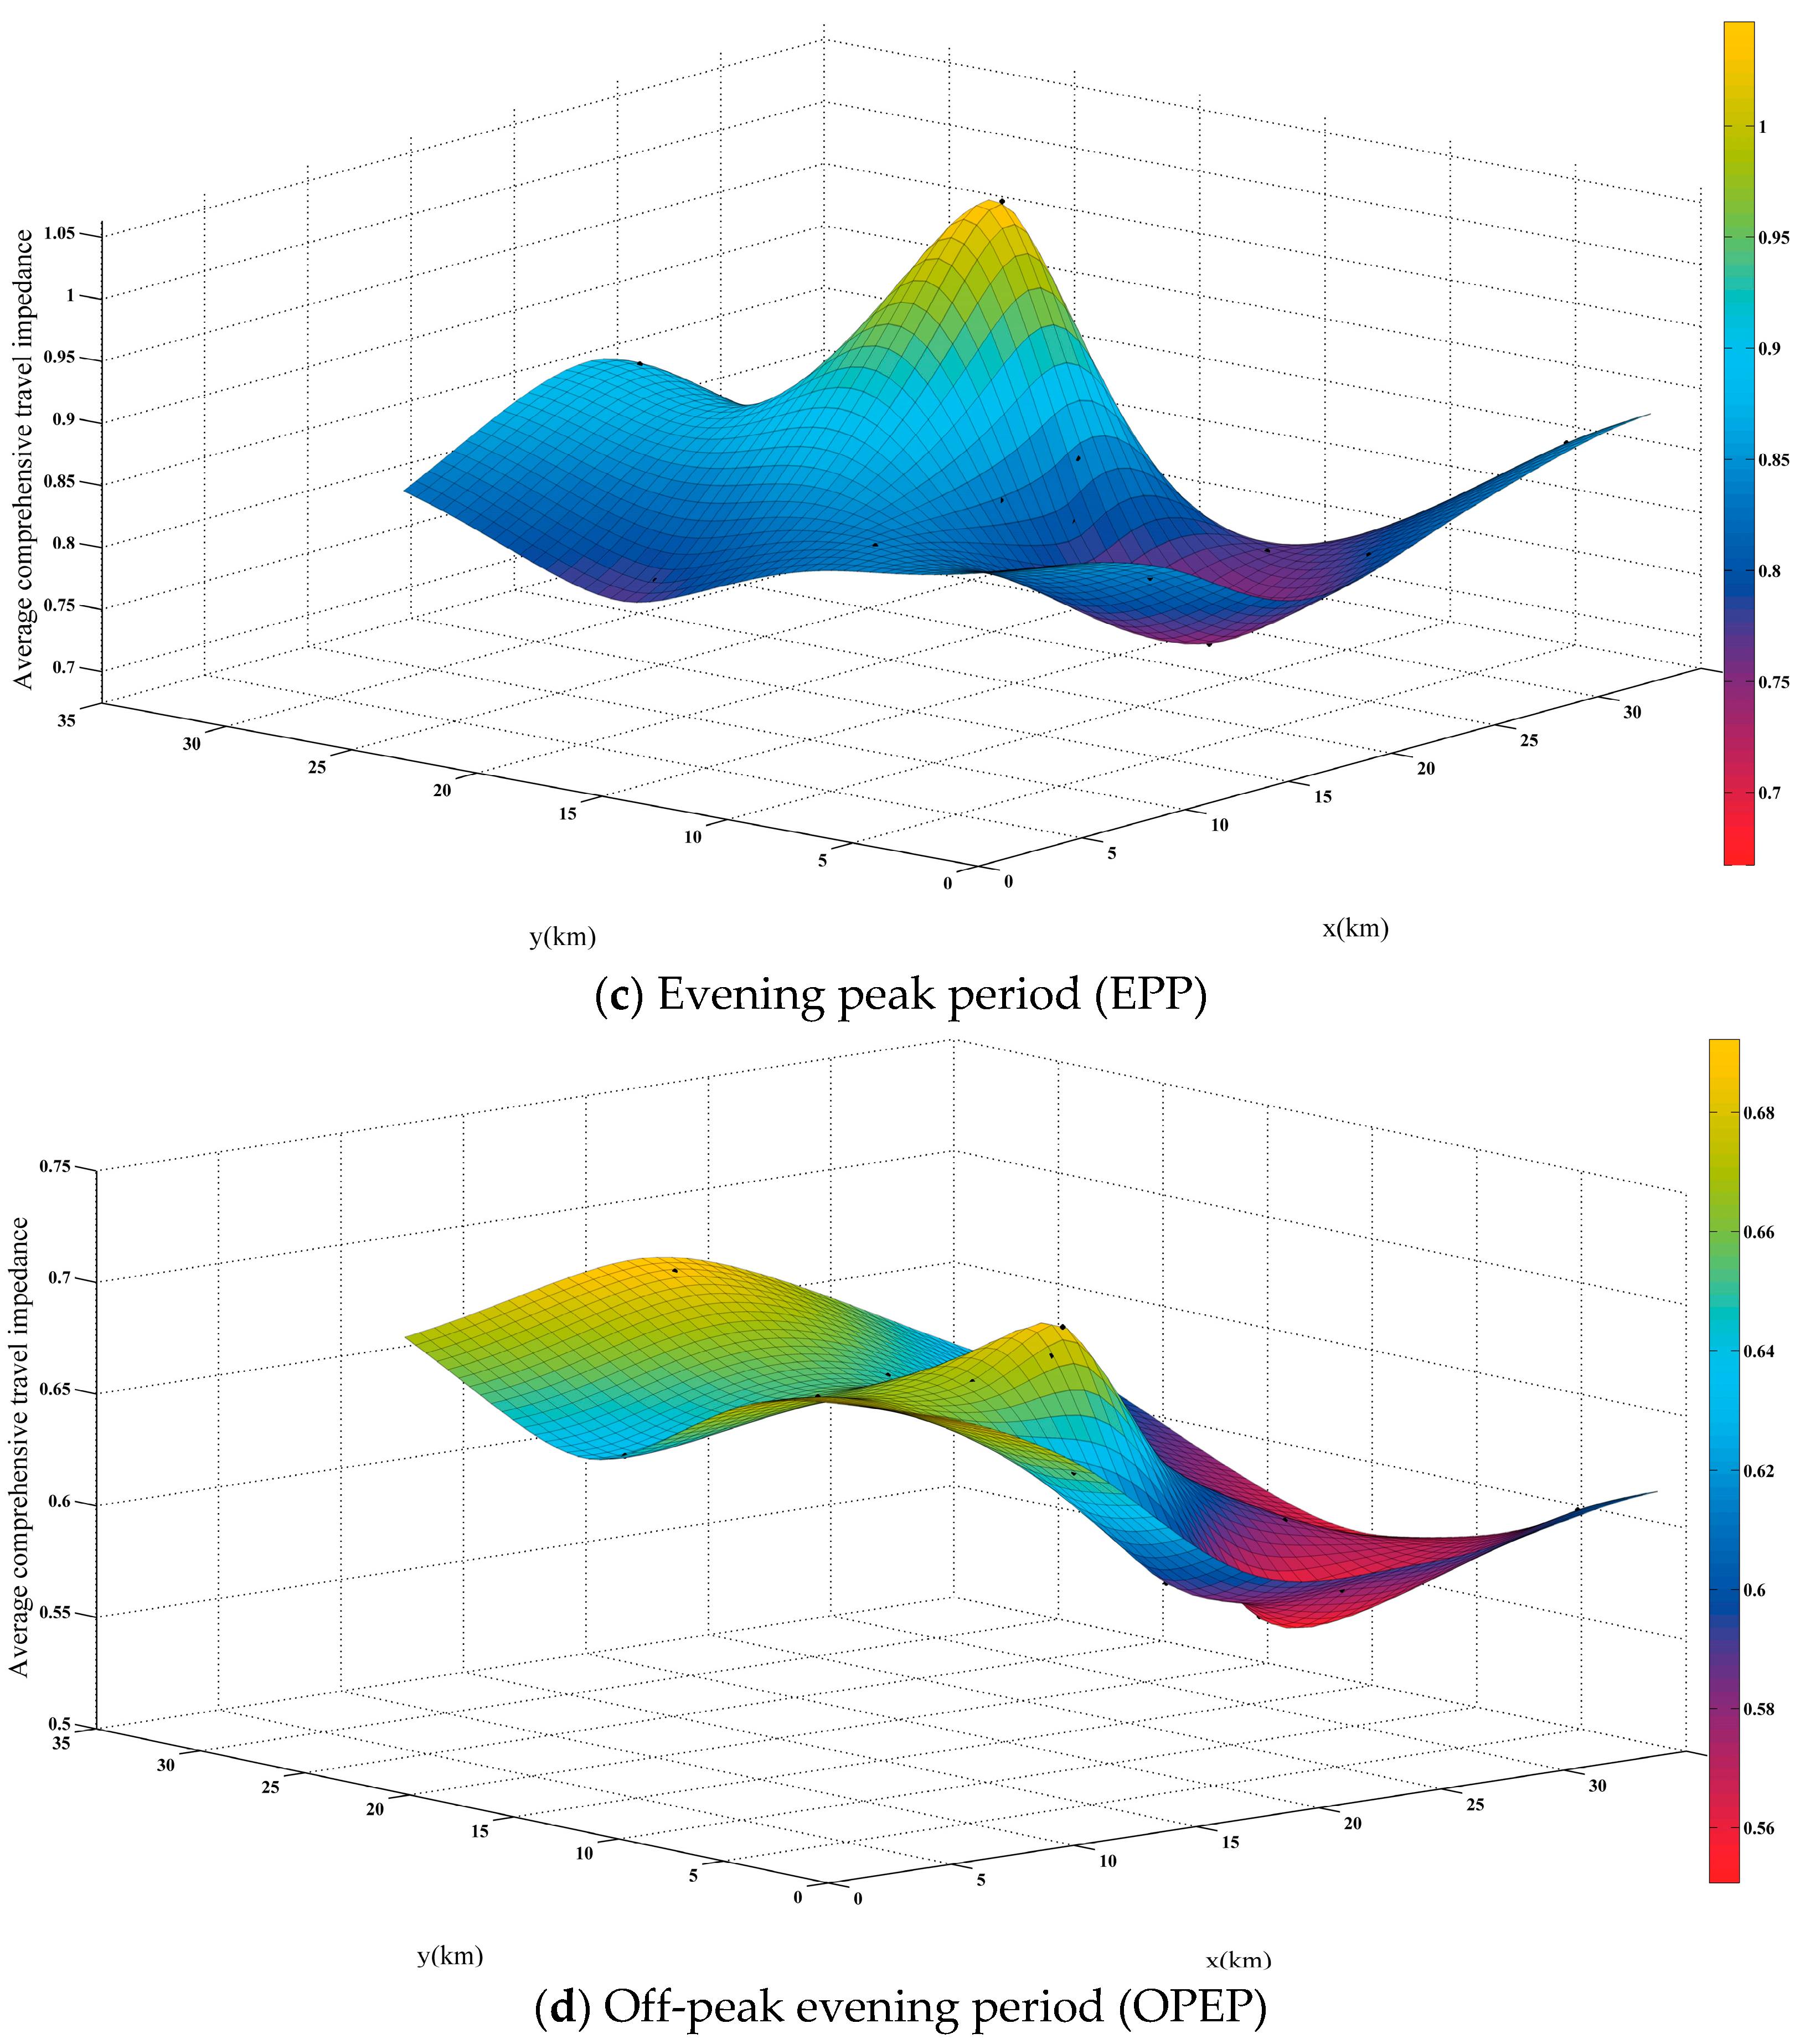
5.2. Calculation Results

After data acquisition, cleaning and analysis, the average comprehensive travel impedance results of 17 hotspots were calculated in four time periods: MPP (t = 1; between 9:00 and 10:00), OPAP (t = 2; between 13:00 and 14:00), EPP (t = 3; between 17:00 and 18:00), and OPEP (t = 4; between 23:00 and 24:00), as shown in Figure 11.
The average comprehensive travel impedance is a measure of the overall impedance from hotspot to all freeway entrances and exits within the city. By analyzing the results for different periods, we can see the impedance change with the traffic condition for different periods of time.
According to the results in Figure 11, the average comprehensive travel impedance of each travel hotspot was the lowest during OPEP, when traffic conditions were the best. Accordingly, each travel hotspot had the greatest accessibility during this period. During the EPP, for most of the travel hotspots, the average comprehensive travel impedance was the highest. Correspondingly, most of the travel hotspots had less freeway entrance and exit accessibility during this period. Therefore, it was found that the travel impedance of each hotspot was the lowest during the OPEP, the travel impedance of each hotspot was the highest during the EPP, and the travel impedance of the OPAP was between that of the EPP and OPEP periods and less than that of the MPP.
From the perspective of a single travel hotspot, a comprehensive view of the four time periods indicated that the average comprehensive travel impedance of the HYSC hotspot was the highest, and the volatility during the four periods was clear. The HYSC hotspot was located in Jinshui District, which is in the middle of the central city. Jinshui District has the largest population among the eight districts of Zhengzhou. Population has a macroscopic impact on travel impedance; the larger the population is, the higher the impedance may be. The clear volatility reflects that the road network around the HYSC hotspot may change greatly with time, resulting in fluctuations in travel impedance. The average comprehensive traffic impedance of CPZD was the lowest, and the volatility over the four periods was minimal. The CPZD is the geographic centroid of Zhengdong New District, and the main land types of Zhengdong New District are commercial land and university campus land. Furthermore, as a new district, Zhengdong New District has a better level of road network construction, which makes travel in this area convenient and lowers the travel impedance. The above analysis shows that the road network capacity of the area around the CPZD hotspot can meet the traffic demand of different periods. Changes in traffic flow have little influence on the road network conditions, which demonstrates that the road network construction of the surrounding area of the CPZD hotspot is of good quality and resilience.

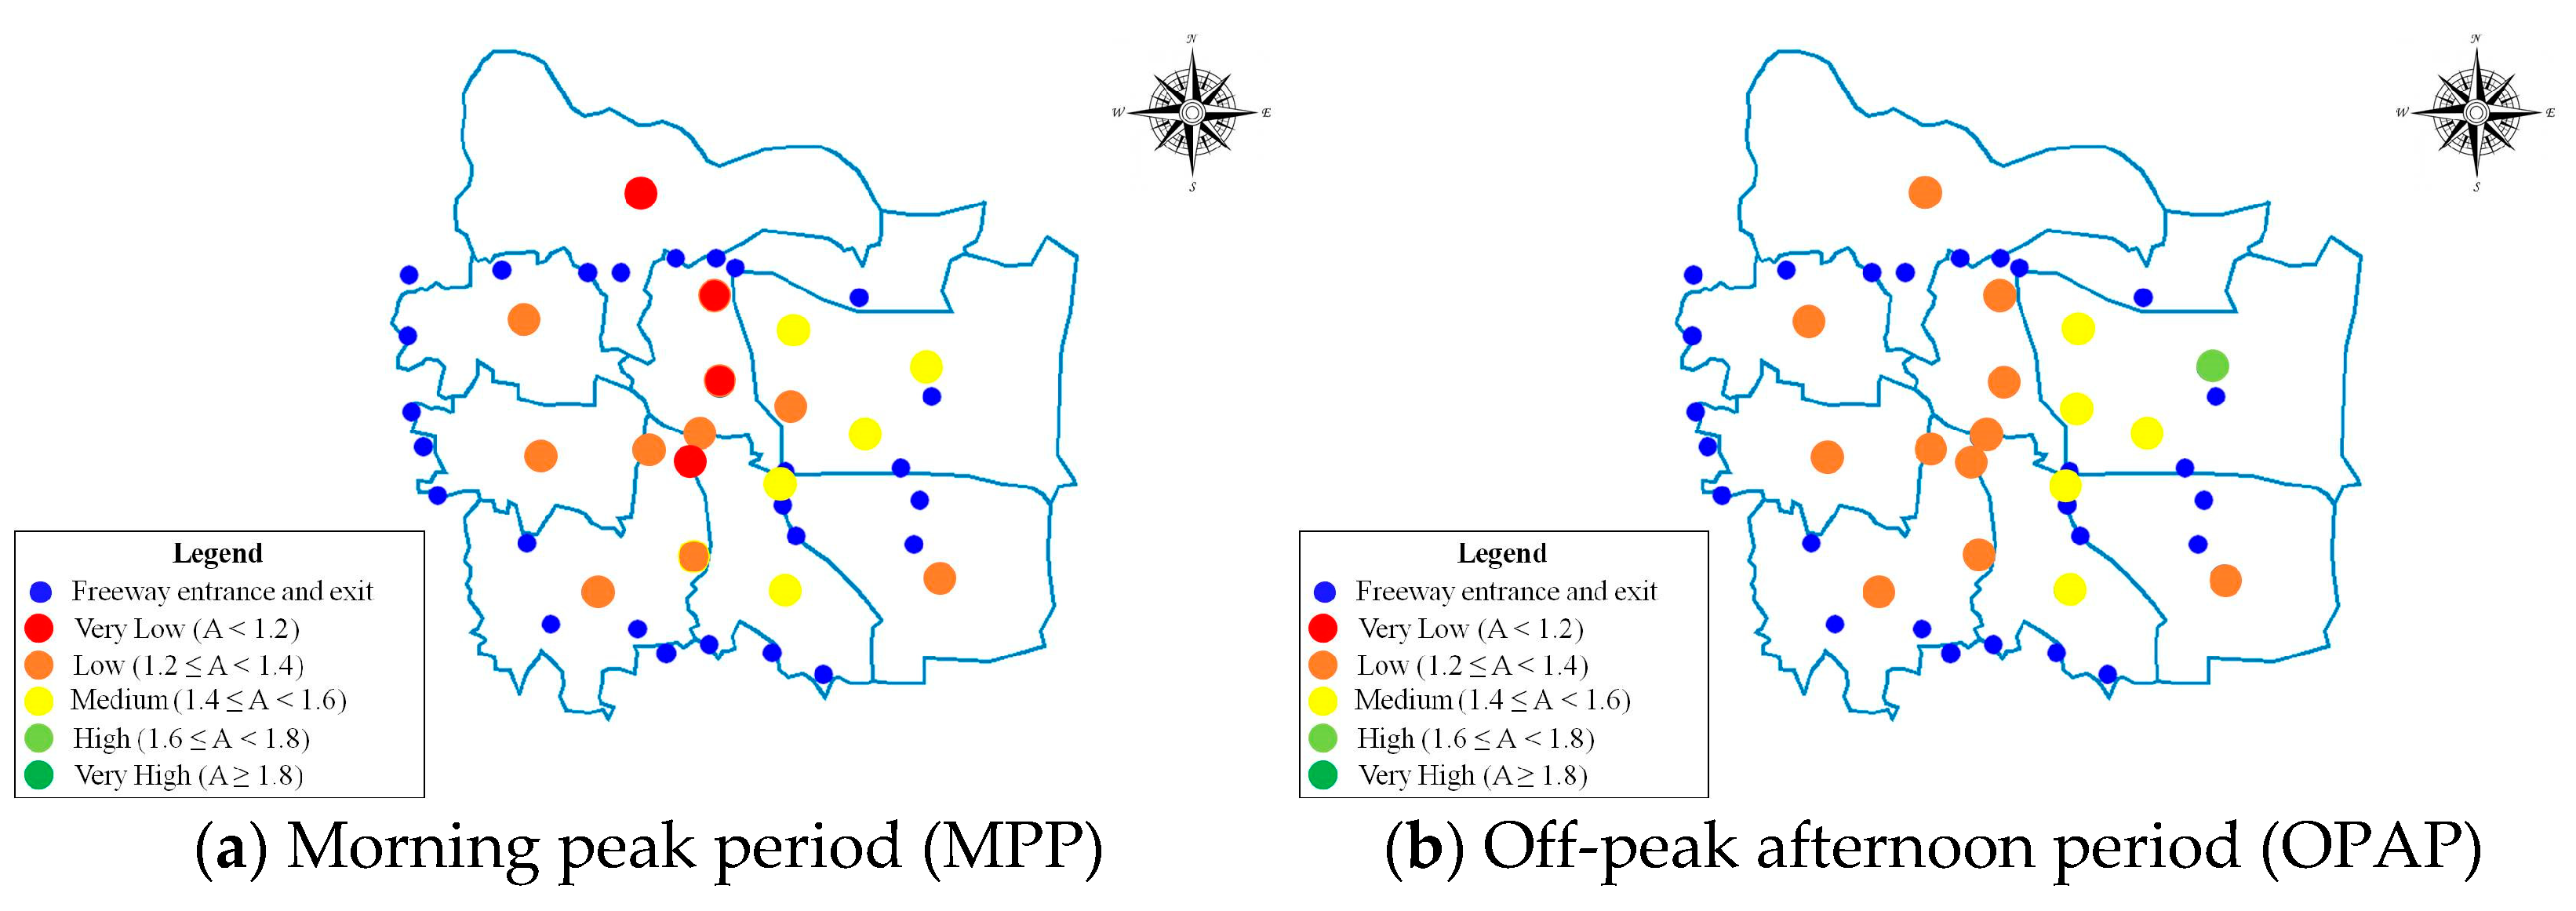
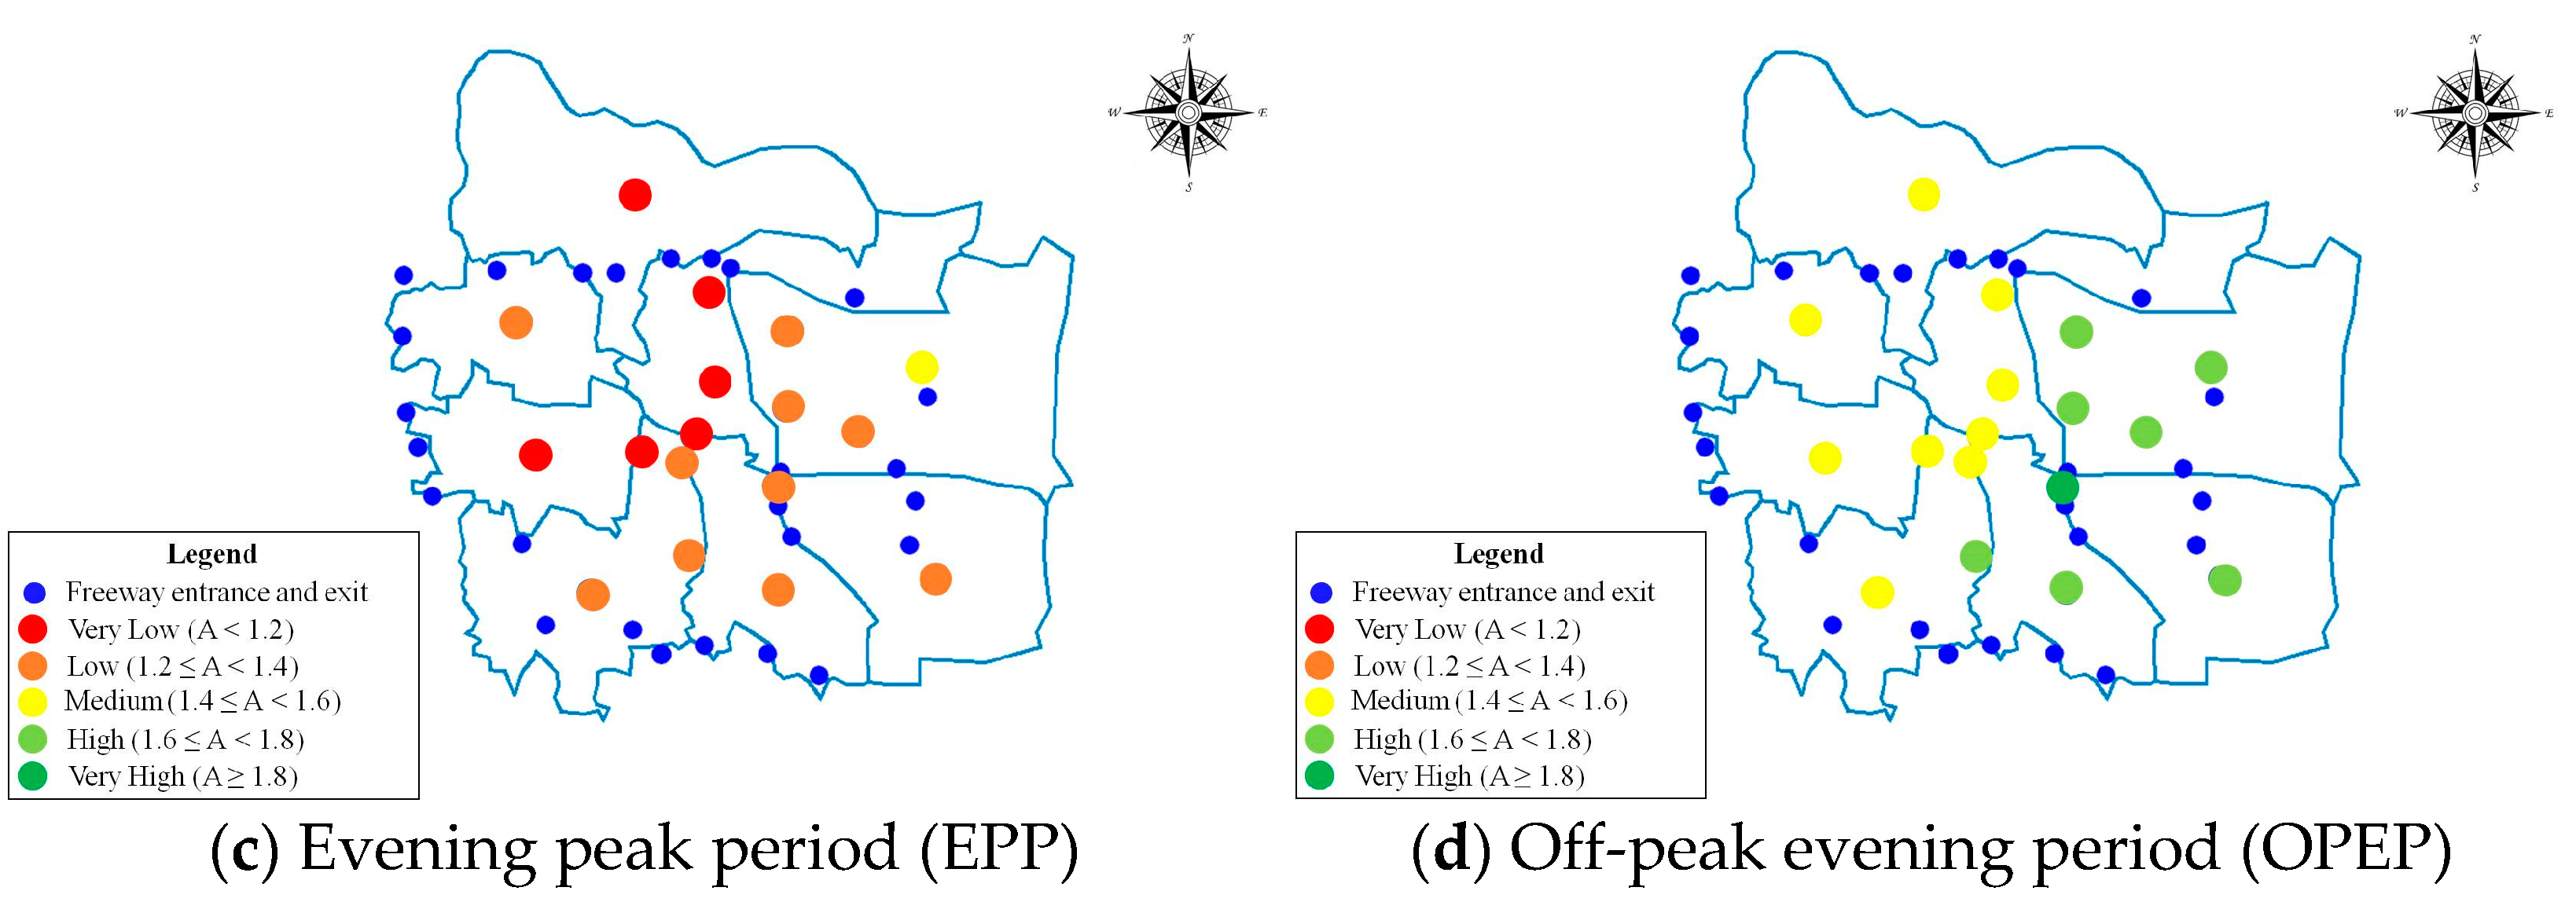
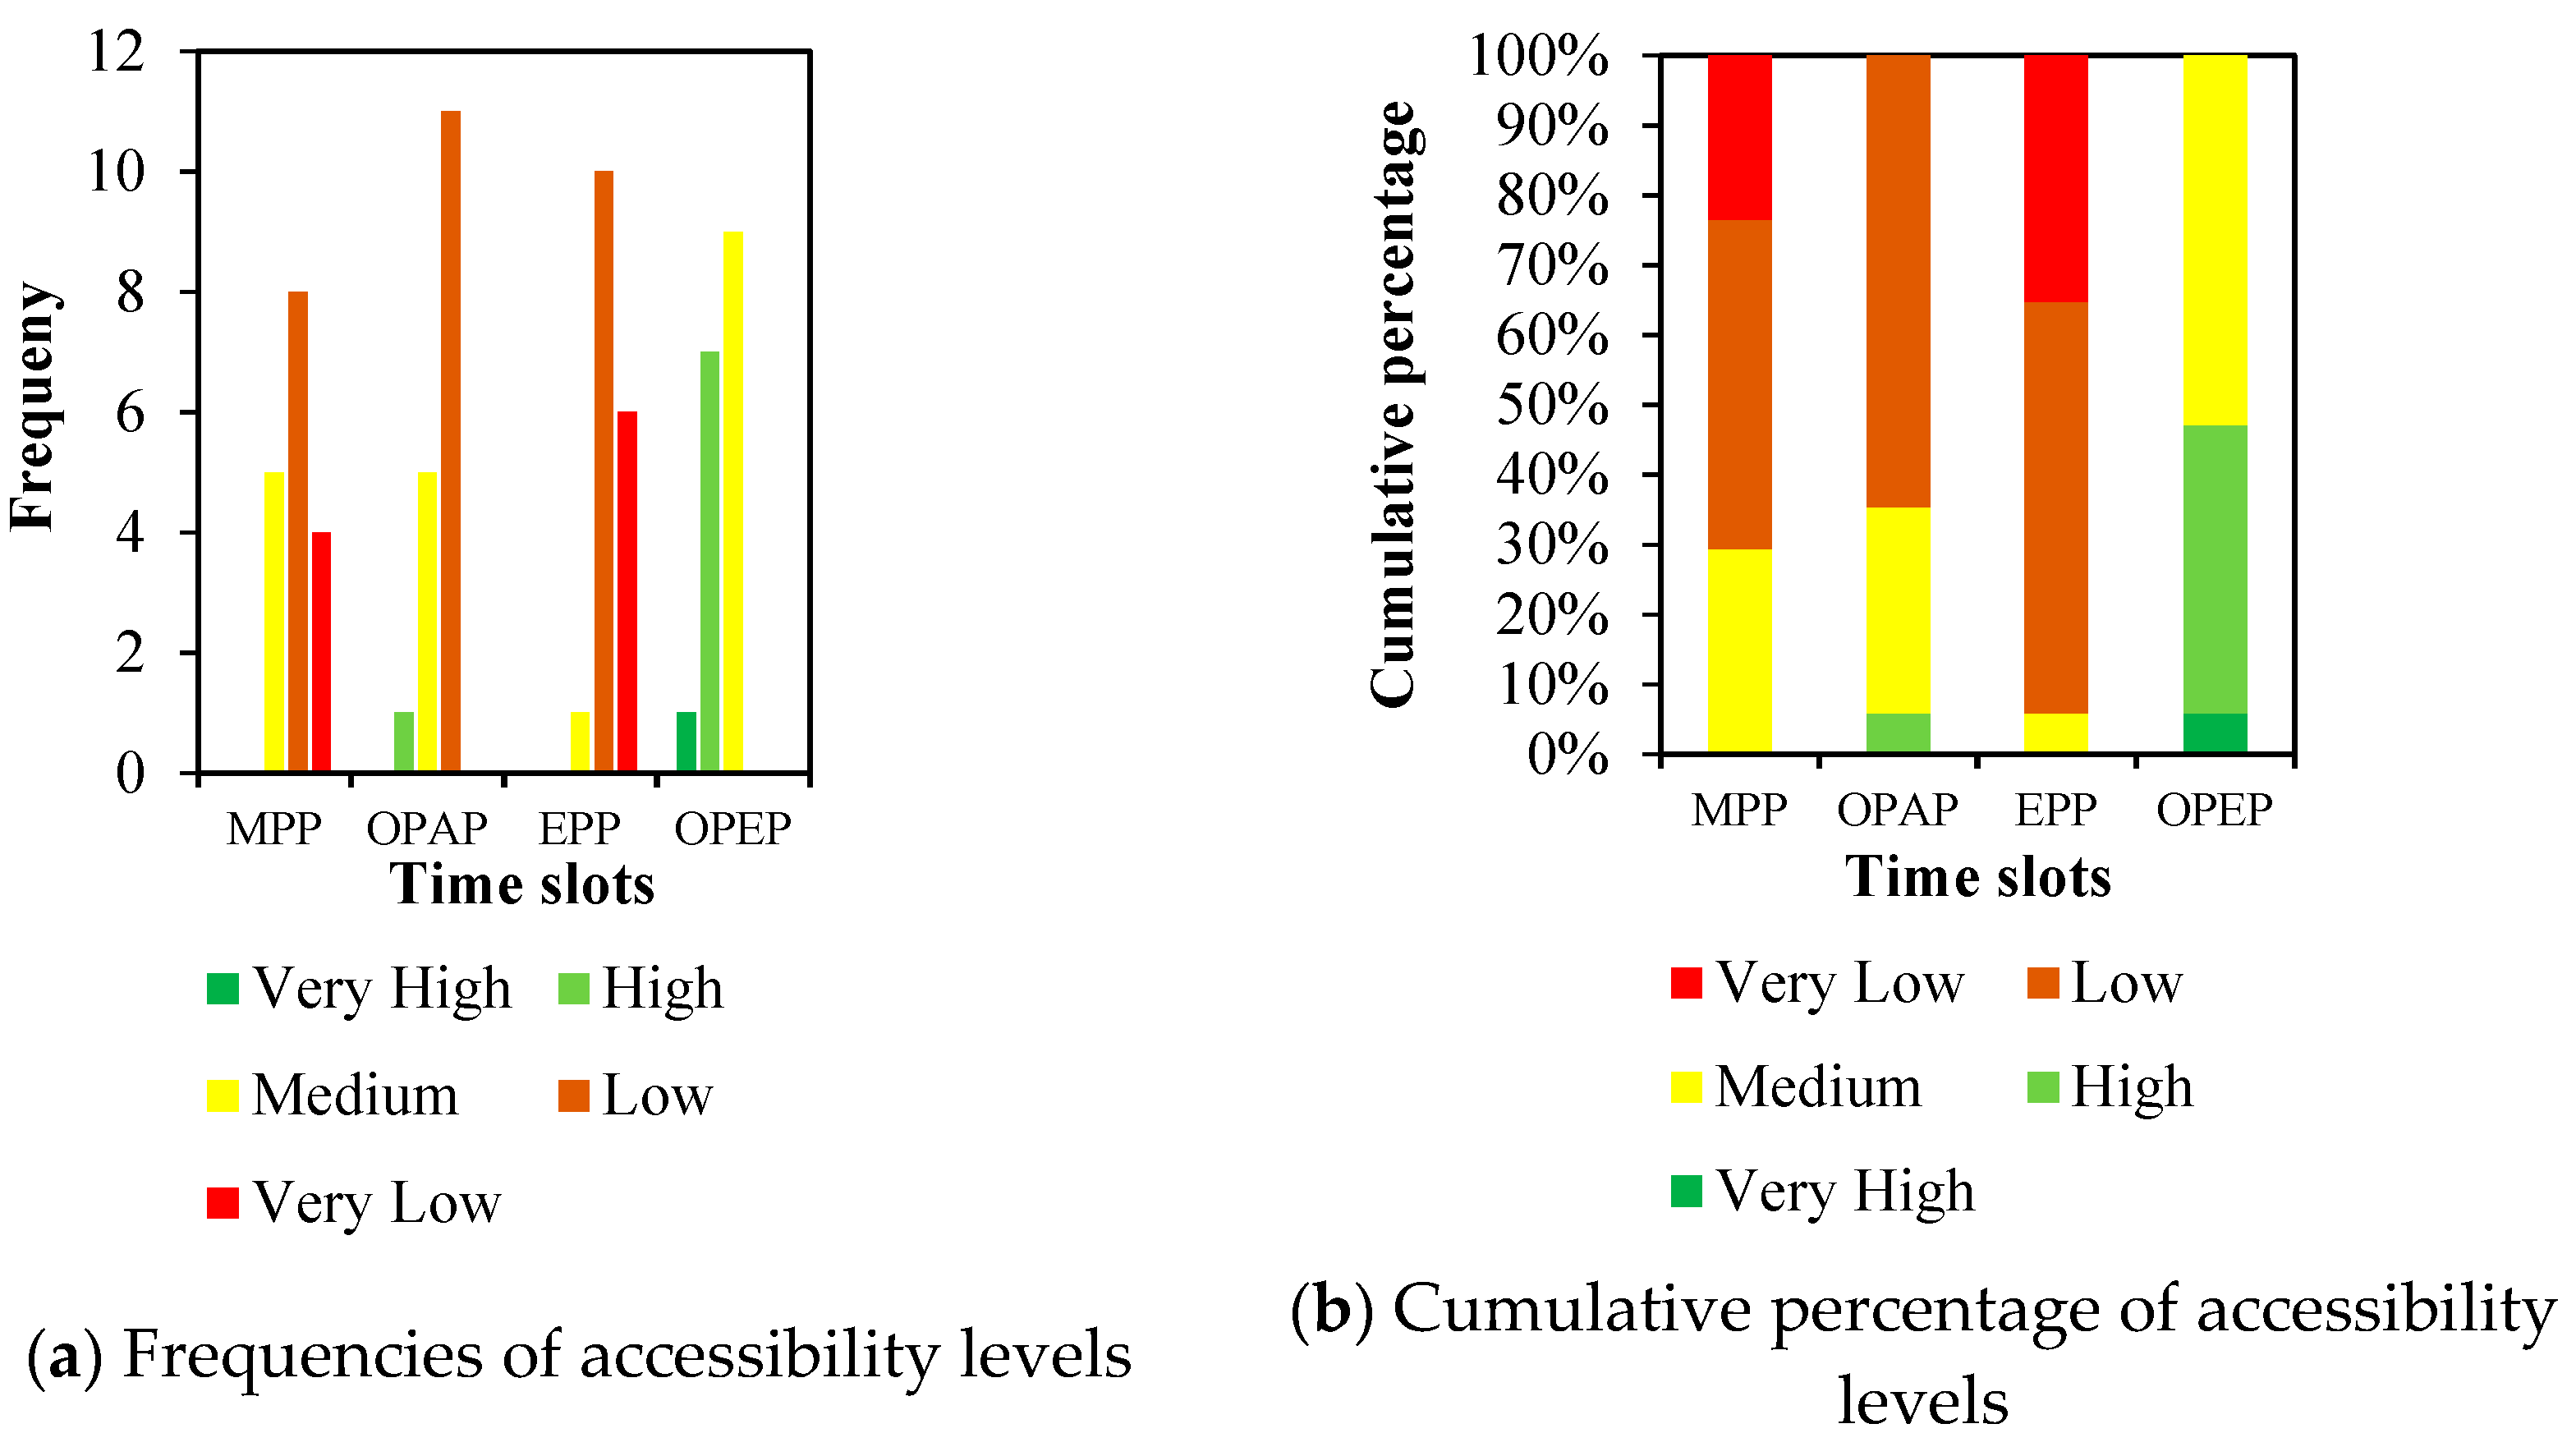
5.3. Dynamic Accessibility Analysis

To more intuitively compare and analyze the accessibility of freeway entrances and exits for each travel hotspot in different periods, an accessibility classification was provided in Table 4.
The distribution of the average comprehensive travel impedance in the central urban area of Zhengzhou in each period is shown in Figure 12. The classification level of the freeway entrance and exit accessibility of each travel hotspot is shown in Figure 13.
Comprehensive analysis of the visualization results in Figure 12 and Figure 13 yields the following conclusions.
(1) During the MPP
As shown in Figure 12a, the impedance in the middle of the central urban area is the highest and the accessibility is the lowest. The center of Figure 13a contains hotspots with low accessibility levels and very low accessibility levels. According to Figure 12a, the impedance in the western part of the central urban area is high, and the accessibility is low. Correspondingly, the western part of Figure 13a has hotspots with low levels of accessibility. As shown in Figure 12a, the impedance in the eastern part of the central urban area is low, the accessibility value is high, and the distribution is relatively even. Thus, as seen in Figure 13a, most of the travel hotspots in the eastern part of the central urban have a medium accessibility level.
Figure 13a shows that the accessibility of five travel hotspots is medium, that of eight hotspots is low, and that of four hotspots is very low. During this morning peak period, the overall accessibility of freeway entrances and exits in the central urban area is medium to very low.
(2) During the OPAP
As shown in Figure 12b, the impedance in the northwest of the central urban area is slightly lower than that in the southwest but both are higher than that in the east. The central impedance is at a peak, while the impedance in the east is at a valley, and the average comprehensive travel impedance decreases gradually from southeast to northeast. Correspondingly, Figure 13b shows that travel hotspots with low accessibility are distributed in the west and middle parts of the central urban area, while travel hotspots in the east have medium and high accessibility. Moreover, in the east, the accessibility gradually increases from south to north.
Figure 13b shows that the accessibility of one travel hotspots is high, that of five hotspots is medium, and that of eleven hotspots is low. Compared with the MPP, during this period, the accessibility of partial travel hotspots changes, and all these hotspots have clearly improved accessibility levels.
(3) During the EPP
As shown in Figure 12c, during the EPP, the impedance in the middle of the central urban area is extremely high, and the accessibility is very low. Correspondingly, the middle of Figure 13c contains hotspots with low accessibility levels and very low levels. According to Figure 12c, the eastern part of the central urban area has the lowest impedance and highest accessibility. Furthermore, the eastern part of Figure 13c shows travel hotspots with low accessibility levels, and the accessibility of travel hotspots from the west to the middle and east of the central urban area shows a low/very low distribution.
Figure 13c indicates that the accessibility of one travel hotspot is medium, that of ten hotspots is low, and that of six travel hotspots is very low. In summary, during this period, most of the travel hotspots have low accessibility, and only one hotspot in the east has medium accessibility. During the evening travel peak, the overall accessibility of freeway entrances and exits in the central urban area is low.
(4) During the OPEP
As shown in Figure 12d, the impedance in the north of the central urban area is higher than that in the south, and the impedance in the west is slightly higher than that in the east. The peak comprehensive impedance is in the northeast, and the valley is in the south. Figure 13d shows hotspots of medium accessibility in the west and high accessibility in the middle region.
Furthermore, Figure 13d indicates that the accessibility of one travel hotspot is very high, that of seven travel hotspots is high, and that of nine travel hotspots is medium. The accessibility distribution has a strong regularity from west to east. During this period, it is dominated by the hotspots of medium and high accessibility.
Furthermore, we conducted relevant statistical analysis according to the above accessibility results. A statistical table of accessibility is provided in Figure 14d, in which different colors represent different levels of accessibility.
According to Figure 14, low levels of freeway entrance and exit accessibility are most common in the MPP, OPAP, and EPP. During the MPP and EPP, we observed a very low level of accessibility due to the intensification of internal travel in the city during the peak periods, the increase in traffic pressure, and the impact on the operation of the urban road network.
During the two off-peak periods, OPAP and OPEP, we observed high and very high levels of accessibility, respectively, due to the smooth operation of the road network during off-peak periods. The travel time was greatly reduced compared to that during peak periods, thereby affecting the accessibility of freeway entrances and exits for travel hotspots.
From the perspective of time, the overall level of accessibility of freeway entrances and exits is highest during the OPEP and the lowest during the EPP.

6. Conclusions

Accessibility to an external freeway network from an urban road network is important, especially for outbound transportation of the city. However, although a large number of studies has explored accessibility from various perspectives, few accessibility analyses of urban road-to-freeway interchanges have been reported. To fill this research gap, this paper presents a dynamic accessibility analysis of urban road-to-freeway interchanges based on navigation map path data, which reflect the accessibility of the freeway network by analyzing the accessibility of urban road-to-freeway interchanges (i.e., freeway entrances and exits). It can help cities measure their dynamic accessibility for people in the city using the freeway resources and support decision making on where to improve accessibility and for which travel hotspots in the city. The methodology proposed in this study uses the data from the navigation map path, which has the characteristics of easy availability. Besides the travel time, travel distance and the number of traffic lights are both considered in the travel impedance model. The central urban area of Zhengzhou city is taken as the case study. Dynamic accessibility of 17 travel hotspots in the city for 26 outer freeway entrances and exits are analyzed. Four different periods are selected: MPP, OPAP, EPP, and OPEP. It is found that accessibility varies over time. Furthermore, the accessibility of Erqi District is always at the lowest level. As the central area of the city, Erqi District has greater travel demand, which influences the traffic condition and further the accessibility of the freeway network. During off-peak periods, the accessibility of the westward area is lower than that of the eastward area, which is because Zhengdong New District is a newly developed area, the urban road networks and traffic facilities of which are better.
However, there are still limitations in this study, which motivates future research directions. First, there is a limitation pertaining to the sample size used in this study, which is just large enough to yield reliable results and capture some medium effects. It may be necessary to collect data from a much larger sample in future studies. Second, further studies can be carried out about using AHP (analytic hierarchy process) or other MCDM (multi-criteria decision making) techniques to determine the weight coefficients. Third, building the model for simulation, including for example other freeways, weather, and connecting restrictions connected with collisions and required speed reductions, also can be combined for accessibility analysis. Moreover, there is currently no literature on dynamic accessibility considering travelers’ preferences, which can be important future work for us to do. Finally, based on the methodology framework proposed in this study, it is not difficult to further extend this study by adding relevant factors that consider demand and different travel modes (e.g., public transport users or other mobility sharing services), which is regarded as our important future work.

Author Contributions

Conceptualization, D.W.; methodology, Y.Y.; validation and writing, T.G.; writing and review, Y.Y. All authors have read and agreed to the published version of the manuscript.

Funding

There is no external funding.

Institutional Review Board Statement

Not applicable.

Informed Consent Statement

Not applicable.

Data Availability Statement

Data can be provided upon request from the corresponding author.

Acknowledgments

This research was supported by the National Natural Science Foundation of China (No. 51678535), the Youth Talent Support Program of High-Level Talents Special Support Plan in Henan Province, and the Foundation for University Young Key Teacher by Henan Province (No. 2018GGJS004).

Conflicts of Interest

The authors declare no conflict of interest.

References

  1. Stamatiadis, N.; Kirk, A.; Hartman, D.; Jasper, J.; Wright, S.; King, M.; Chellman, R. An Expanded Functional Classification System for Highways and Streets. In NCHRP Research Report; National Academy of Sciences, Engineering, and Medicine: Washington, DC, USA, 2017. [Google Scholar]
  2. García-Albertos, P.; Picornell, M.; Salas-Olmedo, M.H.; Gutiérrez, J. Exploring the potential of mobile phone records and online route planners for dynamic accessibility analysis. Transp. Res. Part A Policy Pr. 2019, 125, 294–307. [Google Scholar] [CrossRef]
  3. Shi, Y.; Blainey, S.P.; Sun, C.; Jing, P. A literature review on accessibility using bibliometric analysis techniques. J. Transp. Geogr. 2020, 87, 102810. [Google Scholar] [CrossRef]
  4. Xia, N.; Cheng, L.; Chen, S.; Wei, X.; Zong, W.; Li, M. Accessibility based on Gravity-Radiation model and Google Maps API: A case study in Australia. J. Transp. Geogr. 2018, 72, 178–190. [Google Scholar] [CrossRef]
  5. Ministry Housing and Urban-Rural Development of the China. Standard for Urban Comprehensive Transport System Planning (GB/T 51328-2018); Ministry Housing and Urban-Rural Development of the China: Beijing, China, 2018. [Google Scholar]
  6. Ray, B.L.; Schoen, J.; Jenior, P.; Knudsen, J.; Porter, R.J.; Leisch, J.P.; Mason, J.; Roess, R. Guidelines for Ramp and Interchange Spacing. In NCHRP Report; National Academies of Sciences, Engineering, and Medicine, Transportation Research Board: Washington, DC, USA, 2011. [Google Scholar]
  7. Páez, A.; Scott, D.M.; Morency, C. Measuring accessibility: Positive and normative implementations of various accessibility in-dicators. J. Transp. Geogr. 2012, 25, 141–153. [Google Scholar] [CrossRef]
  8. Van Wee, B. Accessible accessibility research challenges. J. Transp. Geogr. 2016, 51, 9–16. [Google Scholar] [CrossRef] [Green Version]
  9. Witlox, F. Beyond the Data Smog. Transp. Rev. 2015, 35, 245–249. [Google Scholar] [CrossRef]
  10. Bertolini, L.; Le Clercq, F.; Kapoen, L. Sustainable accessibility: A conceptual framework to integrate transport and land use plan-making. Two test-applications in the Netherlands and a reflection on the way forward. Transp. Policy 2005, 12, 207–220. [Google Scholar] [CrossRef]
  11. Tyrinopoulos, Y.; Antoniou, C. Public transit user satisfaction: Variability and policy implications. Transp. Policy 2008, 15, 260–272. [Google Scholar] [CrossRef]
  12. Geurs, K.T.; van Wee, B. Accessibility evaluation of land-use and transport strategies: Review and research directions. J. Transp. Geogr. 2004, 12, 127–140. [Google Scholar] [CrossRef]
  13. Handy, S.L.; A Niemeier, D. Measuring Accessibility: An Exploration of Issues and Alternatives. Environ. Plan. A Econ. Space 1997, 29, 1175–1194. [Google Scholar] [CrossRef]
  14. Zhou, X.; Ding, Y.; Wu, C.; Huang, J.; Hu, C. Measuring the Spatial Allocation Rationality of Service Facilities of Residential Areas Based on Internet Map and Location-Based Service Data. Sustainability 2019, 11, 1337. [Google Scholar] [CrossRef] [Green Version]
  15. Rong, P.; Zheng, Z.; Kwan, M.-P.; Qin, Y. Evaluation of the spatial equity of medical facilities based on improved potential model and map service API: A case study in Zhengzhou, China. Appl. Geogr. 2020, 119, 102192. [Google Scholar] [CrossRef]
  16. Foth, N.; Manaugh, K.; El-Geneidy, A.M. Towards equitable transit: Examining transit accessibility and social need in Toronto, Canada, 1996–2006. J. Transp. Geogr. 2013, 29, 1–10. [Google Scholar] [CrossRef]
  17. Weiss, D.J.; Nelson, A.; Gibson, H.S.; Temperley, W.; Peedell, S.; Lieber, A.; Hancher, M.; Poyart, E.; Belchior, S.; Fullman, N.; et al. A global map of travel time to cities to assess inequalities in accessibility in 2015. Nat. Cell Biol. 2018, 553, 333–336. [Google Scholar] [CrossRef]
  18. Beria, P.; Debernardi, A.; Ferrara, E. Measuring the long-distance accessibility of Italian cities. J. Transp. Geogr. 2017, 62, 66–79. [Google Scholar] [CrossRef]
  19. Guan, J.; Zhang, K.; Shen, Q.; He, Y. Dynamic Modal Accessibility Gap: Measurement and Application Using Travel Routes Data. Transp. Res. Part. D: Transp. Environ. 2020, 81, 102272. [Google Scholar] [CrossRef]
  20. Zhu, Y.J.; Hu, Y.J.; Collins, J.M. Estimating road network accessibility during a hurricane evacuation: A case study of hurricane Irma in Florida. Transp. Res. Part D Transp. Environ. 2020, 83, 102334. [Google Scholar] [CrossRef]
  21. Pritchard, J.P.; Tomasiello, D.B.; Giannotti, M.; Geursa, K. Potential impacts of bike-and-ride on job accessibility and spatial equity in São Paulo, Brazil. Transp. Res. Part A 2019, 121, 386–400. [Google Scholar] [CrossRef]
  22. Meire, S.; Derudder, B. A bimodal accessibility analysis of Australia through application programming interfaces. Transp. A: Transp. Sci. 2020, 16, 695–715. [Google Scholar] [CrossRef]
  23. Levinson, D.; Harder, K.; Bloomfield, J.; Winiarczyk, K. Weighting waiting: Evaluating the perception of in-vehicle travel time under moving and stopped conditions. Transp. Res. Rec. 2004, 1898, 61–68. [Google Scholar] [CrossRef] [Green Version]
  24. Malta, L.; Miyajima, C.; Kitaoka, N.; Takeda, K. Analysis of real-world driver’s frustration. IEEE T. Intell. Transp. 2011, 12, 109–118. [Google Scholar] [CrossRef]
  25. Saxena, N.; Rashidi, T.H.; Dixit, V.; Waller, S.T. Modelling the route choice behaviour under stop-&-go traffic for different car driver segments. Transp. Res. Part A Policy Pr. 2019, 119, 62–72. [Google Scholar] [CrossRef]
  26. Fosgerau, M.; Frejinger, E.; Karlstrom, A. A link based network route choice model with unrestricted choice set. Transp. Res. Part B Methodol. 2013, 56, 70–80. [Google Scholar] [CrossRef] [Green Version]
Figure 1. Navigation usage.
Sustainability 13 00372 g001
Figure 2. Factors for short-distance travel.
Sustainability 13 00372 g002
Figure 3. Factors for medium-distance travel.
Sustainability 13 00372 g003
Figure 4. Factors for long-distance travel.
Sustainability 13 00372 g004
Figure 5. Recommended travel path and information in the navigation app.
Sustainability 13 00372 g005
Figure 6. Result of travelers’ preference for time and distance.
Sustainability 13 00372 g006
Figure 7. Zhengzhou ring freeway.
Sustainability 13 00372 g007
Figure 8. Illustration of the freeway entrance and exit (East 3rd Ring Road North Station).
Sustainability 13 00372 g008
Figure 9. Study area and travel hotspots distribution.
Sustainability 13 00372 g009
Figure 10. The distribution of freeway entrances and exits and travel hotspots.
Sustainability 13 00372 g010
Figure 11. Average comprehensive travel impedance of each travel hotspot in four periods.
Sustainability 13 00372 g011
Figure 12. Three-dimensional distribution of average comprehensive travel impedance in central urban area of Zhengzhou.
Sustainability 13 00372 g012aSustainability 13 00372 g012b
Figure 13. Hierarchical distribution of accessibility values of each travel hotspot.
Sustainability 13 00372 g013aSustainability 13 00372 g013b
Figure 14. Statistical values of accessibility level.
Sustainability 13 00372 g014
Table 1. Impedance functions in some existing studies.
Existing StudiesImpedance Function
[2]Travel time t i j
[18]Exponential distance decay function j = 1 n M j e β x i j
[19]Travel time
[20]Network distance d i j
[21]Negative exponential distance decay function e α t i j
Table 2. Freeway entrances and exits.
Freeways that form the Ring FreewayEntrances and Exits on the Freeway
Zhengzhou Ring ExpresswayLotus Street; Science Avenue; Zhengshang Road; Zhongyuan West Road; Longhai West Road; Zhengmi Road; University South Road; Beijing–Guangzhou Freeway; Zheng Xin Freeway; East 3rd Circle Road
Zhengshao FreewayZheng Shao Freeway–Navigation Road connection Line
Zhengluan FreewaySouth section of Songshan South Road
Airport FreewayZhongzhou Avenue; Navigation East Road; South 3rd Circle Road
Beijing–Hong Kong–Macao FreewaySouth 3rd Circle Road; Navigation East Road; Longhai Freeway; Zhengkai Avenue
Lianhuo FreewayEast 3rd Circle Road North; Zhongzhou Avenue; Garden North Road; Cultural North Road; Beijing–Guangzhou Freeway; West 3rd Circle Road; West 4th Circle Road
Table 3. Information about travel hotspots.
Travel HotspotAbbreviationLocation (km, km)
Erqi Square Main CenterEQMC(18.5, 12.3)
Zhengdong New District Main CenterZDMC(24.5, 13.4)
East Station SubcenterESSC(28.7, 12.4)
Longhu SubcenterLHSC(24.8, 18.1)
Futa SubcenterFTSC(24.4, 8.2)
Bishagang SubcenterBSGSC(15.4, 11.3)
Huayuan Road SubcenterHYSC(19.9, 15.0)
Zhengzhou South Passenger StationSPS(17.9, 5.2)
Zhengzhou Railway StationRS(17.6, 10.9)
Centroid point of Huiji DistrictCPHJ(15.6, 26.3)
Centroid point of Gaoxin DistrictCPGX(7.0, 18.5)
Centroid point of Jinshui DistrictCPJS(19.2, 20.0)
Centroid point of Zhengdong New DistrictCPZD(32.7, 16.0)
Centroid point of Zhongyuan DistrictCPZY(8.2, 11.0)
Centroid point of Erqi DistrictCPEQ(12.0, 2.9)
Centroid point of Guancheng DistrictCPGC(23.7, 3.9)
Centroid point of Jingkai DistrictCPJK(33.6, 4.2)
Table 4. Accessibility levels.
LevelAccessibility Value
Very HighA ≥ 1.8
High1.6 ≤ A < 1.8
Medium1.4 ≤ A < 1.6
Low1.2 ≤ A < 1.4
Very LowA < 1.2
Publisher’s Note: MDPI stays neutral with regard to jurisdictional claims in published maps and institutional affiliations.

