Article

Exploring EU’s Regional Potential in Low-Carbon Technologies
1
Department of Economics and Statistics, University of Turin & Collegio Carlo Alberto, Piazza Arbarello 8, 10122 Turin, Italy
2
Bruegel, Rue de la Charité 33, B-1210 Brussels, Belgium
*
Author to whom correspondence should be addressed.
Sustainability 2021, 13(1), 32; https://doi.org/10.3390/su13010032
Submission received: 10 September 2020 / Revised: 23 November 2020 / Accepted: 16 December 2020 / Published: 22 December 2020
(This article belongs to the Special Issue Economic Complexity and Sustainability)

Abstract

:
This research builds on the regional innovation literature, and aims to better understand the potential for, and development of, low-carbon technologies in the European Union. Exploiting the OECD’s REGPAT for regionalised patent data, we estimate the potential advantage of European NUTS2 regions have in 14 green technologies. We use network proximity between technologies and between regions to understand technological/regional clusters of revealed technological advantage and build the regressors for estimating regional potential advantage in specific technologies via zero-inflated beta regressions. Based on this, we explore the region-technology networks, finding two gravity centres for green innovation in France’s and Germany’s industrial and high-tech hubs (Île de France, Stuttgart, and Oberbayern). We also construct a dataset of lagged potentials and labour market, economic and demographic variables, and perform an elastic net regularisation to understand the association with current revealed advantages. Our approach indicates an association between technological advantage in green technologies and the (lags of) participation rates in labour markets, sectoral employment in science and technology, general higher education, duration of employment, percentage of GDP spent on R&D (public and private) and other expenditure on R&D. If confirmed by causality tests, the established associations could help in designing horizontal economic policies to enable specific regions to realise their specialisation potential in specific green technologies.

1. Introduction

Keeping the global temperature increase below 2 °C above pre-industrial levels will require the almost complete decarbonisation of our energy system early in the second half of this century. This will require a growing and diverse deployment of low-carbon technologies (including vehicles, power plants, appliances, and batteries), which will replace the existing stock of high-carbon technologies. Regions with strong climate policies—such as the EU—will become pilot markets for low-carbon technologies. However, being a pilot market does not automatically translate into a competitive edge in the new technologies, as the limited success of photovoltaic cell production in Europe shows. To enable domestic companies to flourish in these new sectors, policymakers seek to complement the creation of early markets for decarbonisation technologies with some form of industrial policy.
While some works have focused on specific country-sectors as candidates for industrial policy exercises (Huberty and Zachmann, 2011) [1], other contributions exploited the product space (Hidalgo et al., 2007) [2] methodology to infer information from the most promising sectors and products from complexity-grounded statistics. Our work builds in this direction, focusing on the green product space (Hamwey et al. 2013) [3]. Compared to other works exploiting these methodologies, we focus on technological specialisation rather than export specialisation, using patent data for this analysis.
We argue that not all regions have the potential to excel in all green technologies, and that a fundamental characteristic of green industrial policies should be the consideration and inclusion of a tailored regional dimension. Our analysis relies on systematic evidence originating from the complexity-based literature triggered by Hidalgo and Hausmann (2009) [4] and builds on the analytical approaches in patent analysis for low-carbon technologies based on similar regions’ current advantages. These techniques yield a more systematic approach to understanding the potential benefits from diversification, and complementary information with respect to qualitative studies focusing on specific case studies. In terms of informing policies aimed at directing structural change and achieving (green) economic growth, the economic complexity framework has proved useful to identify “low-hanging” opportunities for product development and market expansion. Industrial policies aim to foster industrial competitiveness, new products development, and innovation, taking “strategic bets” Fraccascia et al. (2018) [5] on which low-carbon products and technologies to develop. Understanding how related some particular green technology is to the knowledge base in a region, and uncovering latent factors underlying technological specialisation, might inform policymakers in taking these strategic bets.
The literature that builds on these theoretical frameworks and empirical approaches has advanced the European efforts to pursue so-called Smart Specialisation Strategies (Foray et al., 2011) [6]. Based on empirical work on geographically granular data, these analyses identify competitive advantages in terms of regions’ knowledge bases, labour markets, geographical characteristics or industrial structures, and provide guidelines for diversification opportunities at regional level. The idea is that regions can build on local characteristics in order to branch out into producing what is more related to their existing economic structures (Balland et al., 2019) [7].
The “green guidance” from European and national policymakers steers policymakers and market players in finding opportunities for development in the low-carbon economy. The S3 strategies should inform, in turn, regional governments about their potential in the green economy landscape, with a data- and evidence-driven approach, able to extract insights both from observed and latent characteristics. The investments from the European budget for industrial policy, from the European Structural Investment Funds (ESIF) and the innovation programmes (Horizon Europe), are now targeted at projects in line with the S3 framework (Crespo et al., 2017) [8]. In the context of recent European initiatives such as the European Green Deal, tailored green industrial policies assume an even greater importance. The architecture of the European Green Deal, arguably a green industrial policy initiative, has regional components, such as ESIF or the Just Transition Funds (JTF), built on top of the Cohesion Policy framework.
In this context, we contribute to the understanding of the innovation landscape, particularly in low-carbon technologies, and with a high degree of resolution. The (green) product space approach does not substitute industrial policy empirical work and shall be complemented by the causal evaluation of policies using firm-level data. While there are many dimensions that it fails to capture, it is systematic, easy to communicate, and somewhat intuitive. In this paper, we build on the literature and adapt the notion of green product space (Hamwey, 2013) [3] to that of green technological space (Zachmann and Roth, 2018) [9] building on patents data only. Related works (Fraccascia et al. 2017; Mealy and Teytelboyom, 2020) [10], focus on exports at the country-sector dimension, while we work on innovation at the regional level.
Several works have addressed similar questions about regional green innovations. Van den Berge and Weterings (2014) [11] explored the potential for regions to diversify in eco-technologies. They found that in regions in which the knowledge base was previously characterised by the presence of green innovations, the likelihood of developing new technologies is greater. Montresor and Quatraro (2019) [12] also explore the role of relatedness in green technology in a regional context, finding that the relatedness of the existing knowledge base with green technologies can facilitate specialisation in the latter.
Balland et al. (2019) [7] looked at the relatedness and complexity figures using a network approach, estimating the figures for all European regions based on network techniques, linking regions to technologies. This study made policy recommendations based on the position of each region in terms of opportunities and risks, depending on the level of aggregate relatedness and complexity of the regional production structure. Zachmann and Roth (2018) [9] used a similar approach at the national level, specifically focusing on innovation in low-carbon technologies. Our contribution, firstly, mixes the two approaches, by bringing the network-based estimates for potential at the regional level. We employ the regression-based forecasting technique in Zachmann and Roth (2018) [9], to estimate future potential advantage at the regional level, and we focus specifically on low-carbon technologies.
Our empirical work builds on the idea of related diversification (Boschma and Frenken, 2011) [13]: comparative regional advantages in specific green technologies and sectors can be built on top of existing strengths in related technologies and sectors. Accordingly, the first step in our analysis is to identify regional green technology potential based on the relatedness to green technologies of current regional comparative advantages. To identify potential advantages, we refer to the framework conceptualised in Hausmann et al. (2019) [14], building on the regression-based forecasting technique in Zachmann and Roth (2018) [9], to estimate future potential advantage at the regional level, and we focus specifically on green technologies. Similarly, to the work of Mealy and Teytelboyom (2020) [10], our approach is grounded in complexity-based methodologies aiming at shedding light onto promising low-carbon technologies (rather than products), at a regional granularity.
The second step in our analysis focuses on identifying policies that can help to realise the regional potential in low-carbon technologies. A growing body of empirical literature is studying the policy relevance of Smart Specialisation and regional innovation. Boschma and Gianelle (2013) [15] argued that an experienced entrepreneurial base, labour mobility across related industries, and inter-regional collaboration are factors for success in the diversification process. Santoalha and Boschma (2020) [16] confirmed that the presence of green-related capabilities in a region, and political support for green development at the regional level, can foster innovation. Crespo et al. (2017) [8], explained how “developing new growth paths in related industries or technological domains increases the probability of regional competitive advantage because the shorter cognitive distance enhances mutual learning, knowledge spillovers and actors’ redeployment of skills from one domain to another.” Dordmond et al. (2020) [17] investigate the labour market direction of technological change, building a systematic indicator of job “greenness”. Exploring the product and occupational spaces (Shutters et al. 2015) [18] find that regional economic complexity and the greenness of jobs are associated.
Similarly, in the second stage of our research, we investigate observed regional characteristics, from labour markets to policy and institutional aspects, which might make it easier for regions to realise the potential technological advantage. We use an exploratory approach, rather than a causal econometric model, and a novel dataset to do so. We essentially ask: which labour market, economic and demographic conditions are associated, together with a potential specialisation in the past, with a stronger relative technological advantage in the present? Hence, our analysis is based on a two-stage approach in which we first estimate the potential and revealed green specialisation, and subsequently select labour market, demographic and economic variables that are associated with it.
The paper proceeds as follows: Section 2 explains the data sources used, and details our methodology for each of the two research questions we introduced. We build an empirical strategy to estimate regional technological advantage and use a network and regression-based technique to estimate potential advantage. In a second stage, we use selection algorithms, to perform a data-driven selection of socio-economic variables associated with RTA in green technologies. In Section 3, we discuss limitations and results coming from the network analysis, the estimates of potential advantage, and the socio-economic factors selected in this approach. We conclude by discussing possible policy implications.

2. Methodology and Data

2.1. Estimating Potential Advantage in Green Technologies

In this section we outline our methodological approach, which can be divided into two stages, corresponding to the two research questions. First, we estimate the technological advantage of regions in specific technologies, and later use these indicators as regressors in a dimensionality reduction. Section 2.2 details the methodology of the latter exercise. In the first part, we largely build on the previous work of Zachmann and Roth (2018) [9]. In a nutshell, this approach exploits the information about the current technological structure of an economy (the product space), as regressors to understand the future potential in related technologies. They focus on the relatedness between technological structure and green technologies. We will detail further this methodology: overall, compared to their work, at the country-level, here we will reproduce it on the regional NUTS2 level, and in a longer time dimension.
We measure regional innovation with patent activity. Patents are not only an indicator for the technological specialization but also a proxy for the sectoral specialisation of regional economies. The PATSTAT database is the go-to resource for patent statistics. The advantages of these data are that it contains very granular information, comprehending the full patents texts, as well as inventor-level data. However, a well-known issue in the use of PATSTAT for geographical analysis is that of missing information, especially at a granularity lower than the national level.
Thus, we exploit the OECD’s REGPAT database, a plugin for the PATSTAT database with enhanced geocoding, providing information consistently geocoded at the regional level. The number of patients attributed to a region is based on the location of patent inventors that applied at the EPO or international patents under the Patent Cooperation Treaty (PCT). The earliest application of individual patent families is used and attributed in fractions to all inventor countries and technology codes. REGPAT contains patents listed under the Patent Cooperation Treaty (PCT) and the European Patent Office (EPO). We combine the patents from both sources, preferring EPO to PCT, by keeping the PCT entries only where the patent is not filed under both.
Patents are classified under very granular technological codes: CPC and IPC codes (Cooperative Patents Classification and International Patents Classification). To observe activity in a “green technology”, we group the granular codes in a tailored and broader definition of technology. We select the definition of low-carbon technologies based on the Joint Research Centre’s definition (Fiorini et al., 2017) [19]. CPC codes are grouped for 14 technologies, namely: solar panels, hydrogen-related technologies, solar and thermal energy, wind energy, hydro energy, energy management, efficient lighting, efficient heating and cooling, combustion, residential insulation, biofuels, batteries, electric cars, efficient rail transport, and nuclear energy. The list of relevant CPC-Y codes is provided in Table A1 of Appendix A. We use IPC definitions for all the technologies, and CPC-Y codes to group low-carbon technologies.
We start from simple patent counts, as a basis to derive Revealed Technological Advantage (RTA) statistics, calculating the relative specialisation in patents of a region, as a measure of innovation. This measure is based on the classic Revealed Comparative Advantage (RCA) measured à-la-Balassa. RCA is built on export, rather than patents data, and measures economic specialization of countries in international trade. In such a fashion, we derive the relative specialisation of regions in a particular technology. Formally, the revealed technological advantage in for a region is a fraction of two shares:
RTA =   x i l i x i l l x i l i , l x i l
where:
  • xil is the number of patents of technology i in region l
  • xil is the sum of patents of technology i across all regions
  • xil is the sum of all patents across all regions
The subsequent estimations, all the RTAs are generated while excluding green technologies from the sample. RTAs are, in turn, standardised in the following way:
sRTA =   R T A     1 R T A   +   1 + 1 2
where RTA is derived as in Equation (1). We structure the dataset in three non-overlapping three-years, sums of patent counts, from 2001 to 2016, to smooth out the volatility in patent activity. We repeat this exercise, only for this stage, also with a parallel five-year structure, as we will discuss in Section 3.1.
To estimate the potential technological advantage of regions (pRTA), we apply the methodology inspired by Hausmann et al. (2019) [14]. This methodology assumes a relationship between the comparative advantage of different products or technologies. For instance, a region’s comparative strength in one product can imply a potential strength in another product. This is because there can be a link, a similarity, either between the pair of products or between the pair of regions. The intuition behind potential advantage is the attempt to estimate correlations between regions and technologies that are based on latent factors that are unknown a priori. For example, the latent factors that make regions similar could be factor costs, infrastructures, geography, domestic market sizes. These correlations could also be based on technological links (e.g., similar value chains, technological spill-overs, degree of complexity).
To infer these relationships, we also build the RTA matrices in the other two levels of aggregation: at both the inventor and applicant level, which we exploit in later steps. Hence, in total, we build technology cross-tables for each time stack at four different levels: Country, NUTS2 region, inventor, application. We apply Equations (1) and (2) to the cross-tables and obtain RTAs. In turn, we build a matrix of product correlation ϕ i i and the region correlation matrix ϕ l l .
ϕ i i = 1 + c o r r R C A i , R C A i 2  
ϕ l l = 1 + c o r r R C A l , R C A l 2  
The region-correlation matrix ϕ l l measures the similarity between the two regions by expressing how strong the RTA-patterns of these two regions are associated with each other. The similarity between them will be higher, like the patenting activities—within the time-stack—are more similar. The product correlations, instead, will mirror this idea and measure the proximity between products, given how often regions patent in those same technologies. This idea reflects the mentioned concept of technological relatedness. We build the proximity matrices also at the inventor and applicant level.
As in Zachmann and Roth (2018) [9], we construct 18 different proximity networks, where proximity is measured differently. We borrow the definitions of the technological networks from two papers (Yan and Luo, 2017; Stellner, 2014) [20,21]. The methods applied include simple correlations, minimum pairwise conditional probabilities, class-to-class cosine similarity, class-to-patent cosine similarity, co-classification, co-occurrence to generate the networks on the four different aggregations, geographic (regions and countries) and personal (inventors and applicants).
At this stage, we obtain 18 different matrices of technology-region proximity measures, of 258 NUTS2 regions and 637 technology codes. In a final step, all the matrices are stacked vertically, to construct two column vectors of IPC class-regions pairs. The column vectors represent 18 weighted networks of technologies and regions (Hidalgo et al. 2007) [2]. These 18 networks are very collinear, and contain largely similar information, and summarize the latent and observed characteristics of the networks. We apply a Principal Component Analysis and reduce the dimensionality from 18 regressors to two Principal Components (as the first two Principal Components already explain more than 90% of the data). The correlation between the networks and the first principal component is, on average, higher than 0.93. The aforementioned steps, which bring the dataset from patent counts to principal components, are applied separately for all the different, non-overlapping time stacks, in which we originally divided REGPAT data.
At this stage, we can proceed with the estimation of potential advantage, using a regression-based technique as in Zachmann and Roth (2018) [9]. For our estimates, we make use of a zero-inflated Beta regression. The use of a zero-inflated model is necessary to model this information, which has been aggregated from largely sparse matrices (Ospina and Ferrari, 2012) [22]. The beta distribution can only take values in the range between zero and one, and models zero values. The zero-inflated beta regression takes the following functional form:
if   y = 0 : f y =   υ if   y = 0 ,   1 : f y | μ , σ = 1 υ Γ σ Γ μ σ Γ 1 μ σ y μ σ 1 y 1 μ σ 1
The parameter Γ . describes a gamma function, the parameters satisfy the following conditions: 0 < μ < 1 ,   σ > 0   and 0 < υ < 1 . The parameters μ and σ define the shape of the beta distribution, while υ defines the likelihood of value to be exactly zero. Given the structure of our data, column vectors obtained from largely sparse region-technology networks, it is extremely important to employ a zero-inflated model.
Our implementation uses RTA as an independent variable and utilises the first two principal components, obtained from the 18 networks, as regressors. We regress RTA values on the Principal Components in t, on t + 1 (Equation (6)). Once the β parameters of this model are estimated, we subsequently fit them on the matrices at t + 1 and obtain the predicted values for technological advantage for t + 2.
RTA t + 1 =   β 0 +   β 1   P C 1 t +   β 2   P C 2 t +   ε t
We rely on the R package GAMLSS and its function BEZI for the implementation. We repeat the same approach using linear regressions to have a baseline evaluation of our model. The zero-inflated beta regressions show a mean squared error of 0.05 compared to the baseline, and an average R2, for all the stacks, not higher than 0.35. The statistics, if compared to a similar previous paper by Zachmann and Roth (2018) [9] that performed a country-level analysis, exhibit a poorer performance of our regional models. We will discuss the implications and the possible ways to improve the models in Section 4.1.
The predicted data resulting from fitting the regressions will be at t + 2 and represents our estimate of potential technological advantage (pRTA). We repeat this implementation for all the time stacks and build a panel of RTA and pRTA values for all the low-carbon technologies. At this stage, the dataset solely relies on innovation measures, and information has been inferred from the technological structure of the regions and their latent factors. Section 3.1 will present the results of this methodology, and discuss findings of the potential regional advantage for green technologies. In the following section, we present our methodology for the second stage, which attempts at assessing which socio-economic variables are associated with the green innovation indicators estimated.

2.2. Dimensionality Reduction: A Data-Driven Selection of Variables that Associate with RTA

Our second research question, turns to which regional socio-economic factors could be associated with potential and revealed green innovation. We investigate this by making use of a large dataset of regional characteristics, and an exploratory approach. We begin with an agnostic view about what regional characteristics could be associated with RTA. First, we build a wide dataset at the NUTS2 level with all the variables present in the Eurostat database and in the Joint Research Centre’s Urban Data Platform. We perform an indiscriminate download of all the NUTS2-level variables present in these two sources, from all the domains possible. The time dimension in this panel corresponds to the same three-year non-overlapping period of the patents-based measures.
We merge the dataset with the patent-based estimates, with this wide dataset: each observation is at the time-stack and NUTS2 dimension. We argue that the resulting dataset, to our knowledge, is novel compared to previous literature. It matches regional innovation indicators, based on both revealed and potential measures of technological advantage, with a large number of socio-economic variables from recognised statistical sources. We purposefully build this dataset on a quite wide amount of potential regressors. As mentioned, our approach is agnostic: we aim at recognising patterns of association between green technological potential and socio-economic variables, without assuming which might affect it. Empirically, we rely on dimensionality reduction techniques.
On the left-hand side, we have measures for revealed advantage in a region, and the large number of regressors on the right-hand side, together with the potential technological advantage in the previous time-stack. We aim to observe, row-wise (hence, for each region r, at time t), the potential in that same technology at t − 1. We define RTA, an observed advantage for the low-carbon technology i in region r, at time t, as a function of all the right-hand side variables. In turn, the right-hand side is composed of vectors of independent variables at time t (first term), t − 1 (second term) and t − 2 (third term), as well as potential advantage for that same technology in t − 1 (Equation (7)).
RTA r , t , i =   β 0 +   β 1   x r , t , i +   β 2   x r , t 1 , i +   β 3   x r , t 2 , i   +   θ   pRTA r , t 1 , i
where:
  • r = 258 (NUTS2 regions)
  • i = Low-carbon technology
  • t = 3 years non overlapping time-stack
In order to isolate the relevant variables in the vector of right-hand side independent variables, we implement this specification using a regularisation technique. The two most common applications of regularisation regression are LASSO (Least Absolute Shrinkage and Selection Operator) and Ridge regressions. The intuition behind these techniques is to apply a penalty score to the magnitude of the coefficients of an OLS regression, maximising the relevant ones and shrinking the others to 0.
In the literature, there are two typical definitions of regularisation techniques: L1 and L2. The L1 type is known as Ridge regression, while L2 is known as LASSO regression. The main difference between the models is in the application of the ‘penalty factor’ to the cost function. LASSO regularisations can shrink coefficients all the way down to zero, performing a real variable selection. However, in presence of a large number of multicollinear variables, the selection of the feature is done randomly. This is the case, given our indiscriminate collection of data from the two databases, which in many cases (for example, unemployment) includes several different measures for the same variable. On the other hand, Ridge can handle the issue of multicollinearity without selecting variables at random, but performs poorly with a high number of dimensions. Elastic net regularisation (Zou and Hastie, 2005) [23] combines L1 and L2 approaches, overcoming the respective limitations. This method is more flexible to our purpose, being able to better handle the high multi-dimensionality and collinearity of our dataset.
Our approach presents a number of challenges, in terms of data availability. Data collection of regional statistics at the NUTS2 level, though improving, is highly inconsistent. As a result, many of the data sheets used to generate our dataset are incomplete in terms of time and location. As a consequence of the indiscriminate scraping and querying techniques used to generate it, the dataset is incomplete and highly multicollinear, containing several repeated and aggregated indicators. Proper utilization of NUTS2 regional statistics, especially in cases where full datasets are necessary, is therefore a challenge given such complications. Limitations will be discussed further in Section 4.1.
Regularisation techniques fail in the presence of missing data, making complete datasets necessary. Therefore, we choose to impute missing values before using any data-driven variable selection technique (see Appendix B for details on the imputation method). After using imputation to fill in the gaps without biasing the distributions of the variables, we apply elastic net regularisation to the dataset. To be able to assess which regional characteristics might be promising to engineer regional specialisation, we explore the relationship between current specialisation in green technologies on the one hand, and past potential specialisation and current and past regional characteristics on the other hand. As mentioned, we use an experimental approach and we do not seek to make any causal inference at this stage, but only to look at associations. Future research should encompass the role of implied green advantage causally, building on the economics of innovation literature.
In order to estimate the coefficients for the right-hand side, we first subset the panel to cross-sectional datasets based on the time stacks. We make use of the ElasticNetCV module of the Python library sklearn to perform the regularisation. The module allows an automatic choice of the L1-L2 ratio, influencing the weight given to each penalty factor, by feeding in an array of possible values. The L1-L2 ratio ranges from 0 to 1, and tells how skewed the model should be towards LASSO or Ridge. The array chosen is skewed towards the LASSO-type regression, including more values above 0.5 than below. The ElasticNetCV library optimises the parameter selection based on a typical 10-fold cross-validation approach. In the same fashion, the alpha level (overall magnitude of the penalty score) is also selected.
Figure 1 shows an example of the regularisation procedure for electric vehicles, for the 2012 and 2015 time-stacks. On the horizontal axis we plot the 110 coefficients estimated, and on the vertical axis their magnitude. The coefficient distancing from the others on the right-hand side is the potential technological advantage (pRTA) at t − 1. On the y-axis we represent the magnitude of the coefficients for the 2012 (in yellow), and for the 2015 (in blue) time stacks.
After applying the regularisation to each low-carbon technology, we obtain a list of significant variables. These variables are associated with RTA for a low-carbon technology, with non-zero coefficients (both negative and positive). We combine together a count of all the ‘surviving’ variables. Table A2 and Table A3 in the Appendix D present the results respectively for the 2012 and 2015 cross-sections. We provide a count of surviving variables at time t, t − 1 and t − 2, and in total. Potential advantages at t − 1 are found to be always the highest-ranking coefficients, and are omitted from the tables. As expected, the variables surviving more often are related to the presence of a highly-educated labour force, higher wages and people employed in scientific fields. We discuss these results in the next Section.
At this stage, the count of surviving variables is only based on the separate cross-sectional exercises. The panel structure is not exploited, as the cross-sections are considered separately. In order to observe time-varying effects of these variables, we demean the panel dataset, following a two-way fixed effects approach as in Imai and Kim (2018) [24]. However, unlike the two-way methodology, the panel is only demeaned for region-fixed effects.
We subtract from each variable the average value for that region over the year, on a region-time basis. Subsequently, we perform an elastic net regularisation, similar to the previous estimates, this time under the assumption of fixed effects estimation. We rely on the R library glinternet for this implementation. The results of the fixed effects regularisation are presented in Table A5 in the Appendix D. The R2 values yielding from this model are all lower than 0.5 percent, suggesting that the variation in RTA comes more from cross-sectional differences rather than time-varying effects. It is not possible to perform regularisations that include interaction terms, in this fixed effects setup, as explained by Giesselmann and Schmidt-Catran (2018) [25].

3. Results

3.1. The Geographical Dimension of Potential Advantage

We start by presenting the estimated RTAs and pRTAs for the different low-carbon technologies. We observe how certain low-carbon products show a pattern of strong concentration in few regions, such as Rhône-Alpes in France, Dresden and Stuttgart in Germany and Lombardy in Italy: well-known industrial districts and technological hubs.
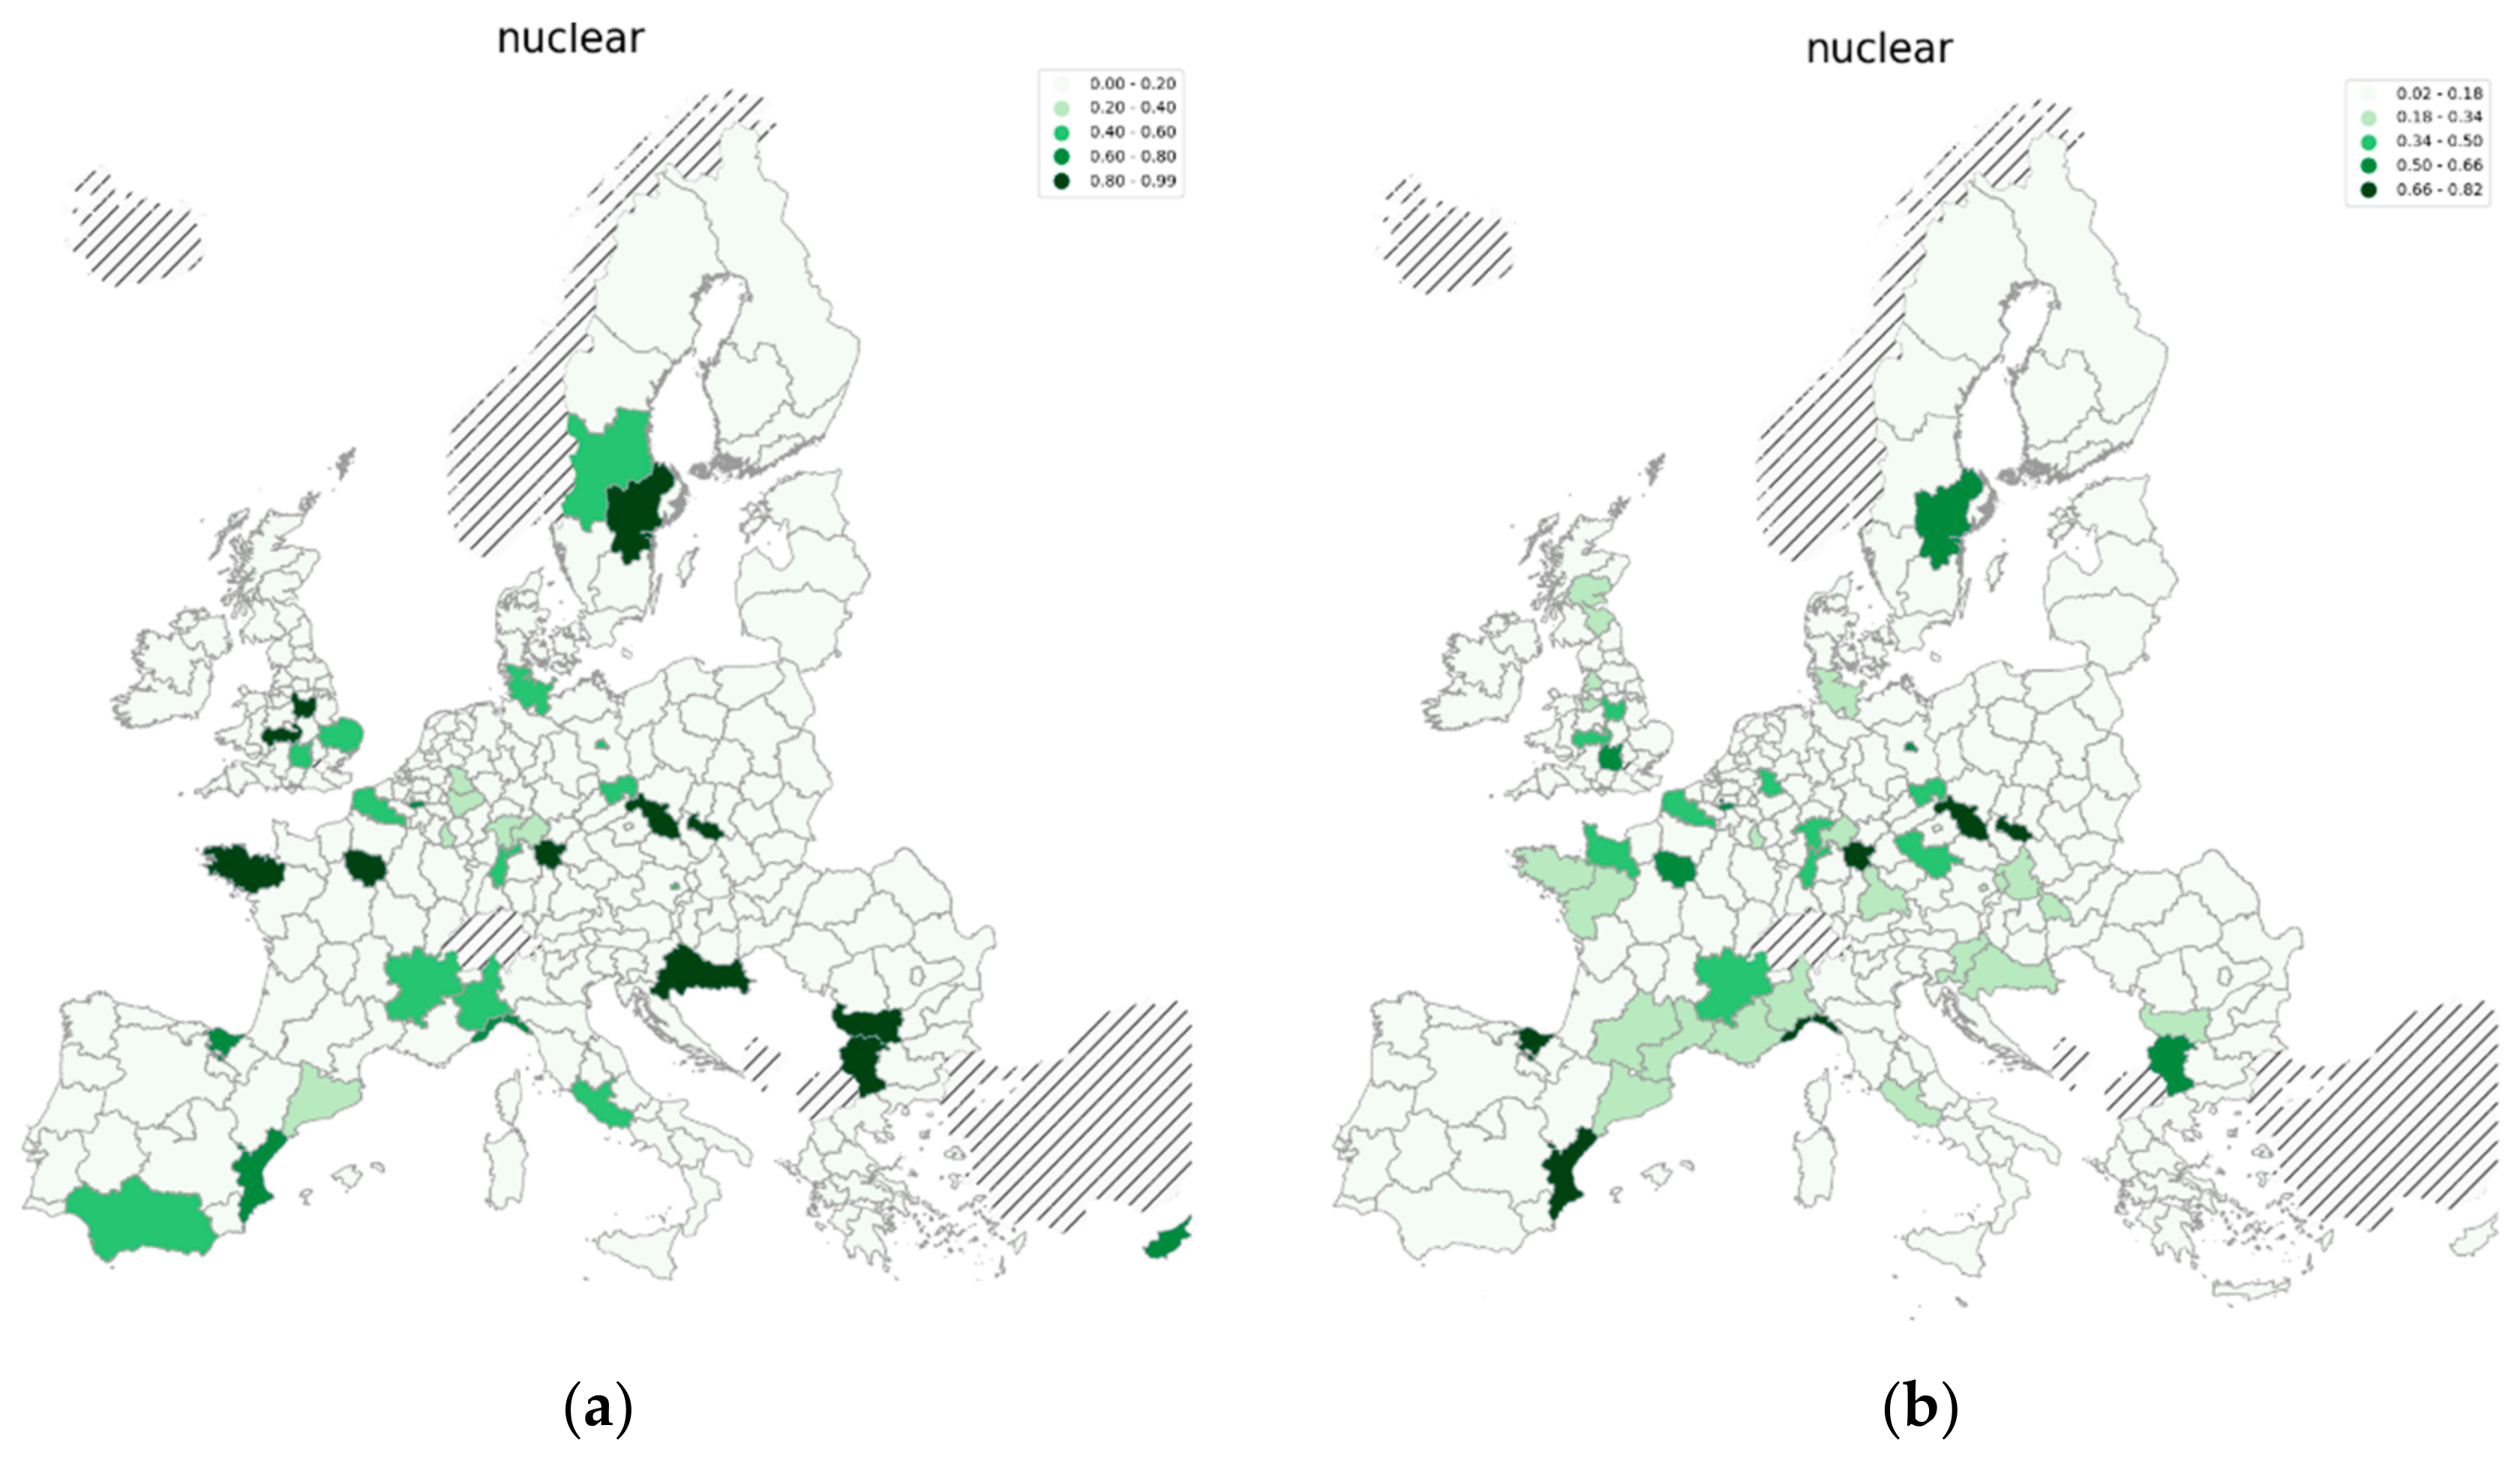
Over time, we observe a general increase in low-carbon technological advantage across Europe, although our measure of RTA seems to be quite volatile, despite the three-year aggregation of the original patent counts. At this stage, in fact, the trade-off is between the granularity of patent data at the regional level, the time dimension necessary to create a panel and our technological definitions. The necessity of defining peculiar groups of patents as “technologies”, combined with the sliced time dimension, spurs the volatility in patent activity, especially when observed as RTA. In terms of innovation specialisation, certain technologies, such as nuclear, remain exclusive to a smaller number of regions that are already strong in nuclear technology innovation, as shown in Figure 2. Other technologies, such as wind and hydropower, appear to be promising for many regions.
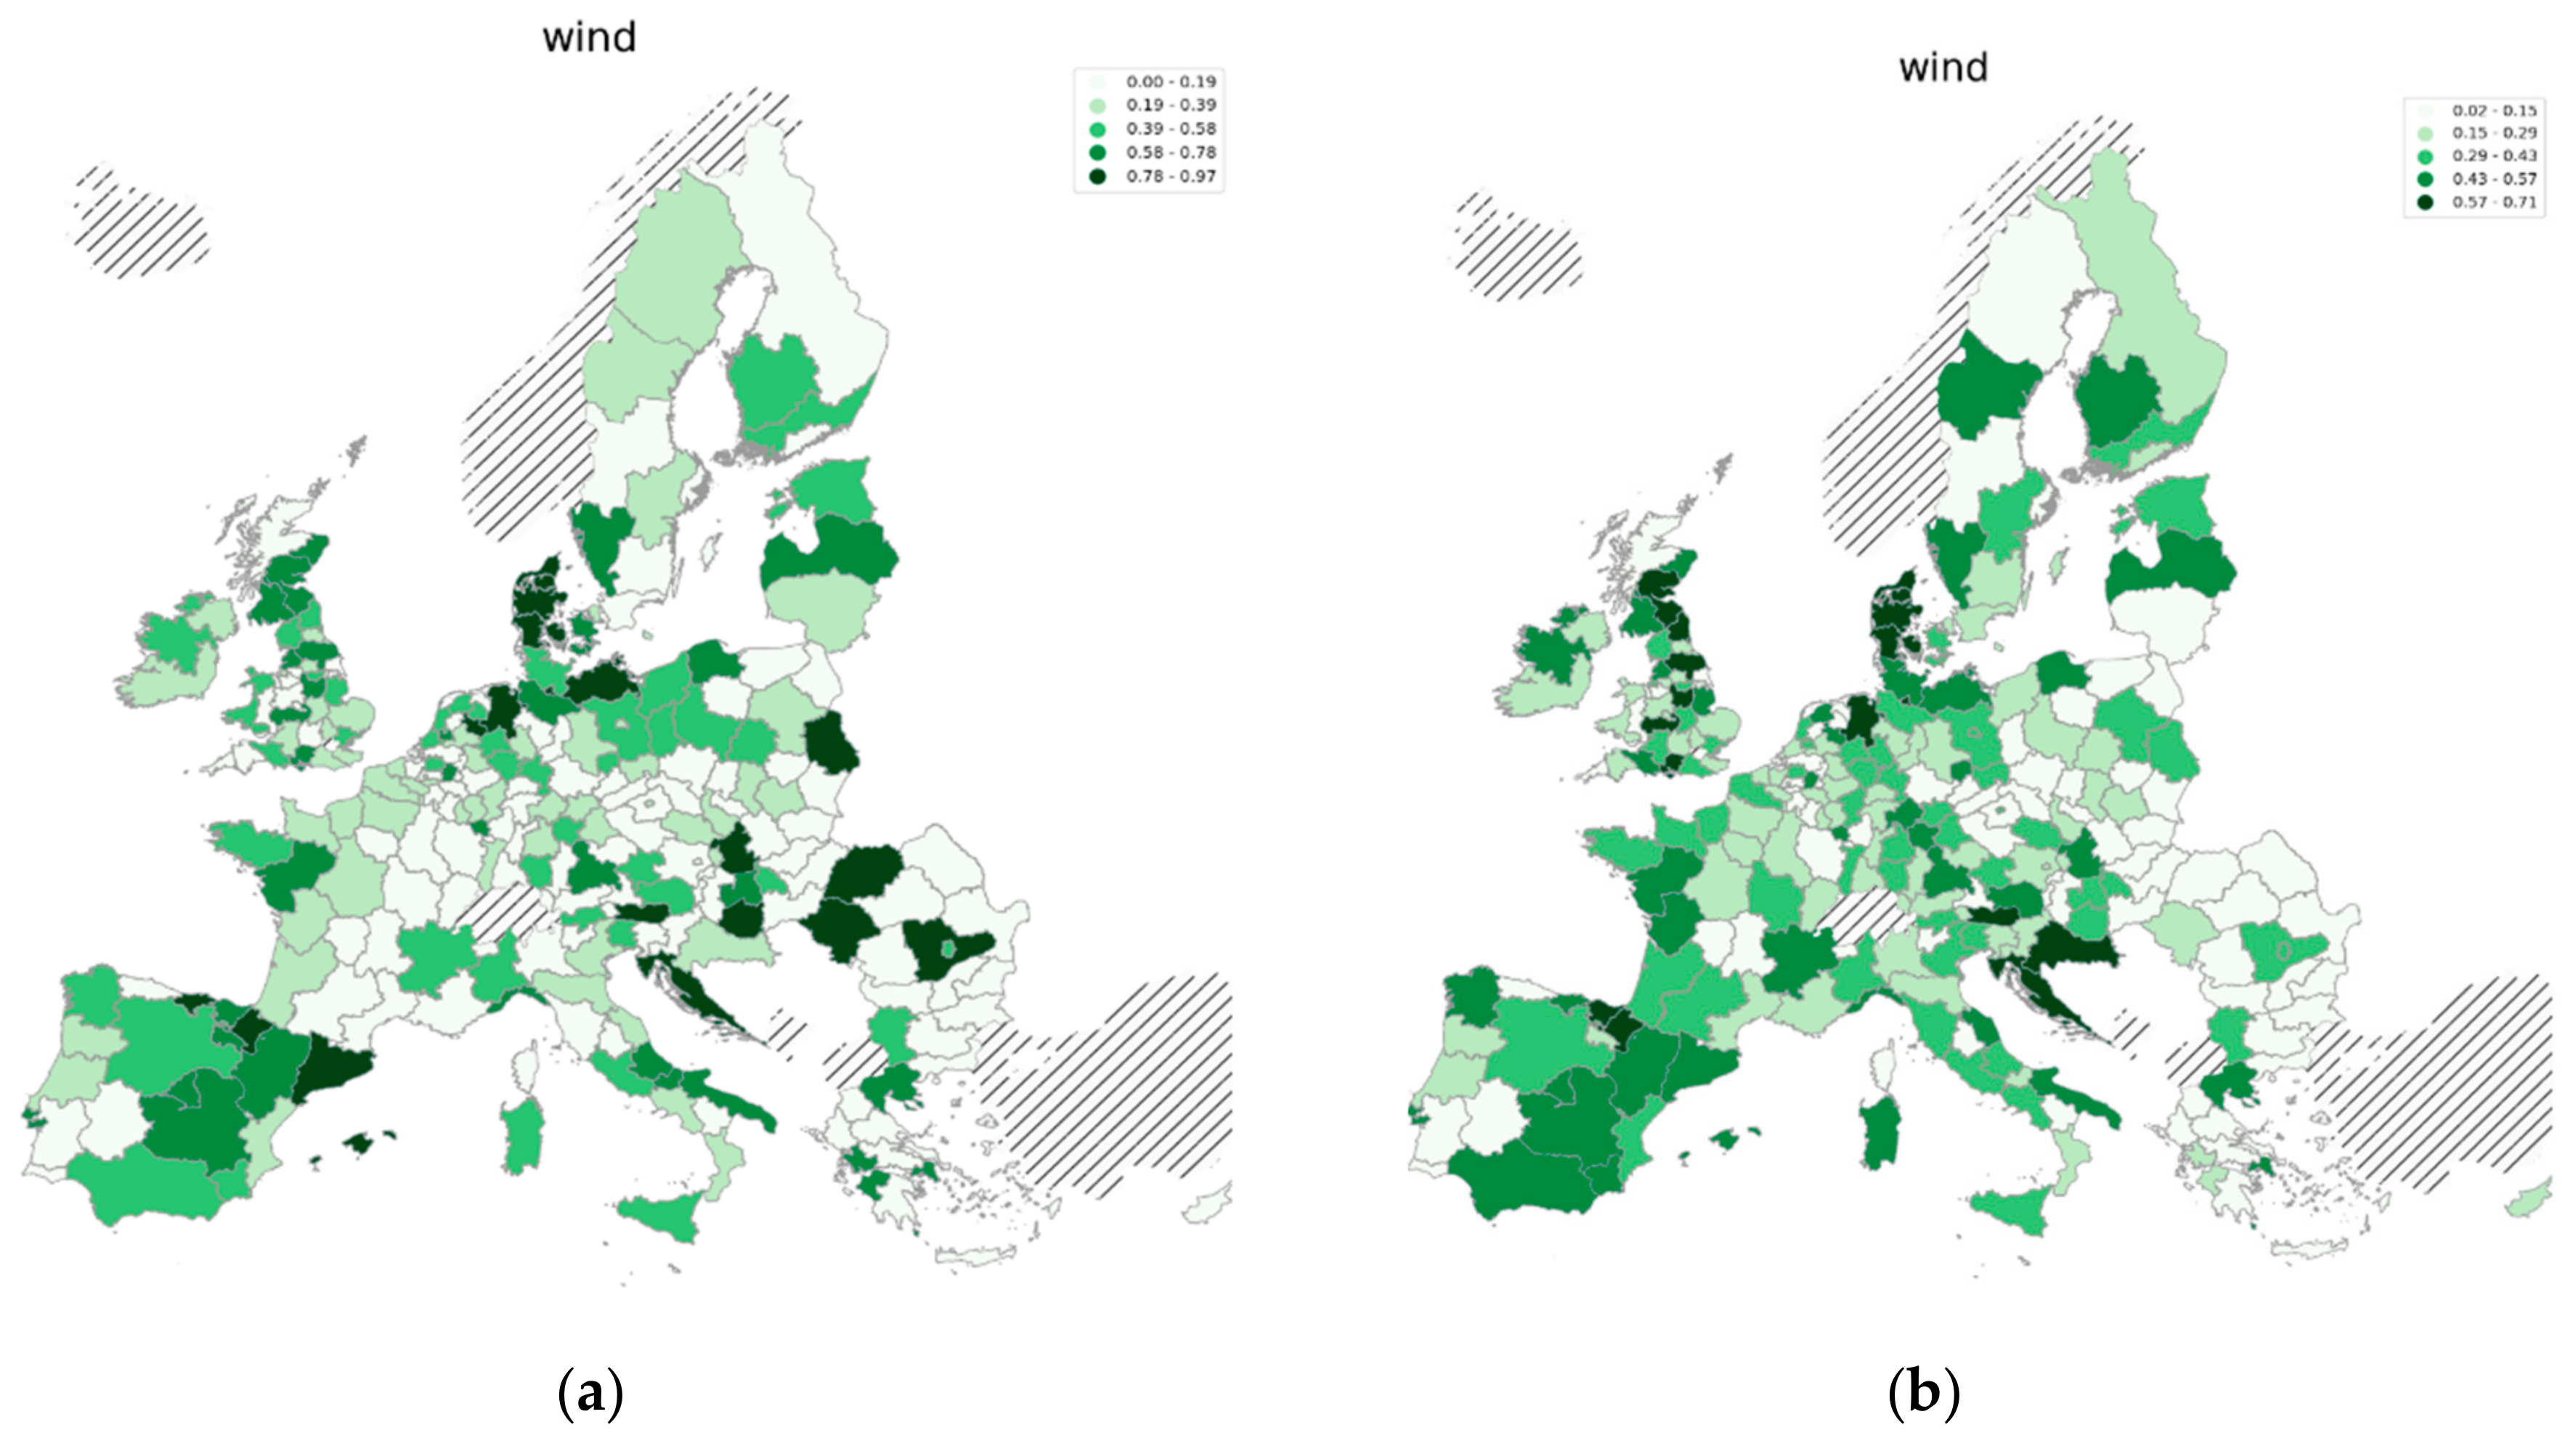
In Figure 3, it is possible to observe how wind-related technologies had similar geographical distribution for RTAs in 2013 as for potential RTAs for the successive period, 2019. Countries including Denmark, Germany and Spain have at least one region with some degree of specialisation in the wind that resulted in a country-level advantage in 2013. Some regions, instead, exhibit strong potential future advantage in wind, despite the only modest actual advantage in 2013. This is the case across Scotland or the Pays de la Loire in the north-west of France.
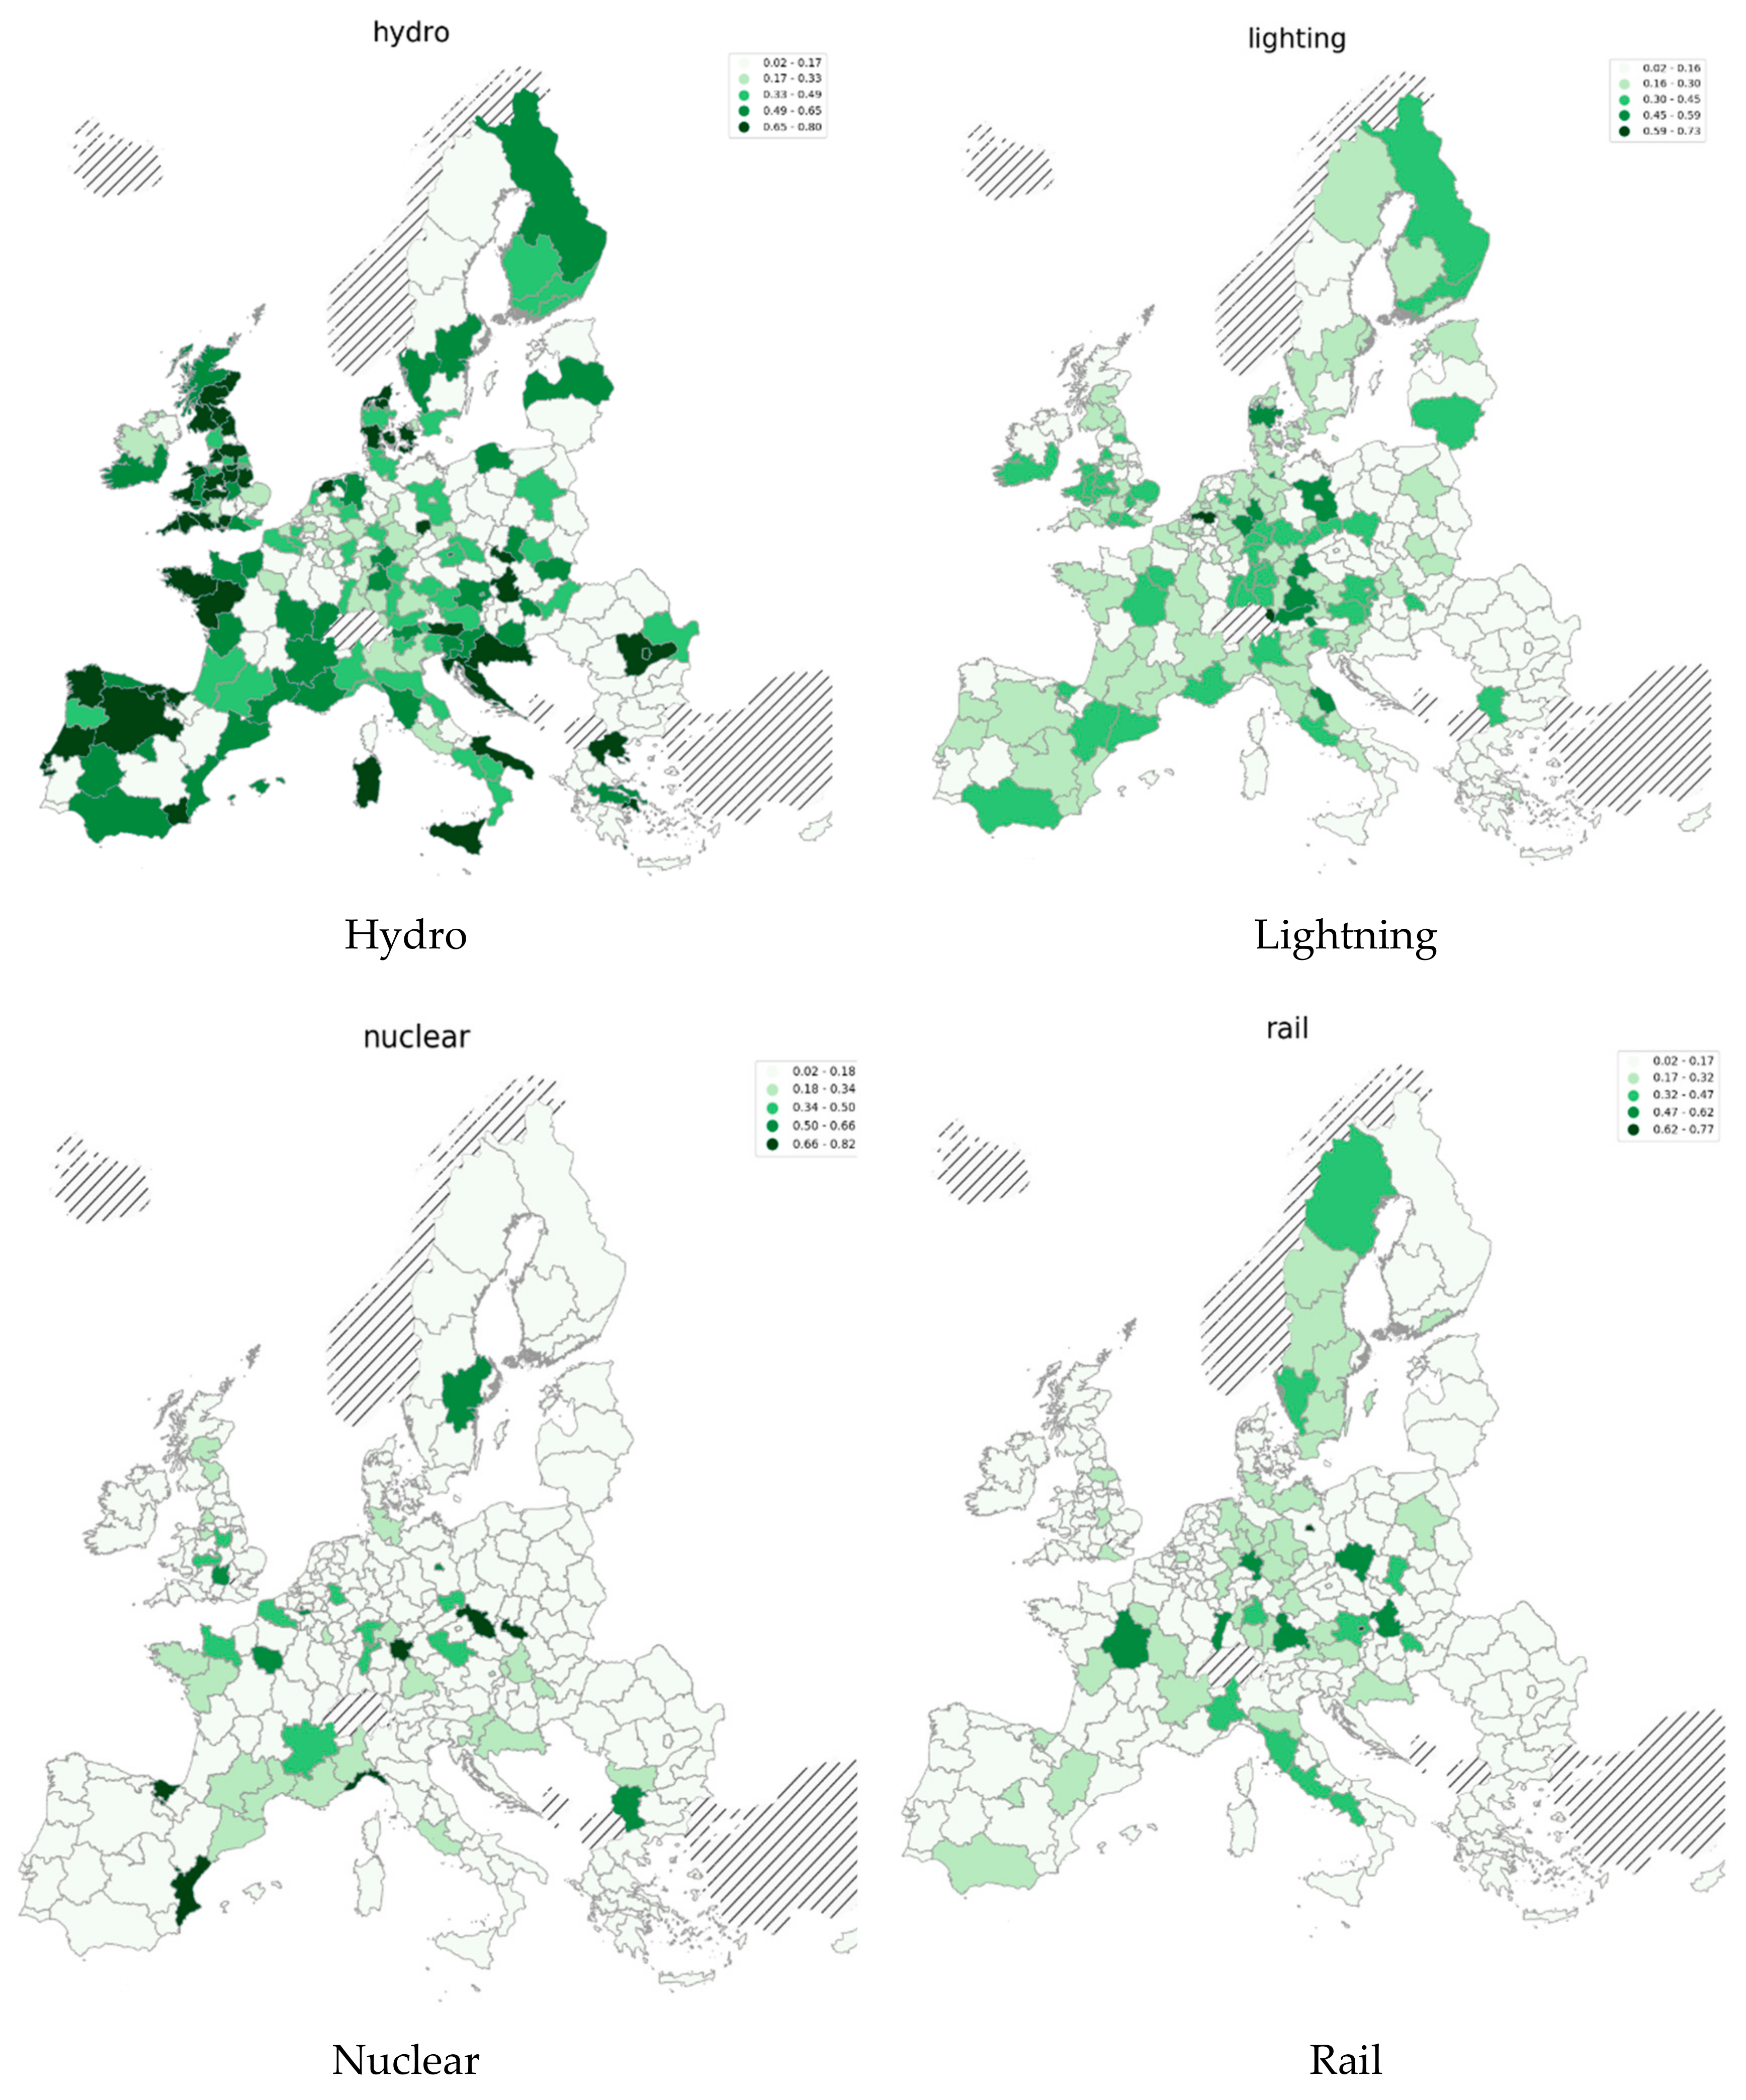
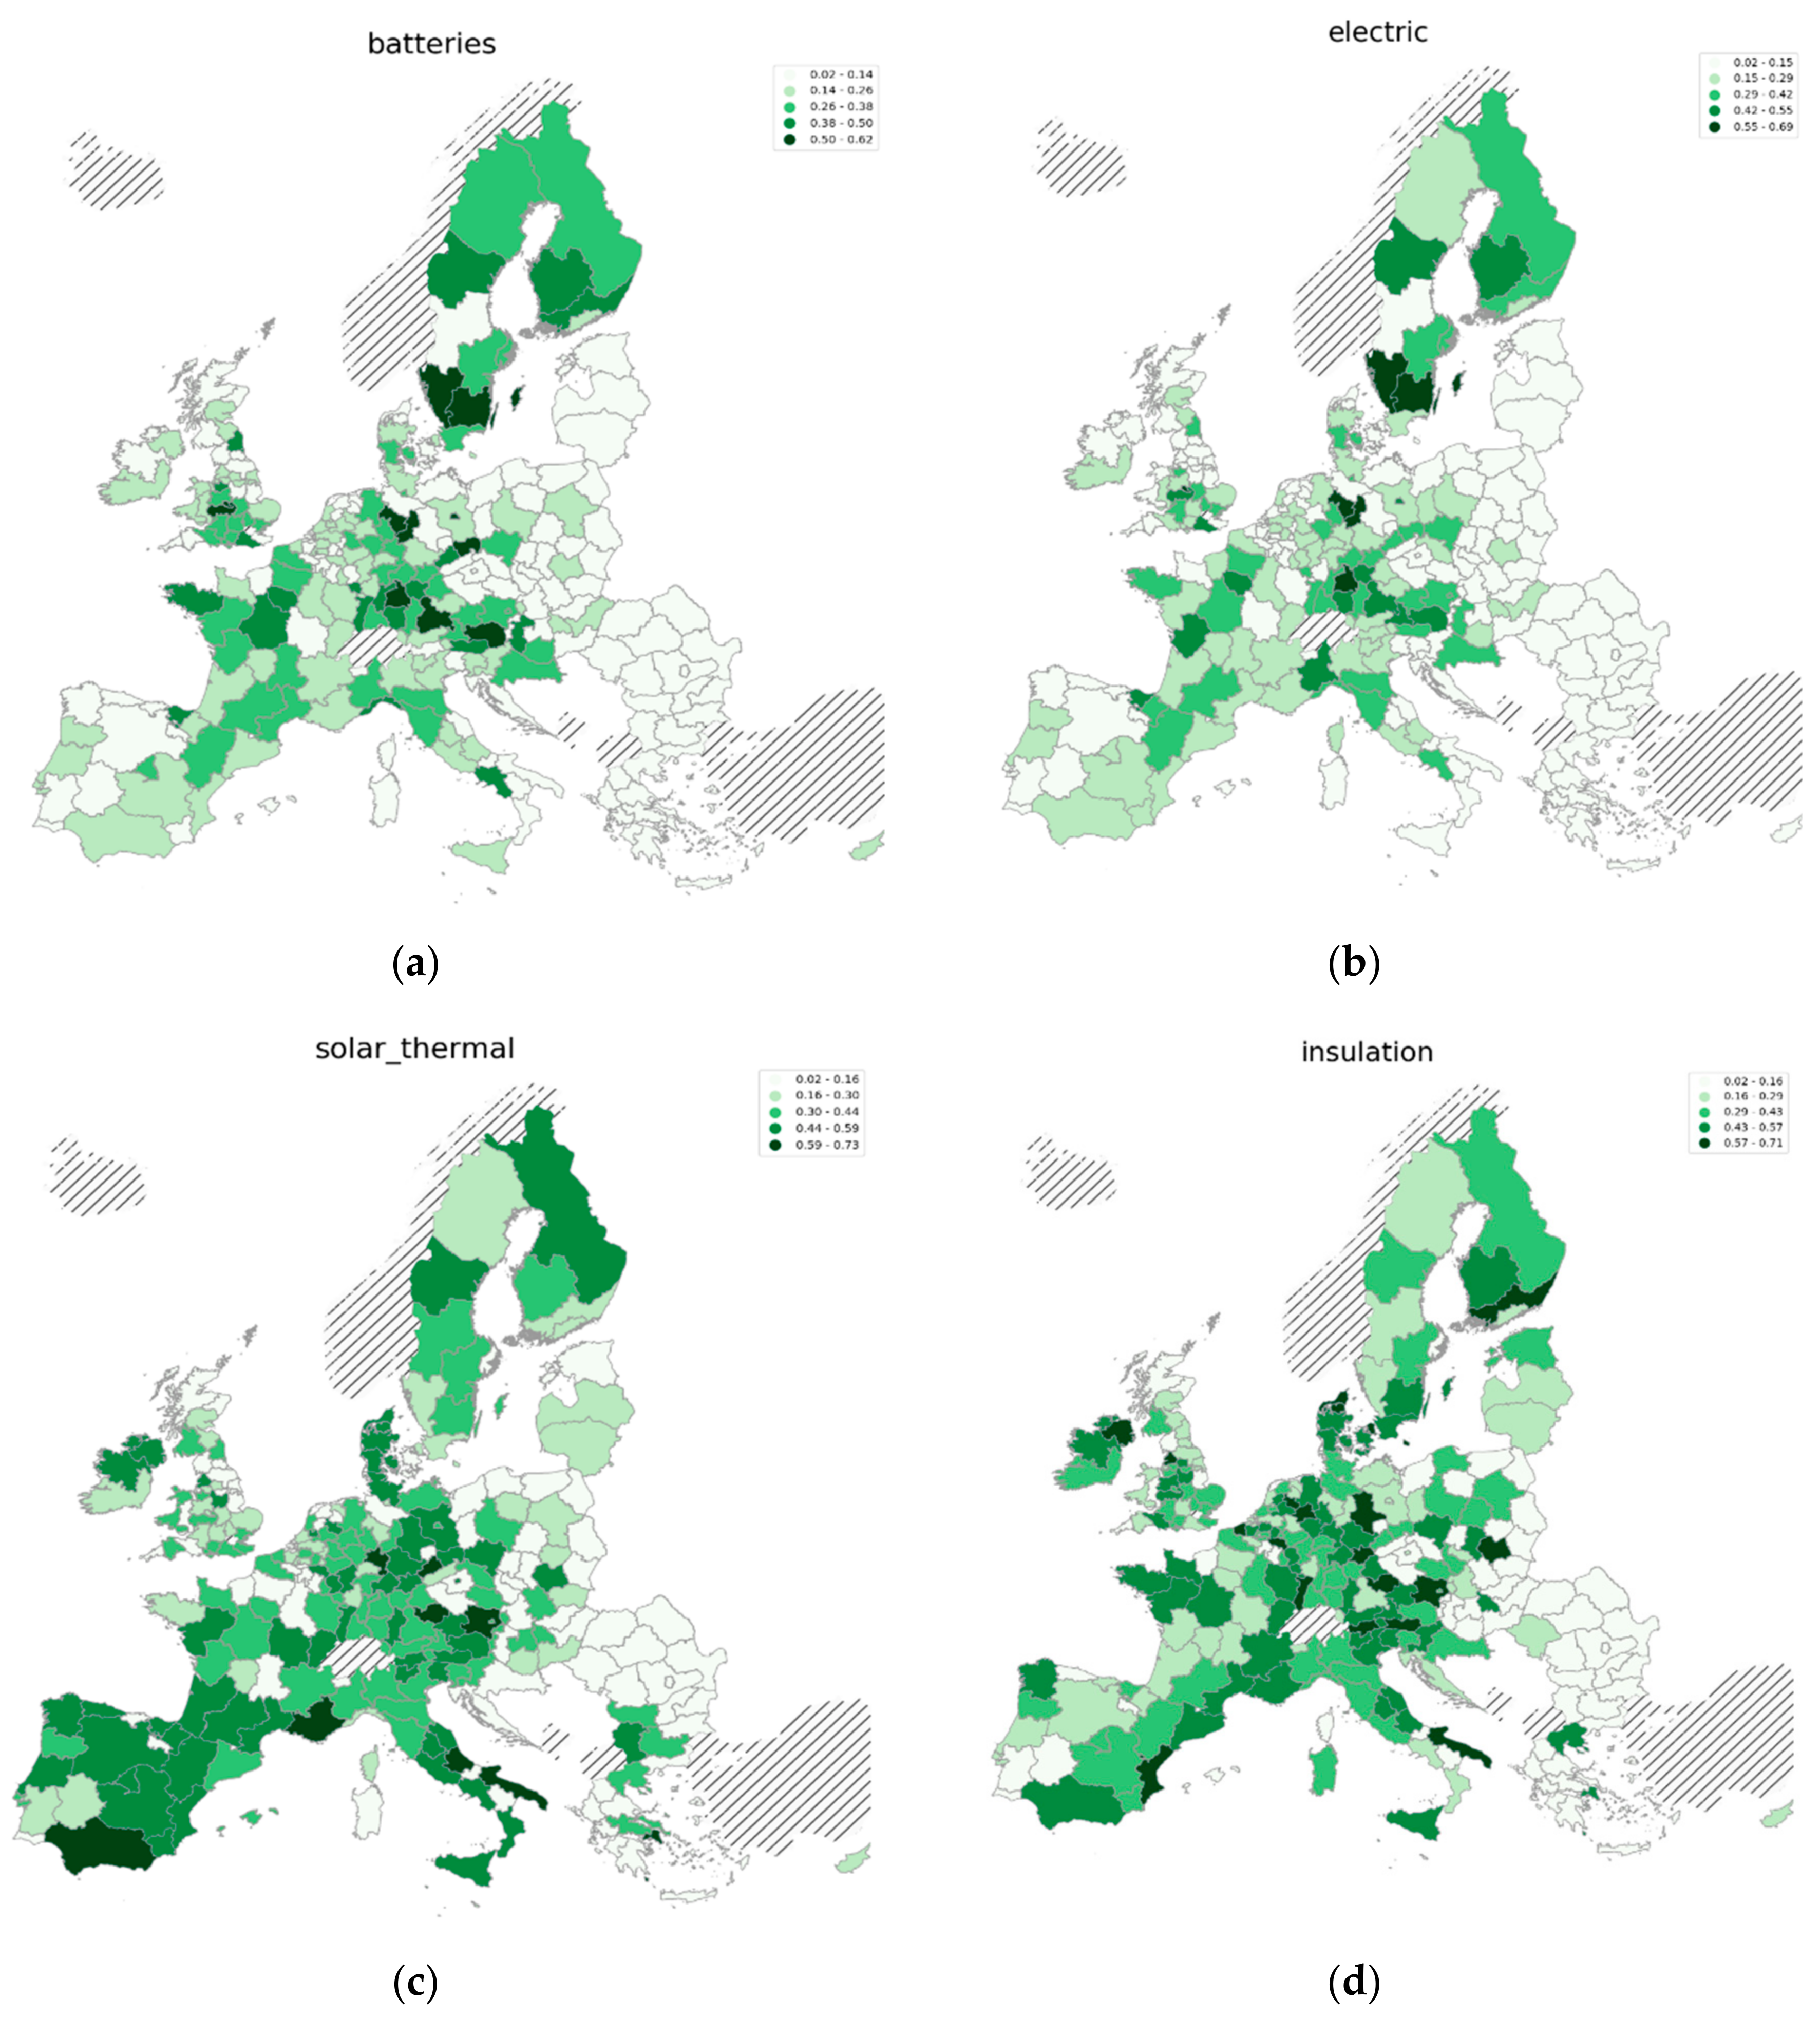
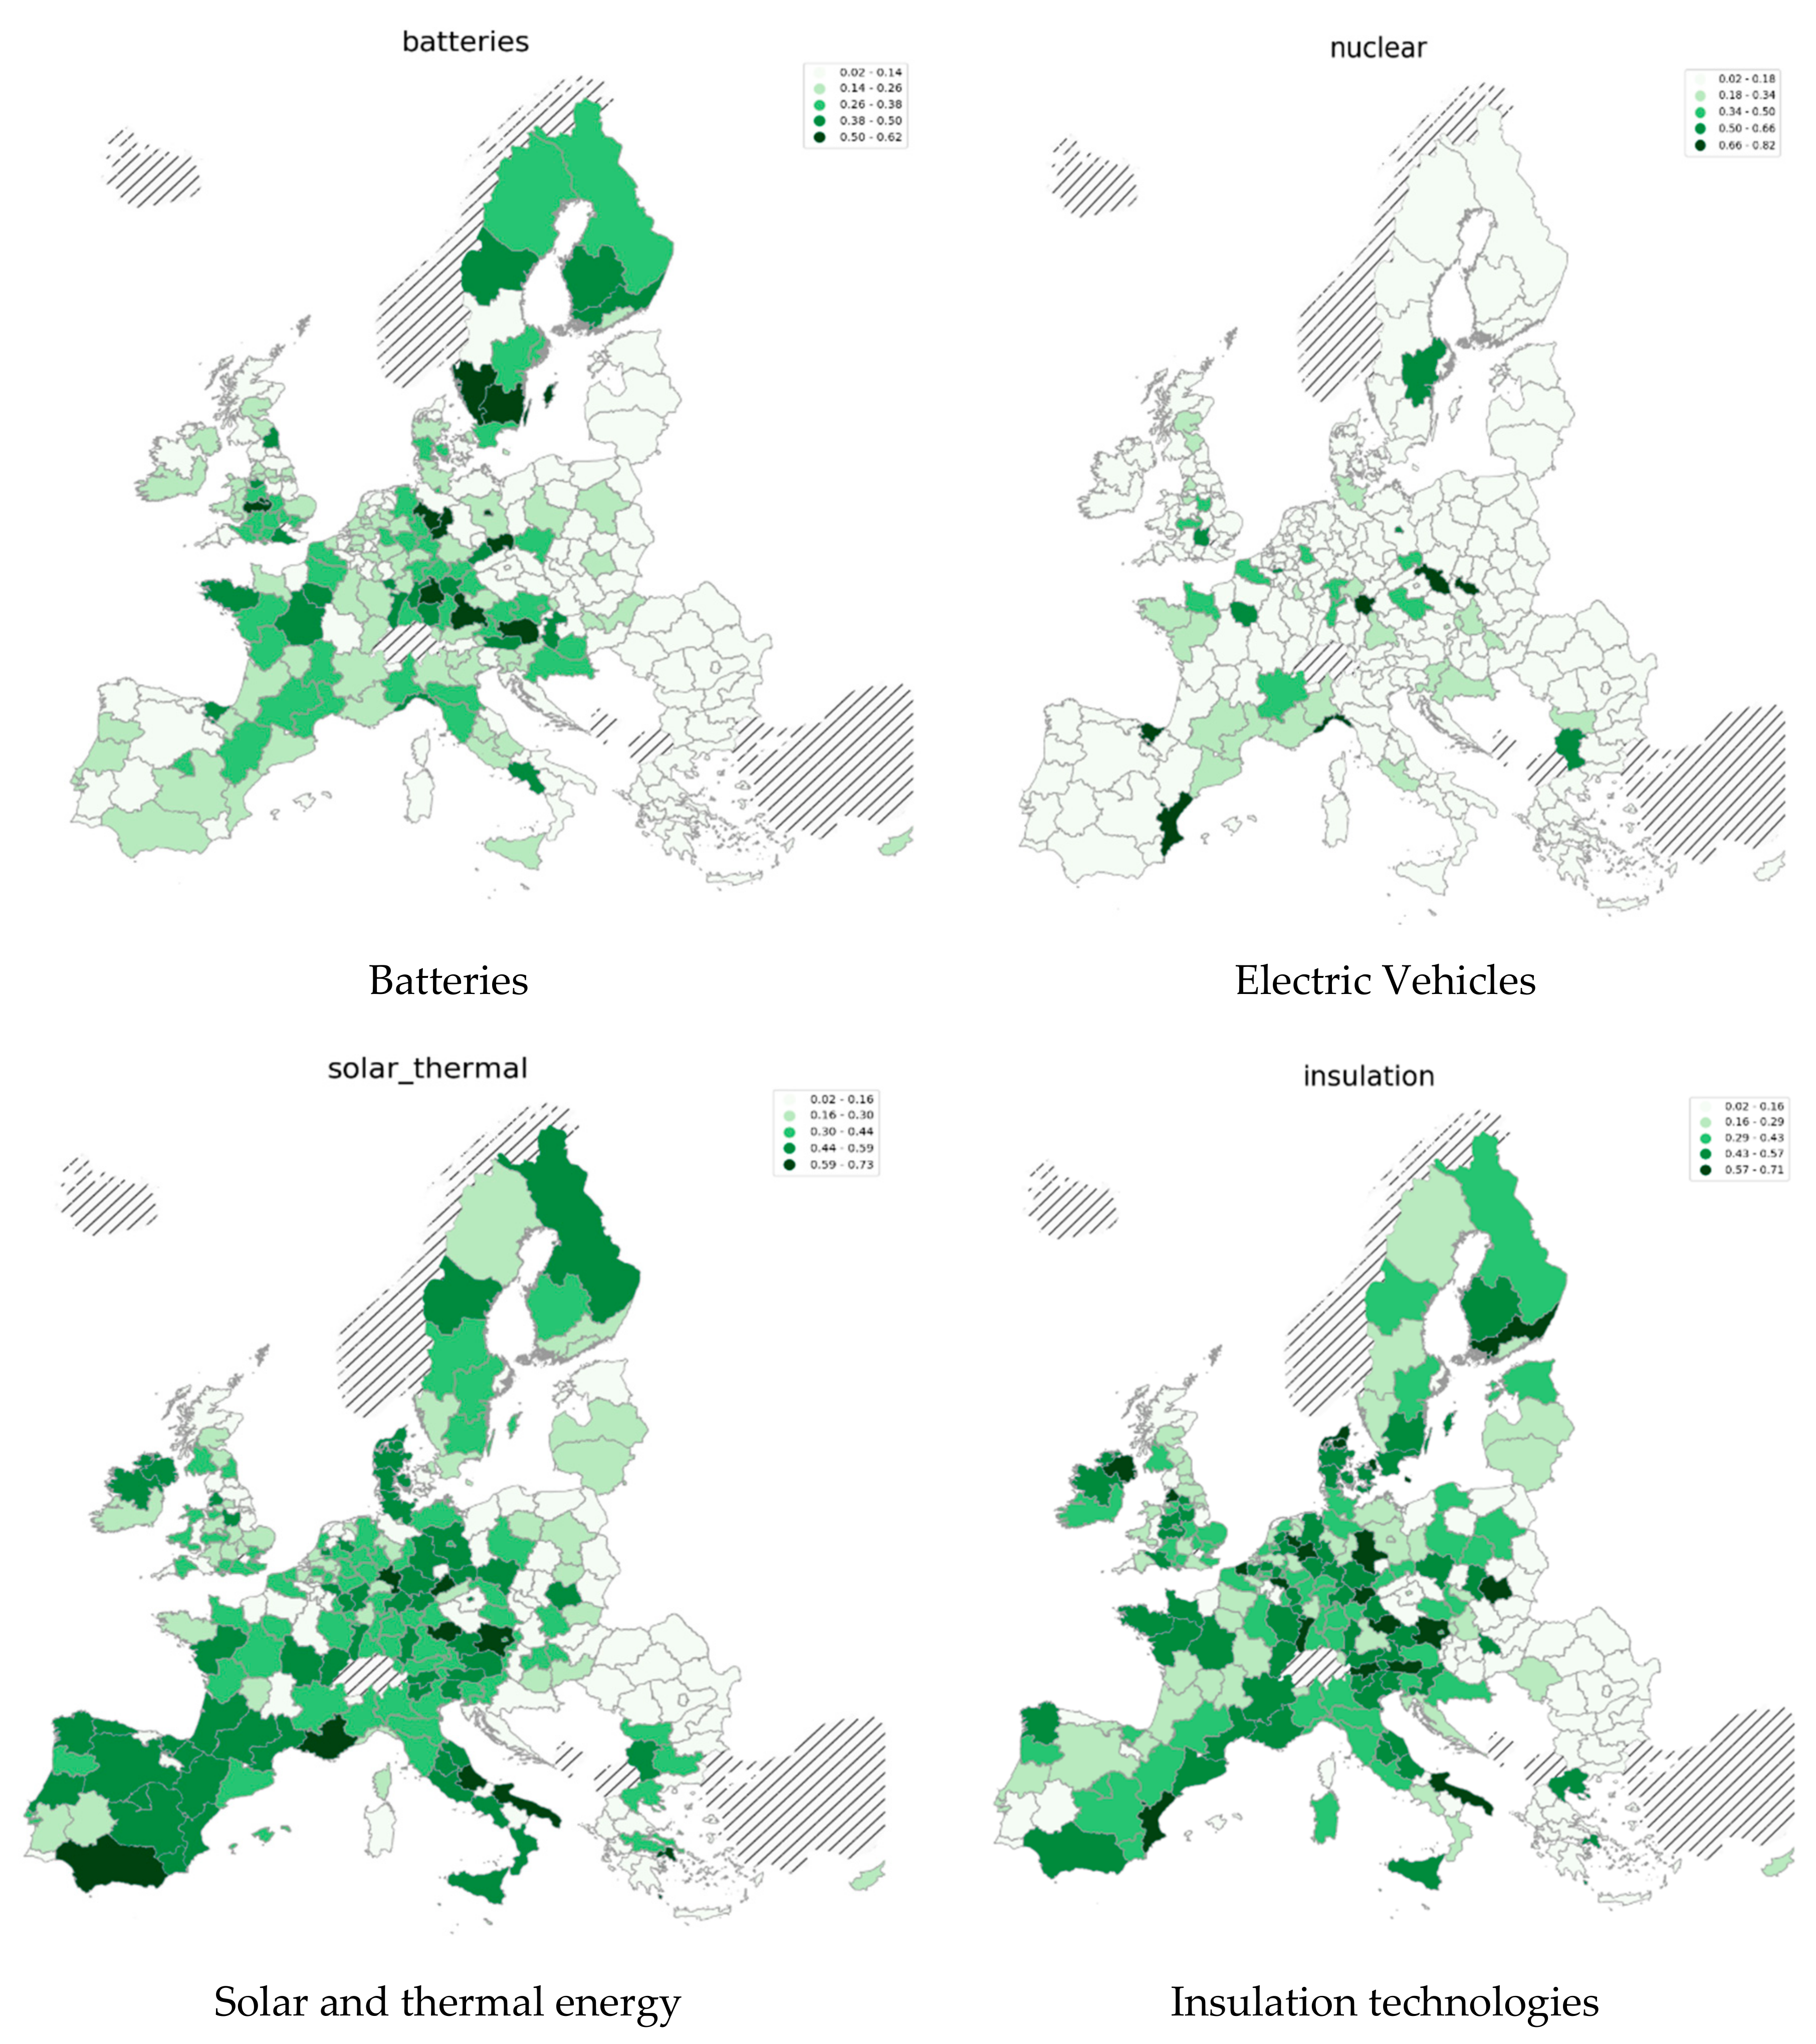
This, most likely, has to do with the technological complexity involved in producing these products. As mentioned, the other effect at play is the trade-off between technology definitions, time and categories. Because of this effect, nuclear technologies show much less patenting activity compared to patents, for example, in solar panels. While the production of products for nuclear power plants involves many sophisticated technologies, the entry barrier for companies is high (Figure 2). Other low-carbon technologies allow easier access for newcomers and thus a wider spread over several countries. Industrial hubs are revealed to have an advantage or a potential advantage in many fields, as they present a very complex product mix. The maps in Figure 4, present the estimates for pRTA values for different technologies, as of 2019. We present the same estimates for the other low-carbon technologies in Figure A3, Appendix C.
In very complex and typically clustered technologies, such as electric vehicles, our measure of potential advantage seems to be more clustered in highly innovative regions. By nature, green technologies are more complex than other technologies (Ghisetti et al. 2015; Barbieri et al. 2020) [26,27]. In line with this idea, only already very innovative regions, with a broad set of capabilities, would concentrate the potential to produce more complex technologies. Here, innovators are more likely to be able to draw competitive advantages externalities in the labour market, its highly-educated and skilled labour force, the infrastructural characteristics of industrial districts, the presence of well-established innovative supply-chains.
To give a statistic about how much green innovation clusters in innovative regions, and corroborate these ideas, we correlate the measures for pRTA with the European Commission’s innovation scoreboard. The scoreboard assesses how innovative regions are, based on a broad set of indicators, including patent activity, workforce education, data from the Community Innovation Survey and other information. In the first column of Table 1, we present the correlation coefficients, for all the low-carbon technologies observed, between the Commission’s indicator for 2019, and the pRTA for the same year. In the second column, we present the correlation between the same indicator and the RTA values, both in 2015.
We find a high correlation with pRTA for most of the technologies, particularly the most innovative (batteries, electric vehicles and energy management technologies). The volatility issues for the RTA calculations could explain the lower correlation with RTA. Interestingly, however, the discrepancy in correlations could also indicate that our pRTA measure is, indeed, picking up some of those latent factors, “hidden” in patent data, and observed by the innovation scoreboard.

3.2. Unpacking Network Proximity Measures

We employed several types of networks to build the regressors for the pRTA estimates. While the information contained in the 18 proximity networks, is reduced with a PCA procedure, it can be very informative about the state of low-carbon innovation in Europe. A growing body of literature applies network theory to patent analysis. Mariani et al. (2019) [28] focused on patent citations and used network centrality for technological forecasting. Wu and Yao (2012) [29] created and tested on a specific technical field an artificial intelligence-based method for network analysis, combining text-mining techniques. Song et al. (2016) [30] applied overlay patent networks to analyse the design space evolution by looking at co-references of patents, to understand the possible directions of the most likely expansion paths.
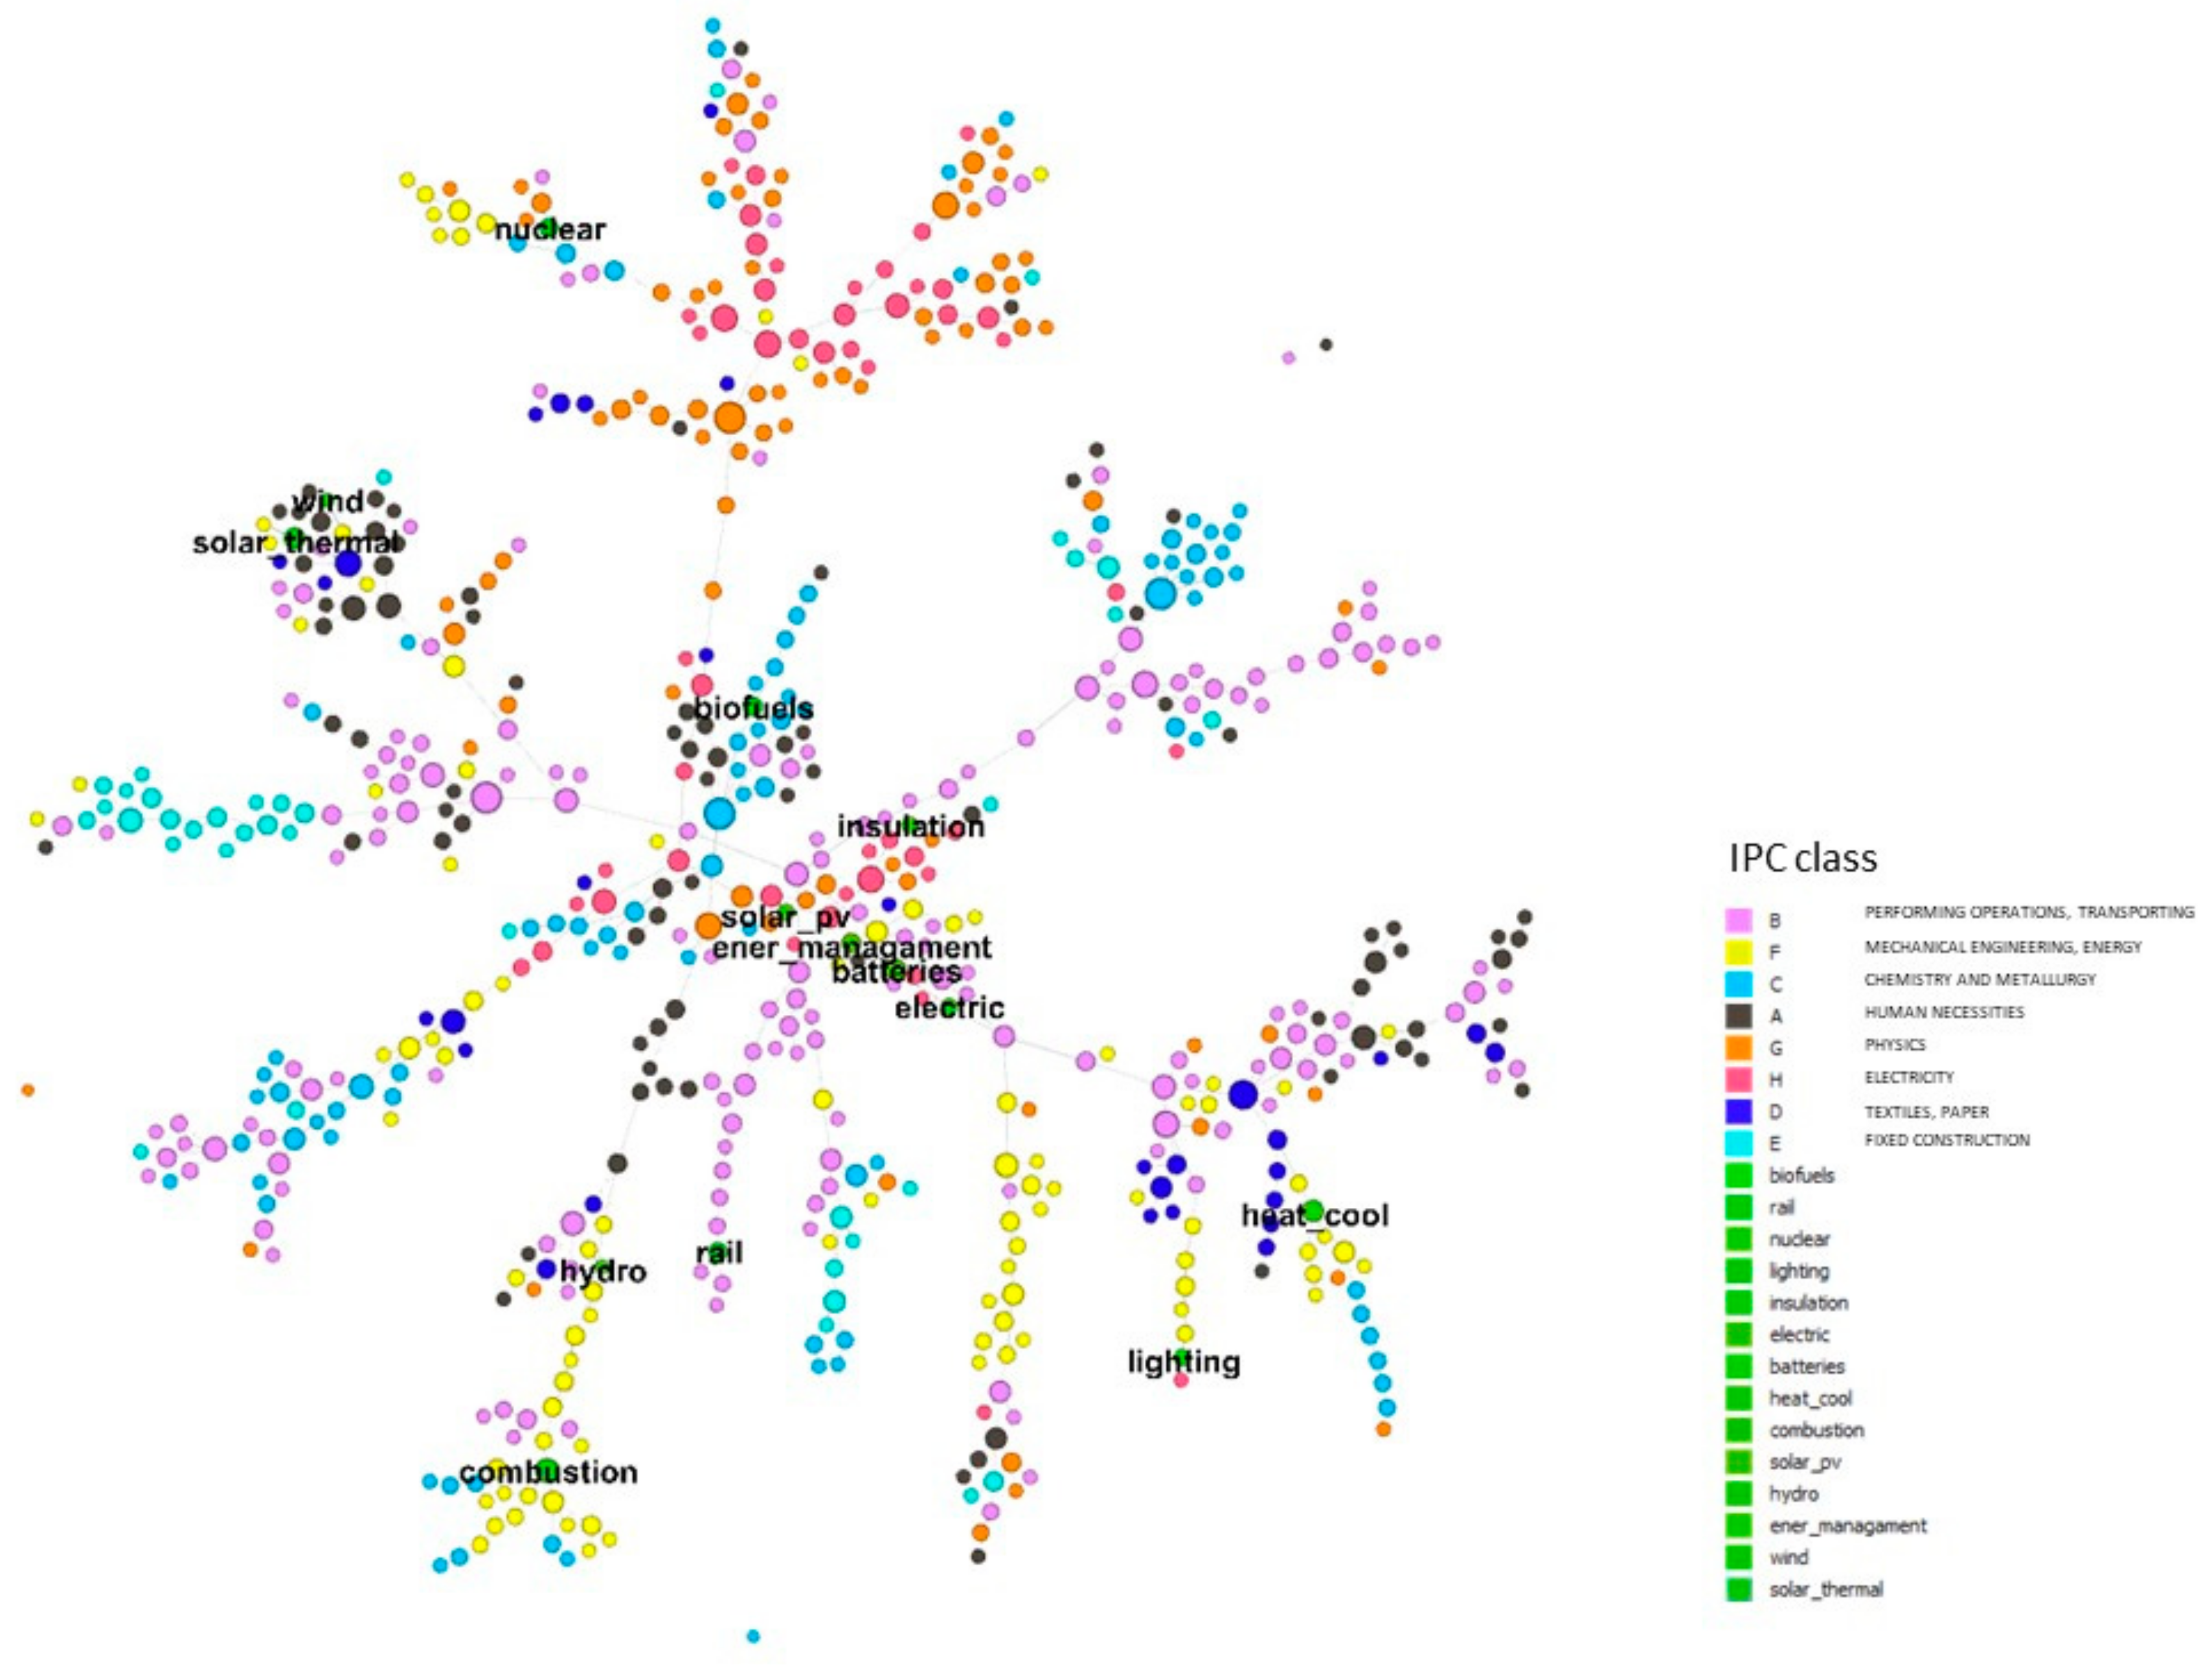
We start by looking at the green technology space, similarly to what Hamwey et al. (2013) [3] investigate, with a focus on low-carbon technologies (Figure 5). The technological space resembles the concept of the product space (Hidalgo et al., 2007) [2], showing to what extent different technologies are related, based on how often they are patented together (co-occurrence). This graph is built by constructing a technology-technology matrix between IPC classes for all the technologies and CPC-Y classes for low-carbon ones, based on co-occurrence of patenting in the same IPC class across regions. Each node is a 4-digit IPC class or a green technology. The weight of the nodes is given by the correlations between RTAs in different regions, for the 2013 time-stack.
Since the network is extremely dense, as all technologies are connected to some degree to one another, we present here a visualization of the Maximum Spanning Tree (the graph that maximises the total weights of the edges). This graph can give a sense about the type of technologies presented in Appendix A, and confirm that similar technologies position closer to each other. Solar panels, energy management, batteries and electric cars seem to have good proximity in the network. Trivially, nuclear technologies are, instead, closer to classes G and F (physics and mechanical and energy engineering) and rail technologies position close to class B (performing operations, transportation). While this is an aggregate picture, observing directly the relatedness between technologies may inform on the (green) diversification possibilities of regions, given their current position in the technological space.
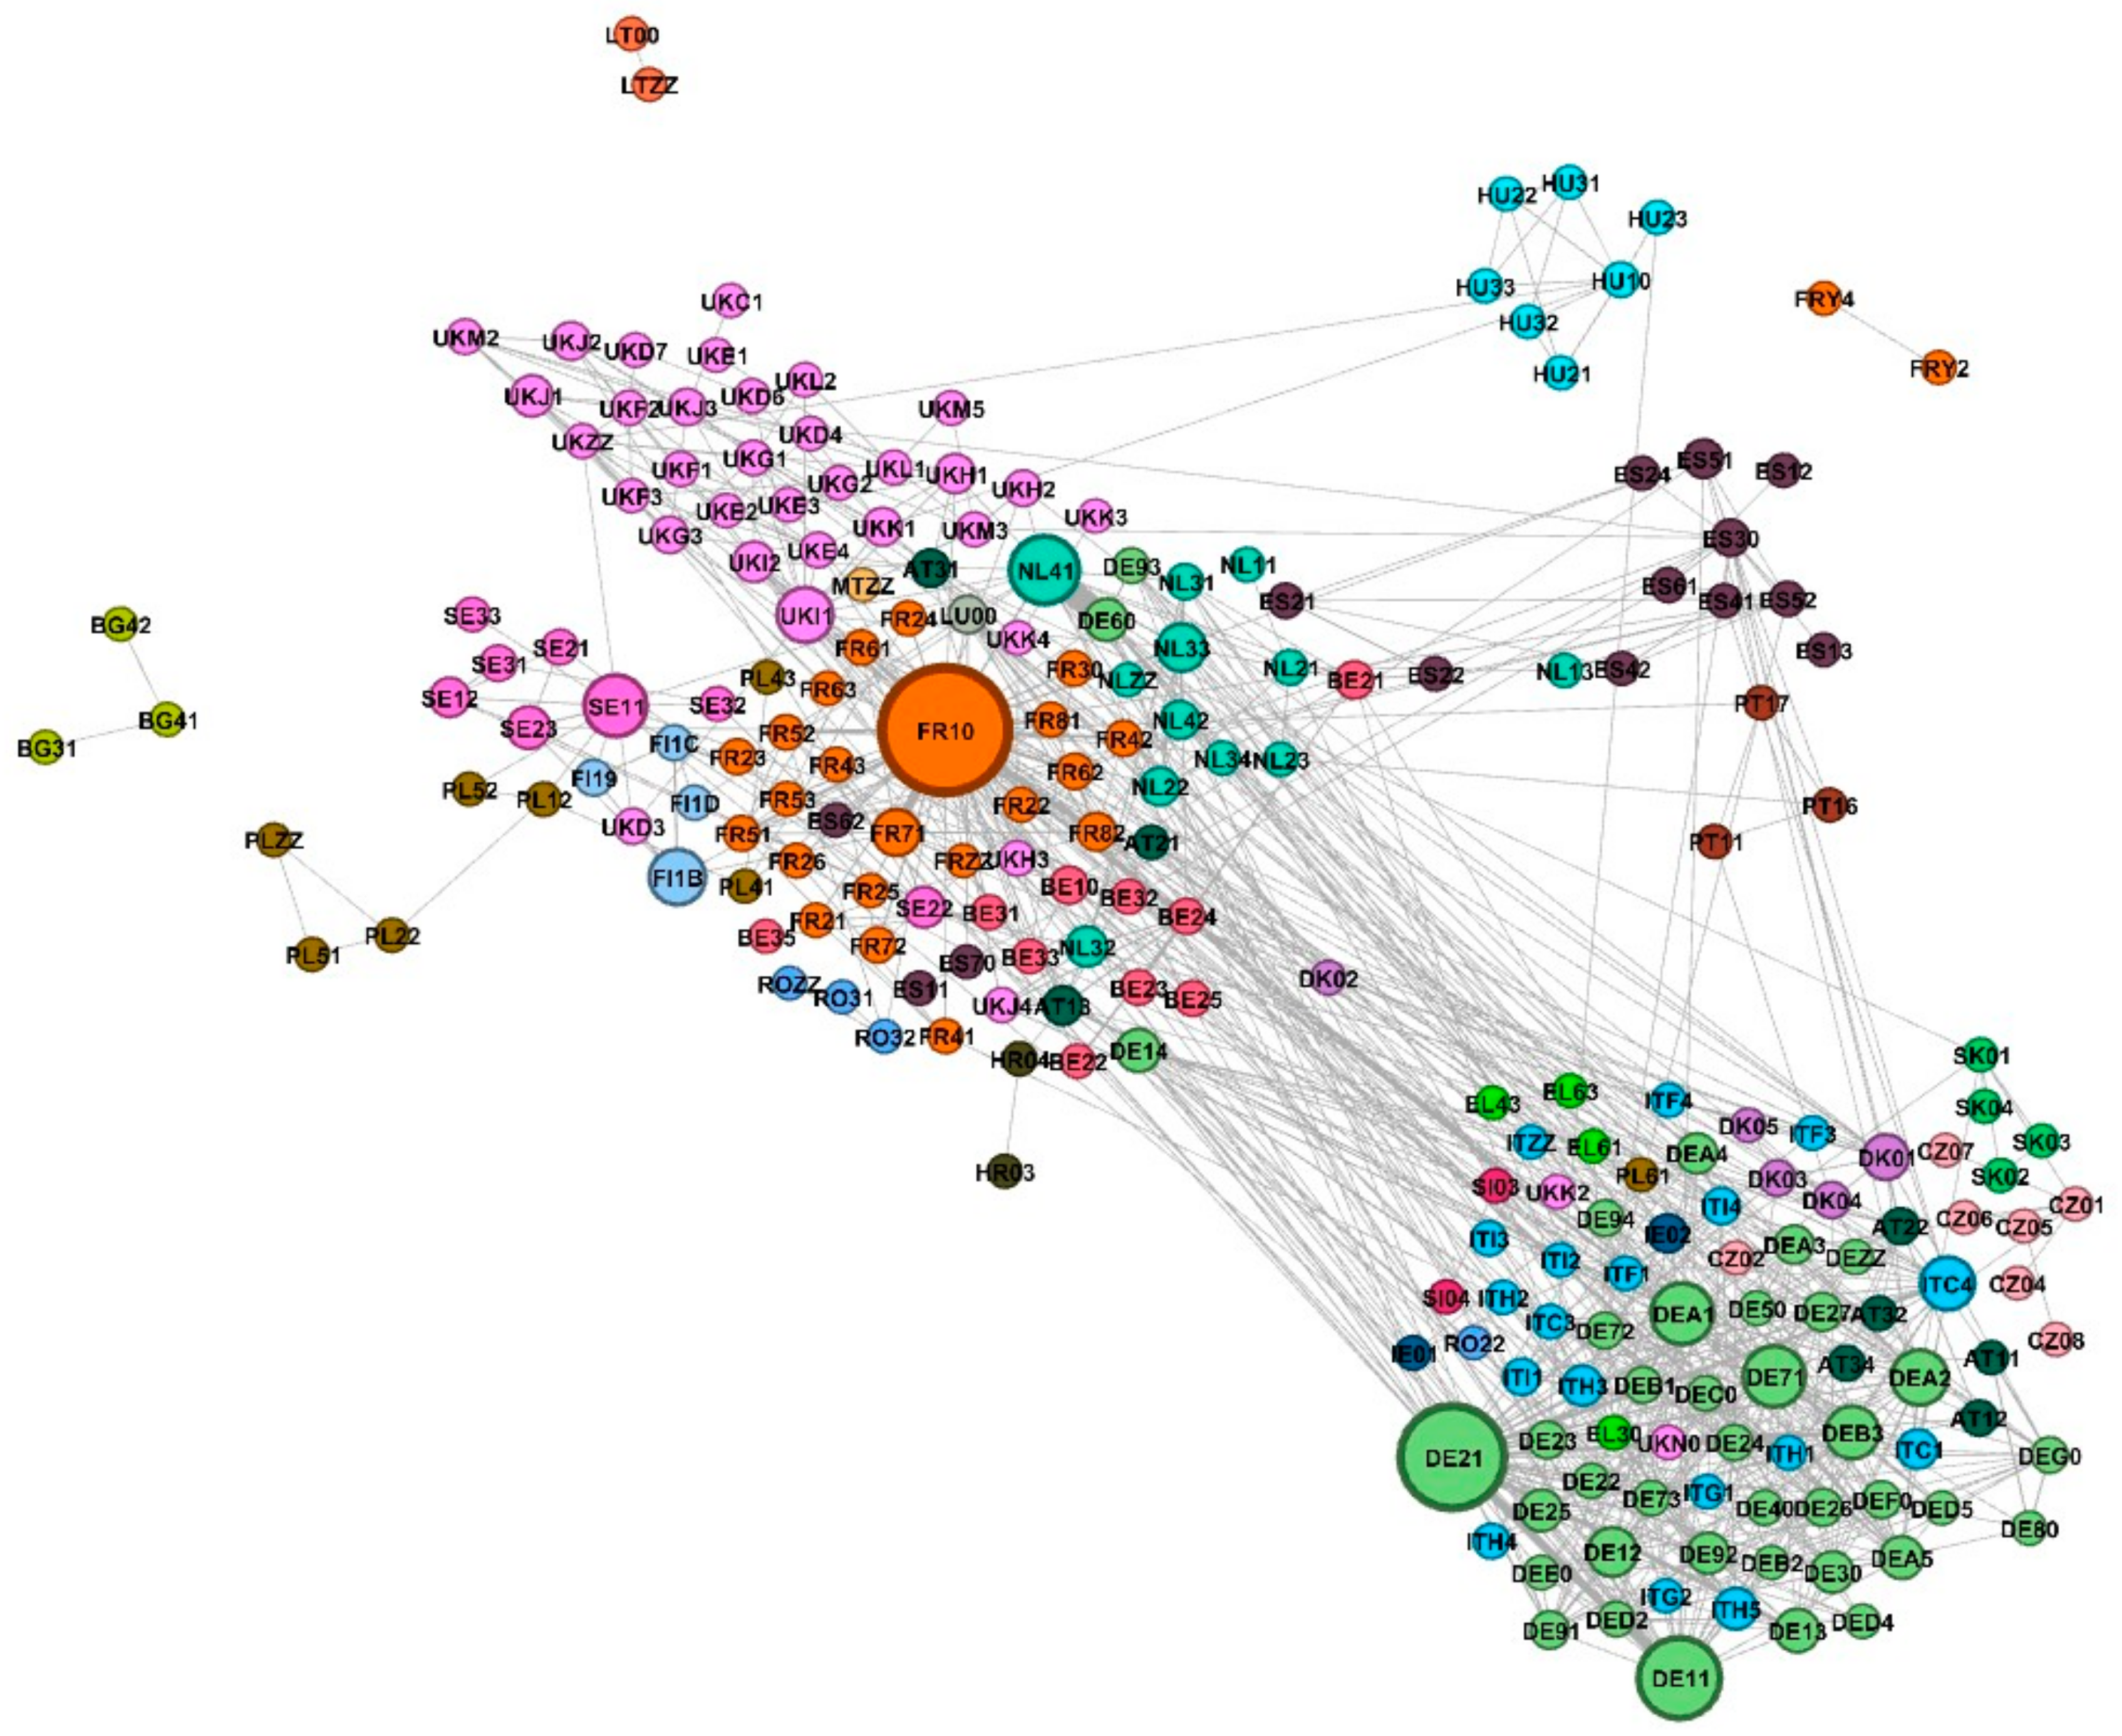
Next, we use a co-patenting measure to assess how European regions collaborate in patenting low-carbon technologies and observe green technological clusters. This exercise gives us a more precise map about which regions are central in the low carbon industry, based on dry patent counts, rather than the RTA measures presented in the previous section. In Figure 6, we plot a graph-based only on low-carbon technologies, in which the size of the nodes is relative to the number of patent applications, and the weight of the edges represents the number of co-patents between two regions. The network is then clustered based on its modularity, a structural measure informing about how well the graph can be divided into different modules. Specifically, the OpenOrd algorithm (Martin et al., 2011) [31] is applied.
Two clusters emerge, although quite tightly connected. One is dominated by Ile de France (FR10), the region of the capital of France. The other is dominated by Germany, with Oberbayern (DE21) and Stuttgart (DE11). The United Kingdom, the Netherlands, Belgium and Sweden, among others, seem to be clustered more tightly with France, whereas on the other side we see Italy, Germany, Slovakia and Austria. We have already mentioned that the concentration of green (as mentioned, typically more complex) technologies into highly technological industrial districts is in line with the literature. Here, we confirm the quite strong agglomeration of low-carbon innovation clusters in high-tech centres such as Paris and Oberbayern. Moreover, our findings are in line with (Calignano and Trippl, 2020) [32] that find that very few regions play a central and dominant role in pan-European energy research consortia funded by the EU Horizon2020 program.
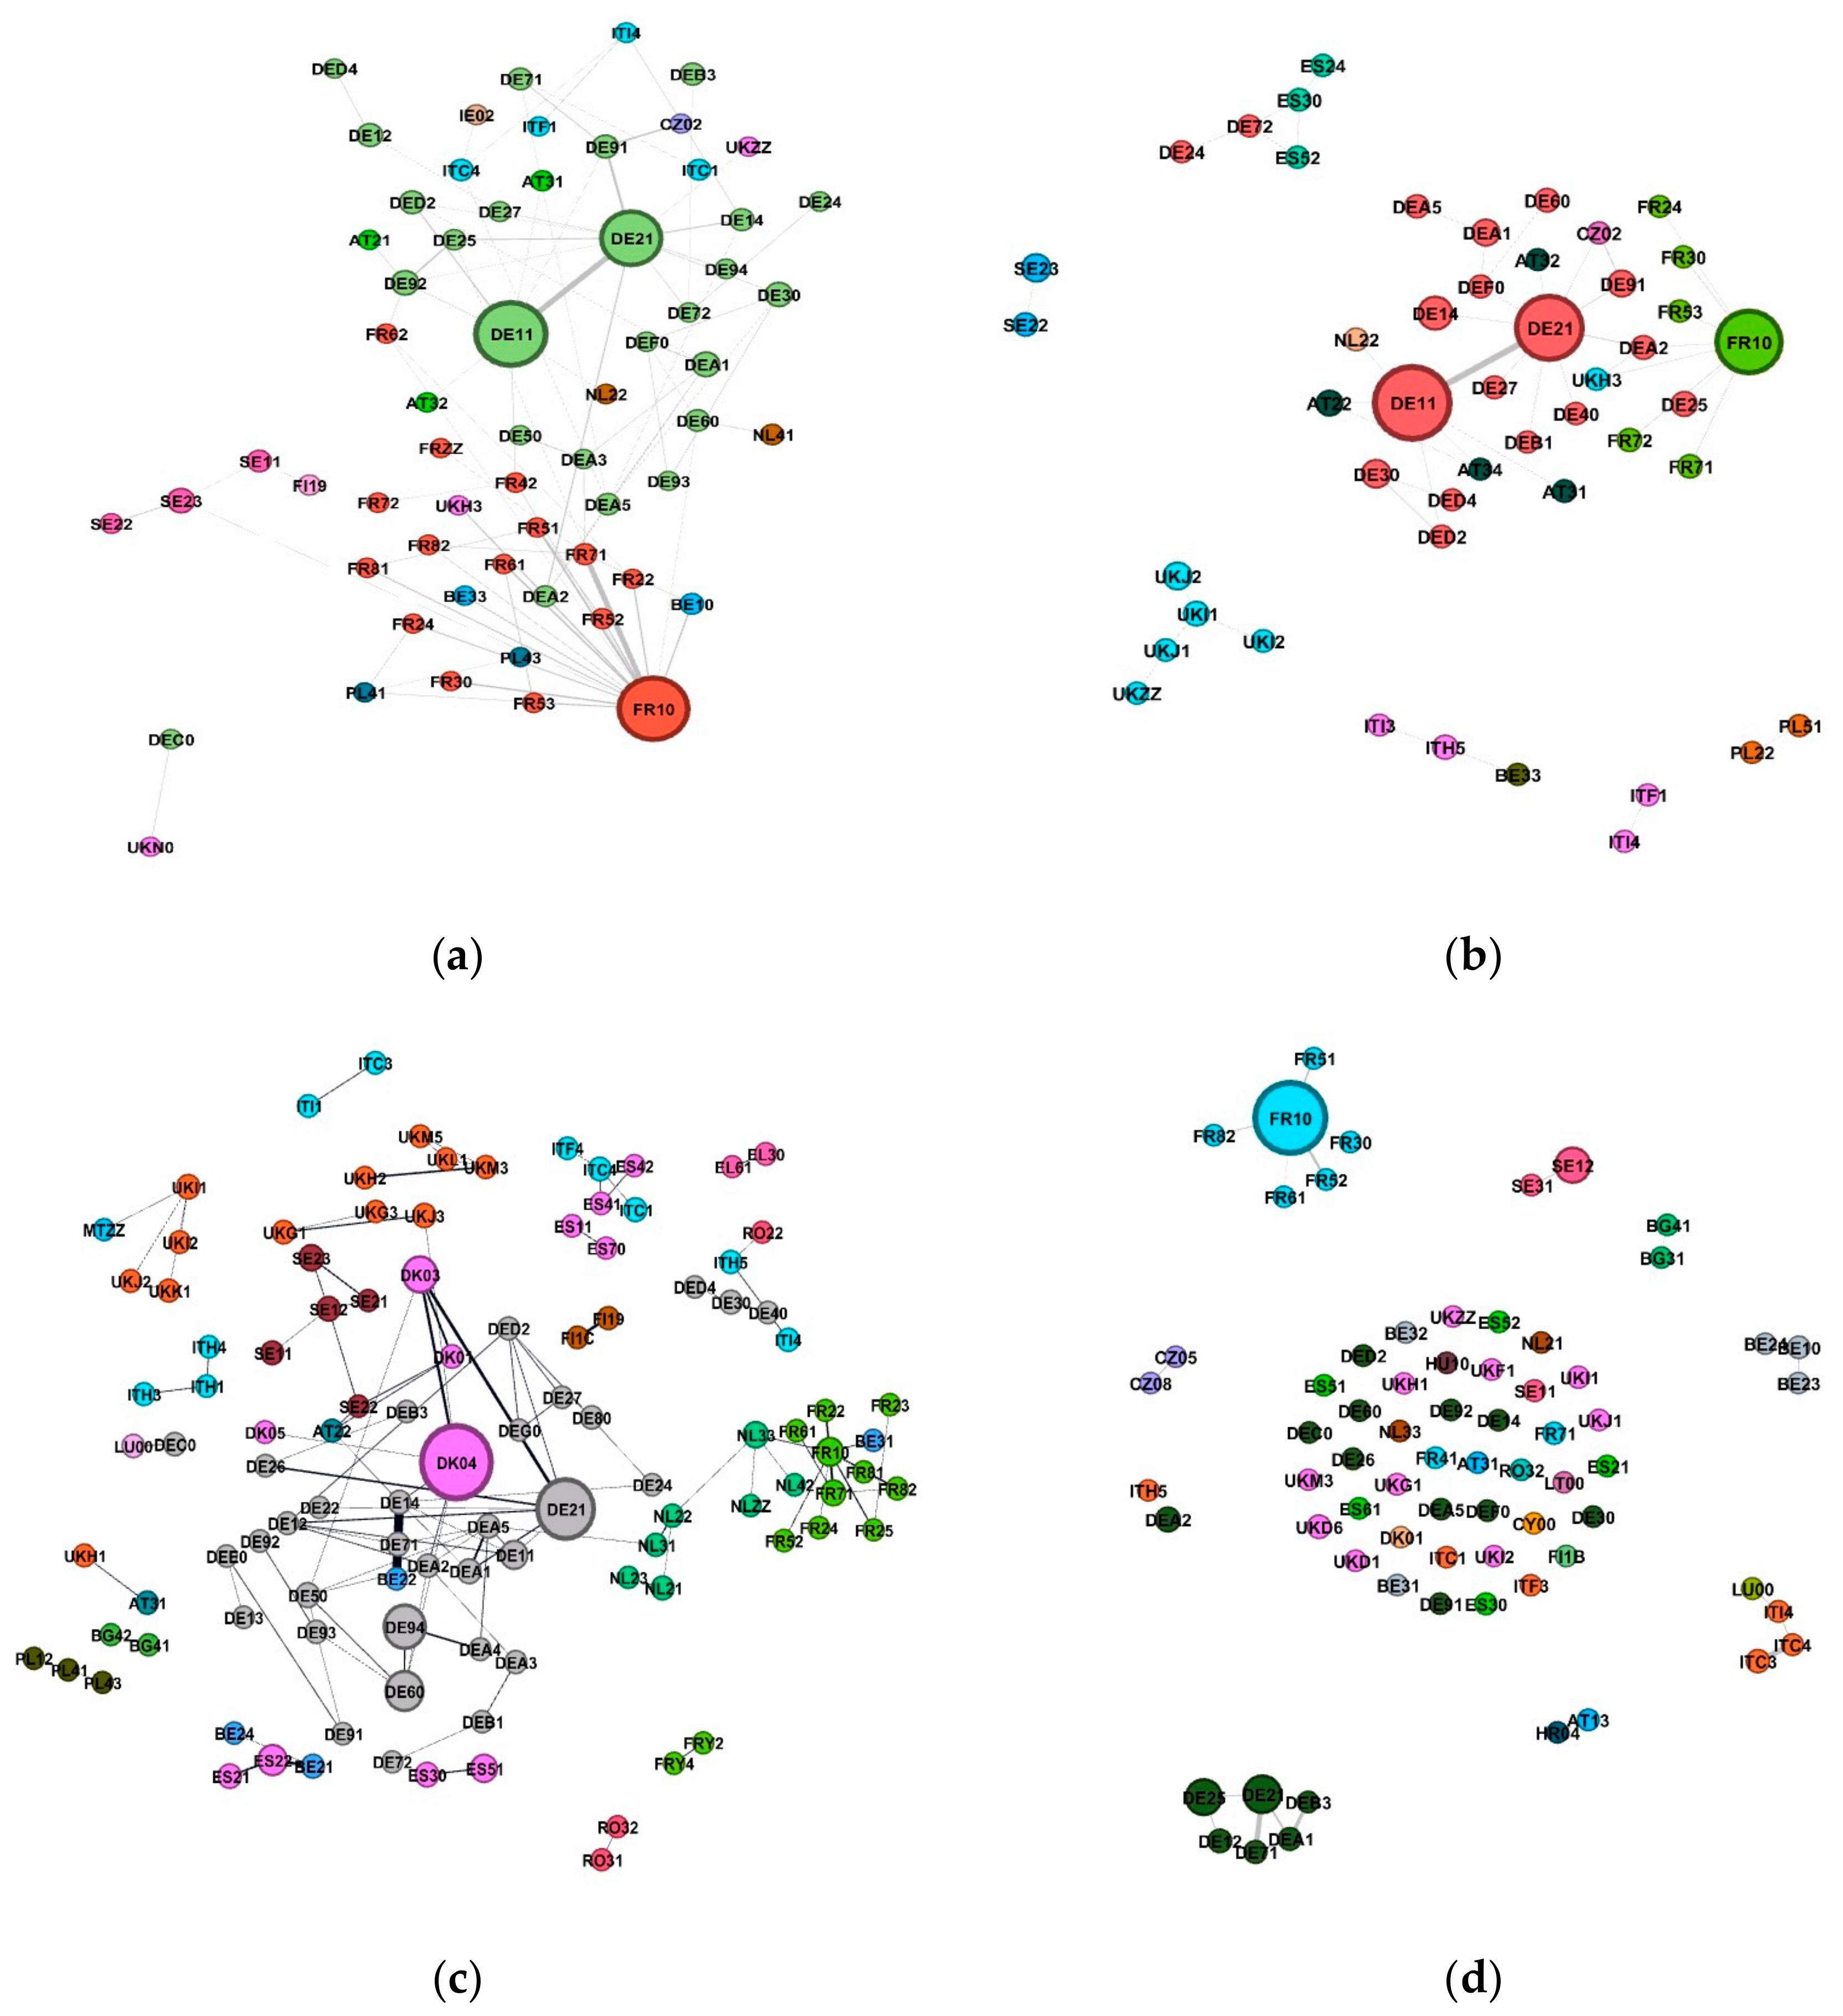
In addition, we compute the same co-patenting networks considering one low-carbon technology at the time. In the four panels of Figure 7, we show the examples of batteries, electric vehicles, wind, and nuclear technologies. Which are the clusters of innovations? In the case of batteries and electric vehicles, we can see the clusters in France and Germany, whereas for wind Denmark and Germany are the most central. In these three panels, we filter out the nodes that have no co-patenting and a small number of patents. For nuclear we cannot do this, as most nuclear-patenting regions do not co-patent nuclear patents with other nuclear-patenting regions. Moreover, observed nuclear co-patenting reflects national boundaries.
Unpacking the network measures underlying the potential RTA estimates, and looking at European co-patenting, proved to be a useful tool to map green innovation. We believe that further research could investigate more precisely which clusters of green innovation exist in Europe, how they relate to each other in value chains, by means of network analysis. In the next section, we turn to the results from the second stage of the paper, looking at associations between green technologies and socio-economic variables at the NUTS2 level.

3.3. Socio-Economic Variables and Low-Carbon Innovation

In the last stage of the analysis, we present the results of the regularisation techniques and regress onto RTA a combination of socio-economic variables at different time-stacks and pRTA for the previous period. We exploit the wide panel dataset that we constructed by merging the patent-based information with a large number of variables available as open data, as detailed in Section 2.2.
Table 2 and Table 3 (set out in more length in Appendix D), summarise the top results of the regularization via the elastic net, by showing the number of times a coefficient is found to be non-zero, at time t, t − 1, t − 2, and in total. We present a count of the survived coefficients resulting from the dimensionality reduction technique, across the several specifications that we run for each of the low-carbon technologies considered. As mentioned, none of our results are causally identified and should only be intended associations. Furthermore, we do not interpret the sign of any coefficient, but only its survival in the elastic net regularisation.
The variable that survives the greatest number of times is the activity rate (labour participation) of people that have an ISCED level of education (International Standard Classification of Education, classified by the UNESCO), higher than the upper secondary level. A longer duration of employment is also associated positively in many of the specifications with the advantage in low-carbon technologies. The number of engineers and scientists is also significant. In general, higher educational attainments of the population are associated with more innovation in green technologies. In addition, different measures for R&D expenditure survive for all green technologies. Both private and public sector spending result from our analysis and seem to appear more often at time t rather than as a lag.
Table A4 and Table A5 in the Appendix D present the counts of coefficients indicated by the regularisation procedure, one-way demeaned panel approach discussed in the previous section. Table A4 summarises the main effects, while Table A5 summarises the surviving variables included as interaction factors that we force with pRTA at t − 1. Overall, our fixed-effects regularisation approach does not yield different results compared to the cross-sectional specifications. As mentioned, the lower R2 could be indicative of a higher variation coming from the cross-regional rather than from time-varying effects.

4. Discussion

4.1. Limitations and Further Research

The first stage of this paper used zero-inflated beta regressions to predict pRTA values. Looking at the R2 statistics, not higher than 0.35, suggests that the modelling could be improved. pRTA values correlate at 0.4, on average, with RTA. Note that the correlation of present RTA with past pRTA is higher than that of present RTA with past RTA (i.e., autocorrelation). That is, the methodology is performing visibly better in identifying future strength in technology than just extrapolating past specialisation in this technology. This effect seems particularly strong for more novel technologies.). The definition of the stacks (three years versus a longer period), appears to be less problematic than the modelling, although the volatility in regionalised patent data should be explored further, also comparing REGPAT availability with alternative sources of geocoded patents. In further research, a model with less volatile RTAs could yield more consistent predictions for pRTAs.
As detailed in Appendix B, the most significant limitation of this study is data availability at the NUTS2 level. Prior to dimensionality reduction, over 70 percent of indicators were missing more than 10 percent of observations. Of these, around 60 percent are time-lagged and 40 percent are non-lagged. As a consequence of this missing information, the 30 percent threshold used for keeping covariates is higher than preferred, and yet causes a large loss in the availability of data eventually included. As mentioned, the performance of multiple imputations on high dimensional matrices with significant amounts of missing data is improving. However, the stability and quality of imputed values would be much better given a more complete starting dataset. Moreover, because of the need to reduce dimensionality and missing data when using multiple imputations and regularised regression, we may be eliminating covariates or interactions among covariates and pRTA/RTA which have significant predictive power. For some covariates, though, the lack of data is so pervasive that the ability to achieve meaningful predictive power is precluded. Better and more consistent data collection at the regional level will help solve these dilemmas.
Relatedly, adding different NUTS2 level datasets and types of variables could lead to different results. In particular, we believe that the use of datasets with diverse scopes and extensions could be particularly relevant, notably focusing on the infrastructural dimension, market structure, competitiveness and institutions. Within our current framework, purposefully exploratory and agnostic on the economic mechanisms underlying green innovation, we have recognised the association between our right-hand side variables. Further research should try to establish causal results in this framework, by means of econometric approaches aiming at modelling the determinants of green innovation, rather than at reducing the dimensionality. This approach isolated relevant socio-economic variables, linked to education, labour markets and public and private R&D spending. While these results remain largely unsurprising, within our analytical framework they seem promising as a base for further econometric analysis. In this sense, our results point towards what is generally recognised as good horizontal policies for innovation. Further research might also exploit the implied technological advantage framework to understand if and how policies differently affect green and non-green innovation activities.

4.2. Implications for Policy

In this paper, we explored the geography of specialisation in low-carbon technologies across European regions. The motivation for our study stems from the double-folded necessity to foster low-carbon technologies. On the one hand, this necessity is driven by the climate emergency, on the other it is embedded in the industrial transformation that the decarbonisation process will bring along with it, impacting labour markets and industrial sectors.
This paper contributes to inform place-based green industrial policies. It is also rooted in the S3 framework and the place-based approach at the EU level (Barca, 2009) [33], that are picked up in the European Green Deal to guide the decarbonisation process while achieving industrial competitiveness. We, therefore, highlight the importance of understanding the nuanced geography of (potential) green technological advantage, to inform policies targeting green growth at a higher resolution (Capasso et al. 2019) [34]. The policy can leverage strength in similar technologies by shaping innovation paths, strengthening learning capabilities, targeting sector-specific innovation regimes, and coordinating sectoral, national and regional policies.
We start by exploring network-based methodologies to predict the advantage of regions in green technologies, based on observed specialisations, and latent, unobserved factors. Our methodology is in line with the works of Hidalgo et al. (2007) [2] and Hausmann et al. (2019) [14], estimating implied comparative advantage. We focus specifically on low-carbon innovation in Europe. The first contribution of our study is to provide an atlas of potential specialisation in green technologies for European NUTS2 regions, using regression-based forecasts.
The main result of this paper is to present detailed and complexity-grounded estimates for green potential advantage in several low-carbon technologies. Compared to similar work (Zachmann and Roth, 2018) [9], we estimate the potential advantage of technological advantage at the regional NUTS2 level. The estimates are based on different proximity and relatedness measures in technology-region networks. In line with the literature, we find that more innovative regions, where the combinatorial processes require a broader and more skilled knowledge base, have a higher potential for developing low-carbon technologies (Capasso et al., 2019) [34].
Our representations of co-patenting figures across Europe seem to confirm the agglomeration effects present in innovation in the context of green technologies. A small number of leading regions (notably in France and Germany) are pushing the frontier of green patenting. This result is in line with the agglomeration of innovations and quite expected given the more complex nature of technology (Barbieri et al., 2020) [27]. Our empirical results confirm the idea that the breath and innovation characteristics of the knowledge base, green or not, matters for the potential development of green technologies. Highly innovative regions, as comprehensively measured by the Commission’s innovation scoreboard, tend to have a higher potential for low-carbon technologies, as measured with the latent factors methodology. This correlation is in line with the results of Montresor and Quatraro (2019) [12] and Van den Berge and Weterings (2014) [11]. With a certain degree of complementarity to Fankhauser et al. (2013) [35], we aim to identify which regions have green technological potential, and which factors affect it, while also providing information on a lack of potential.
While the relevance of our work is clear in terms of the upsides (fostering structural change and competitiveness in a green direction), a successful green industrial policy must also address the downsides of dealing with lagging and carbon-intensive industrial regions (Cosbey et al., 2017) [36]. In this sense, part of the Green Deal is the Just Transition Fund, aimed at compensating the losers of the transition. The implementation of both sides of green industrial policies, in Europe, will be at the regional level, building on the structure of the Cohesion Policies and of the Framework Programmes for innovation.
Understanding the potential for green specialization, hence, is as important as understanding the lack of potential. In fact, the nexus between technological developments, productivity, employment, should eventually translate in productivity gains and eventually green growth. Achieving green jobs creation and broader socio-economic objectives will be pivotal (Pahle et al., 2016) [37], and should remain the aim of industrial policies (Aiginger and Rodrik, 2020) [38]. While being beyond the scope of this paper, the employment effects of decarbonization in carbon-intensive and lagging regions must be kept in great consideration for the success of industrial policy (Rodrik, 2014; Cosbey et al., 2017; Pegels et al., 2018) [36,39,40].
The second part of this study, instead, makes an exploratory contribution to the debate around a horizontal green industrial policy for regions, with a purely data-driven approach. We find an association between revealed advantages in low-carbon products for regions with a higher activity rate for people who have a level of education above upper secondary, and a greater presence of science and technology knowledge-intensive workers. These results are also in line with those for Brazil, presented by Dordmond et al. (2020) [17], explaining how the levels of economic complexity are closely related to the specialisation of the labour market into green jobs. In addition, in terms of labour markets, we have evidence of this association where the total duration of employment is longer. In terms of R&D spending, the correlations seem to be significant for both public general spending in R&D, as well as expenditure in the private sector and in higher education institutions.
The results from this second stage, although based on a novel methodology, are quite expected and in line with the common understanding of horizontal (green) industrial policy (Cosbey et al., 2017) [36]. While being intuitively very reasonable, they are subject to strong limitations due to data availability and are far from a causal empirical analysis of industrial policy (Lane, 2020) [41]. Yet, we argue that the novel methodological approach allows a more rigorous third-stage aiming at causal inference. Further research, in this sense, grounded in granular complexity-based analysis, has clear policy relevance and could provide a smart direction for fostering low-carbon innovation across Europe.

Author Contributions

Conceptualization, G.Z. and E.B.; methodology, G.Z. and E.B.; software, E.B.; formal analysis, E.B.; investigation, E.B.; resources, E.B.; data curation, E.B.; writing—original draft preparation, E.B.; writing—review and editing, E.B. and G.Z.; visualization, E.B.; supervision, G.Z. All authors have read and agreed to the published version of the manuscript.

Funding

This research received no external funding.

Acknowledgments

The authors would like to thank Donovan Tokuyama for the excellent research assistance, and Robert Kalcik and Catarina Midões for their fundamental inputs and suggestions. Furthermore, they would like to thank Antoine Mathieu-Collin, Alexander Roth, and Reinhilde Veugelers for their valuable comments.

Conflicts of Interest

The authors declare no conflict of interest.

Appendix A. Green Technologies Definition

Table A1. List of CPC-Y codes for low-carbon technologies definitions.
TechnologyCPC-Y Codes (Patents)
Solar PVY02E1050, Y02E1052, Y02E1054, Y02E10541, Y02E10542, Y02E10543, Y02E10544, Y02E10545, Y02E10546, Y02E10547, Y02E10548, Y02E10549, Y02E1056, Y02E10563, Y02E10566, Y02E1058
Solar ThermalY02E1040, Y02E1041, Y02E1042, Y02E1043, Y02E1044, Y02E1045, Y02E1046, Y02E10465, Y02E1047
WindY02E1070, Y02E1072, Y02E10721, Y02E10722, Y02E10723, Y02E10725, Y02E10726, Y02E10727, Y02E10728, Y02E1074, Y02E1076, Y02E10763, Y02E10766
HydroY02E1020, Y02E1022, Y02E10223, Y02E10226, Y02E1028
Energy managementY02B7030, Y02B7032, Y02B703208, Y02B703216, Y02B703225, Y02B703233, Y02B703241, Y02B70325, Y02B703258, Y02B703266, Y02B703275, Y02B703283, Y02B703291, Y02B7034, Y02B70343, Y02B70346
LightingY02B2010, Y02B2012, Y02B20125, Y02B2014, Y02B20142, Y02B20144, Y02B20146, Y02B20148, Y02B2016, Y02B2018, Y02B20181, Y02B20183, Y02B20185, Y02B20186, Y02B20188, Y02B2019, Y02B2020, Y02B20202, Y02B20204, Y02B20206, Y02B20208, Y02B2022, Y02B2030, Y02B2032, Y02B20325, Y02B2034, Y02B20341, Y02B20342, Y02B20343, Y02B20345, Y02B20346, Y02B20347, Y02B20348, Y02B2036, Y02B2038, Y02B20383, Y02B20386, Y02B2040, Y02B2042, Y02B2044, Y02B20445, Y02B2046, Y02B2048, Y02B2070, Y02B2072
Heating and coolingY02B3008, Y02B3010, Y02B30102, Y02B30104, Y02B30106, Y02B30108, Y02B3012, Y02B30123, Y02B30126, Y02B3014, Y02B3016, Y02B3018, Y02B3020, Y02B3022, Y02B3024, Y02B3026, Y02B3028, Y02B3050, Y02B3052, Y02B3054, Y02B30542, Y02B30545, Y02B30547, Y02B3056, Y02B30563, Y02B30566, Y02B3060, Y02B3062, Y02B30625, Y02B3064, Y02B3066, Y02B3070, Y02B3072, Y02B3074, Y02B30741, Y02B30743, Y02B30745, Y02B30746, Y02B30748, Y02B3076, Y02B30762, Y02B30765, Y02B30767, Y02B3078, Y02B3080, Y02B3090, Y02B3092, Y02B3094
CombustionY02B8010, Y02B8012, Y02B8014, Y02B8020, Y02B8022, Y02B8024, Y02B8026, Y02B8028, Y02B8030, Y02B8032, Y02B8034, Y02B8040, Y02B8050
Residential insulationY02E2010, Y02E2012, Y02E2014, Y02E2016, Y02E2018, Y02E2030, Y02E2032, Y02E20322, Y02E20324, Y02E20326, Y02E20328, Y02E2034, Y02E20342, Y02E20346, Y02E20348, Y02E2036, Y02E20363, Y02E20366, Y02E20185, Y02E20344
BiofuelsY02E5010, Y02E5011, Y02E5012, Y02E5013, Y02E5014, Y02E5015, Y02E5016, Y02E5017, Y02E5018, Y02E5030, Y02E5032, Y02E5034, Y02E50343, Y02E50346
BatteriesY02E6012, Y02E60122, Y02E60124, Y02E60126, Y02E60128, Y02T1070, Y02T107005, Y02T107011, Y02T107016, Y02T107022, Y02T107027, Y02T107033, Y02T107038, Y02T107044, Y02T10705, Y02T107055, Y02T107061, Y02T107066, Y02T107072, Y02T107077, Y02T107083, Y02T107088, Y02T107094, Y02T1072, Y02T107208, Y02T107216, Y02T107225, Y02T107233, Y02T107241, Y02T10725, Y02T107258, Y02T107266, Y02T107275, Y02T107283, Y02T107291
Electric carsY02T1064, Y02T10641, Y02T10642, Y02T10643, Y02T10644, Y02T10645, Y02T10646, Y02T10647, Y02T10648, Y02T10649, Y02T1062, Y02T106204, Y02T106208, Y02T106213, Y02T106217, Y02T106221, Y02T106226, Y02T10623, Y02T106234, Y02T106239, Y02T106243, Y02T106247, Y02T106252, Y02T106256, Y02T10626, Y02T106265, Y02T106269, Y02T106273, Y02T106278, Y02T106282, Y02T106286, Y02T106291, Y02T106295
Rail transportY02T3000, Y02T3010, Y02T3012, Y02T3014, Y02T3016, Y02T3018, Y02T3030, Y02T3032, Y02T3034, Y02T3036, Y02T3038, Y02T3040, Y02T3042
NuclearY02E3030, Y02E3031, Y02E3032, Y02E3033, Y02E3034, Y02E3035, Y02E3037, Y02E3038, Y02E3039, Y02E3040

Appendix B. Imputation Methodology

Multiple Imputation by Chained Equations (MICE) is a data imputation algorithm which can attempt to capture the uncertainty associated with missing data values by “randomly drawing multiple imputations from a distribution of imputations and also by introducing additional error variance to each imputation”. MICE assumes that data is missing at random (MAR), meaning that the presence of an underlying relationship between the propensity of a region to be missing data and the value of the missing data causes any results taken from imputation to be problematic (i.e., due to estimator bias). Additionally, MICE fails when imputing on non-invertible matrices. Therefore, it is important to reduce collinearity as much as possible prior to imputation.
Given the poor performance of advanced imputation methods on high-dimensional low-rank matrices, we first hand-select indicators based on the domain knowledge. We reduce the total number of collected indicators, with respect to the indiscriminate scraping, from 476 to 245, by removing, for example, similar measures of population density, broken down by different demographic. Additionally, we remove regions defined as extra NUTS2 regions (encoded with a ZZ). We also remove overseas territories (e.g., PT20 or FRY1) or regions with NUTS2 codes that have been replaced (e.g., UKI1 or IE01), but persist in Eurostat or Urban Data Platform databases.
Further, these methods often utilize linear regressions to estimate missing values and lose a great deal of stability above certain thresholds of missingness. Addo (2018) [42], showed that MICE imputation using non-Bayesian linear regression exhibits stability for datasets missing up to 50% of observations. For our purposes, we place this threshold at 30% to get a dataset of 110 indicators for 258 NUTS2 regions.
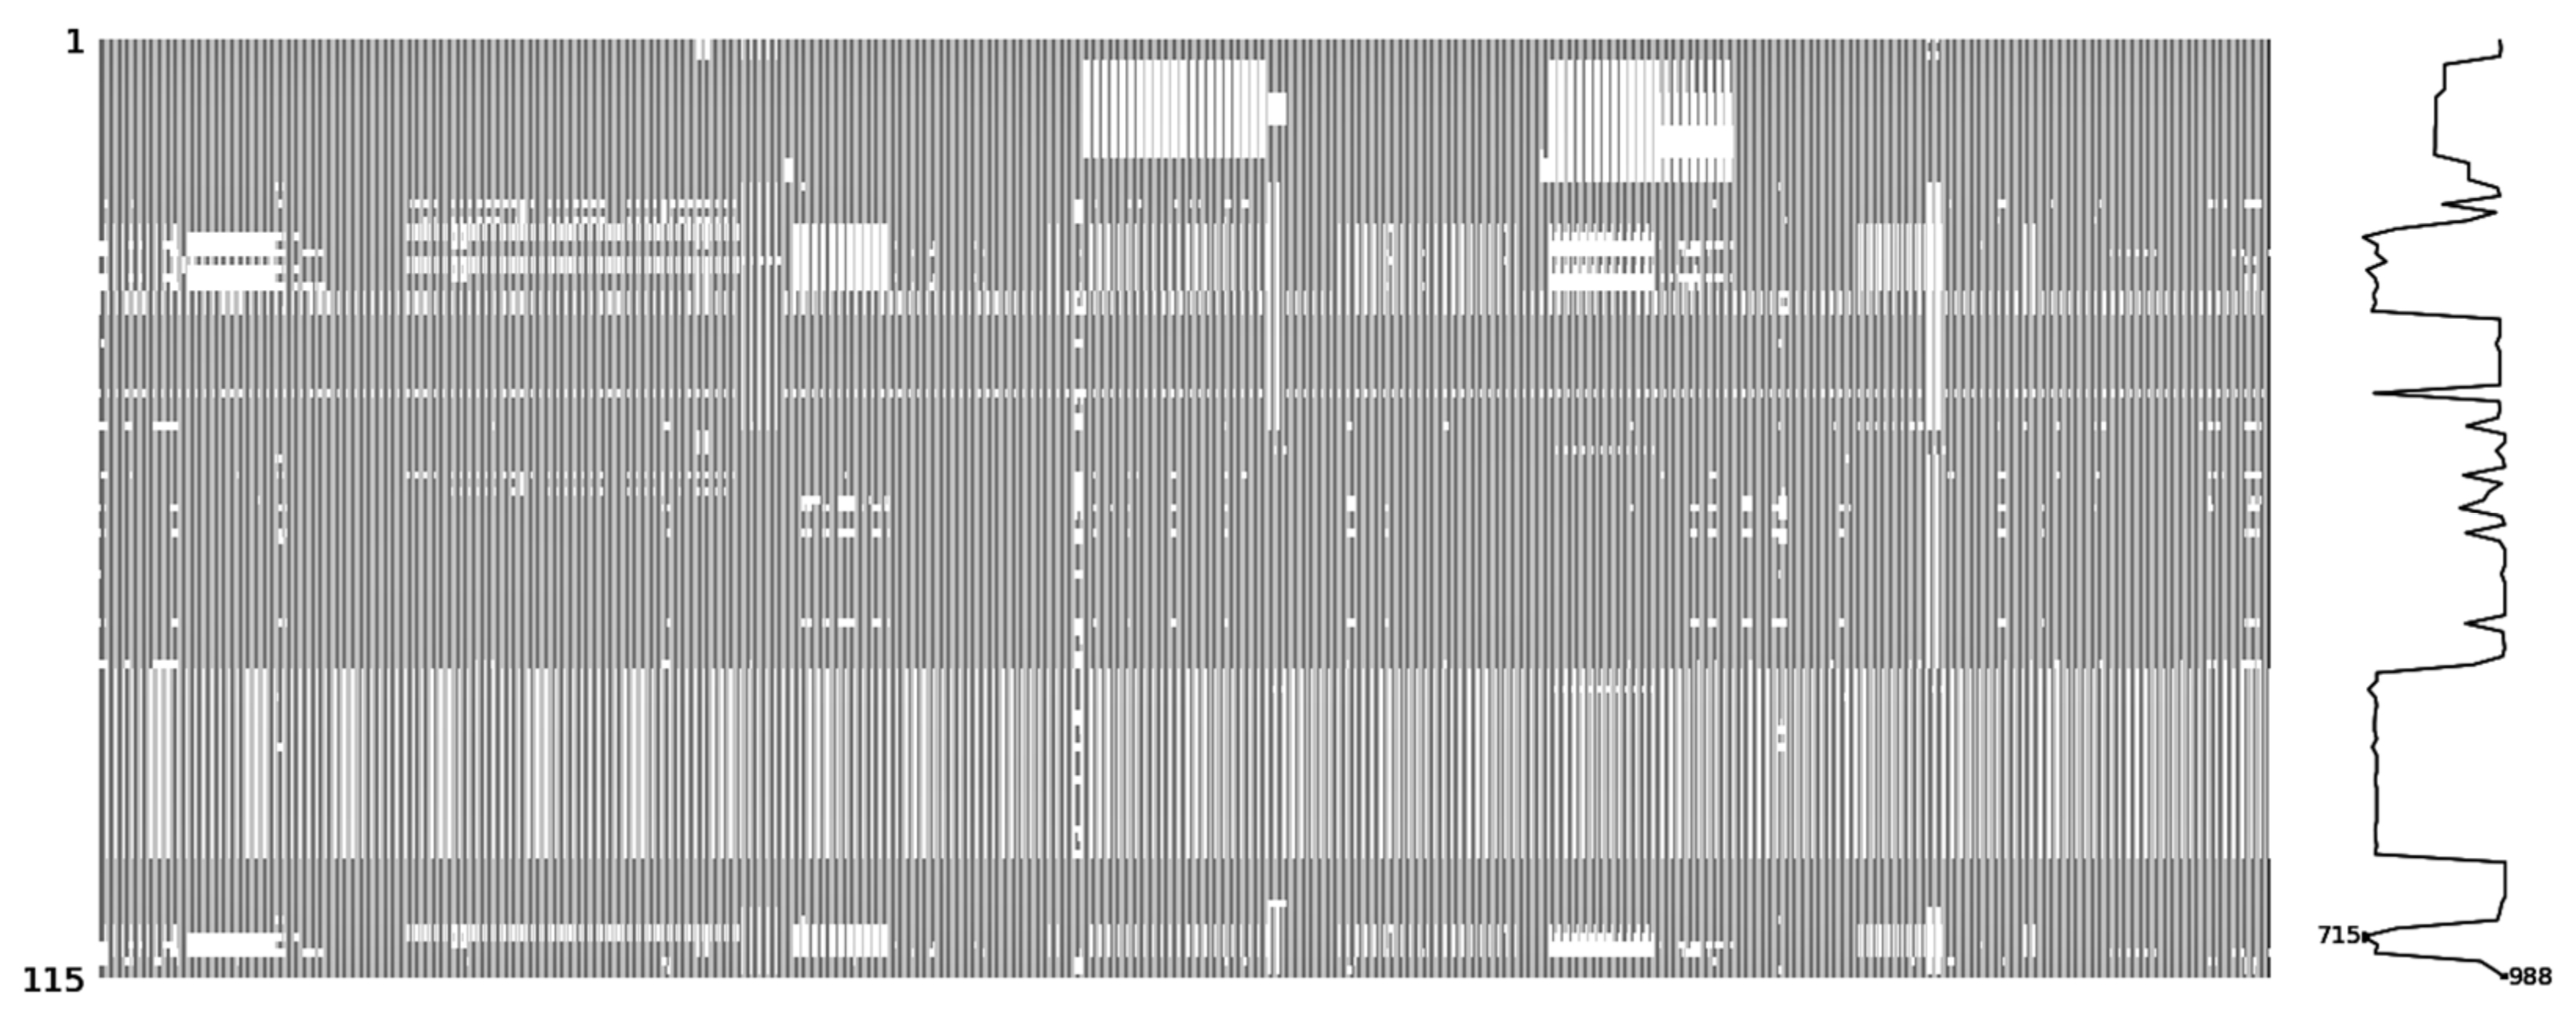
Figure A1. Visualization of the dataset with missing data is shown in white. Horizontal patterns of missingness indicate data missing across regions while vertical patterns indicate missingness within a region.
Sustainability 13 00032 g0a1
Using the Python missing data visualization package missingno, we examine our dataset for patterns which might invalidate the MAR assumption. Investigation shows that several areas of missingness can be attributed to lack of availability (i.e., Denmark in 2005). Given these patterns and the completeness of the remaining data, we proceed under MAR assumptions and impute with MICE.
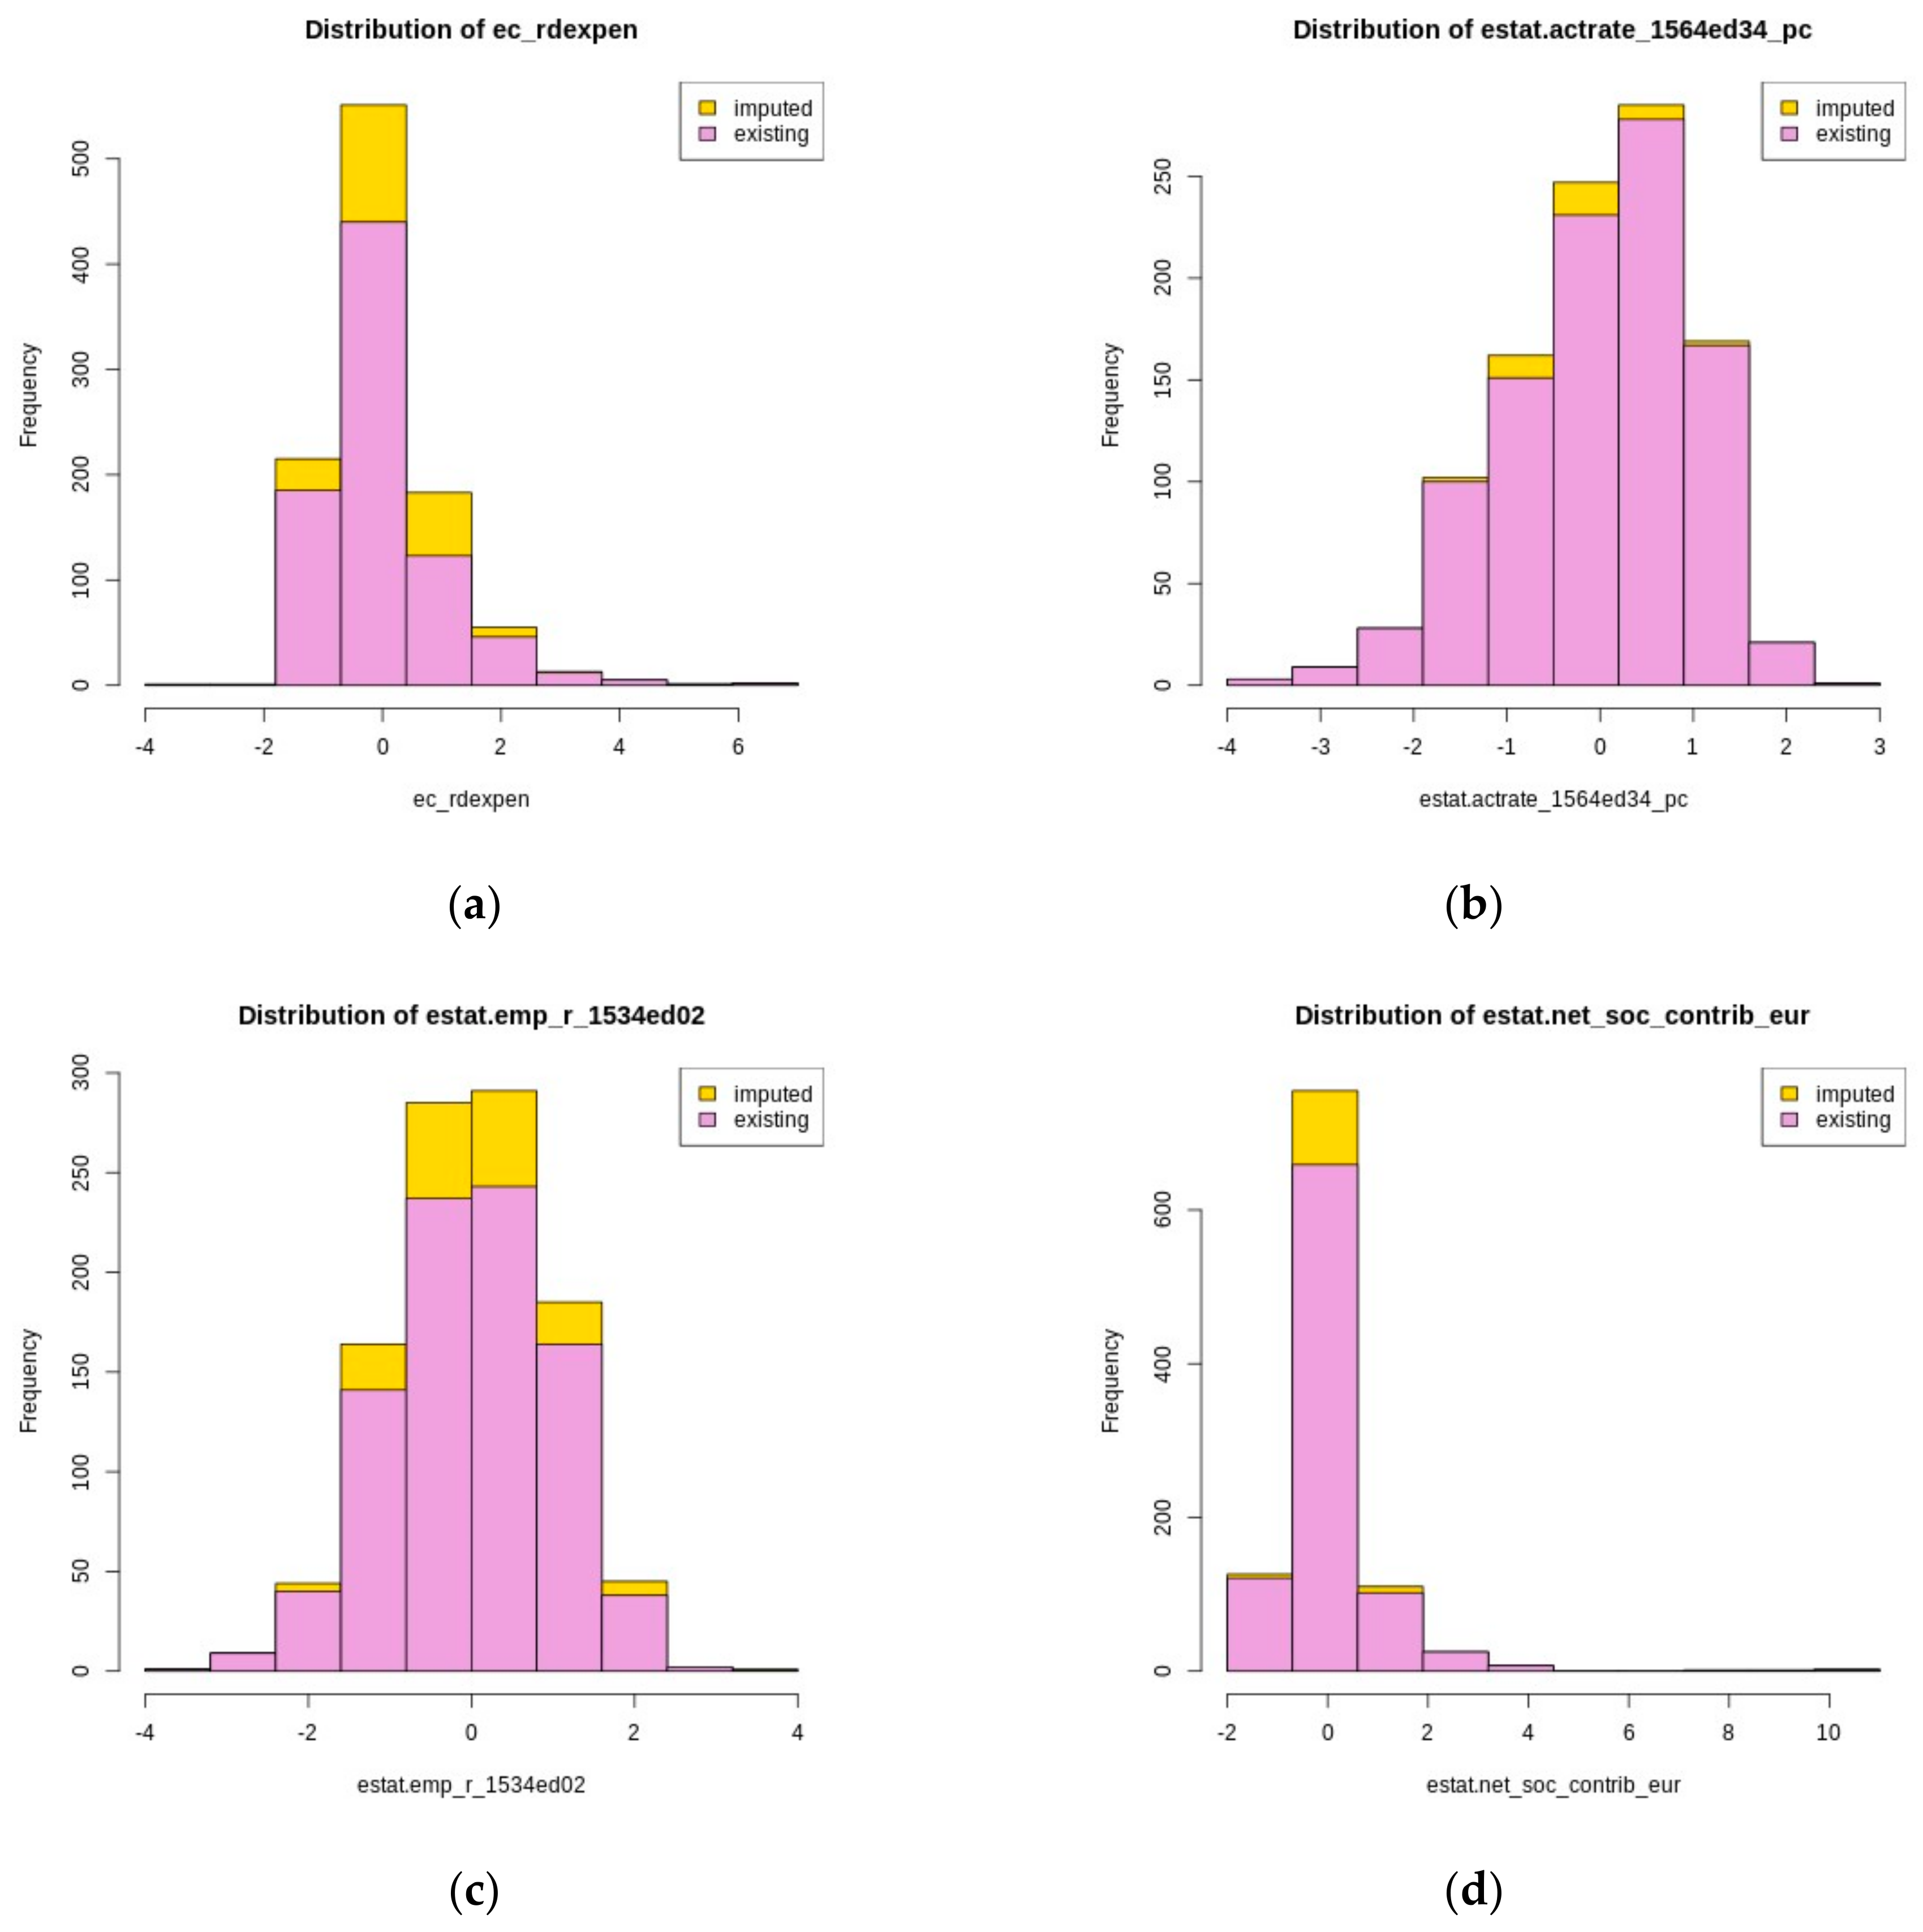
In line with MICE common practice, we first allow the algorithm to identify constant or collinear variables which could present problems during the imputation step. Three covariates are identified as being collinear and are removed. We then impute using MICE using non-Bayesian linear regression. See Figure A2 for histograms showing the results of imputation on selected covariates.
Figure A2. Distributions of selected variables before and after imputation. (a) R&D expenditure, (b) Activity rate of highly-skilled individuals, (c) Employment of low-skilled individuals, (d) Net social-security contributions in Euros.
Sustainability 13 00032 g0a2
A limiting factor for this paper, related to the data availability problem, MICE imputation assumes that the absence mechanism of the underlying data is MAR. This would imply, conditional on our observed values, that the values of missing data have no relation to the missing data. After reviewing the patterns of missing data by indicator, region and time, it could be argued that absence is heterogeneous in its mechanism, with some being MAR and others being missing not at random (MNAR). Given a high proportion of missing data being consolidated across similar indicators and time periods, we felt comfortable making a blanket MAR assumption; however, a much closer evaluation of missing data should be performed to confirm this assumption.

Appendix C. Regional Potential in Low-Carbon Technologies
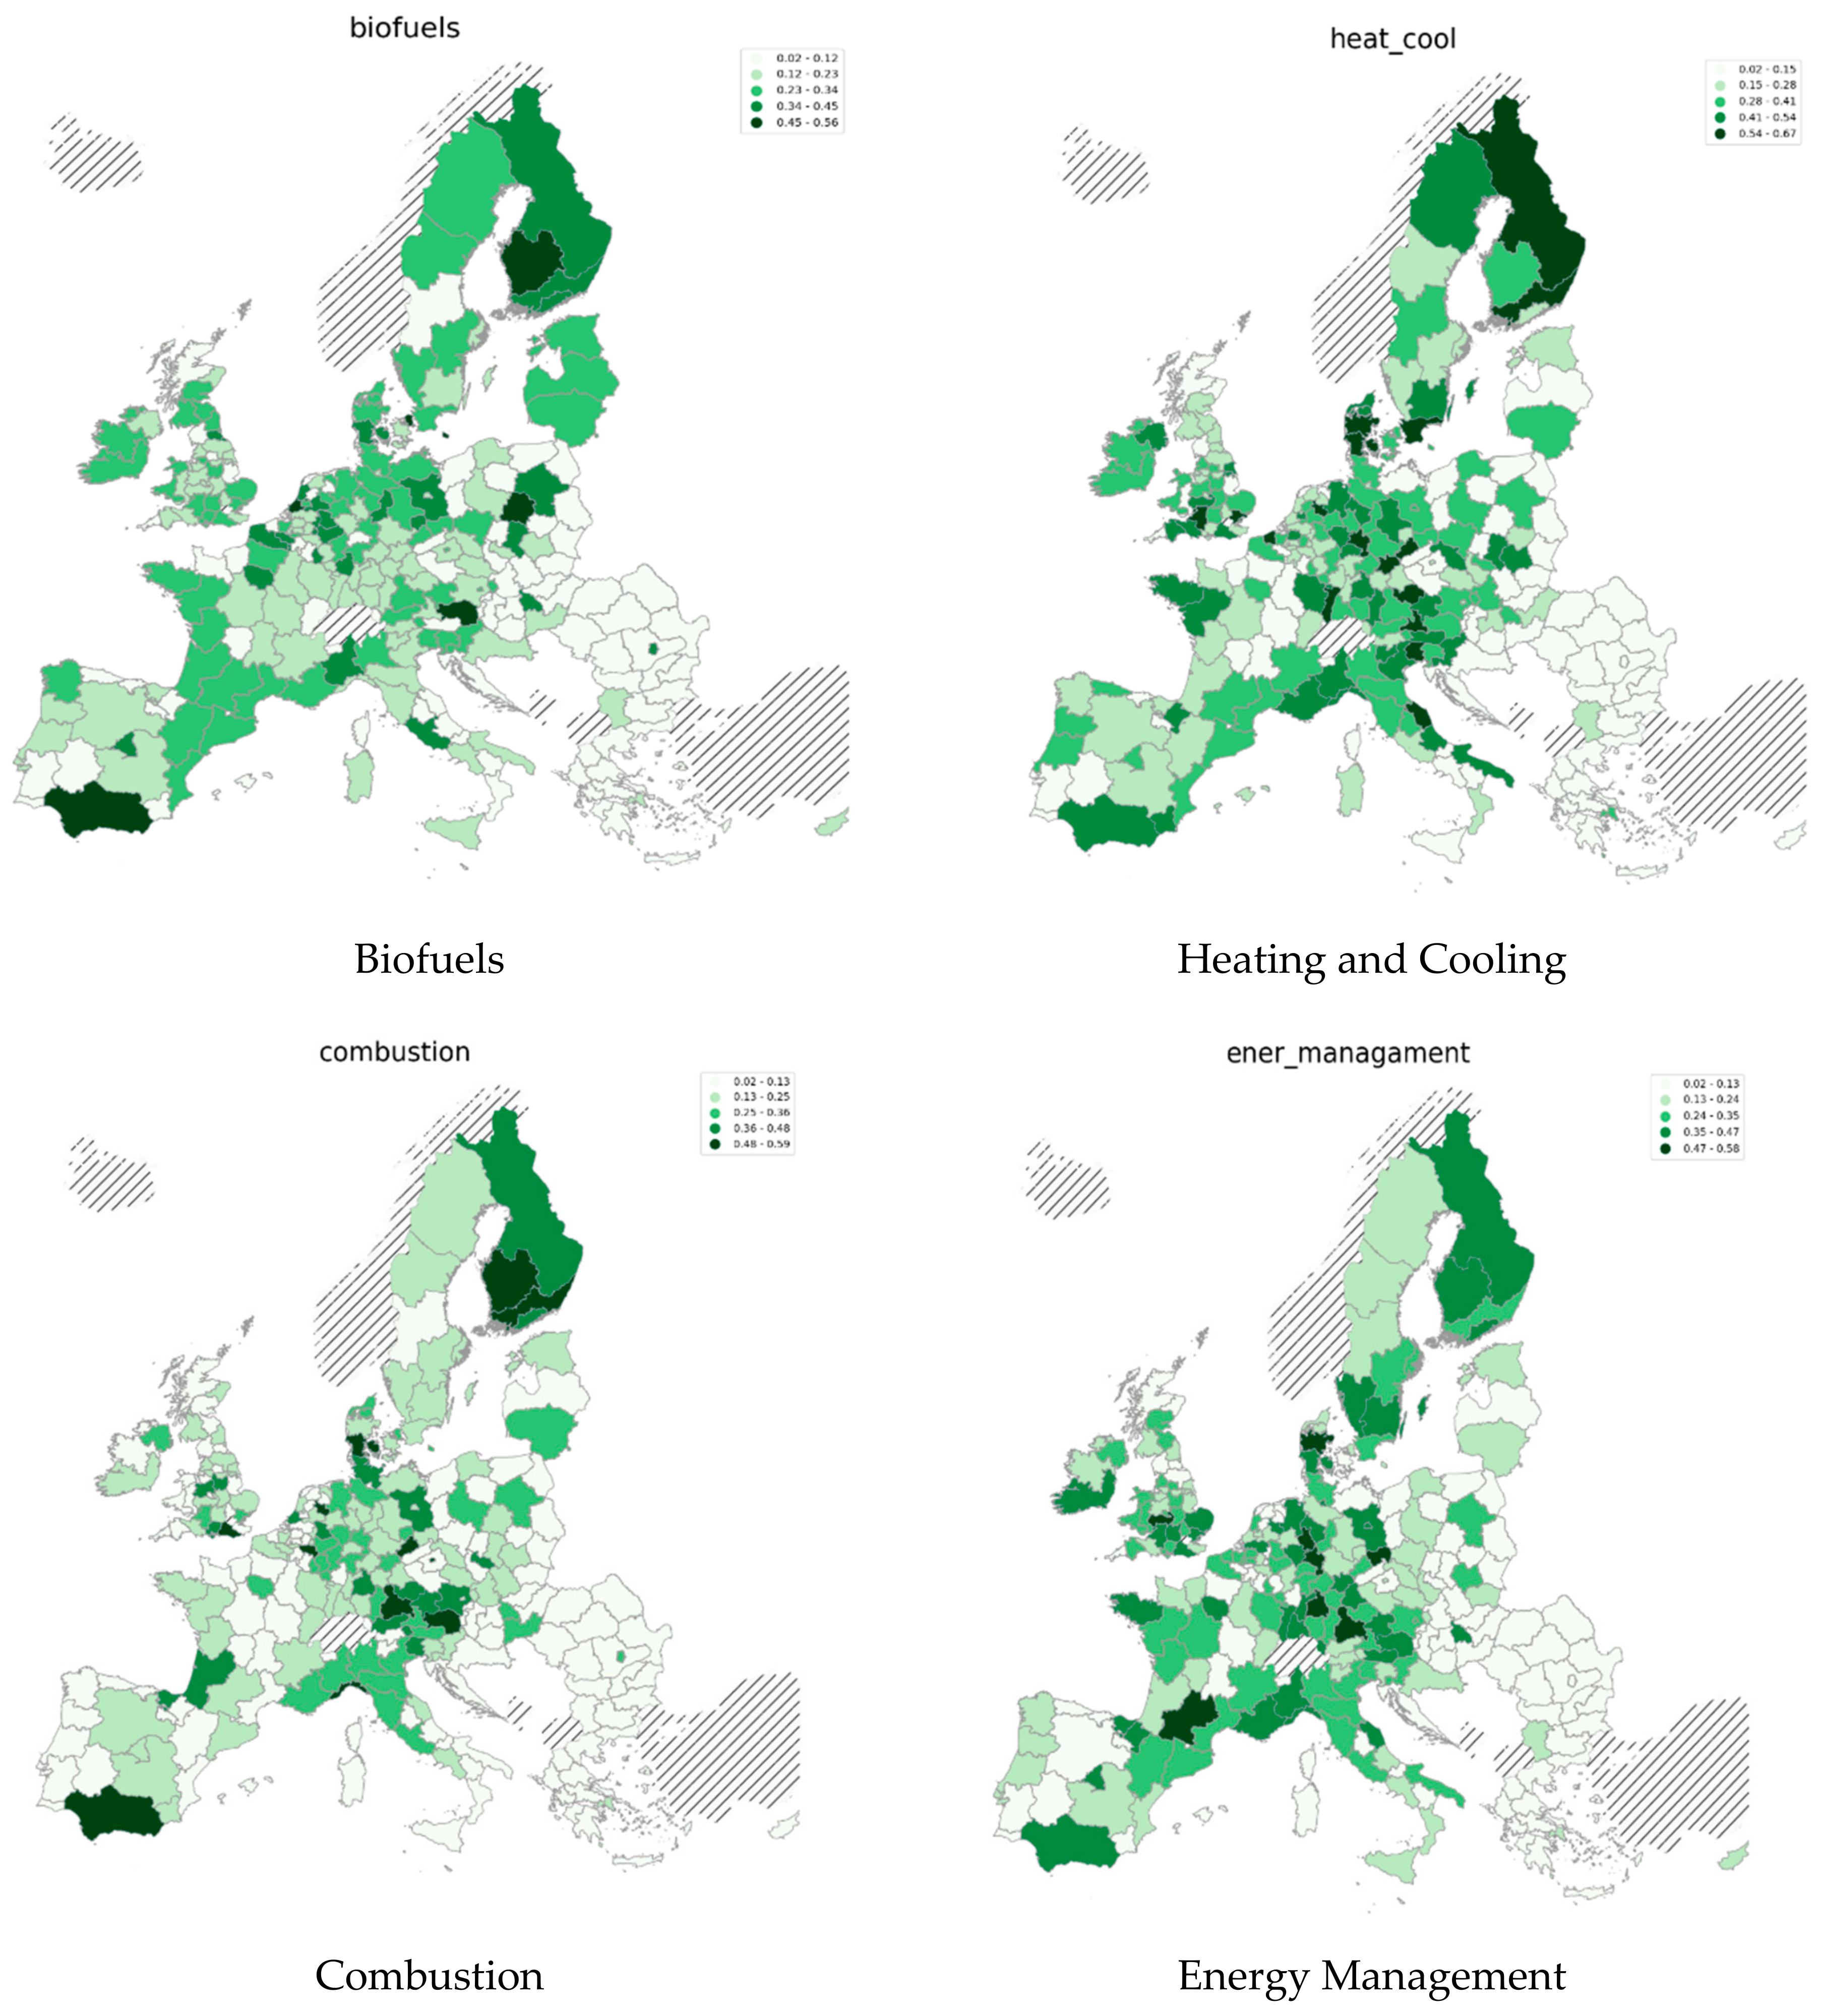
Figure A3. Potential in low-carbon technologies for EU regions (2019).
Sustainability 13 00032 g0a3aSustainability 13 00032 g0a3bSustainability 13 00032 g0a3c

Appendix D. Regularisation Results

Table A2. Cross-sectional estimation 2012.
tt − 1t − 2All
Activity rates by age education attainment level and citizenship 15162152
Total duration13211448
Scientists and engineers47718
HH Paid current taxes on income wealth etc. mil EUR56516
HH Social benefits other than social transfers in kind received mil EUR58316
Persons employed in science and technology82414
Long term unemployment (12 months or longer) in thousands63514
Unemployment rate by age45514
Average number of usual weekly hours in the main job by age in hours61512
Participation rate in education and training (last 4 weeks) total age 25–6406511
Gross domestic expenditure on R&D million EUR government56011
Self-employed persons24511
HH Net social contributions mil EUR34411
Gross domestic expenditure on R&D million EUR business enterprise sector64010
Table A3. Cross-sectional estimation 2015.
tt − 1t − 2All
Activity rates by age education attainment level and citizenship 12141339
Total duration11121033
Scientists and engineers67518
Average number of usual weekly hours in the main job by age in hours74516
Persons employed in science and technology84416
HH Paid current taxes on income wealth etc. mil EUR46414
Long term unemployment (12 months or longer) in thousands72413
Self-employed persons32611
Proportion of population aged 20–3942511
Participation rate in education and training (last 4 weeks) total age 25–6406511
HH Social benefits other than social transfers in kind received mil EUR47011
Gross domestic expenditure on R&D million EUR government83011
Persons with tertiary education (ISCED) and/or employed in science and technology % of the active population2439
Unemployment rate by age2529
Table A4. Fixed effects estimator—Main effects.
tt − 1t − 2All
Total duration12121741
Activity rates ISCED > 311121336
Age dependency ratio (0–19 and over 60 to pop. aged 20–59)45514
Scientists and engineers64414
Long term unemployment (12 months or longer) in thousands62614
Students (ISCED 5–6) at regional level—as % of total country level students (ISCED 5–6)06713
Persons employed in science and technology83213
Gross domestic expenditure on R&D million EUR business enterprise sector 64313
Table A5. Fixed effects estimator—Interactions.
tt − 1t − 1All
Total duration of employment0235
Activity rates ISCED > 32114
HH Net social contributions mil EUR0112
Self-employed persons0202
Total R&D personnel bussiness enterprise sector full time equivalent (FTE)1102
Unemployment Rate (Females)2002

References

  1. Huberty, M.; Zachmann, G. Green exports and the global product space: Prospects for EU industrial policy (No. 2011/07). In Bruegel Working Paper; Bruegel: Brussels, Belgium, 2011. [Google Scholar]
  2. Hidalgo, C.A.; Klinger, B.; Barabasi, A.L.; Hausmann, R. The product space conditions the development of nations. Science 2007, 317, 482–487. [Google Scholar] [CrossRef] [PubMed] [Green Version]
  3. Hamwey, R.; Pacini, H.; Assunção, L. Mapping green product spaces of nations. J. Environ. Dev. 2013, 22, 155–168. [Google Scholar] [CrossRef]
  4. Hidalgo, C.A.; Hausmann, R. The building blocks of economic complexity. Proc. Natl. Acad. Sci. USA 2009, 106, 10570–10575. [Google Scholar] [CrossRef] [PubMed] [Green Version]
  5. Fraccascia, L.; Giannoccaro, I.; Albino, V. Green product development: What does the country product space imply? J. Clean. Prod. 2018, 170, 1076–1088. [Google Scholar] [CrossRef]
  6. Foray, D.; David, P.A.; Hall, B.H. Smart Specialisation from Academic Idea to Political Instrument, the Surprising Career of a Concept and the Difficulties Involved in Its Implementation (No. REP_WORK); EPFL: Lusanne, Switzerland, 2011. [Google Scholar]
  7. Balland, P.A.; Boschma, R.; Crespo, J.; Rigby, L.D. Smart specialization policy in the European Union: Relatedness, knowledge complexity and regional diversification. Reg. Stud. 2019, 53, 1252–1268. [Google Scholar] [CrossRef] [Green Version]
  8. Crespo, J.; Balland, P.A.; Boschma, R.; Rigby, D. Regional Diversification Opportunities and Smart Specialization Strategies; European Commission: Brussels, Belgium, 2017; Available online: https://ec.europa.eu/research/openvision/pdf/rise/crespo-balland-boschma-rigby_regional_diversification.pdf (accessed on 20 December 2020).
  9. Zachmann, G.; Roth, A. Report on Assessing the Technology Innovation Implications of NDCs, Technology Portfolio Choices, and International Competitiveness in Clean Technologies V2.0–Final–01/08/2018. Available online: https://www.cop21ripples.eu/wp-content/uploads/2018/08/RIPPLES_D3.3.pdf (accessed on 20 December 2020).
  10. Mealy, P.; Teytelboym, A. Economic complexity and the green economy. Res. Policy 2020, 103948. [Google Scholar] [CrossRef]
  11. Van Den Berge, M.; Weterings, A. Relatedness in eco-technological development in European regions. Pap. Evol. Econ. Geogr. 2014, 14, 1–30. [Google Scholar]
  12. Montresor, S.; Quatraro, F. Green technologies and Smart Specialisation Strategies: A European patent-based analysis of the intertwining of technological relatedness and key enabling technologies. Reg. Stud. 2020, 54, 1354–1365. [Google Scholar] [CrossRef] [Green Version]
  13. Boschma, R.; Frenken, K. The emerging empirics of evolutionary economic geography. J. Econ. Geogr. 2011, 11, 295–307. [Google Scholar] [CrossRef] [Green Version]
  14. Hausmann, R.; Hidalgo, C.; Stock, D.; Yildirim, M.A. Implied Comparative Advantage; Center for International Development, Harvard University: Cambridge, MA, USA, 2019. [Google Scholar]
  15. Boschma, R.; Gianelle, C. Regional Branching and Smart Specialization Policy; JRC Technical Reports; 06/2104; Publications Office of the European Union: Luxembourg, 2013. [Google Scholar]
  16. Santoalha, A.; Boschma, R. Diversifying in green technologies in European regions: Does political support matter? Reg. Stud. 2020, 1–14. [Google Scholar] [CrossRef] [Green Version]
  17. Dordmond, G.; de Oliveira, H.C.; Silva, I.R.; Swart, J. The complexity of green job creation: An analysis of green job development in Brazil. Environ. Dev. Sustain. 2020, 1–24. [Google Scholar] [CrossRef]
  18. Shutters, S.T.; Muneepeerakul, R.; Lobo, J. How hard is it for urban economies to become ‘green’? Environ. Plan. B Plan. Des. 2016, 43, 198–209. [Google Scholar] [CrossRef]
  19. Fiorini, A.; Georgakaki, A.; Pasimeni, F.; Tzimas, E. Monitoring R&I in Low-Carbon Energy Technologies; Publications Office of the European Union: Luxembourg, 2017. [Google Scholar]
  20. Yan, B.; Luo, J. Measuring technological distance for patent mapping. J. Assoc. Inf. Sci. Technol. 2017, 68, 423–437. [Google Scholar] [CrossRef] [Green Version]
  21. Stellner, F. Technological distance measures: Theoretical foundation and empirics. In Proceedings of the DRUID Society Conference, Copenhagen, Denmark, 16–18 June 2014. [Google Scholar]
  22. Ospina, R.; Ferrari, S.L. A general class of zero-or-one inflated beta regression models. Comput. Stat. Data Anal. 2012, 56, 1609–1623. [Google Scholar] [CrossRef] [Green Version]
  23. Zou, H.; Hastie, T. Regularization and variable selection via the elastic net. J. R. Stat. Soc. Ser. B Stat. Methodol. 2005, 67, 301–320. [Google Scholar] [CrossRef] [Green Version]
  24. Imai, K.; Kim, I.S. On the Use of Two-Way Fixed Effects Regression Models for Causal Inference with Panel Data; Harvard University: Cambridge, MA, USA, 2018. [Google Scholar]
  25. Giesselmann, M.; Schmidt-Catran, A. Interactions in Fixed Effects Regression Models. Sociol. Methods Res. 2018. [Google Scholar] [CrossRef]
  26. Ghisetti, C.; Marzucchi, A.; Montresor, S. The open eco-innovation mode. An empirical investigation of eleven European countries. Res. Policy 2015, 44, 1080–1093. [Google Scholar] [CrossRef]
  27. Barbieri, N.; Marzucchi, A.; Rizzo, U. Knowledge sources and impacts on subsequent inventions: Do green technologies differ from non-green ones? Res. Policy 2020, 49, 103901. [Google Scholar] [CrossRef]
  28. Mariani, M.S.; Medo, M.; Lafond, F. Early identification of important patents: Design and validation of citation network metrics. Technol. Forecast. Soc. Chang. 2019, 146, 644–654. [Google Scholar] [CrossRef] [Green Version]
  29. Wu, C.C.; Yao, C.B. Constructing an intelligent patent network analysis method. Data Sci. J. 2012, 11, 110–125. [Google Scholar] [CrossRef] [Green Version]
  30. Song, B.; Triulzi, G.; Alstott, J.; Yan, B.; Luo, J. Overlay patent network to analyze the design space of a technology domain: The case of hybrid electrical vehicles. In Proceedings of the DESIGN 2016 14th International Design Conference, Dubrovnik, Croatia, 16–19 May 2016; pp. 1145–1154. [Google Scholar]
  31. Martin, S.; Brown, W.M.; Klavans, R.; Boyack, K.W. OpenOrd: An open-source toolbox for large graph layout. In Proceedings Volume 7868, Visualization and Data Analysis 2011; International Society for Optics and Photonics: Bellingham, WA, USA, 2011. [Google Scholar]
  32. Calignano, G.; Trippl, M. Innovation-Driven or Challenge-Driven Participation in International Energy Innovation Networks? Empirical Evidence from the H2020 Programme. Sustainability 2020, 12, 4696. [Google Scholar] [CrossRef]
  33. Barca, F. Agenda for a Reformed Cohesion Policy; European Communities: Brussels, Belgium, 2009. [Google Scholar]
  34. Capasso, M.; Hansen, T.; Heiberg, J.; Klitkou, A.; Steen, M. Green growth–A synthesis of scientific findings. Technol. Forecast. Soc. Chang. 2019, 146, 390–402. [Google Scholar] [CrossRef]
  35. Fankhauser, S.; Bowen, A.; Calel, R.; Dechezleprêtre, A.; Grover, D.; Rydge, J.; Sato, M. Who will win the green race? In search of environmental competitiveness and innovation. Glob. Environ. Chang. 2013, 23, 902–913. [Google Scholar] [CrossRef] [Green Version]
  36. Cosbey, A.; Wooders, P.; Bridle, R.; Casier, L. In with the good, out with the bad: Phasing out polluting sectors as green industrial policy. In Green Industrial Policy. Concept, Policies, Country Experiences; UN Environment: Geneva, Switzerland; Bonn, Germany, 2017. [Google Scholar]
  37. Pahle, M.; Pachauri, S.; Steinbacher, K. Can the Green Economy deliver it all? Experiences of renewable energy policies with socio-economic objectives. Appl. Energy 2016, 179, 1331–1341. [Google Scholar] [CrossRef] [Green Version]
  38. Aiginger, K.; Rodrik, D. Rebirth of Industrial Policy and an Agenda for the Twenty-First Century. J Ind Compet Trade 2020, 189–207. [Google Scholar] [CrossRef] [Green Version]
  39. Rodrik, D. Green industrial policy. Oxf. Rev. Econ. Policy 2014, 30, 469–491. [Google Scholar] [CrossRef]
  40. Pegels, A.; Vidican-Auktor, G.; Lütkenhorst, W.; Altenburg, T. Politics of green energy policy. J. Environ. Dev. 2018, 27, 26–45. [Google Scholar] [CrossRef] [Green Version]
  41. Lane, N. The new empirics of industrial policy. J. Ind. Compet. Trade 2020, 20, 209–234. [Google Scholar] [CrossRef]
  42. Addo, E.D. . Performance Comparison of Imputation Algorithms on Missing at Random Data. Master’s Thesis. Electronic Theses and Dissertations, 2018; Paper 3422. Department of Mathematics East Tennessee State University. Available online: https://dc.etsu.edu/etd/3422 (accessed on 20 December 2020).
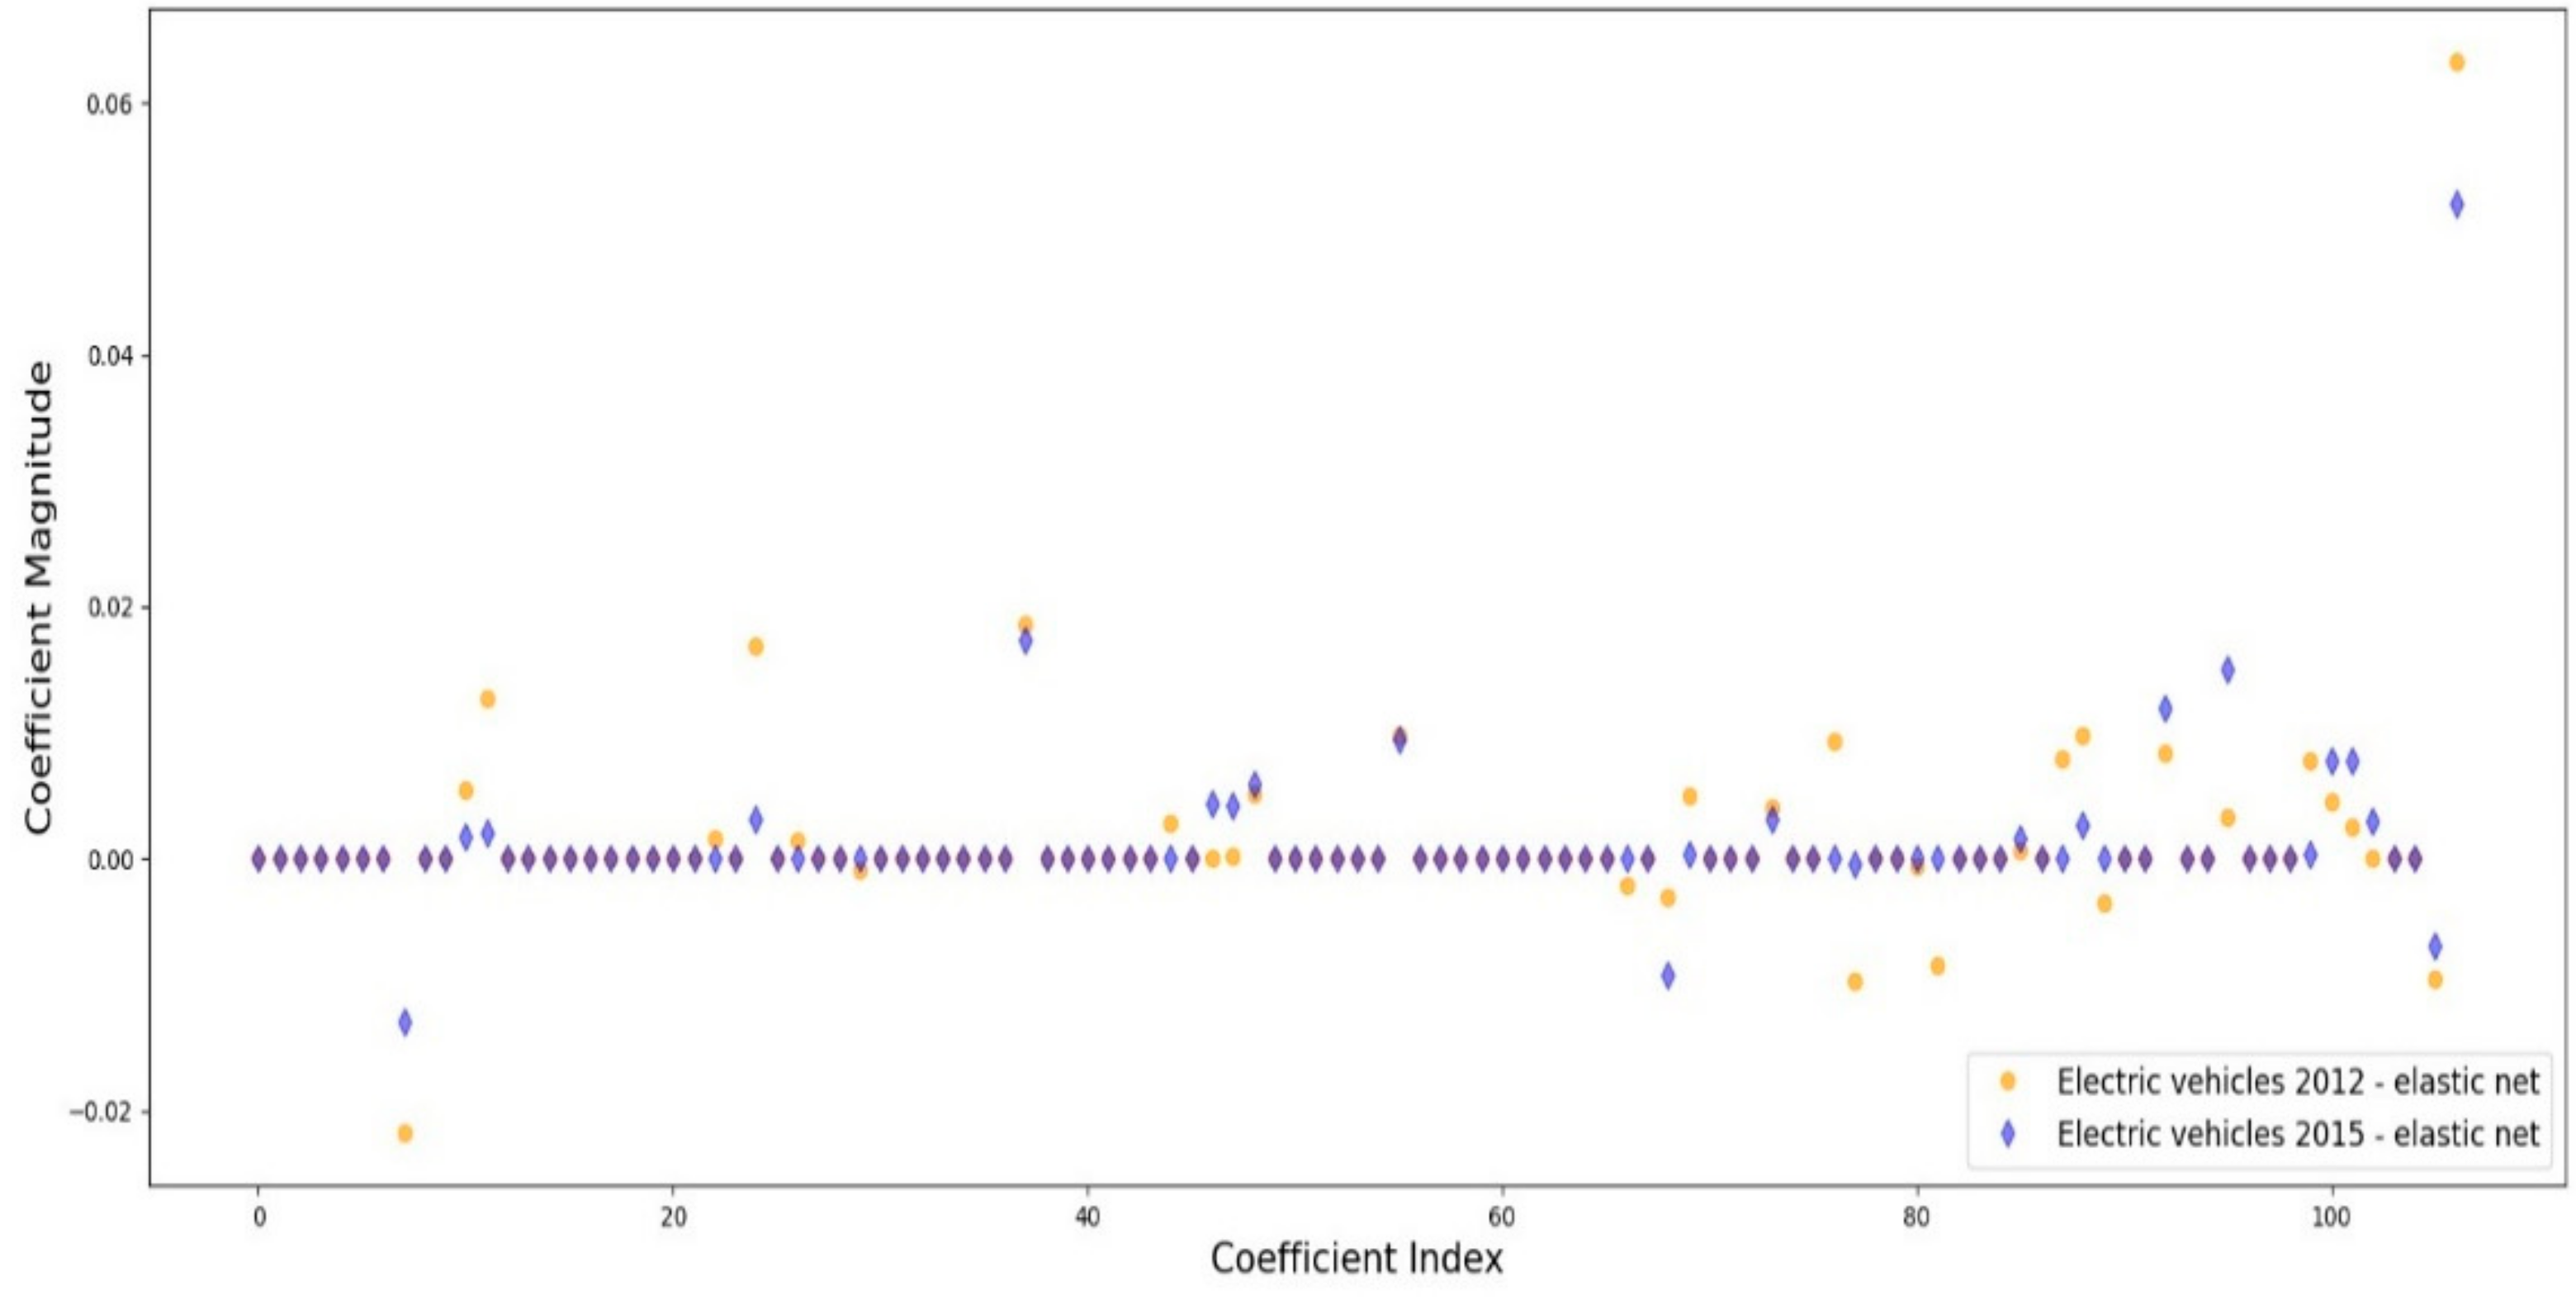
Figure 1. Results of the Elastic net regularization where for electric vehicles in the 2012 (yellow) and 2015 stacks (blue).
Sustainability 13 00032 g001
Figure 2. Revealed and potential technological advantage in nuclear technologies. (a) RTA 2013, (b) pRTA 2019.
Sustainability 13 00032 g002
Figure 3. Revealed and potential technological advantage in wind technologies. (a) RTA 2013, (b) pRTA 2019.
Sustainability 13 00032 g003
Figure 4. Potential technological advantage in 2019. (a) pRTA 2019—Batteries. (b) pRTA 2019—Electric Vehicles. (c) pRTA 2019—Solar and thermal energy. (d) pRTA 2019—Insulation technologies.
Sustainability 13 00032 g004
Figure 5. European product space based on REGPAT 2018.
Sustainability 13 00032 g005
Figure 6. Co-patenting of European regions in low-carbon technologies.
Sustainability 13 00032 g006
Figure 7. Co-patenting for European regions based on Applicant’s location for the period 1990–2016. (a) Batteries. (b) Electric Vehicles. (c) Wind. (d) Nuclear.
Sustainability 13 00032 g007
Table 1. Correlations between revealed and potential advantage with the Regional Innovation Index (European Commission, 2019), across low-carbon technologies.
TechnologypRTA (2019)RTA (2015)
Energy Management0.670.28
Solar Panels0.620.37
Batteries0.600.27
Electric vehicles0.590.34
Lighting0.590.21
Biofuels0.580.46
Heating andcooling0.540.32
Combustion0.530.38
Insulation0.490.30
Rail0.390.28
Solar Thermal0.340.27
Wind0.290.24
Nuclear0.240.25
Hydro0.100.18
Table 2. Cross-sectional estimation 2012.
tt − 1t − 2All
Activity rate of population15162152
Total duration of employment13211448
Scientists and engineers47718
HH Paid current taxes on income wealth etc. mil EUR56516
HH Social benefits other than social transfers in kind received mil EUR58316
Persons employed in science and technology82414
Long term unemployment (12 months or longer) in thousands63514
Unemployment rate by age45514
Highest counts of coefficient survival for the 2012 stack, in an Elastic Net implementation.
Table 3. Cross-sectional estimation 2015.
tt − 1t − 2All
Activity rates of population12141339
Total duration of employment11121033
Scientists and engineers67518
Average number of usual weekly hours in the main job by age in hours74516
Persons employed in science and technology84416
HH Paid current taxes on income wealth etc. mil EUR46414
Long term unemployment (12 months or longer) in thousands72413
Highest counts of coefficient survival for the 2012 stack, in an Elastic Net implementation.
Publisher’s Note: MDPI stays neutral with regard to jurisdictional claims in published maps and institutional affiliations.