A Trade-Off Navigation Framework as a Decision Support for Conflicting Sustainability Indicators within Circular Economy Implementation in the Manufacturing Industry


Abstract
:1. Introduction
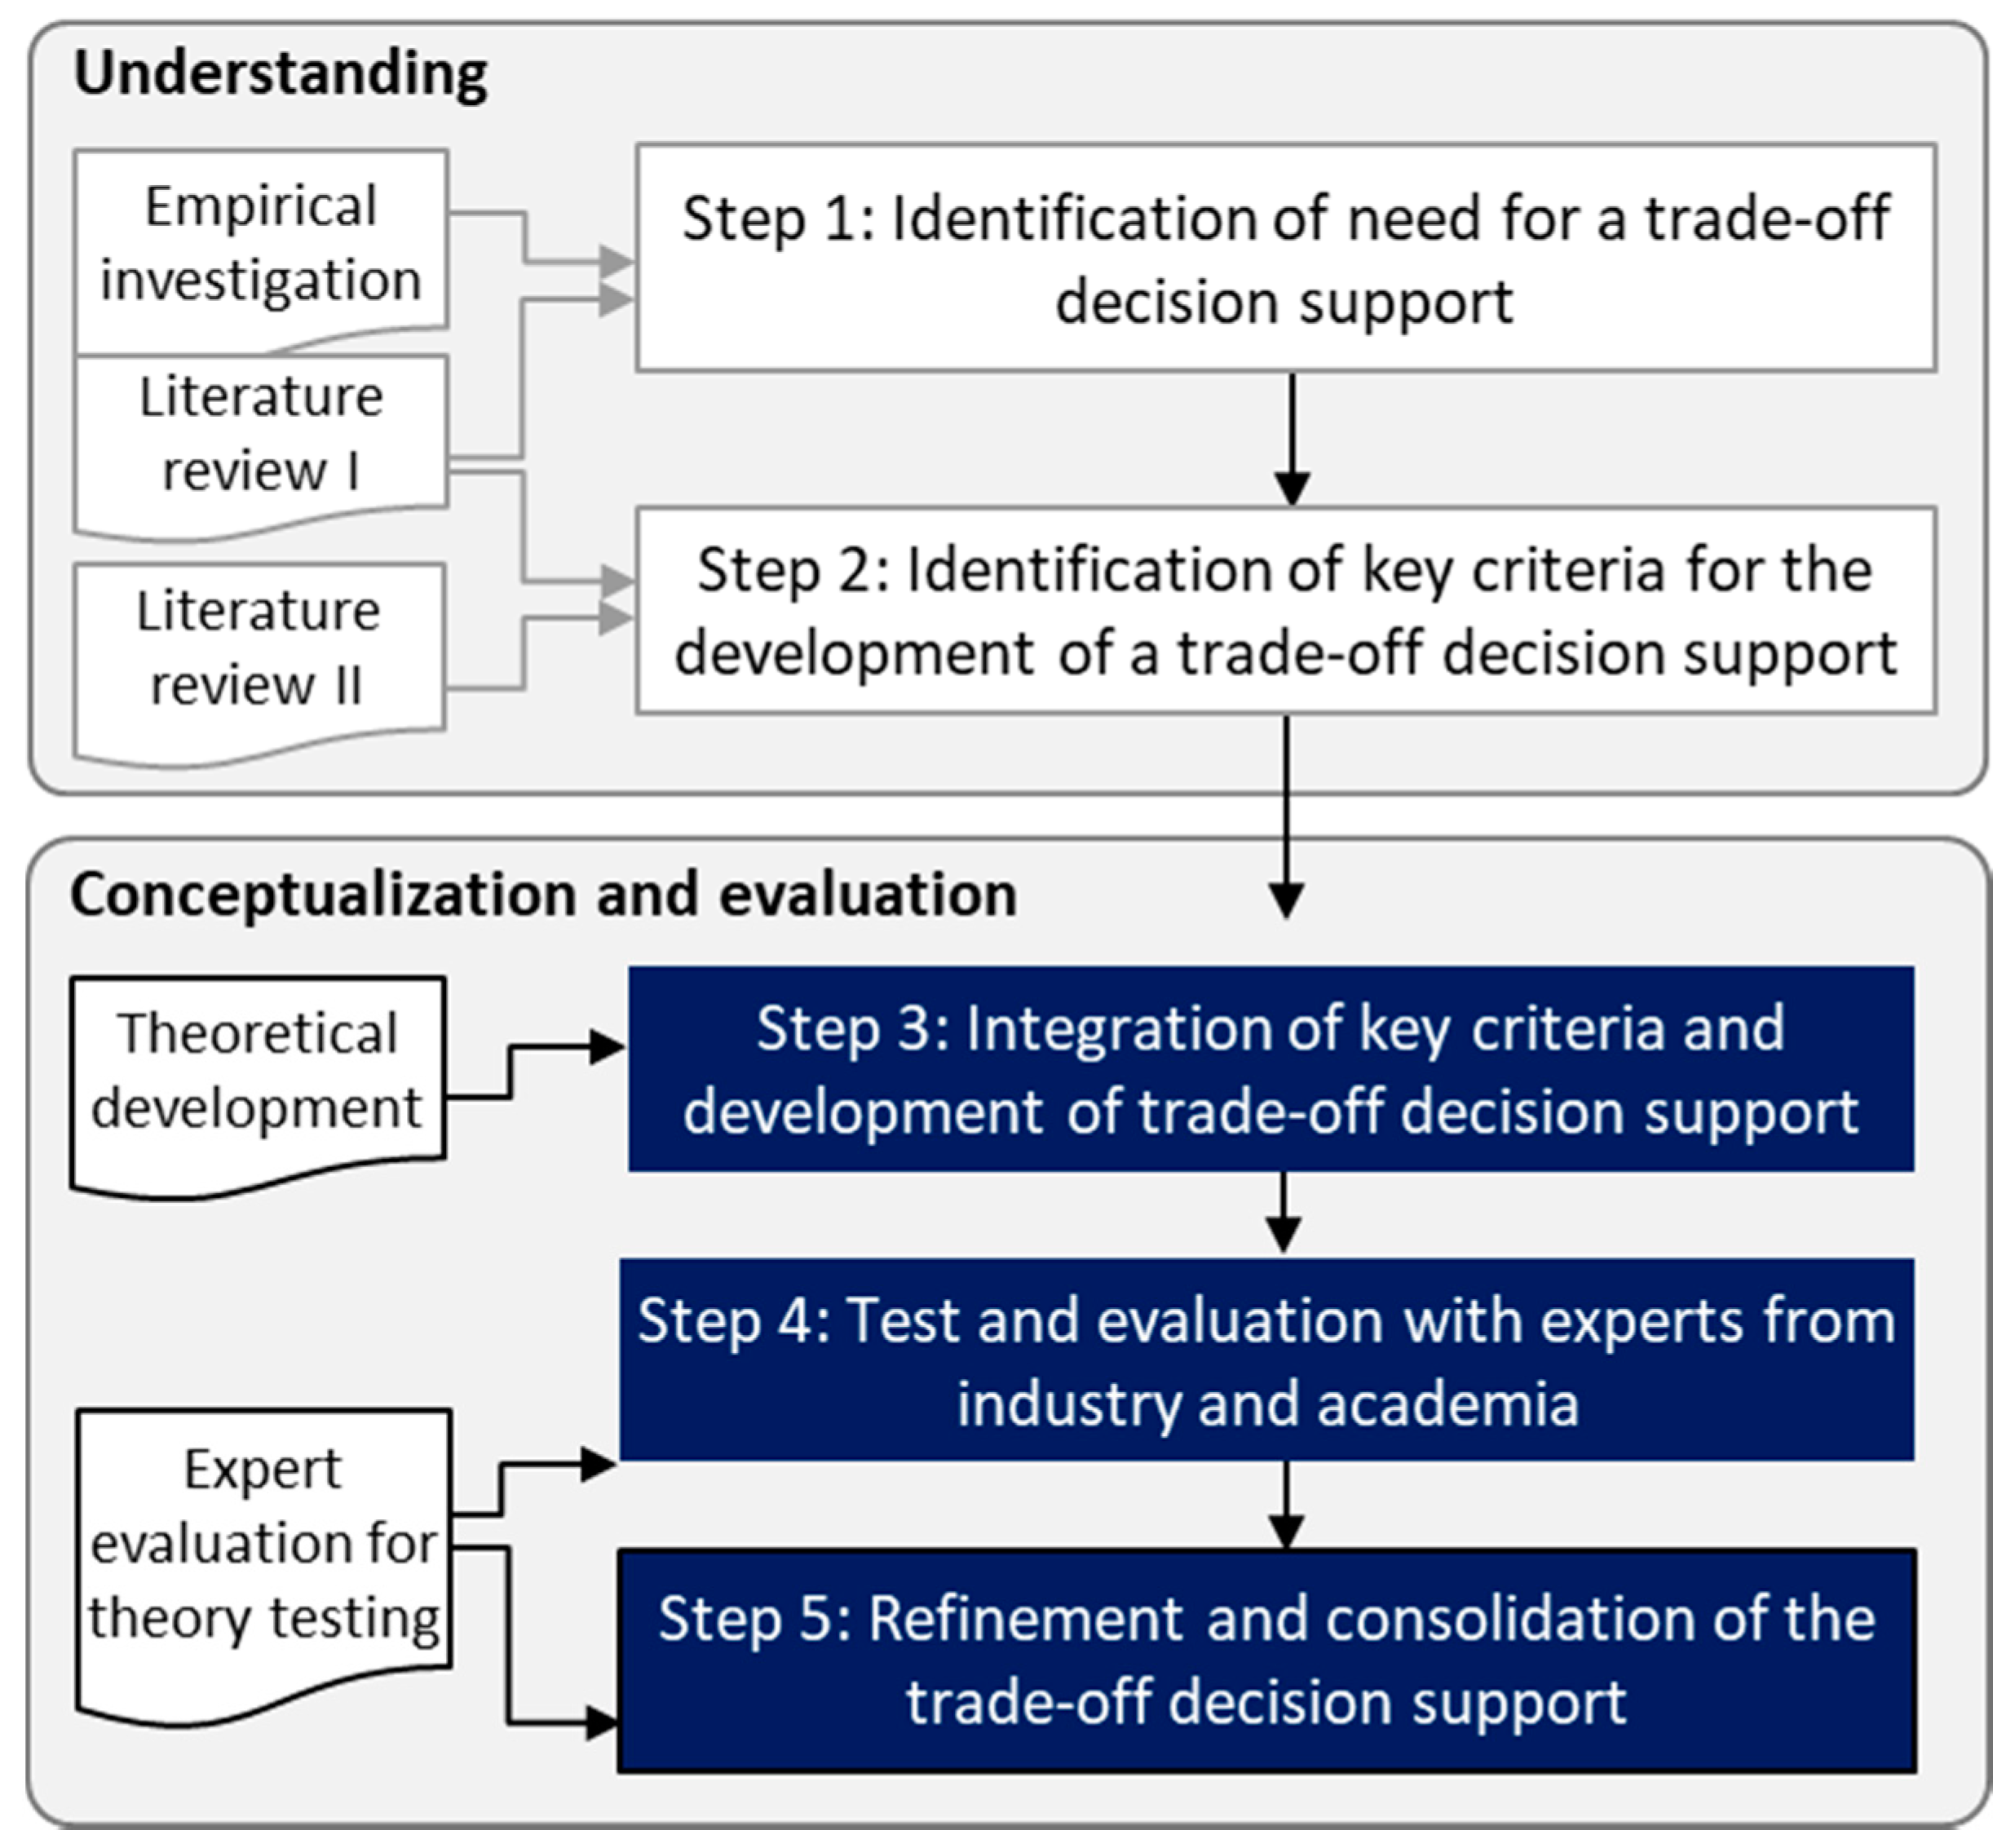
2. Research Design and Methods
3. Presentation of Common Challenges in Implementation of TBL Criteria in Business Processes and the Prominence of Trade-Offs
4. Presentation of the TONF
4.1. Criteria for the Development
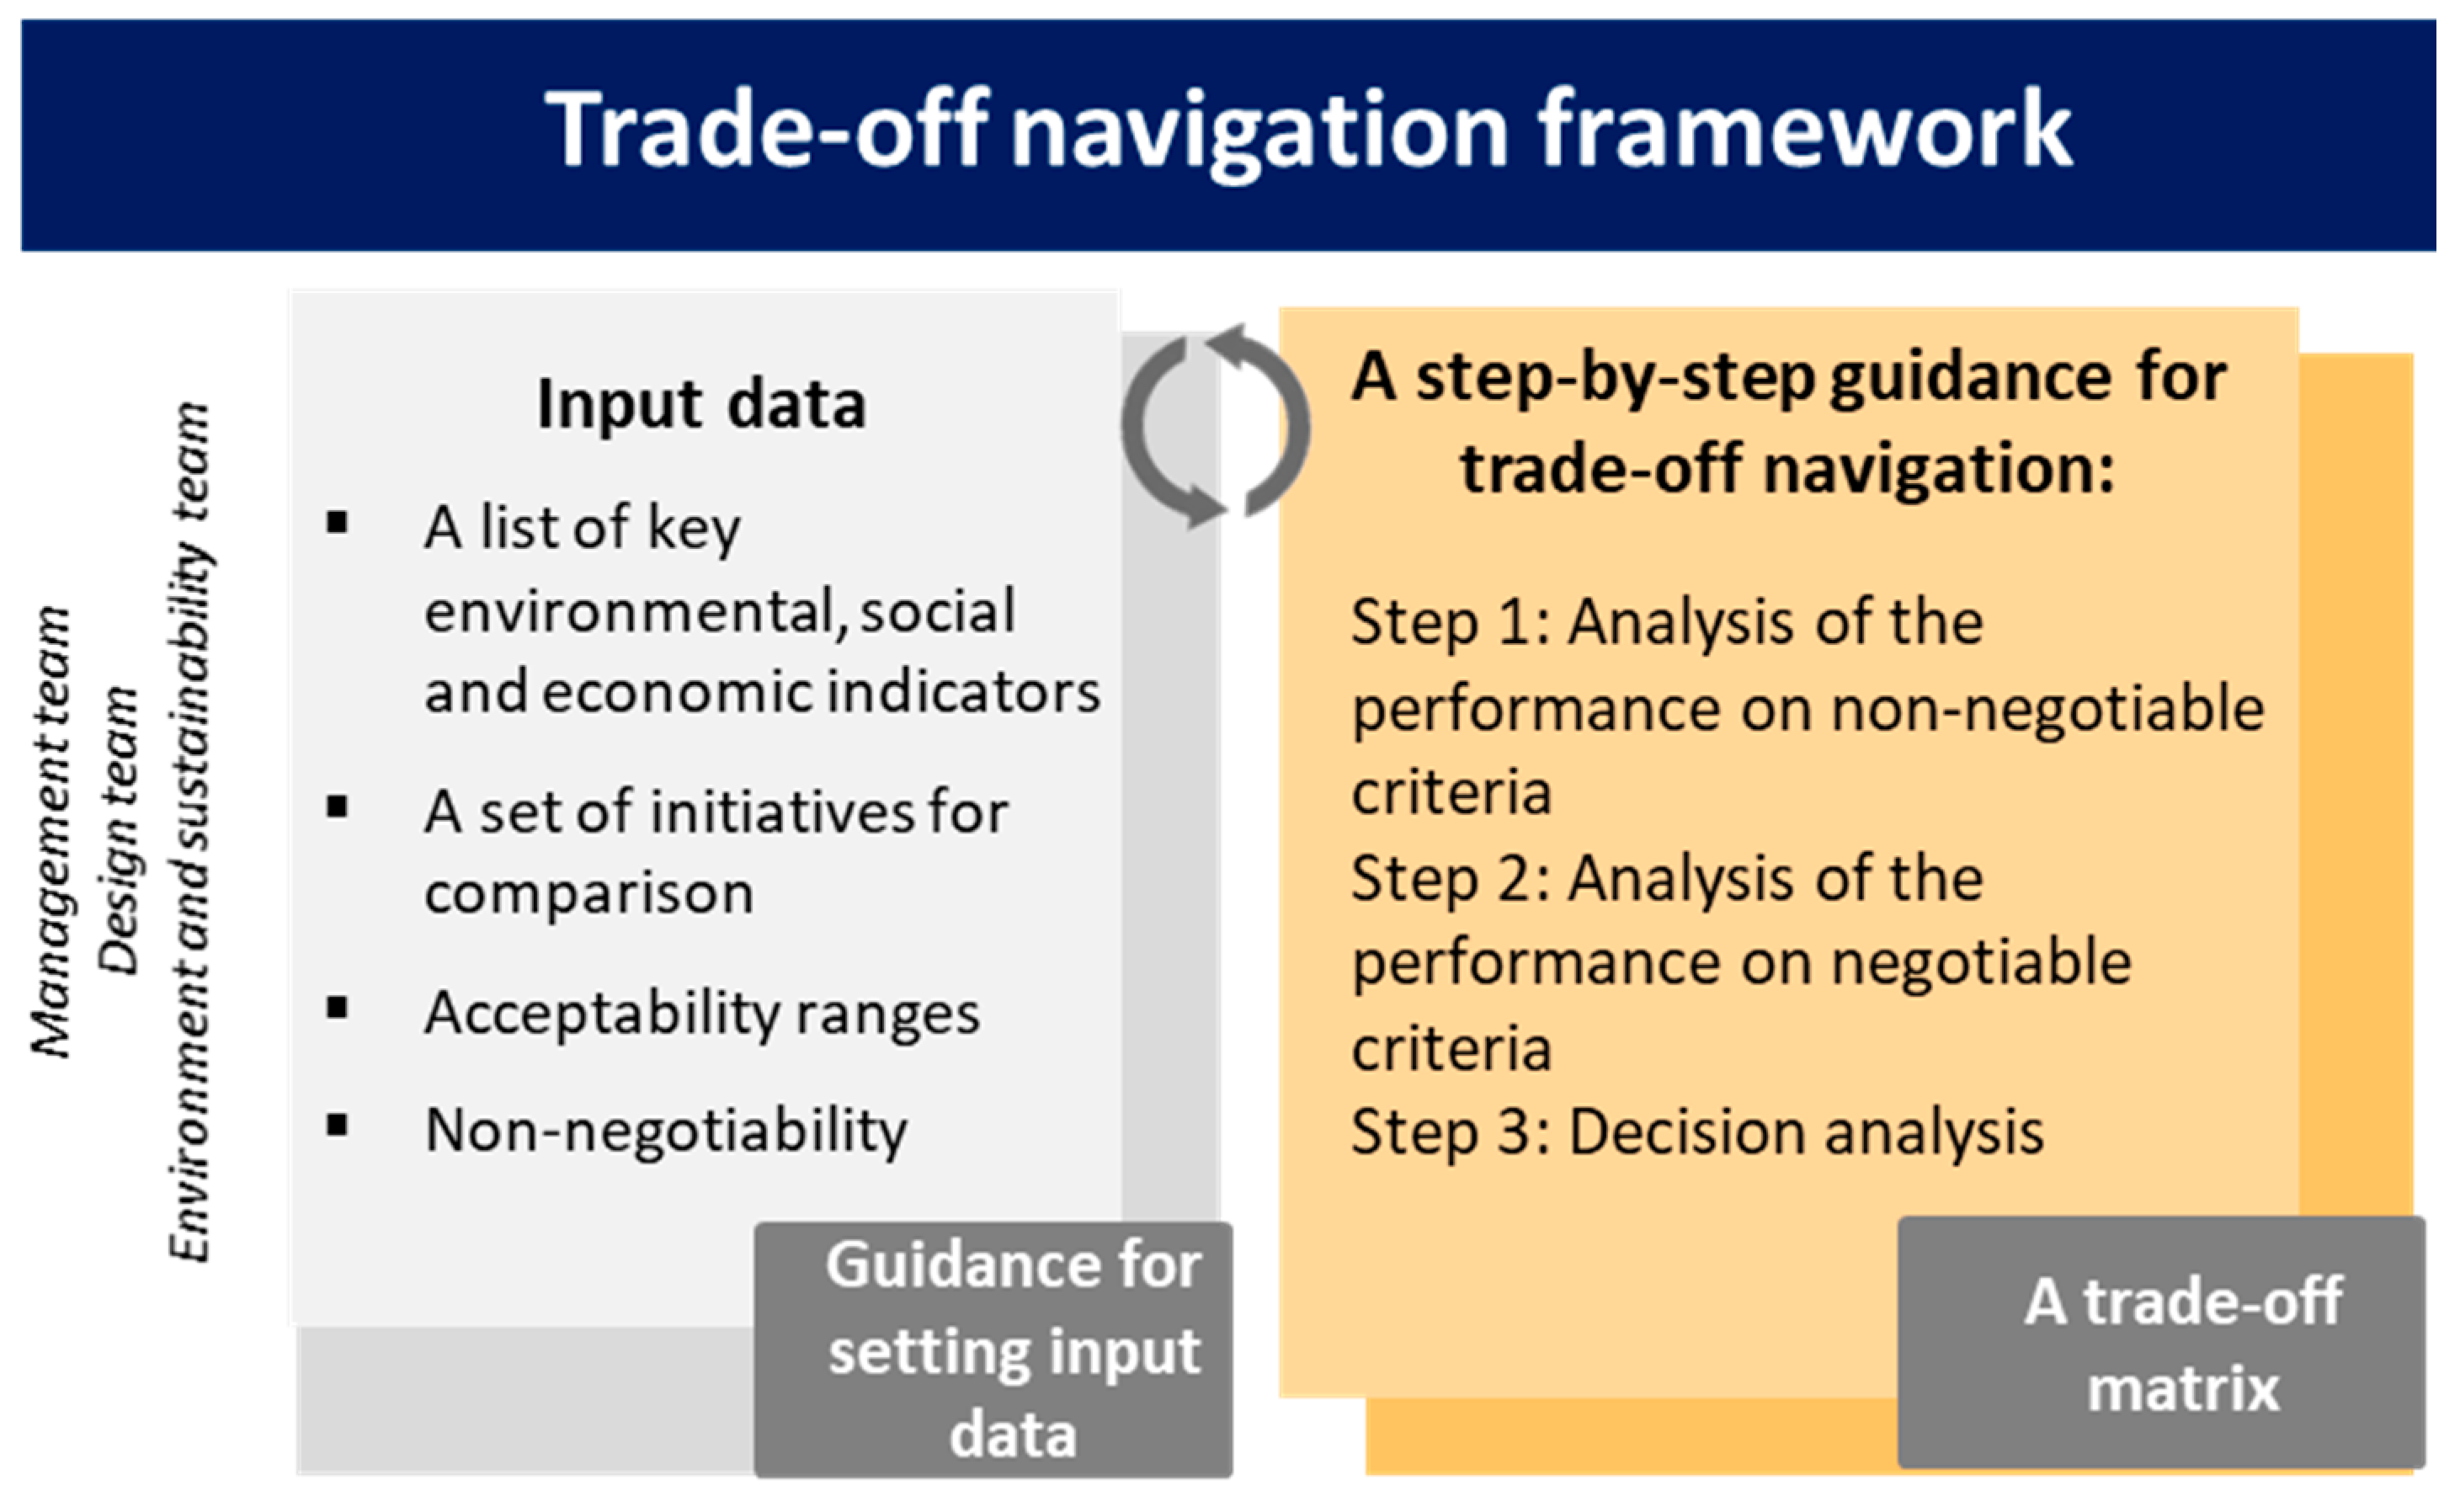
4.2. Trade-Off Navigation Framework, TONF—Required Inputs and Detailed Guidance
- Early stages of sustainability-oriented initiative development (e.g., conceptualization stages of business modelling and product development);
- Multifunctional teams (e.g., management, product designers, sustainability managers).
4.2.1. Input Data
A List of Key Indicators for a Set of Initiatives for Comparison
Guidance for Indicator Selection
Acceptability Ranges and Their Non-Negotiability
Guidance for Setting Acceptability Ranges and Non-Negotiability
- Strategic vision, goals, or project objectives set by the decision-making group (e.g., influenced by past performance impact assessments, trends analysis, dialogues from sectorial associations, market position, etc.);
- Customer and/or stakeholder requirements;
- Technical (and performance) requirements;
- Legal requirements (incl. health and safety, quality) and legal thresholds.
4.2.2. A Step-By-Step Guidance for a Trade-Off Navigation
- Step 1: Analysis of the performance on non-negotiable criteria
- If two or more alternatives satisfy all the non-negotiable criteria, proceed to Step 2.
- If only one alternative satisfies all the non-negotiable criteria, proceed to Step 3.
- If none of the alternatives satisfy all the non-negotiable criteria, i.e., either some alternatives deliver the acceptable performance on some criteria but not the others, or neither of the alternatives deliver the acceptable performance, then all the alternatives should be rejected, unless:
- (a)
- The non-negotiability of the criteria, hence the acceptable ranges, can be re-evaluated, supported by the questions:
- Are the acceptability ranges too narrow or too broad?
- Can they be adjusted and how much?
- What is the aim of the defined acceptability ranges/target? (Does it show a problem/risks or an opportunity? Can it be seen as an approach to balance the objectives? Does it reflect means to achieving a specific goal?)
- Can we re-evaluate the ranges/target in a dialogue with stakeholders or management?
- If none of the alternatives satisfies all (adjusted) non-negotiable criteria, none can be accepted as is, requiring improvement or development of a new set of alternatives.
- If two or more alternatives satisfy all the non-negotiable criteria, the analysis should proceed to Step 2.
- If only one alternative satisfies all the non-negotiable criteria, the analysis should proceed to Step 3.
- Step 2: Analysis of the Performance on Negotiable Criteria
- Select only the criteria for which none of the alternatives meet the performance within the acceptable ranges (e.g., if one criterion is satisfied by all the considered alternatives, it should be excluded from the analysis to simplify the weighting). For the selected criteria, weights should be assigned to them. A weight indicates the importance of one criterion relative to the other under consideration, i.e., a pairwise comparison. It is important to agree on the ranking scale and use it consistently to support the weighting process. A Likert scale from ‘much more important’ to ‘much less important’ could be used to assign priority weights. In doing so, the weights will express levels of trade-offs between the criteria rather than in absolute terms [79]. After weighting, a ranking of alternatives is performed based on their performance and the degree they satisfy the acceptable ranges. Similarly, a ranking scale should be defined, such as 1 to 3, i.e., from unsatisfactory (1), to some extent satisfactory (2), to satisfactory (3). As a result, the weighting score and the ranking score will be combined to show the alternative/s with the most satisfactory scores.
- Following the results of the weighting and ranking process, a dialogue about the scores and whether they can help provide judgements for the prioritization of one alternative over others is encouraged.
- Proceed to Step 3.
- Step 3: Decision analysis
5. Application of the TONF
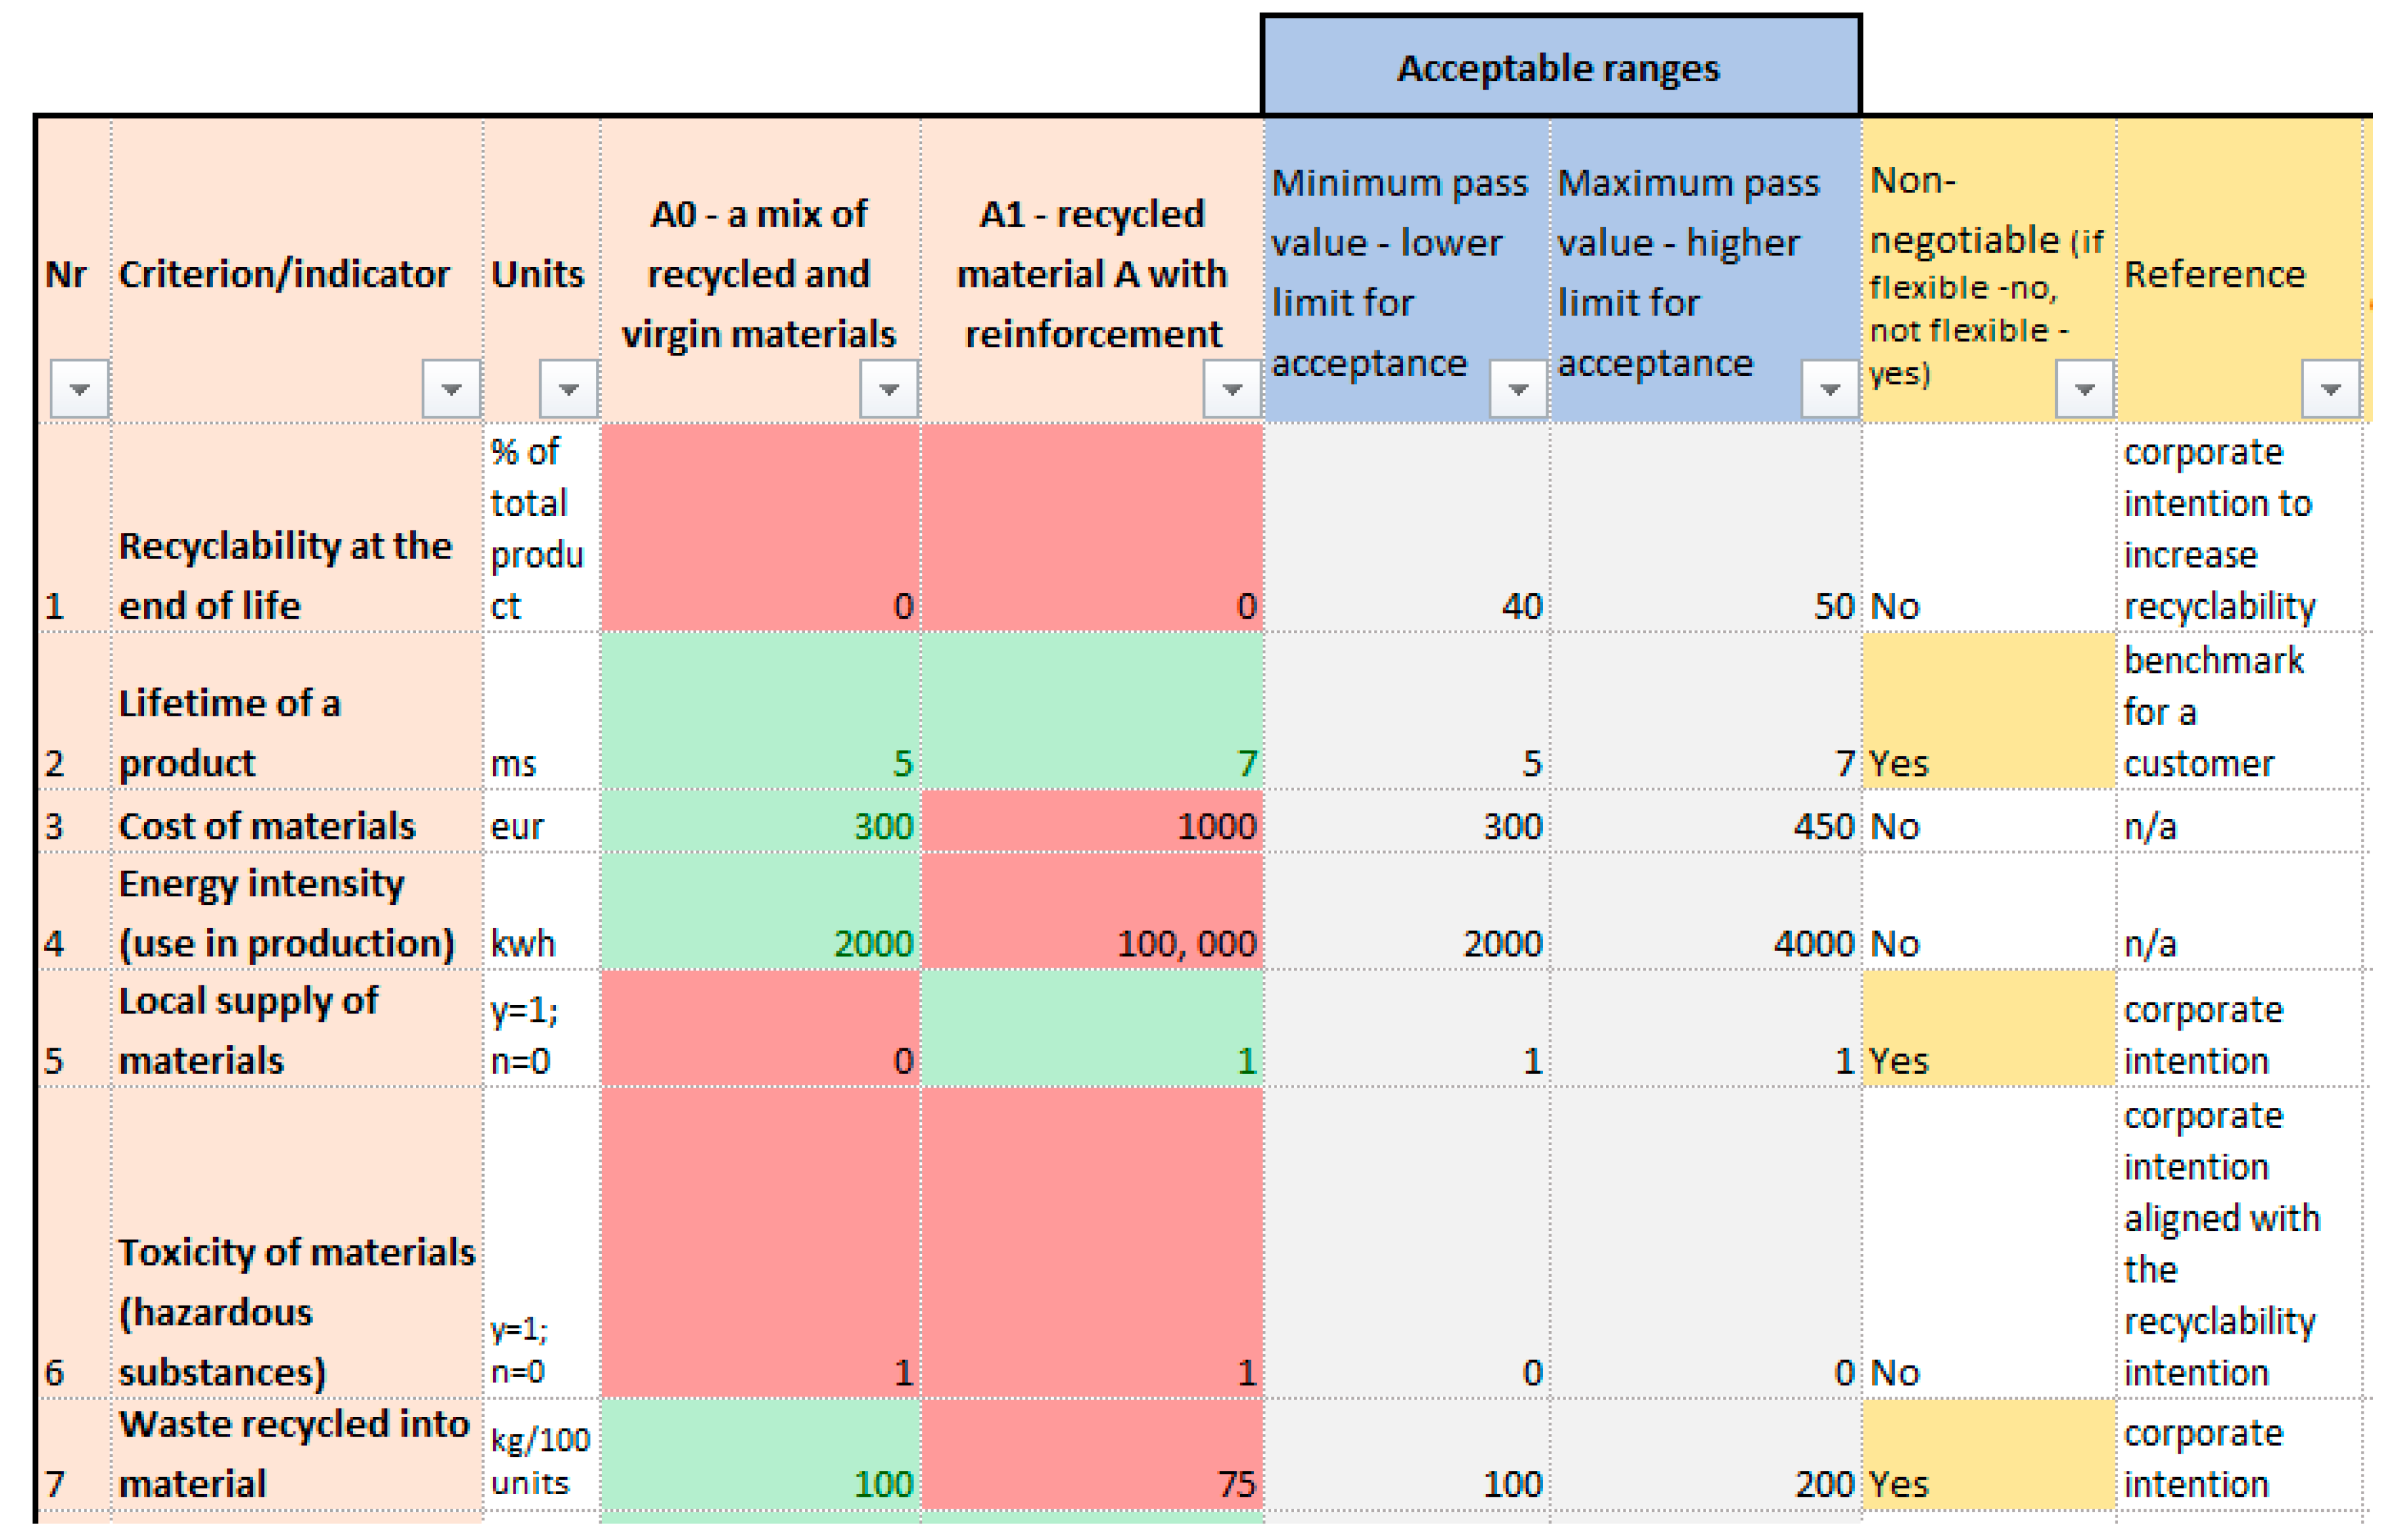
5.1. Example 1a: TONF Application to Support Decision-Making with 2 Alternatives
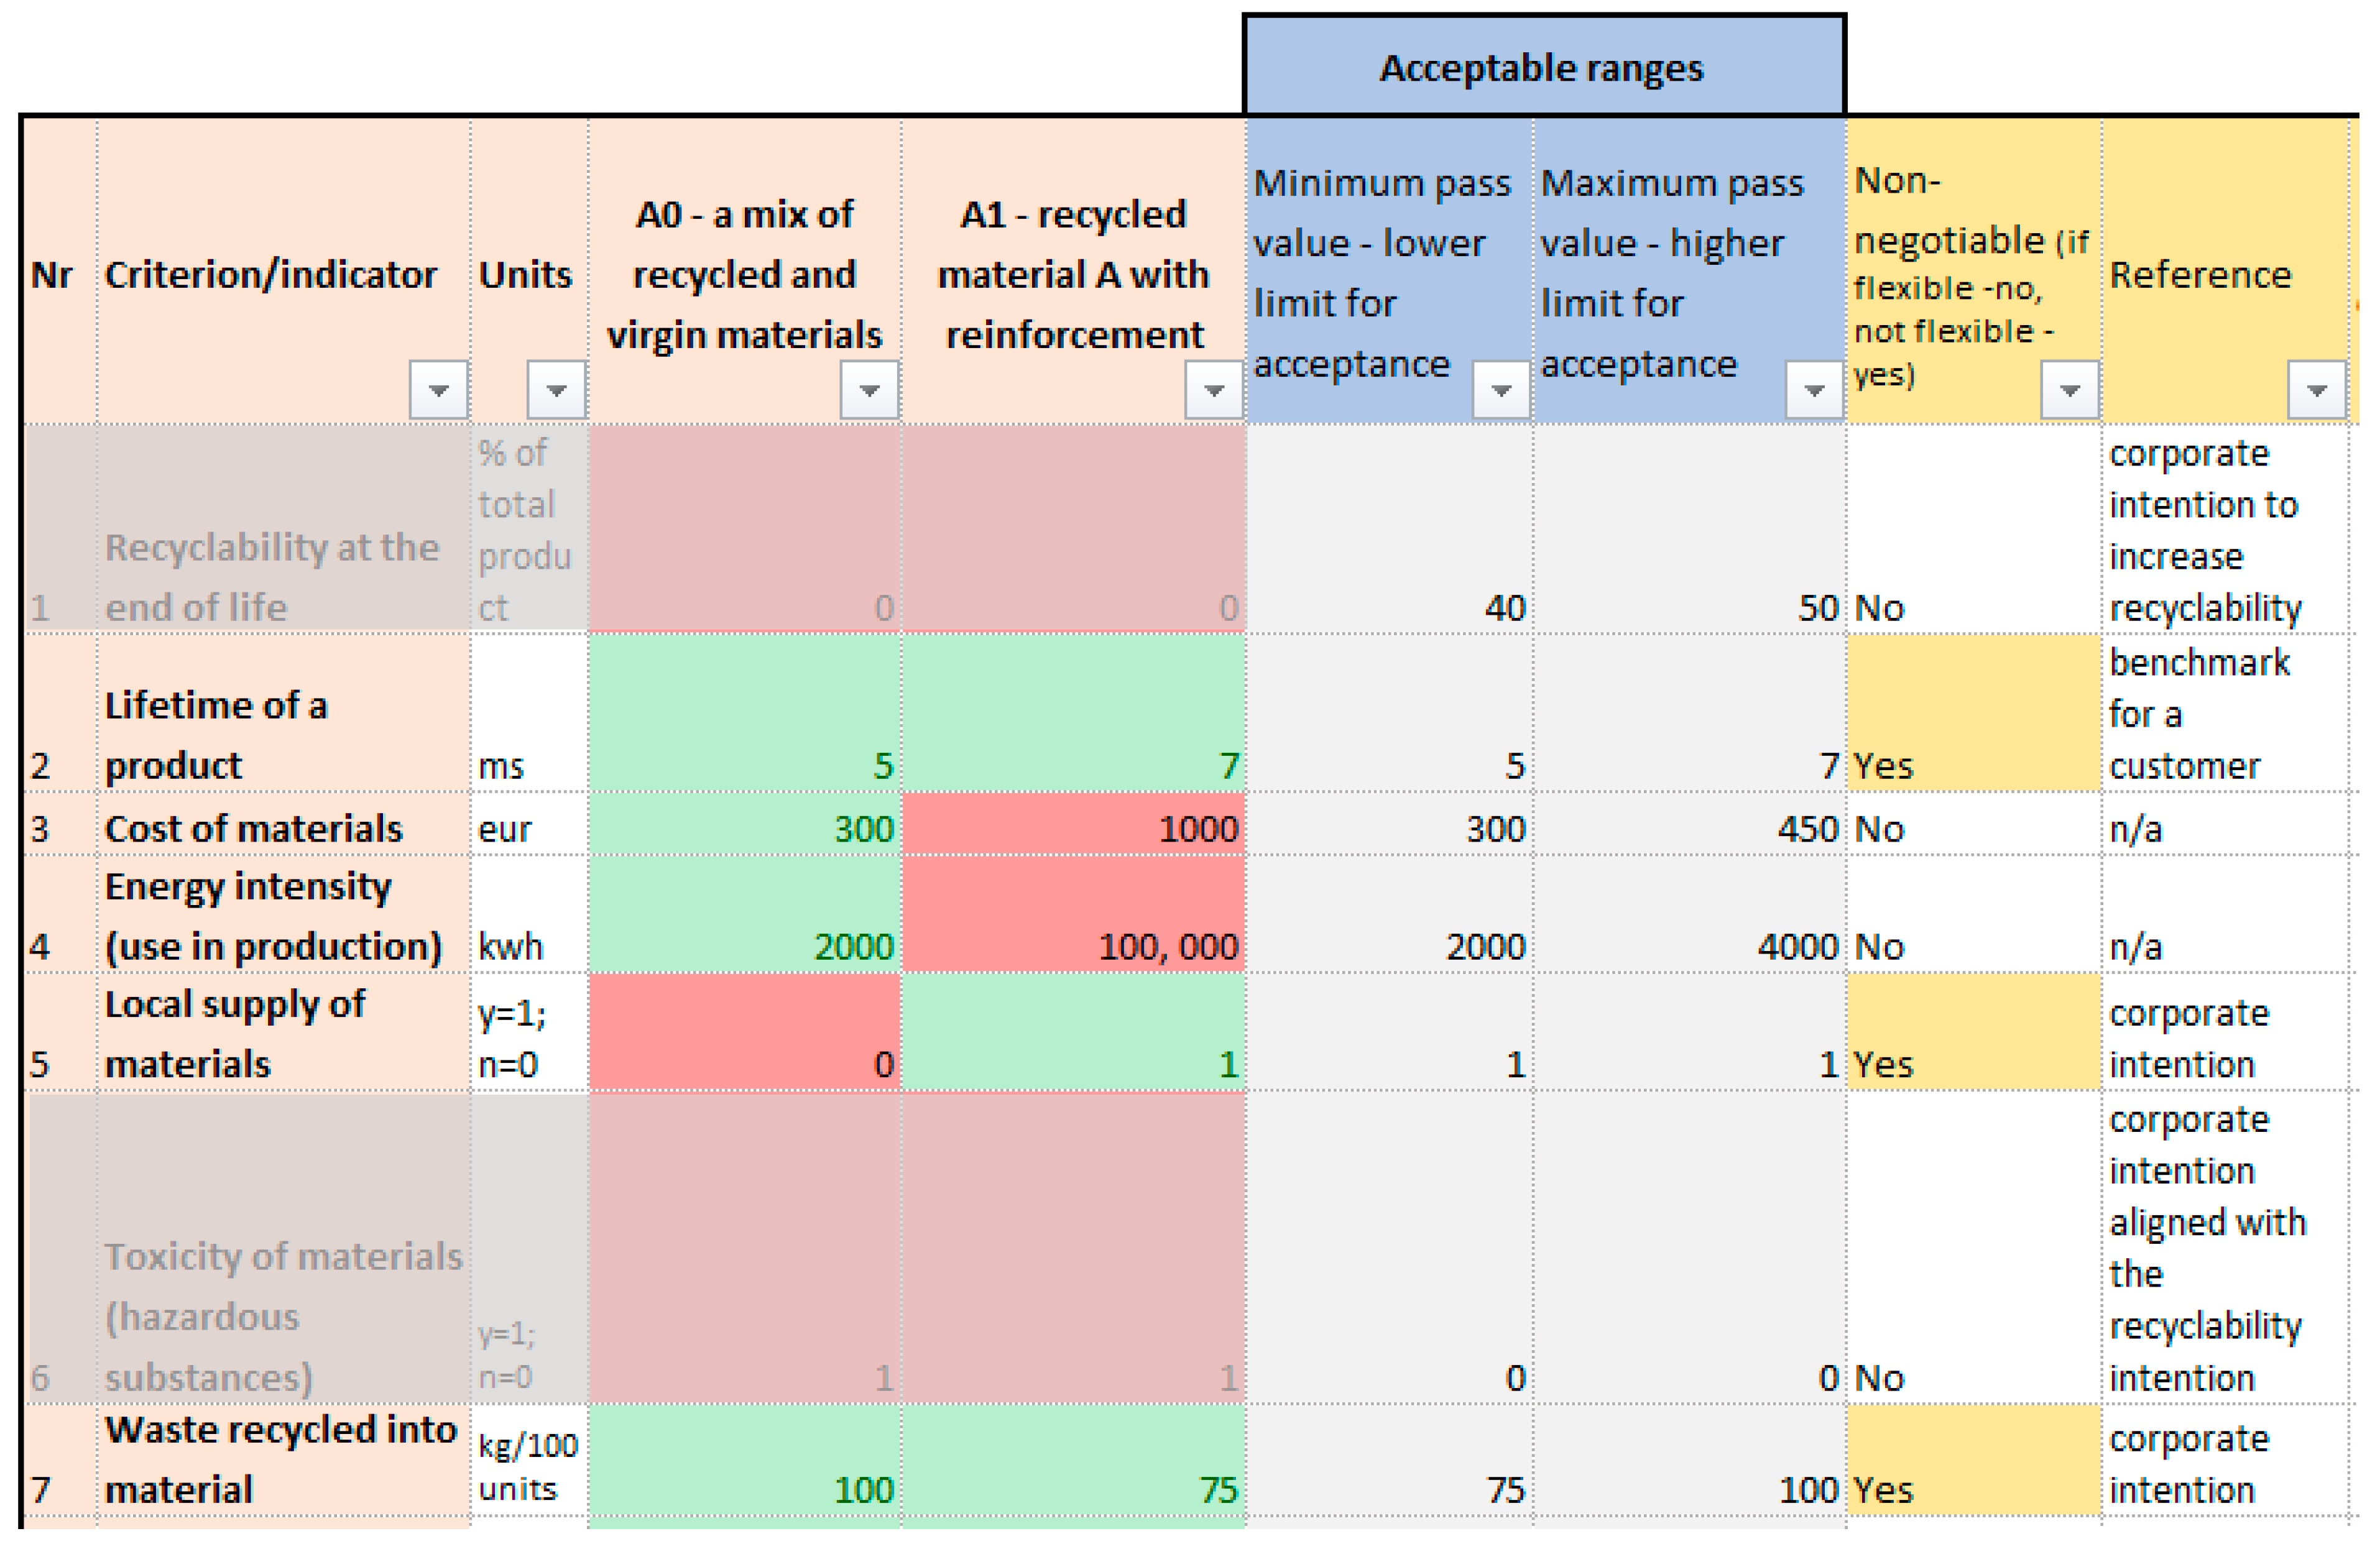
5.1.1. Filling in the Input Data
5.1.2. A Step-by-Step Application
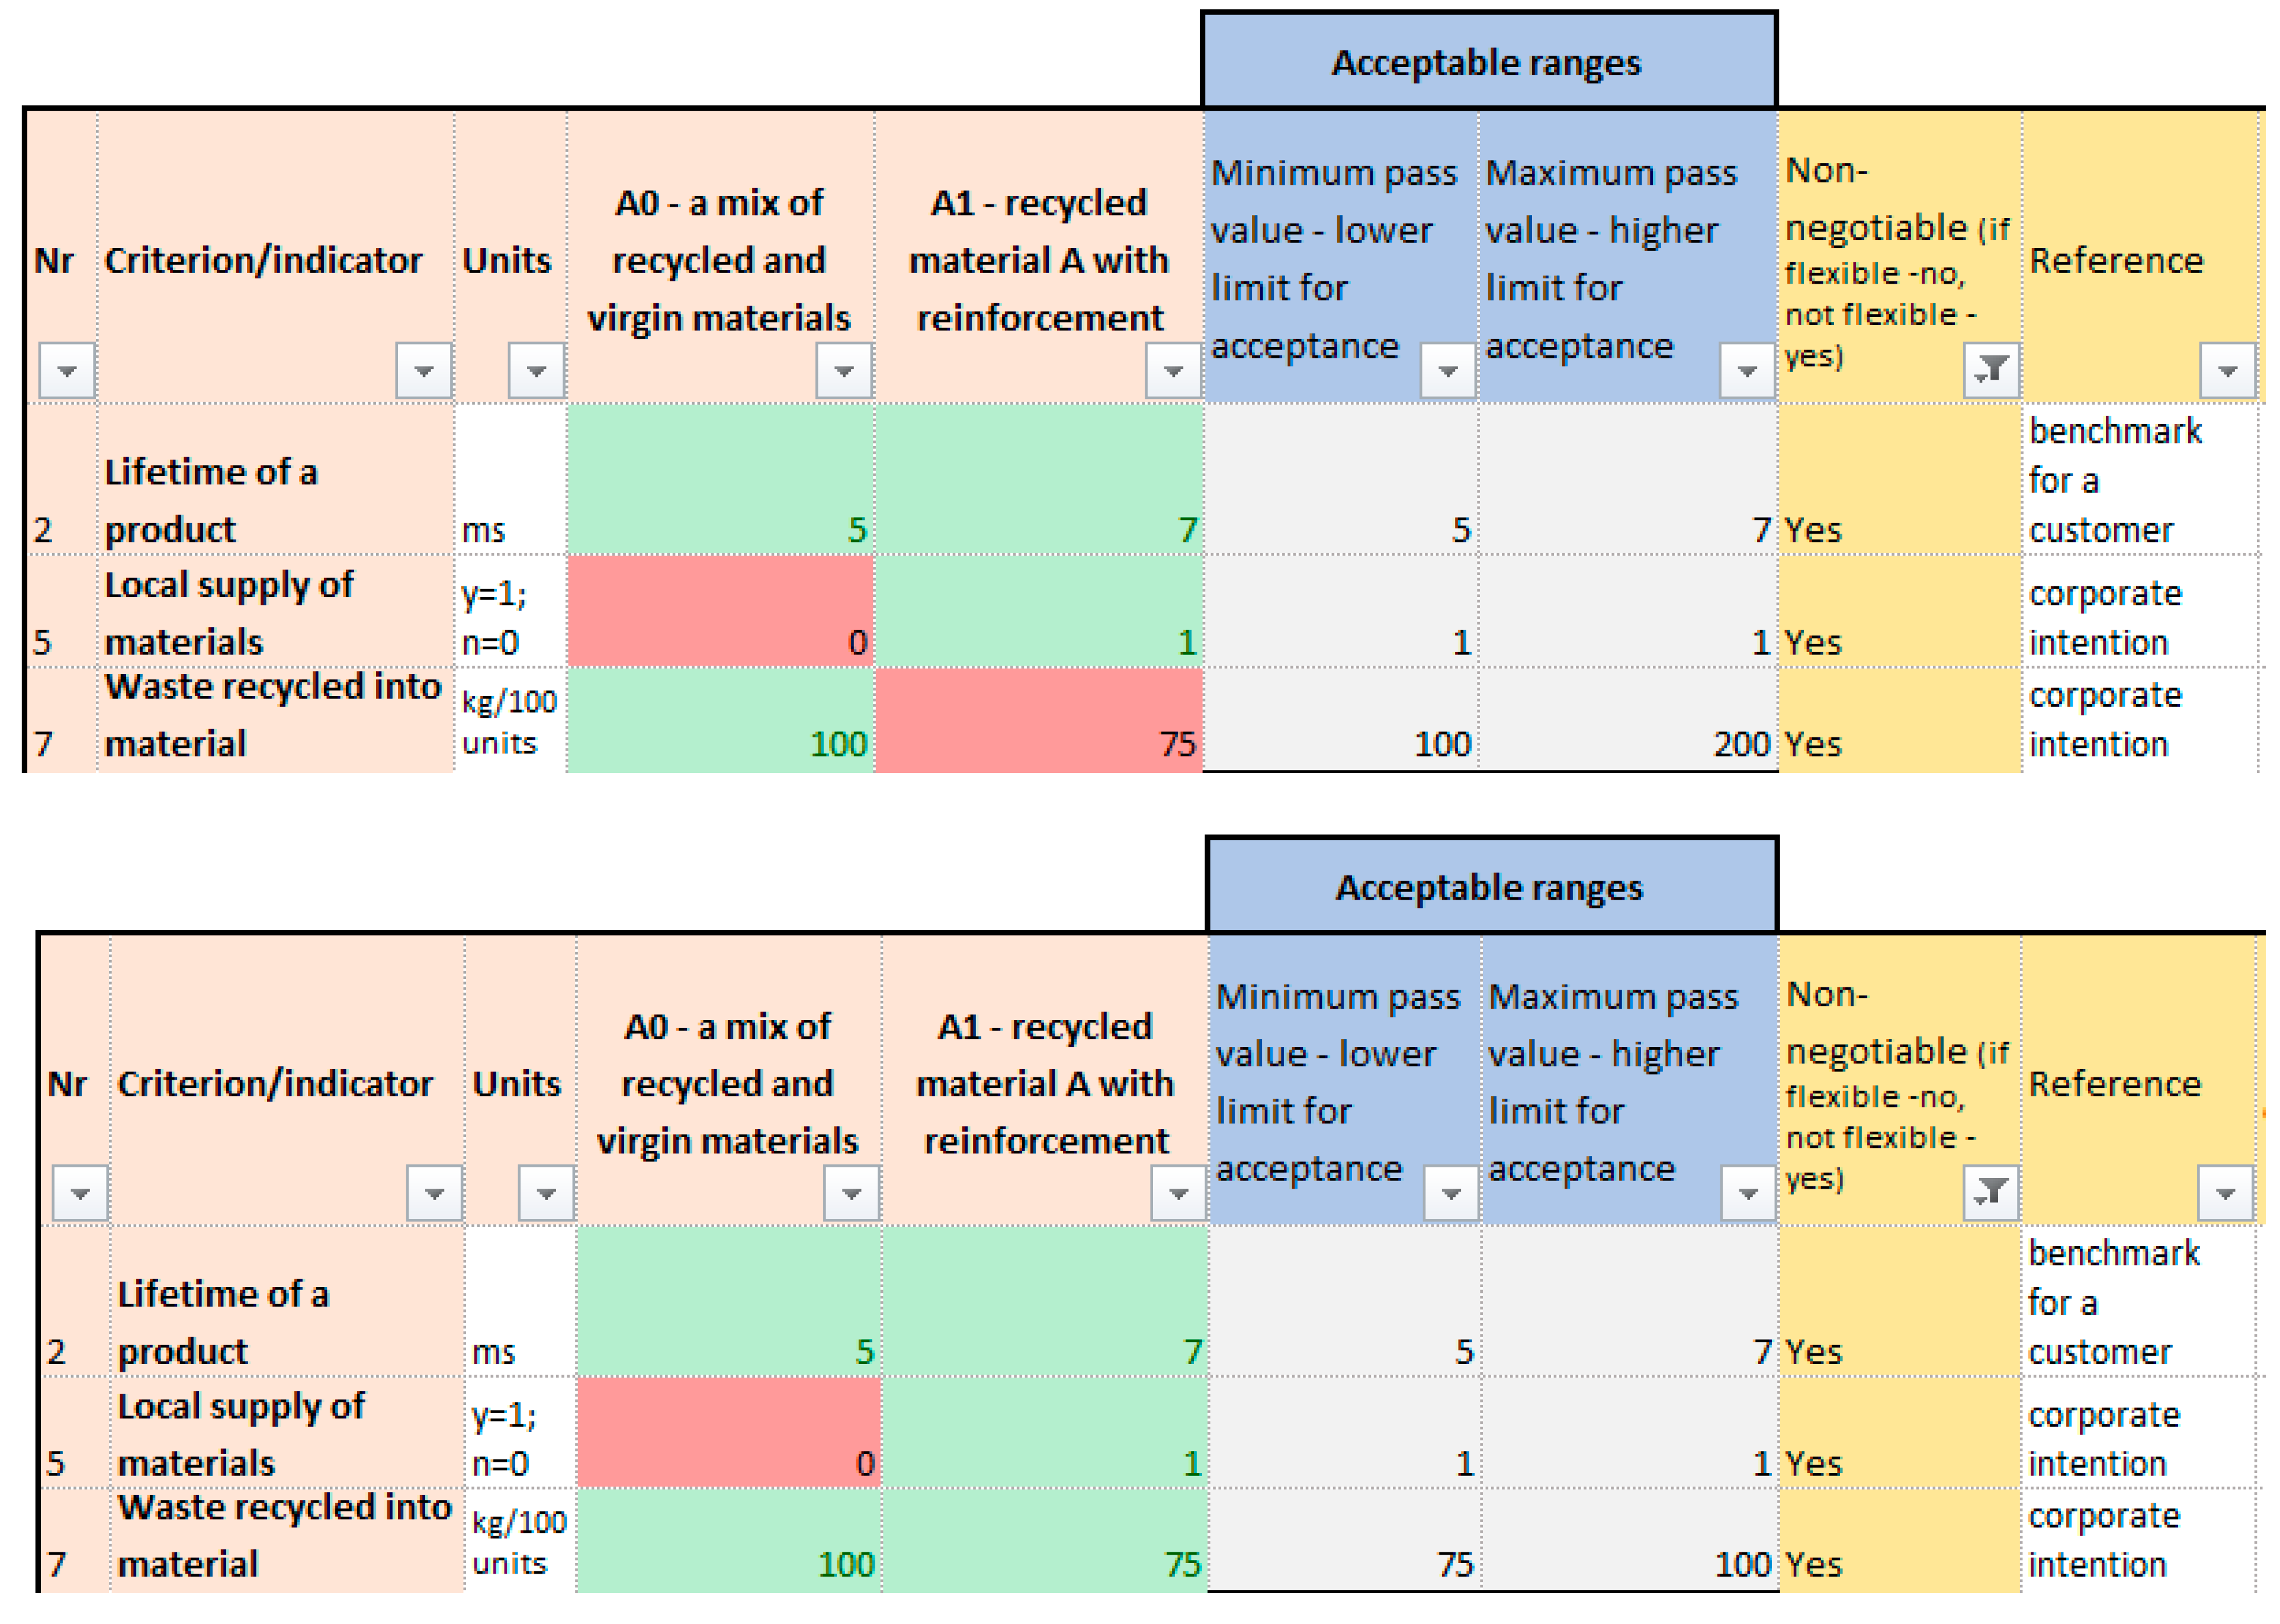
- Step 1: Analysis of the performance on non-negotiable criteria
- Step 2: Not applicable
- Step 3: Decision analysis
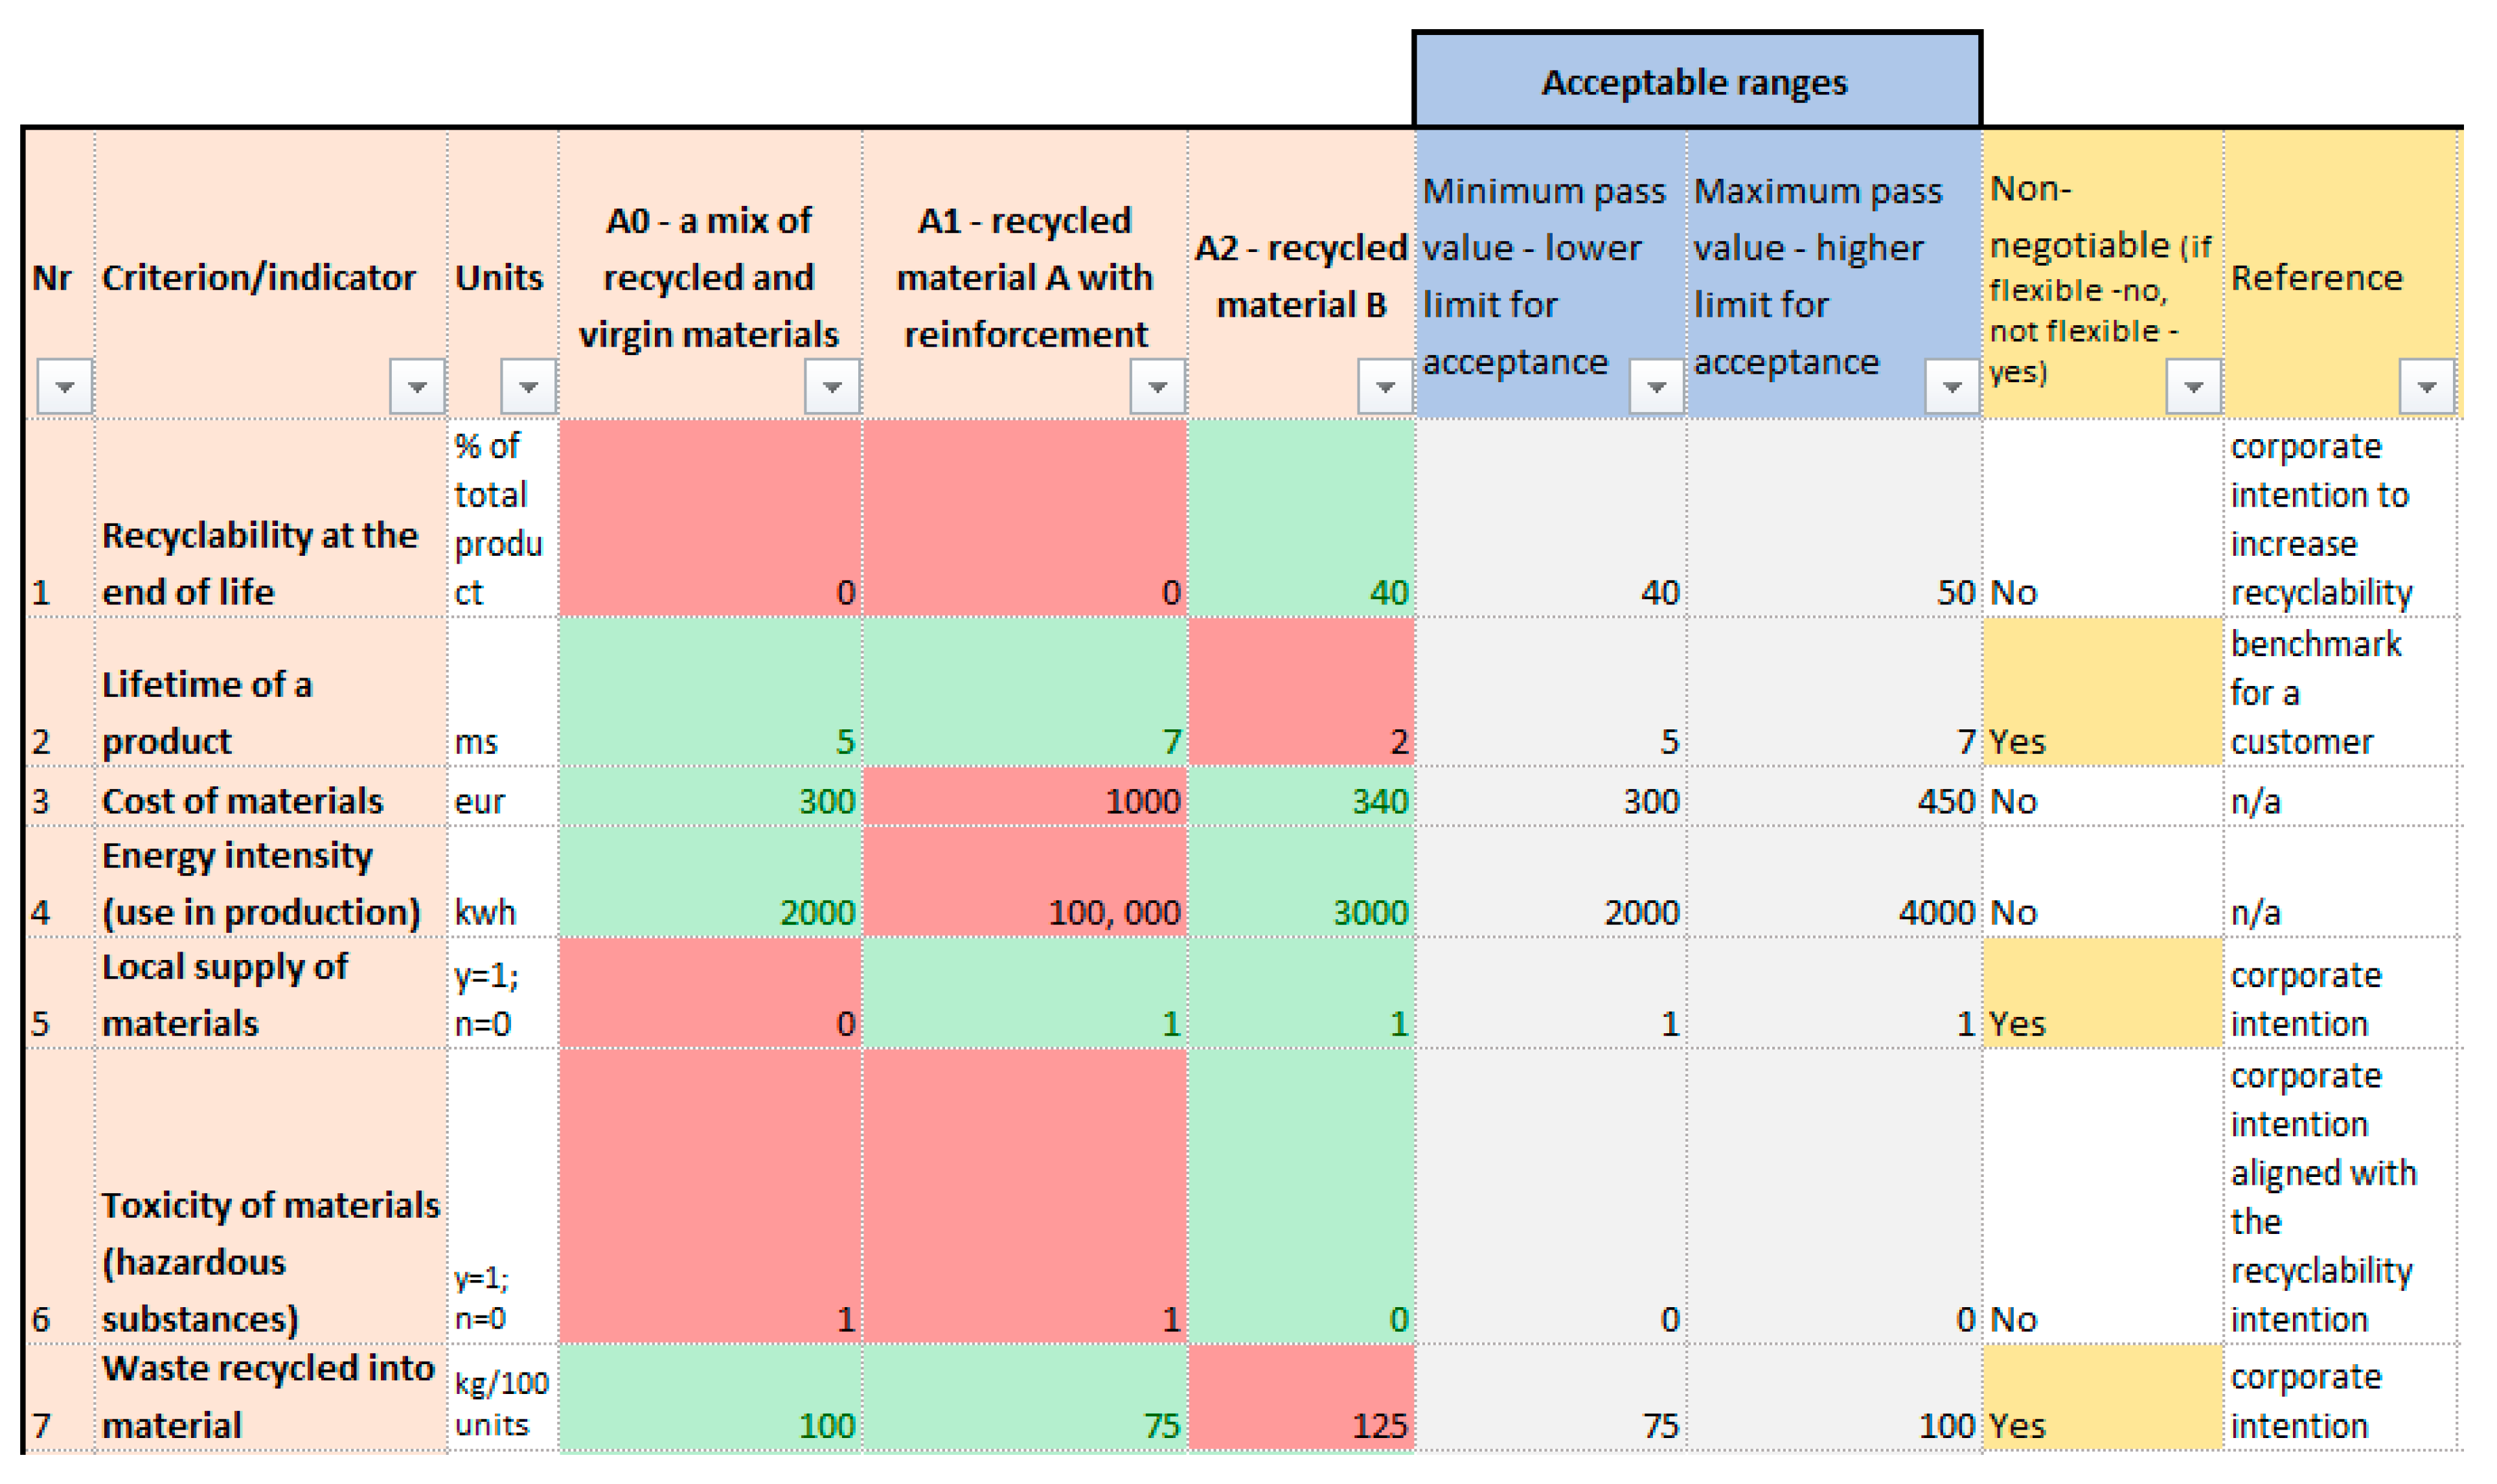
5.2. Example 1b: TONF Application to Support Decision-Making with 3 Alternatives
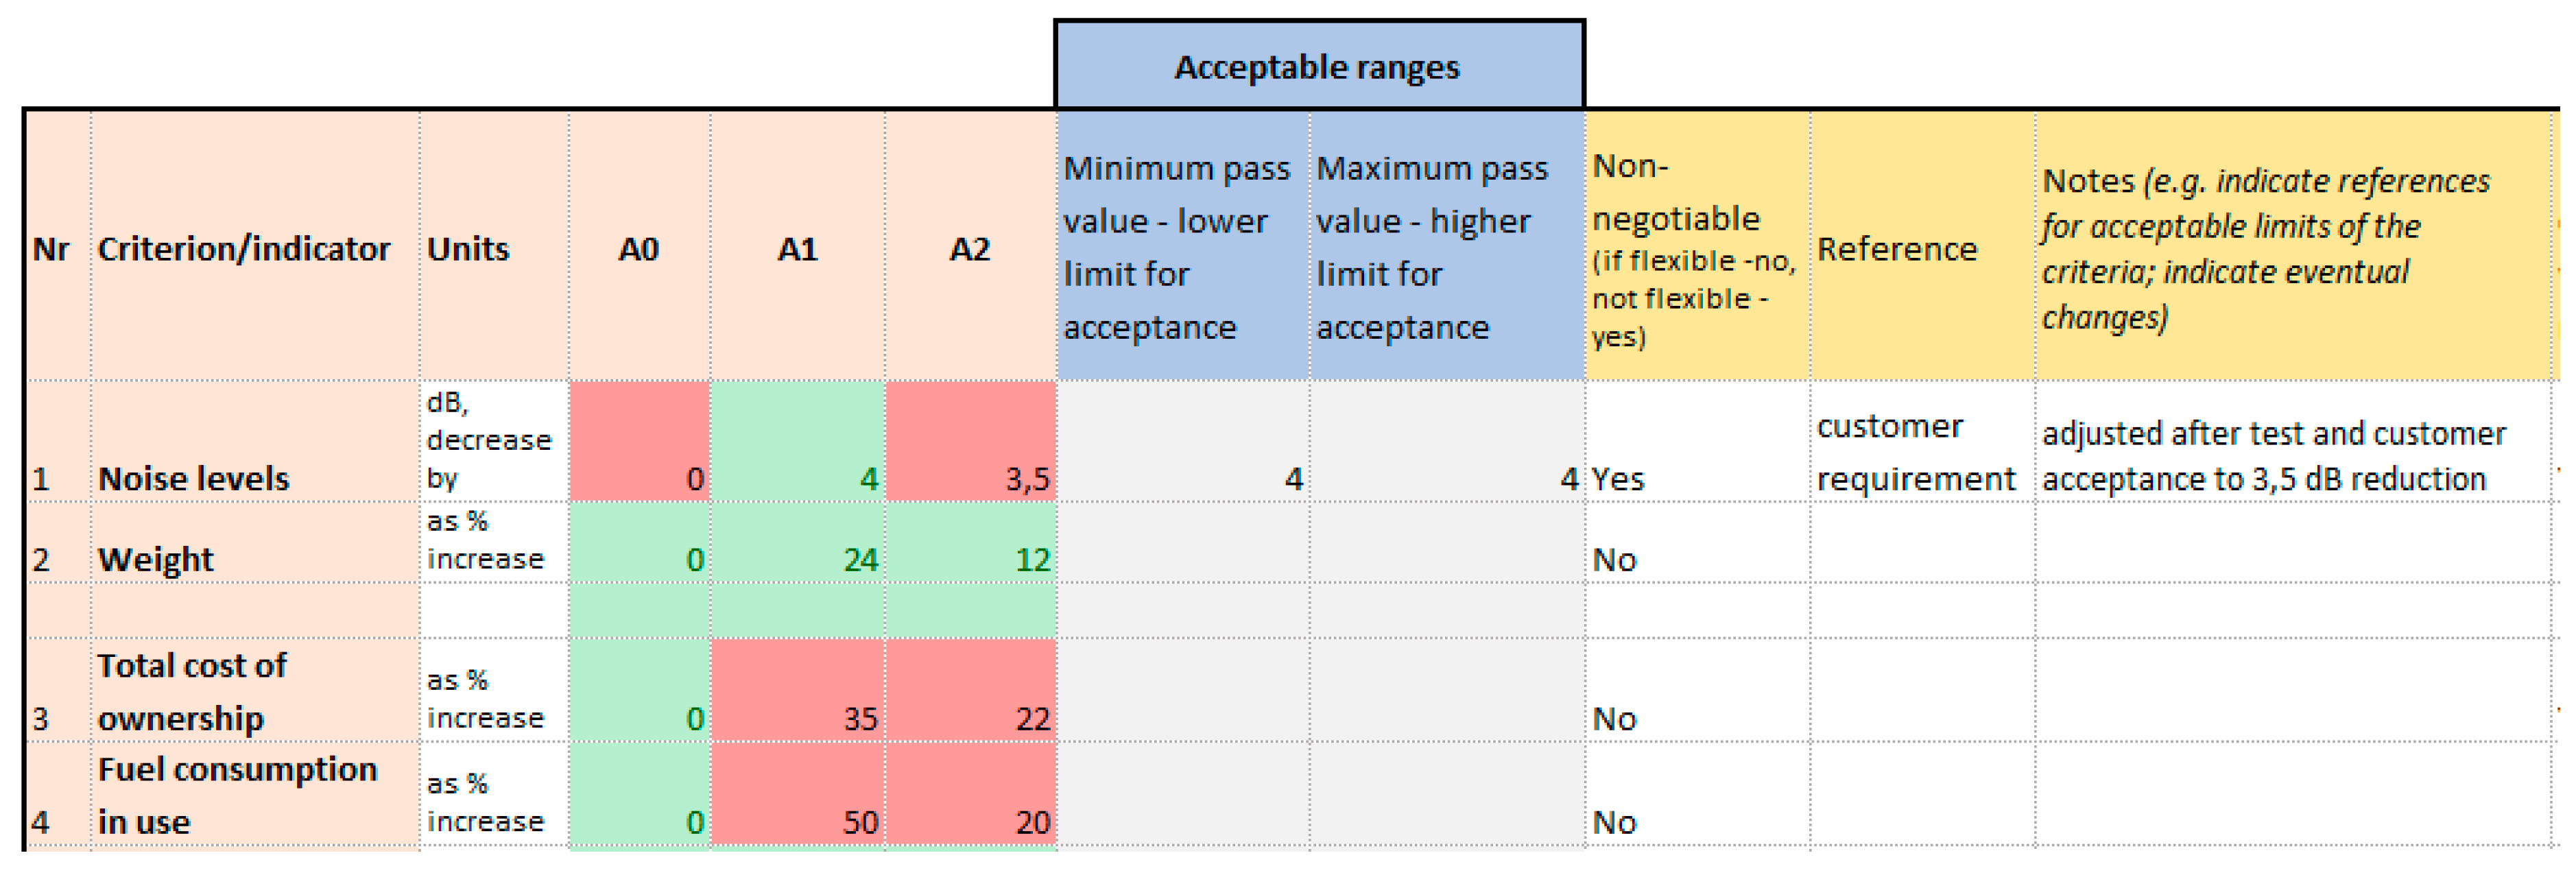
5.3. Example 2: TONF Application to Support Decision-Making with 3 Alternatives
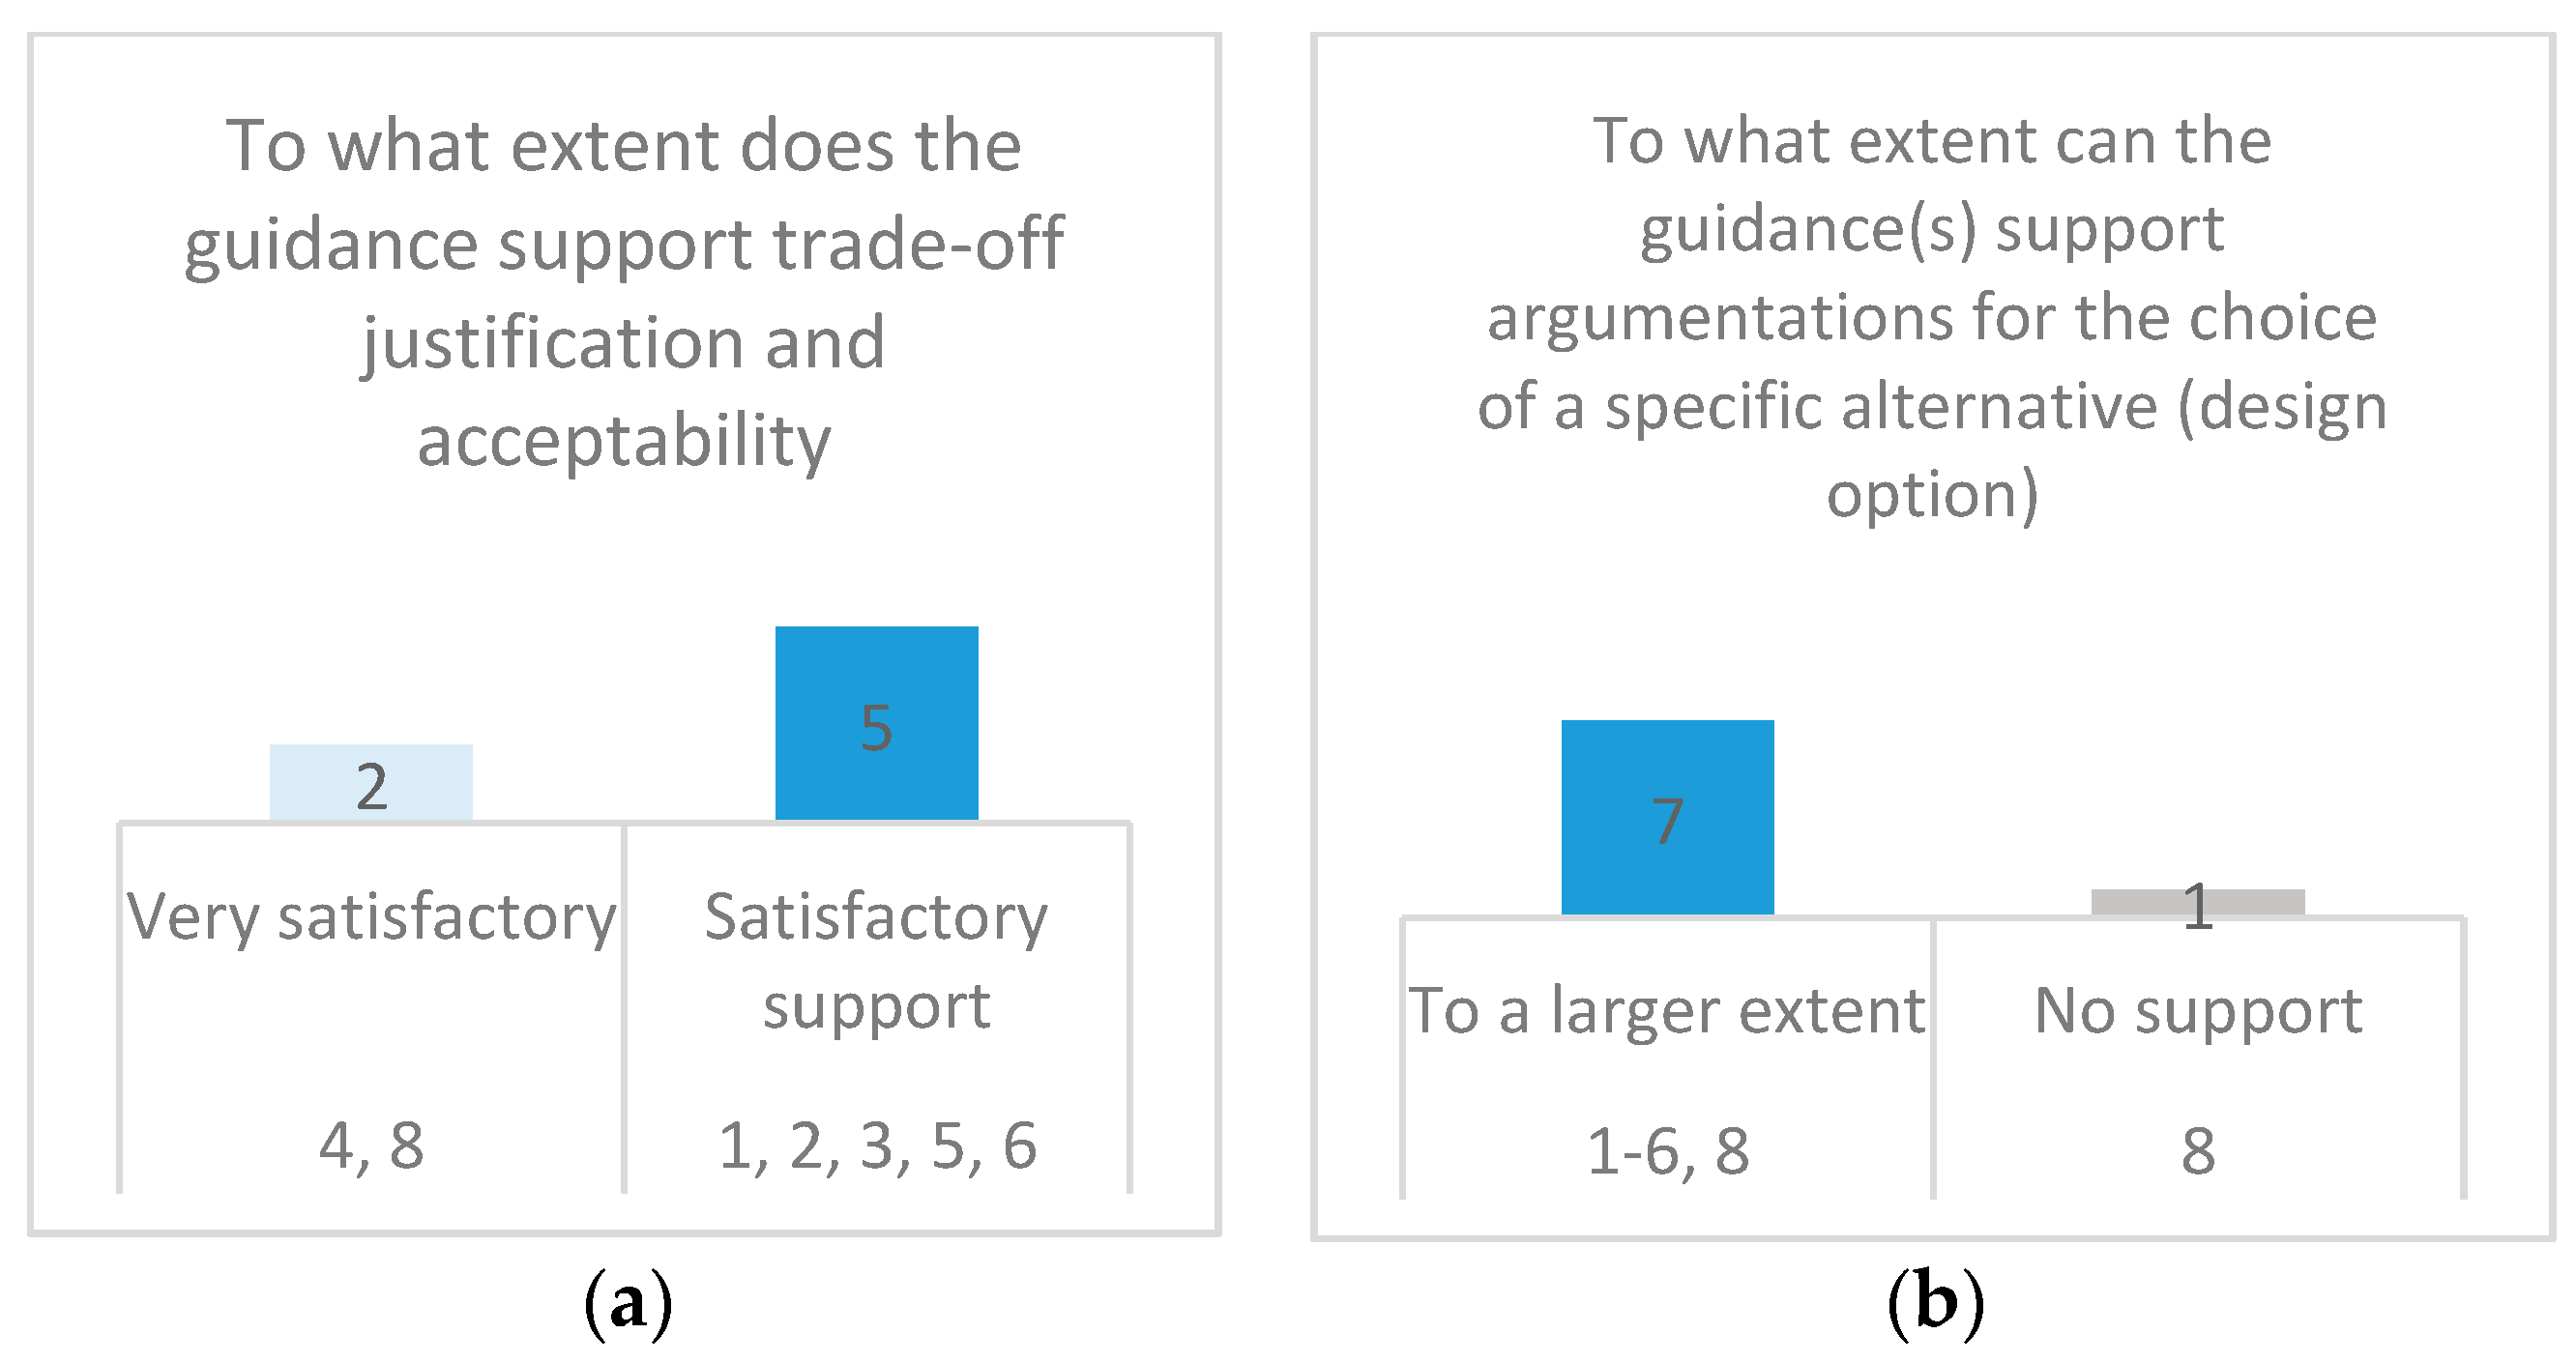
6. Evaluation of the Results and Discussion
7. Conclusions
- Advancing the discussion about the importance of supporting sustainability-related trade-offs after sustainability evaluation;
- Consolidation of key challenges in manufacturing industry related to the integration of sustainability criteria in the early stages of business processes;
- Identification of criteria to support trade-off navigation;
- Proposition of a structured approach to trade-off navigation.From a practical perspective, the following can be highlighted:
- Overview of the information required to frame a decision;
- A practical and flexible approach to making trade-off explicit based on the contextual information;
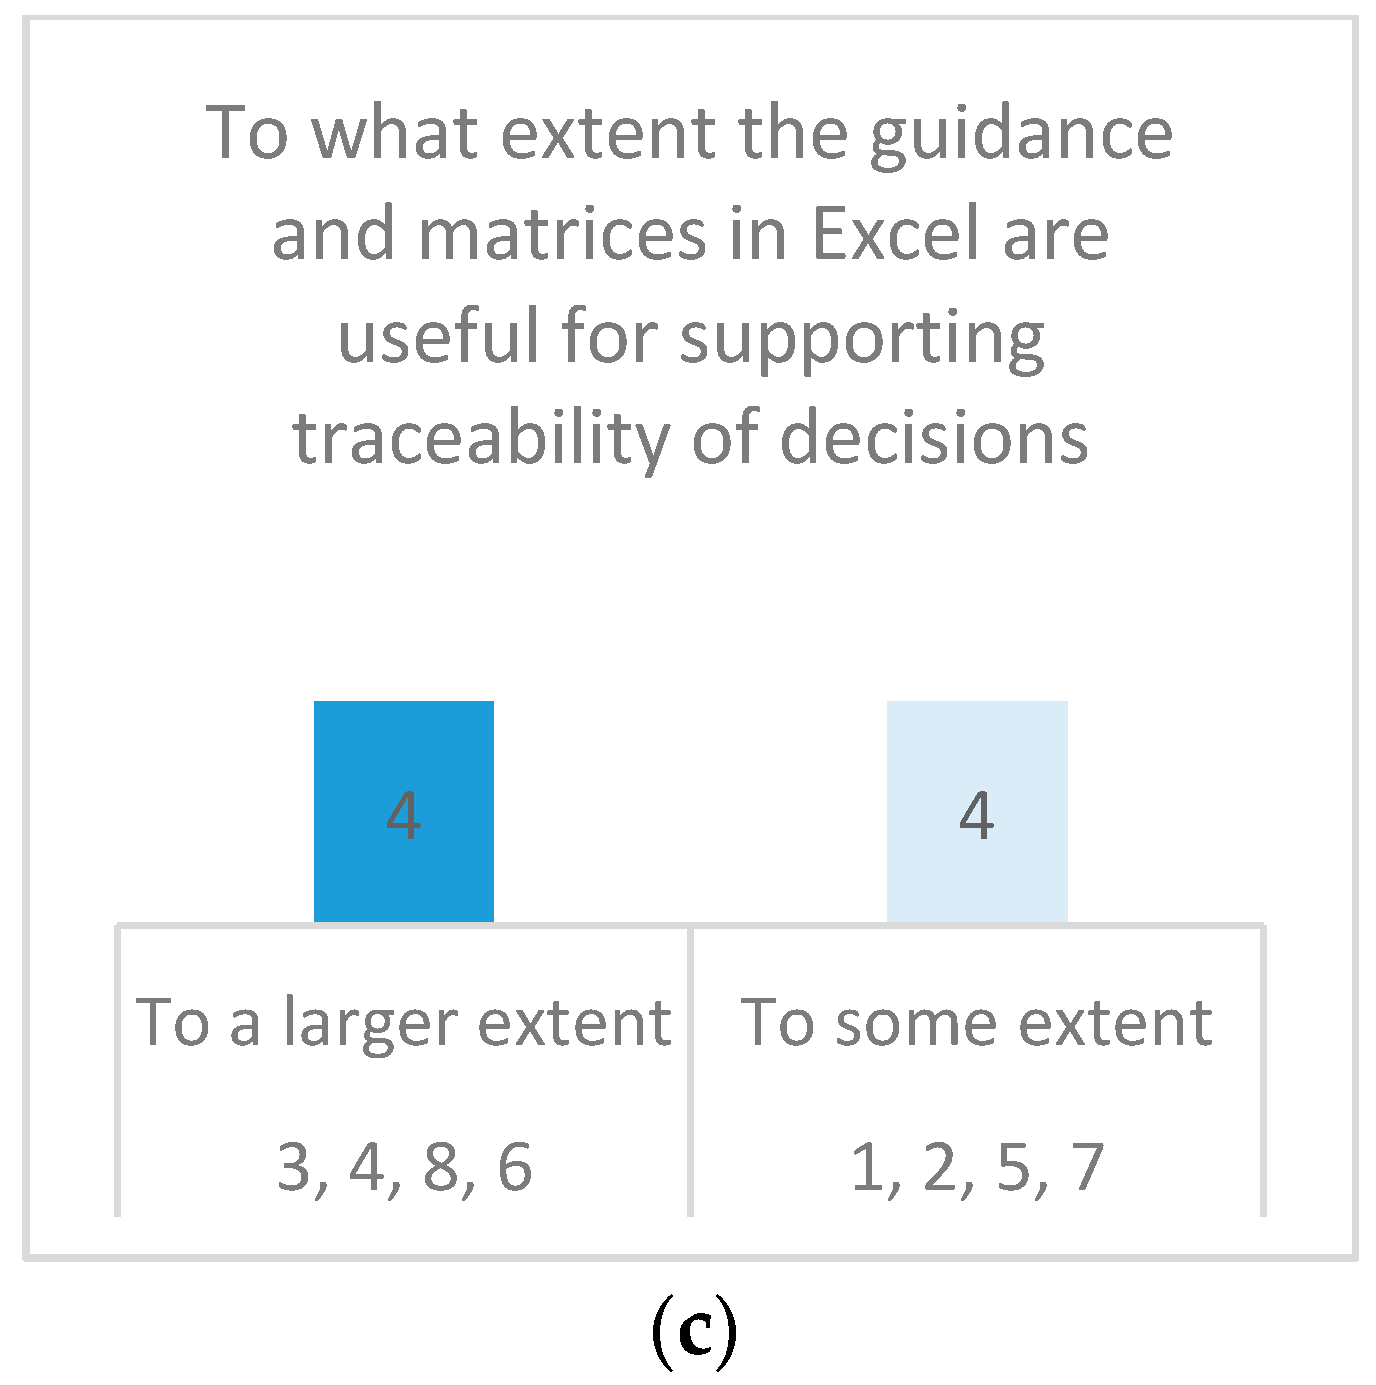
- A structure to support objectivity and traceability of decisions, including re-evaluation of sustainability implications of proposed CE and other initiatives.
Author Contributions
Funding
Institutional Review Board Statement
Informed Consent Statement
Data Availability Statement
Acknowledgments
Conflicts of Interest
Appendix A

References
- Lacy, P.; Long, J.; Spinder, W. The Circular Economy Handbook. In Realizing the Circular Advantage; Palgrave MacMillan: London, UK, 2020. [Google Scholar] [CrossRef]
- EMF. Towards The Circular Economy; Ellen MacArthur Foundation and Ellen MacArthur Foundation Trading Limited: Isle of Wight, UK, 2013. [Google Scholar] [CrossRef] [Green Version]
- Kirchherr, J.; Reike, D.; Hekkert, M. Conceptualizing the circular economy: An analysis of 114 definitions. Resour. Conserv. Recycl. 2017, 127, 221–232. [Google Scholar] [CrossRef]
- Lieder, M.; Rashid, A. Towards circular economy implementation: A comprehensive review in context of manufacturing industry. J. Clean Prod. 2016, 115, 36–51. [Google Scholar] [CrossRef]
- Korhonen, J.; Honkasalo, A.; Seppälä, J. Circular Economy: The Concept and its Limitations. Ecol. Econ. 2018. [Google Scholar] [CrossRef]
- Saidani, M.; Yannou, B.; Leroy, Y.; Cluzel, F.; Kendall, A. A taxonomy of circular economy indicators. J. Clean Prod. 2019, 207, 542–559. [Google Scholar] [CrossRef] [Green Version]
- Linder, M.; Sarasini, S.; van Loon, P. A Metric for Quantifying Product-Level Circularity. J. Ind. Ecol. 2017, 21, 545–558. [Google Scholar] [CrossRef] [Green Version]
- EMF. Circularity Indicators: An Approach to Measuring Circularity. Methodology 2015, 12. [Google Scholar] [CrossRef]
- Lindgreen, E.R.; Salomone, R.; Reyes, T. A critical review of academic approaches, methods and tools to assess circular economy at the micro level. Sustainability 2020, 12, 4973. [Google Scholar] [CrossRef]
- Harris, S.; Martin, M.; Diener, D. Circularity for circularity’s sake? Scoping review of assessment methods for environmental performance in the circular economy. Sustain. Prod. Consum. 2021, 26, 172–186. [Google Scholar] [CrossRef]
- Lonca, G.; Muggéo, R.; Imbeault-Tétreault, H.; Bernard, S.; Margni, M. Does material circularity rhyme with environmental efficiency? Case studies on used tires. J. Clean Prod. 2018, 183, 424–435. [Google Scholar] [CrossRef]
- Cooper, D.R.; Gutowski, T.G. The Environmental Impacts of Reuse: A Review. J. Ind. Ecol. 2017, 21, 38–56. [Google Scholar] [CrossRef]
- Kaddoura, M.; Kambanou, M.L.; Tillman, A.M.; Sakao, T. Is prolonging the lifetime of passive durable products a low-hanging fruit of a circular economy? A multiple case study. Sustainability 2019, 11, 4819. [Google Scholar] [CrossRef] [Green Version]
- Warmington-Lundström, J.; Laurenti, R. Reviewing circular economy rebound effects: The case of online peer-to-peer boat sharing. Resour. Conserv. Recycl. X 2020, 5, 100028. [Google Scholar] [CrossRef]
- Schaubroeck, T. Circular economy practices may not always lead to lower criticality or more sustainability; analysis and guidance is needed per case. Resour. Conserv. Recycl. 2020, 162, 1–3. [Google Scholar] [CrossRef]
- Sassanelli, C.; Rosa, P.; Rocca, R.; Terzi, S. Circular economy performance assessment methods: A systematic literature review. J. Clean Prod. 2019, 229, 440–453. [Google Scholar] [CrossRef]
- Elia, V.; Gnoni, M.G.; Tornese, F. Measuring circular economy strategies through index methods: A critical analysis. J. Clean Prod. 2017, 142, 2741–2751. [Google Scholar] [CrossRef]
- Kristensen, H.S.; Mosgaard, M.A. A review of micro level indicators for a circular economy—Moving away from the three dimensions of sustainability? J. Clean Prod. 2020, 243, 118531. [Google Scholar] [CrossRef]
- Kalmykova, Y.; Sadagopan, M.; Rosado, L. Circular economy—From review of theories and practices to development of implementation tools. Resour. Conserv. Recycl. 2017, 1–13. [Google Scholar] [CrossRef]
- Kravchenko, M.; Pigosso, D.C.A.; McAloone, T.C. A Procedure to Support Systematic Selection of Leading indicators for Sustainability Performance Measurement of Circular Economy Initiatives. Sustainability 2020, 12, 951. [Google Scholar] [CrossRef] [Green Version]
- Bocken, N.M.P.; de Pauw, I.; Bakker, C.; van der Grinten, B. Product design and business model strategies for a circular economy. J. Ind. Prod. Eng. 2016, 33, 308–320. [Google Scholar] [CrossRef] [Green Version]
- Blomsma, F.; Brennan, G. The emergence of circular economy—A new framing around prolonging resource productivity. J. Ind. Ecol. 2017, 21, 603–614. [Google Scholar] [CrossRef]
- Bovea, M.D.; Pérez-Belis, V. A taxonomy of ecodesign tools for integrating environmental requirements into the product design process. J. Clean Prod. 2012, 20, 61–71. [Google Scholar] [CrossRef]
- Buchert, T.; Halstenberg, F.A.; Stark, R. Target-driven selection and scheduling of methods for sustainable product development. J. Clean Prod. 2017, 161, 403–421. [Google Scholar] [CrossRef]
- De Koeijer, B.; de Lange, J.; Wever, R. Desired, perceived, and achieved sustainability: Trade-offs in strategic and operational packaging development. Sustainability 2017, 9, 1923. [Google Scholar] [CrossRef] [Green Version]
- Gibson, R.B.; Hassan, S.; Holtz, S.; Tansey, J.; Whitelaw, G. Sustainability Assessment: Criteria, Processes and Applications; Earthscan: London, UK, 2005. [Google Scholar]
- Byggeth, S.; Hochschorner, E. Handling trade-offs in Ecodesign tools for sustainable product development and procurement. J. Clean Prod. 2006, 14, 1420–1430. [Google Scholar] [CrossRef]
- Zarte, M.; Pechmann, A.; Nunes, I.L. Decision support systems for sustainable manufacturing surrounding the product and production life cycle e A literature review. J. Clean Prod. 2019, 219, 336–349. [Google Scholar] [CrossRef]
- De Magalhães, R.F.; de Danilevicz, Â.M.F.; Palazzo, J. Managing trade-offs in complex scenarios: A decision-making tool for sustainability projects. J. Clean Prod. 2019, 212, 447–460. [Google Scholar] [CrossRef]
- Minnameier, G. The Logicality of Abduction, Deduction and Induction. In Ideas in Action, Proceedings of the Applying Peirce Conference, Helsinki, Finland, 11–13 June 2007; Nordic Pragmatism Network: Helsinki, Finland, 2010; pp. 239–251. [Google Scholar]
- Yin, R.K. Qualitative Research from Start to Finish; The Guilford Press: New York, NY, USA, 2011. [Google Scholar] [CrossRef]
- Rocco, S.T.; Plakhotnik, S.M. Literature reviews, conceptual frameworks, and theoretical frameworks: Terms, functions, and distinctions. Hum. Resour Dev. Rev. 2009, 8, 120–130. [Google Scholar] [CrossRef] [Green Version]
- Dekoninck, E.A.; Domingo, L.; Hare, J.A.O.; Pigosso, D.C.A.; Reyes, T. Defining the challenges for ecodesign implementation in companies: Development and consolidation of a framework. Clean Prod. 2016, 135, 410–425. [Google Scholar] [CrossRef] [Green Version]
- Stindt, D. A generic planning approach for sustainable supply chain management—How to integrate concepts and methods to address the issues of sustainability? J. Clean Prod. 2017, 153, 146–163. [Google Scholar] [CrossRef]
- Schulte, J.; Hallstedt, S.I. Challenges And Preconditions To Build Capabilities For Sustainable Product Design. In Proceedings of the DS 87-1 21st International Conference on Engineering Design (ICED 17), Vancouver, BC, Canada, 21–25 August 2017; pp. 1–10. [Google Scholar]
- Molina-Besch, K.; Pålsson, H. A Supply Chain Perspective on Green Packaging Development- Theory Versus Practice. Packag. Technol. Sci. 2016, 29, 45–63. [Google Scholar] [CrossRef]
- Prendeville, S.M.; O’Connor, F.; Bocken, N.M.P.; Bakker, C. Uncovering ecodesign dilemmas: A path to business model innovation. J. Clean Prod. 2017, 143, 1327–1339. [Google Scholar] [CrossRef] [Green Version]
- Wu, Z.; Pagell, M. Balancing priorities: Decision-making in sustainable supply chain management. J. Oper. Manag. 2011, 29, 577–590. [Google Scholar] [CrossRef]
- Björklund, M.; Forslund, H. Challenges addressed by swedish third-party logistics providers conducting sustainable logistics business cases. Sustainability 2019, 11, 2654. [Google Scholar] [CrossRef] [Green Version]
- Morrison-Saunders, A.; Pope, J. Conceptualising and managing trade-offs in sustainability assessment. Environ. Impact Assess. Rev. 2013, 38, 54–63. [Google Scholar] [CrossRef] [Green Version]
- Blessing, L.; Chakrabarti, A. DRM: A Design Research Methodology; Springer: Berlin/Heidelberg, Germany, 2009; pp. 13–42. [Google Scholar] [CrossRef]
- Nilsson-Lindén, H.; Baumann, H.; Rosén, M.; Diedrich, A. Organizing life cycle management in practice: Challenges of a multinational manufacturing corporation. Int. J. LIFE CYCLE Assess. 2018, 23, 1368–1382. [Google Scholar] [CrossRef]
- Short, T.; Lee-Mortimer, A.; Luttropp, C.; Johansson, G. Manufacturing, sustainability, ecodesign and risk: Lessons learned from a study of Swedish and English companies. J. Clean Prod. 2012, 37, 342–352. [Google Scholar] [CrossRef]
- Abbasi, M.; Nilsson, F. Developing environmentally sustainable logistics. Exploring themes and challenges from a logistics service providers’ perspective. Transp. Res. Part D Transp. Environ. 2016, 46, 273–283. [Google Scholar] [CrossRef]
- Paulson, F.; Sundin, E. Challenges When Including Sustainability Aspects in Product Development at Two Large Manufacturing Companies in Sweden. In Technol. Eco-Innovation Towar; Hu, H.A., Ed.; Springer Nature Singapore Pte Ltd.: Berlin/Heidelberg, Germany, 2019; pp. 229–243. [Google Scholar]
- Watz, M.; Hallstedt, S.I. Profile model for management of sustainability integration in engineering design requirements. J. Clean Prod. 2020, 247, 119155. [Google Scholar] [CrossRef]
- Battistella, C.; Cagnina, M.R.; Cicero, L.; Preghenella, N. Sustainable Business Models of SMEs: Challenges in Yacht Tourism Sector. Sustainability 2018, 10, 3437. [Google Scholar] [CrossRef] [Green Version]
- Hallstedt, S.; Thompson, A. Sustainability driven product development -some challenges and opportunities for aero industry. In Proceedings of the International Society for Airbreathing Engines, ISABE, Goteborg, Sweden, 12–16 September 2011; p. 9. [Google Scholar]
- Issa, I.I.; Pigosso, D.C.A.; McAloone, T.C.; Rozenfeld, H. Leading product-related environmental performance indicators: A selection guide and database. J. Clean Prod. 2015, 108, 321–330. [Google Scholar] [CrossRef]
- Kennedy, S.; Bocken, N. Innovating Business Models for Sustainability: An Essential Practice for Responsible Managers. In Research Handbook of Responsible Management; Laasch, O., Jamali, D., Freeman, E., Suddaby, R., Eds.; Edward Elgar Publishing Ltd.: Cheltenham, UK, 2020; p. 18. [Google Scholar]
- Driessen, P.H.; Hillebrand, B. Integrating multiple stakeholder issues in new product development: An exploration. J. Prod. Innov. Manag. 2013, 30, 364–379. [Google Scholar] [CrossRef]
- Chou, C.J.; Chen, C.W.; Conley, C. An approach to assessing sustainable product-service systems. J. Clean Prod. 2015, 86, 277–284. [Google Scholar] [CrossRef]
- Abbasi, M.; Nilsson, F. Themes and challenges in making supply chains environmentally sustainable. Supply Chain Manag. Int. J. 2012, 5, 517–530. [Google Scholar] [CrossRef]
- Evans, S.; Vladimirova, D.; Holgado, M.; Van Fossen, K.; Yang, M.; Silva, E.A.; Barlow, C.Y. Business Model Innovation for Sustainability: Towards a Unified Perspective for Creation of Sustainable Business Models. Bus. Strateg. Environ. 2017, 26, 597–608. [Google Scholar] [CrossRef]
- Manninen, K.; Koskela, S.; Antikainen, R.; Bocken, N.M.P.; Dahlbo, H.; Aminoff, A. Do circular economy business models capture the environmental value propositions? Framework for evaluating of the environmental value propositions circular economy business models. J. Clean Prod. 2018, 171. [Google Scholar] [CrossRef] [Green Version]
- Schöggl, J.P.; Baumgartner, R.J.; Hofer, D. Improving sustainability performance in early phases of product design: A checklist for sustainable product development tested in the automotive industry. J. Clean Prod. 2017, 140, 1602–1617. [Google Scholar] [CrossRef]
- Bhamra, T.; Lilley, D.; Tang, T. Design for Sustainable Behaviour: Using products to change consumer behaviour. Des. J. 2011, 14, 427–445. [Google Scholar] [CrossRef]
- Fontes, J. Handbook for Product Social Impact Assessment; PRé Sustainability: Amersfoort, The Netherlands, 2016. [Google Scholar]
- Held, M.; Weidmann, D.; Kammerl, D.; Hollauer, C.; Mörtl, M.; Omer, M.; Lindemann, U. Current challenges for sustainable product development in the German automotive sector: A survey based status assessment. J. Clean Prod. 2018, 195, 869–889. [Google Scholar] [CrossRef]
- Silvius, A.J.G.; Kampinga, M.; Paniagua, S.; Mooi, H. Considering sustainability in project management decision making; An investigation using Q-methodology. Int. J. Proj. Manag. 2017, 35, 1133–1150. [Google Scholar] [CrossRef]
- Shields, D.J.; Šolar, S.V.; Martin, W.E. The role of values and objectives in communicating indicators of sustainability. Ecol. Indic. 2002, 2, 149–160. [Google Scholar] [CrossRef]
- Bengtsson, M. Weighting in practice: Implications for the use of life-cycle assessment in decision making. J. Ind. Ecol. 2001, 4, 47–60. [Google Scholar] [CrossRef]
- Dutta, P.; Das, D.; Schultmann, F.; Frohling, M. Design and planning of a closed-loop supply chain with three way recovery and buy-back offer. Clean Prod. 2016, 135, 604–619. [Google Scholar] [CrossRef]
- Matschewsky, J.; Lindahl, M.; Sakao, T. Facilitating industrial adoption of design methods for product-service systems. Proc. Int Conf Eng. Des. ICED 2015, 7, 301–310. [Google Scholar]
- Watz, M.; Hallstedt, S.I. Integrating Sustainability in Product Requirements. In Proceedings of the DESIGN 2018 15th International Design Conference, Dubrovnik, Croatia, 21–24 May 2018; pp. 1405–1416. [Google Scholar] [CrossRef]
- Van den Berg, M.R.; Bakker, C.A. A product design framework for a circular economy. PLATE 2015, 365–379. [Google Scholar]
- Geissdoerfer, M.; Savaget, P.; Bocken, N.M.P.; Hultink, E.J. The Circular Economy—A new sustainability paradigm? J. Clean Prod. 2017, 143, 757–768. [Google Scholar] [CrossRef] [Green Version]
- Agrawal, V.V.; Ferguson, M.; Toktay, B.L.; Thomas, V.M. Is Leasing Greener Than Selling? Manag. Sci. 2012, 58, 523–533. [Google Scholar] [CrossRef] [Green Version]
- Hahladakis, J.N.; Iacovidou, E. An overview of the challenges and trade-offs in closing the loop of post-consumer plastic waste (PCPW): Focus on recycling. J. Hazard. Mater. 2019, 380, 120887. [Google Scholar] [CrossRef]
- Pieroni, M.P.P.; McAloone, T.C.; Pigosso, D.C.A. Configuring new business models for circular economy through product-service systems. Sustainability 2019, 11, 3727. [Google Scholar] [CrossRef] [Green Version]
- Romli, A.; Prickett, P.; Setchi, R.; Soe, S. Integrated eco-design decision-making for sustainable product development. Int. J. Prod. Res. 2015, 53, 549–571. [Google Scholar] [CrossRef]
- Pigosso, D.C.A.; Rozenfeld, H.; McAloone, T.C. Ecodesign maturity model: A management framework to support ecodesign implementation into manufacturing companies. J. Clean Prod. 2013, 160–173. [Google Scholar] [CrossRef] [Green Version]
- Kravchenko, M.; Pigosso, D.C.A.; Mcaloone, T.C. Developing a Tool to Support Decisions in Sustainability-Related Trade-Off Situations: Understanding Needs and Criteria. In Proceedings of the Design Society: DESIGN Conference, Cavtat, Croatia, 11 June 2020; pp. 265–274. [Google Scholar] [CrossRef]
- Zetterlund, H.; Hallstedt, S.; Broman, G. Implementation Potential of Sustainability-oriented Decision Support in Product Development. Procedia CIRP 2016, 50, 287–292. [Google Scholar] [CrossRef] [Green Version]
- Hansen, C.T.; Andreasen, M.M. A Mapping of Design Decision-Making. In Proceedings of the DESIGN 2004 8th International Design Conference, Dubrovnik, Croatia, 18–21 May 2004; pp. 1409–1418. [Google Scholar]
- Ray, G.; Barney, J.B.; Muhanna, W.A. Capabilities, business processes, and competitive advantage: Choosing the dependent variable in empirical tests of the resource-based view. Strateg. Manag. J. 2004, 25, 23–37. [Google Scholar] [CrossRef]
- DaSilva, C.M.; Trkman, P. Business model: What it is and what it is not. Long Range Plann. 2014, 47, 379–389. [Google Scholar] [CrossRef]
- Hallstedt, S.I. Sustainability criteria and sustainability compliance index for decision support in product development. J. Clean Prod. 2017, 140, 251–266. [Google Scholar] [CrossRef]
- Retief, F.; Morrison-Saunders, A.; Geneletti, D.; Pope, J. Exploring the psychology of trade-off decision-making in environmental impact assessment. Impact Assess. Proj. Apprais. 2013, 31, 13–23. [Google Scholar] [CrossRef] [Green Version]
- Waas, T.; Hugé, J.; Block, T.; Wright, T.; Benitez-Capistros, F.; Verbruggen, A. Sustainability assessment and indicators: Tools in a decision-making strategy for sustainable development. Sustainability 2014, 6, 5512–5534. [Google Scholar] [CrossRef] [Green Version]
- Kjaer, L.L.; Pigosso, D.C.A.; McAloone, T.C.; Birkved, M. Guidelines for evaluating the environmental performance of Product/Service-Systems through life cycle assessment. J. Clean Prod. 2018, 190, 666–678. [Google Scholar] [CrossRef] [Green Version]
- Arena, M.; Ciceri, N.D.; Terzi, S.; Bengo, I.; Azzone, G.; Garetti, M. A state-of-the-art of industrial sustainability: Definitions, tools and metrics. Int. J. Prod. Lifecycle Manag. 2009, 4, 207. [Google Scholar] [CrossRef]
- Pieroni, M.P.P.; McAloone, T.C.; Pigosso, D.C.A. Business model innovation for circular economy and sustainability: A review of approaches. J. Clean Prod. 2019, 215, 198–216. [Google Scholar] [CrossRef]
- OECD. OECD Environmental Indicators: Development, Measurement and Use; OECD Environment Directorate: Paris, France, 2003; Available online: http://www.oecd.org/env/ (accessed on 28 November 2020).
- Epstein, M.J.; Buhovac, A.R.; Yuthas, K. Managing Social, Environmental and Financial Performance Simultaneously. Long Range Plann. 2015, 48, 35–45. [Google Scholar] [CrossRef]
- Ernawati, D.; Pujawan, I.N.; Batan, I.M.L.; Anityasari, M. Evaluating alternatives of product design: A multi criteria group decision making approach. Int. J. Serv. Oper. Manag. 2015, 20, 271–288. [Google Scholar] [CrossRef]
- Rossi, M.; Papetti, A.; Marconi, M.; Germani, M. A multi-criteria index to support ecodesign implementation in manufacturing products: Benefits and limits in real case studies. Int. J. Sustain. Eng. 2019, 12, 376–389. [Google Scholar] [CrossRef]
- Hannouf, M.; Assefa, G. A life cycle sustainability assessment-based decision-analysis framework. Sustainability 2018, 10, 3863. [Google Scholar] [CrossRef] [Green Version]
- Nilsson, S.; Sundin, E.; Lindahl, M. Integrated product service offerings e Challenges in setting requirements. J. Clean Prod. 2018, 201, 879–887. [Google Scholar] [CrossRef]
- Baldassarre, B.; Konietzko, J.; Brown, P.; Calabretta, G.; Bocken, N.; Karpen, I.O.; Hultink, E.J. Addressing the design-implementation gap of sustainable business models by prototyping: A tool for planning and executing small-scale pilots. J. Clean Prod. 2020, 255, 120295. [Google Scholar] [CrossRef]
- Salari, M.; Bhuiyan, N. A new model of sustainable product development process for making trade-offs. Int. J. Adv. Manuf. Technol. 2018, 94, 1–11. [Google Scholar] [CrossRef]


| Expert ID | Area of Expertise | Level of Experience |
|---|---|---|
| Industrial experts (IE) | ||
| IA#1 | Product design, LCA modelling | >5 years |
| IA#2 | Product design, manufacturing efficiency, circular economy design | >5 years |
| IA#3 | Product design, circular economy design | >2 years |
| IA#4 | Mechanical and environmental engineering | >25 years |
| IA#5 | Health, quality and safety management, risk management | >2 years |
| IA#6 | Product design, LCA modelling | >5 years |
| IA#7 | LCA modelling, sustainability consulting | >10 years |
| IA#8 | Environmental management, sustainable supply chain management | >10 years |
| Academic experts (AE)—collective | ||
| AE#1-12 | Product design, eco-design, LCA modeling | Mixed |
| Nr | Challenge | Fr 1 | Example | Business Process | ||
|---|---|---|---|---|---|---|
| BM | PD&PSS | SC&M | ||||
| 1 | Prioritizing key sustainability issues and related criteria (e.g., ‘must’ vs. ‘nice to have’) | 6 | Deciding whether to focus on minimizing CO2 emissions and energy use or on water scarcity and water use | √ | √ | √ |
| 2 | Balancing sustainability and other (technical, customer) criteria | 9 | Deciding whether to reduce VOC content in a chemical product which will complicate use of the chemical by the user | √ | √ | √ |
| 3 | Finding a logic of selecting relevant sustainability indicators or measurement methods to quantify sustainability criteria | 11 | Deciding whether to use generic indicators or (customer, supplier, process) specific indicators; use absolute or relative indicators; find a right balance of indicators across sustainability dimensions | √ | √ | √ |
| 4 | Uncertainty in what data to use for sustainability measurements and data quality | 4 | Understanding how toxicity is measured; understanding social issues are measured | - | √ | √ |
| 5 | Interpreting sustainability measurement results to guide decision-making process (e.g., to introduce improvements or show achievement of targets) | 9 | Understanding whether to focus on reducing the total number of chemical substances in a product or eliminating one chemical | √ | √ | √ |
| 6 | Navigating conflicting sustainability criteria, indicators, and measurement results | 11 | How to choose: increased durability compromises recyclability; sourcing of a recycled material increases transportation fuel use and costs | √ | √ | √ |
| Development of a CE Initiative | Challenges and Potential Trade-Offs between the CE Criteria (E—Environmental, Q—Quality, C—Cost) | Challenges and Potential Trade-Offs with Added Triple Bottom Criteria (E—Environmental, Q—Quality, C—cost, S—Social) | ||
|---|---|---|---|---|
| Offering a leasing scheme for a product (limited time allows to control returns of used products; reduced cost of ‘ownership’ for the customer) [68] | Might require adding/substituting material to increase durability of a product (or parts) leading to increase in development costs and higher (or other type of) resource use |  | Might require selecting a material supplier who has not documented material origin |  |
| Introduction of recycled content (to reduce reliance on virgin materials) [69] | Might reduce product/part aesthetic quality (leading to customer dissatisfaction) and physical durability (leading to shorter lifetime) |  | Recycled material might be offered by local recycler at reduced costs |  |
| Elimination of toxic substances (e.g., from impregnation process) (to reduce contamination of potential recycling flows) [70] | Might compromise durability of the product leading to its premature obsolescence and waste generation |  | Might require additional cost from the user to maintain the product |  |
| Criteria # | Elaboration | Criteria Embedded in the TONF |
|---|---|---|
| Pre-condition | ||
| #1—Reveal trade-offs between and within sustainability dimensions [26,27,44,46] |
| Input data:
|
| Decision analysis | ||
| #2—Provide several prioritization techniques to encourage open dialogue [34,40,51] |
| A step-by-step guidance:
|
| #3—Provide rules to evaluate trade-off acceptability [26] |
| |
| #4—Easy to use [24,64,74] |
| N/A
|
| #5—Flexible for different business processes (own criteria based on the summary of challenges in Table 2) |
| N/A
|
| Decisions and actions | Objective (as a direction) | Criteria (as a concrete aspect) | Indicator (as a measurable support) |
| Toxicity of a product | Measured by e.g., type and amount of toxic materials in a product (%) | |
| Safety at working stations | Measured by e.g., noise levels; physical load index; etc. | |
| Product recyclability | Measured by % of recyclable material in a total mass of product | |
| Consequences/Impact assessment | |||
| Examples of Different Acceptability Ranges Considering Contextual Settings: for the Criteria ‘Product Toxicity’ (Measured by Both Type of Toxic Substances and Their Concentration) There Might be Different Limits Set by Two Companies | ||
|---|---|---|
| Criterion | Company A | Company B |
| Acceptable Ranges | Acceptable Ranges | |
| Toxicity of materials in a product | Acceptable limits: the maximum and only acceptable limit is 0 for both type and concentration | Acceptable limits: the lower value is set to 0 and higher value is set to 4% (of all types of substances, e.g., flame retardants) by total material weight following corporate goal to gradually phase out all toxic substances |
| Examples of Different Acceptability Ranges Considering Contextual Settings: for the Criteria ‘Product Toxicity’ (Measured by Both Type of Toxic Substances and Their Concentration) There Might be Different Limits Set by Two Companies. | ||||
|---|---|---|---|---|
| Criterion | Company A | Company B | ||
| Acceptable Ranges | Negotiability | Acceptable Ranges | Negotiability | |
| Toxicity of materials in a product | the maximum and only acceptable limit is 0 for both type and concentration, because it is a requirement of a customer | Non-negotiable criteria based on the customer requirements | the lower value is set to 0 and higher value is set to 4% (of all types of substances, e.g., flame retardants) by total material weight following corporate goal to gradually phase out all toxic substances | Non-negotiable criteria based on corporateobjective |
| Recycled content in a product | the minimum and only value is 40% | Non-negotiable based on the requirement of a customer | the minimum and only value is set to 25% | Negotiable based on the corporate objective to replace virgin content by recycled whenever possible |
| Reference | Fulfilment of Criteria for a Trade-Off Decision Support | ||||
|---|---|---|---|---|---|
| #1—Reveal Trade-Offs between and within Sustainability Dimensions | #2—Provide Several Prioritization Techniques to Encourage Open Dialogue | #3—Provide Rules to Evaluate Trade-Off Acceptability | #4—Easy to Use (Evaluated by Practitioners) | #5—Flexible for Different Business Processes | |
| Present study | √ | √ | √ | √ | √ |
| [86] | ─ | ~ | ─ | ─ | ─ |
| [87] | ~ | √ | ─ | √ | ~ |
| [88] | √ | ~ | √ | ─ | ~ |
Publisher’s Note: MDPI stays neutral with regard to jurisdictional claims in published maps and institutional affiliations. |
© 2020 by the authors. Licensee MDPI, Basel, Switzerland. This article is an open access article distributed under the terms and conditions of the Creative Commons Attribution (CC BY) license (http://creativecommons.org/licenses/by/4.0/).
Share and Cite
Kravchenko, M.; Pigosso, D.C.A.; McAloone, T.C. A Trade-Off Navigation Framework as a Decision Support for Conflicting Sustainability Indicators within Circular Economy Implementation in the Manufacturing Industry. Sustainability 2021, 13, 314. https://doi.org/10.3390/su13010314
Kravchenko M, Pigosso DCA, McAloone TC. A Trade-Off Navigation Framework as a Decision Support for Conflicting Sustainability Indicators within Circular Economy Implementation in the Manufacturing Industry. Sustainability. 2021; 13(1):314. https://doi.org/10.3390/su13010314
Chicago/Turabian StyleKravchenko, Mariia, Daniela C. A. Pigosso, and Tim C. McAloone. 2021. "A Trade-Off Navigation Framework as a Decision Support for Conflicting Sustainability Indicators within Circular Economy Implementation in the Manufacturing Industry" Sustainability 13, no. 1: 314. https://doi.org/10.3390/su13010314
APA StyleKravchenko, M., Pigosso, D. C. A., & McAloone, T. C. (2021). A Trade-Off Navigation Framework as a Decision Support for Conflicting Sustainability Indicators within Circular Economy Implementation in the Manufacturing Industry. Sustainability, 13(1), 314. https://doi.org/10.3390/su13010314