1. Introduction
Disasters are a social phenomenon [
1]. According to United Nations Office for Disaster Risk Reduction (UNDRR), disasters are a serious disruption to the functioning of a community or a society at any scale. Hazardous events interact with conditions of exposure, vulnerability, and capacity, leading to one or more of the following: human, material, economic and environmental losses, and impacts. People who are socially, economically, culturally, politically, institutionally, or otherwise marginalised are especially vulnerable to climate change and also to some adaptation and mitigation responses [
2]. This intensified vulnerability is the product of intersecting social processes that result in inequalities in socioeconomic status and income, as well as exposure [
3,
4]. Such social processes include, for example, discrimination based on gender, class, ethnicity, age, and (dis)ability [
5,
6]. Other social configuration sources can also intensify vulnerabilities, such as the political and sociocultural context, and geographical location [
7].
In the literature, concepts of perception, coping, adaptation, and mitigation have definitions that often appear concurrently and occur alongside discussions on vulnerability and resilience. Although these concepts together form a network of resources that at high levels create resilience and at low levels create vulnerabilities, they have been applied differently in disaster risk approaches. Risk perception is a fundamental factor in understanding the population’s responses to hazards. In other words, it describes the level of preparedness for hazard occurrences [
8]. Therefore, the empirical knowledge about the risk that people acquire through the information communicated and their own experience are defining elements of risk perception. According to Renn [
9], perception of risk must be seen as a mental or sociopsychological instrument that allows for the prediction of future dangers and facilitates risk reduction measures.
The processes that contribute to disaster risk management and reduction comprise coping, adaptation, and mitigation measures. We distinguish between coping, adaptation, and mitigation following the terminology derived from the universal concepts. The term coping capacity is the ability of people, organisations, and systems, using available skills and resources, to manage adverse conditions of risk or disasters [
10]. Adaptation refers to the process of adjustment to actual or expected climate and its effects to moderate harm or exploit beneficial opportunities [
2]. Lastly, mitigation is the lessening or minimising the adverse impacts of a hazardous event [
10].
Despite the similarity and overlapping of these definitions, coping measures are emergency reactions to a specific event that often take the form of reactive, immediate, and informal schemes [
11,
12]. Adaptive strategies, on the other hand, are actions before the disaster, typically medium and long term. In turn, mitigation involves strategies that reduce the severity of the impacts of disasters that cannot be avoided (for example, structures resistant to hazards). The three types of responses can transform and evolve on the temporal and spatial scales. Coping strategies can develop into adaptive strategies, which in turn can become mitigation strategies over time and as the scale changes. Coping strategies are more likely to occur at the local scale, at the individual and family level, and adaptive strategies are more likely to emerge at larger spatial scales, from a sector or neighbourhood, or the entire city [
12,
13,
14]. For their part, mitigation strategies can involve even larger scales, up to municipalities and jurisdictions.
Daramola et al. [
8] argued that while coping strategies are needed in the aftermath of disasters, they may not always represent desirable options for households (for example, relocating furniture to upper floors and temporary migration). In contrast, strengthening adaptive capacity serves to reduce the establishing of the risks associated with disasters. Norris [
15] defined adaptive capacities as resources with dynamic attributes of (i) robustness, i.e., the resource strength in combination with a low probability of deterioration; (ii) redundancy, i.e., the extent to which elements are substitutable in the event of disruption or degradation; and (iii) rapid accessibility, i.e., how quickly the resource can be accessed and used. The interaction between these available resources and disaster risk factors produces different responses due to the social differences between individuals, families, and communities.
Due to the relationship between the risk of disasters and the existing social configurations, we agree that disasters are a social event. In this way, vulnerability is a dynamic factor that changes as the coping, adaptation, and mitigation arrangements develop. We argue that coping, adaptation, and mitigation are processes that, in this sequence, advance to generate risk reduction. As risk reduction strategies begin with coping strategies and move towards adaptation and mitigation strategies, the processes used evolve, reduce vulnerability, and increase resilience.
The reduction of vulnerability can be even more complex in regions with multiple hazards. Multi-hazards coexist when two or more disasters occur simultaneously or in succession [
16,
17]. A study from Pagliacci and Russo [
18] observed positive correlations between multi-hazards, exposure, vulnerability, and risk. The results express clear trends of interaction between the disasters’ drivers which amplify the multiple hazards impacts. This means that due to the multiplicity of simultaneous risks, many citizens may already have a vulnerability (i.e., from another hazard) and at the same time may need multiple resources for preparation. This condition was highlighted by Aksha [
19], whose work show the cumulative and cascading impacts produced using integrated hazard maps as a function of spatial information (e.g., Geographic Information System-GIS) and socioeconomic data. According to Binita [
16], in the future, urban areas will be even more susceptible to multiple risks due to the increase in population and infrastructure concentration.
Even though the importance of integrating multiple hazards is recognised, especially floods and droughts, most research on hydrological risks tends to focus on either flood risk or drought risk [
20]. Certain locations may suffer flooding and may also experience extreme drought in some years and extreme precipitation in others, even in dry periods; this means that these areas can be facing either water shortage or flooding or both in different times (temporal scale). Temporal and spatial dynamics of disasters are particularly important given that design and implementation of disaster risk strategies can reduce risk in the short term but may increase exposure and vulnerability in the long term [
2].
Therefore, this paper considers the importance of understanding the multiple hazards in both spatial and temporal scales [
21], by linking it with the concept of vulnerability and resilience, and considering the position and situation as elements that produce hazards, while also giving conditions to face them [
22]. With the premise that disaster risk is social, we acknowledge the importance of understanding vulnerabilities and human interactions to comprehend the social context in which the disasters occur [
23], and to evaluate ways to minimise the hazards with the implementation of mitigation strategies [
24,
25].
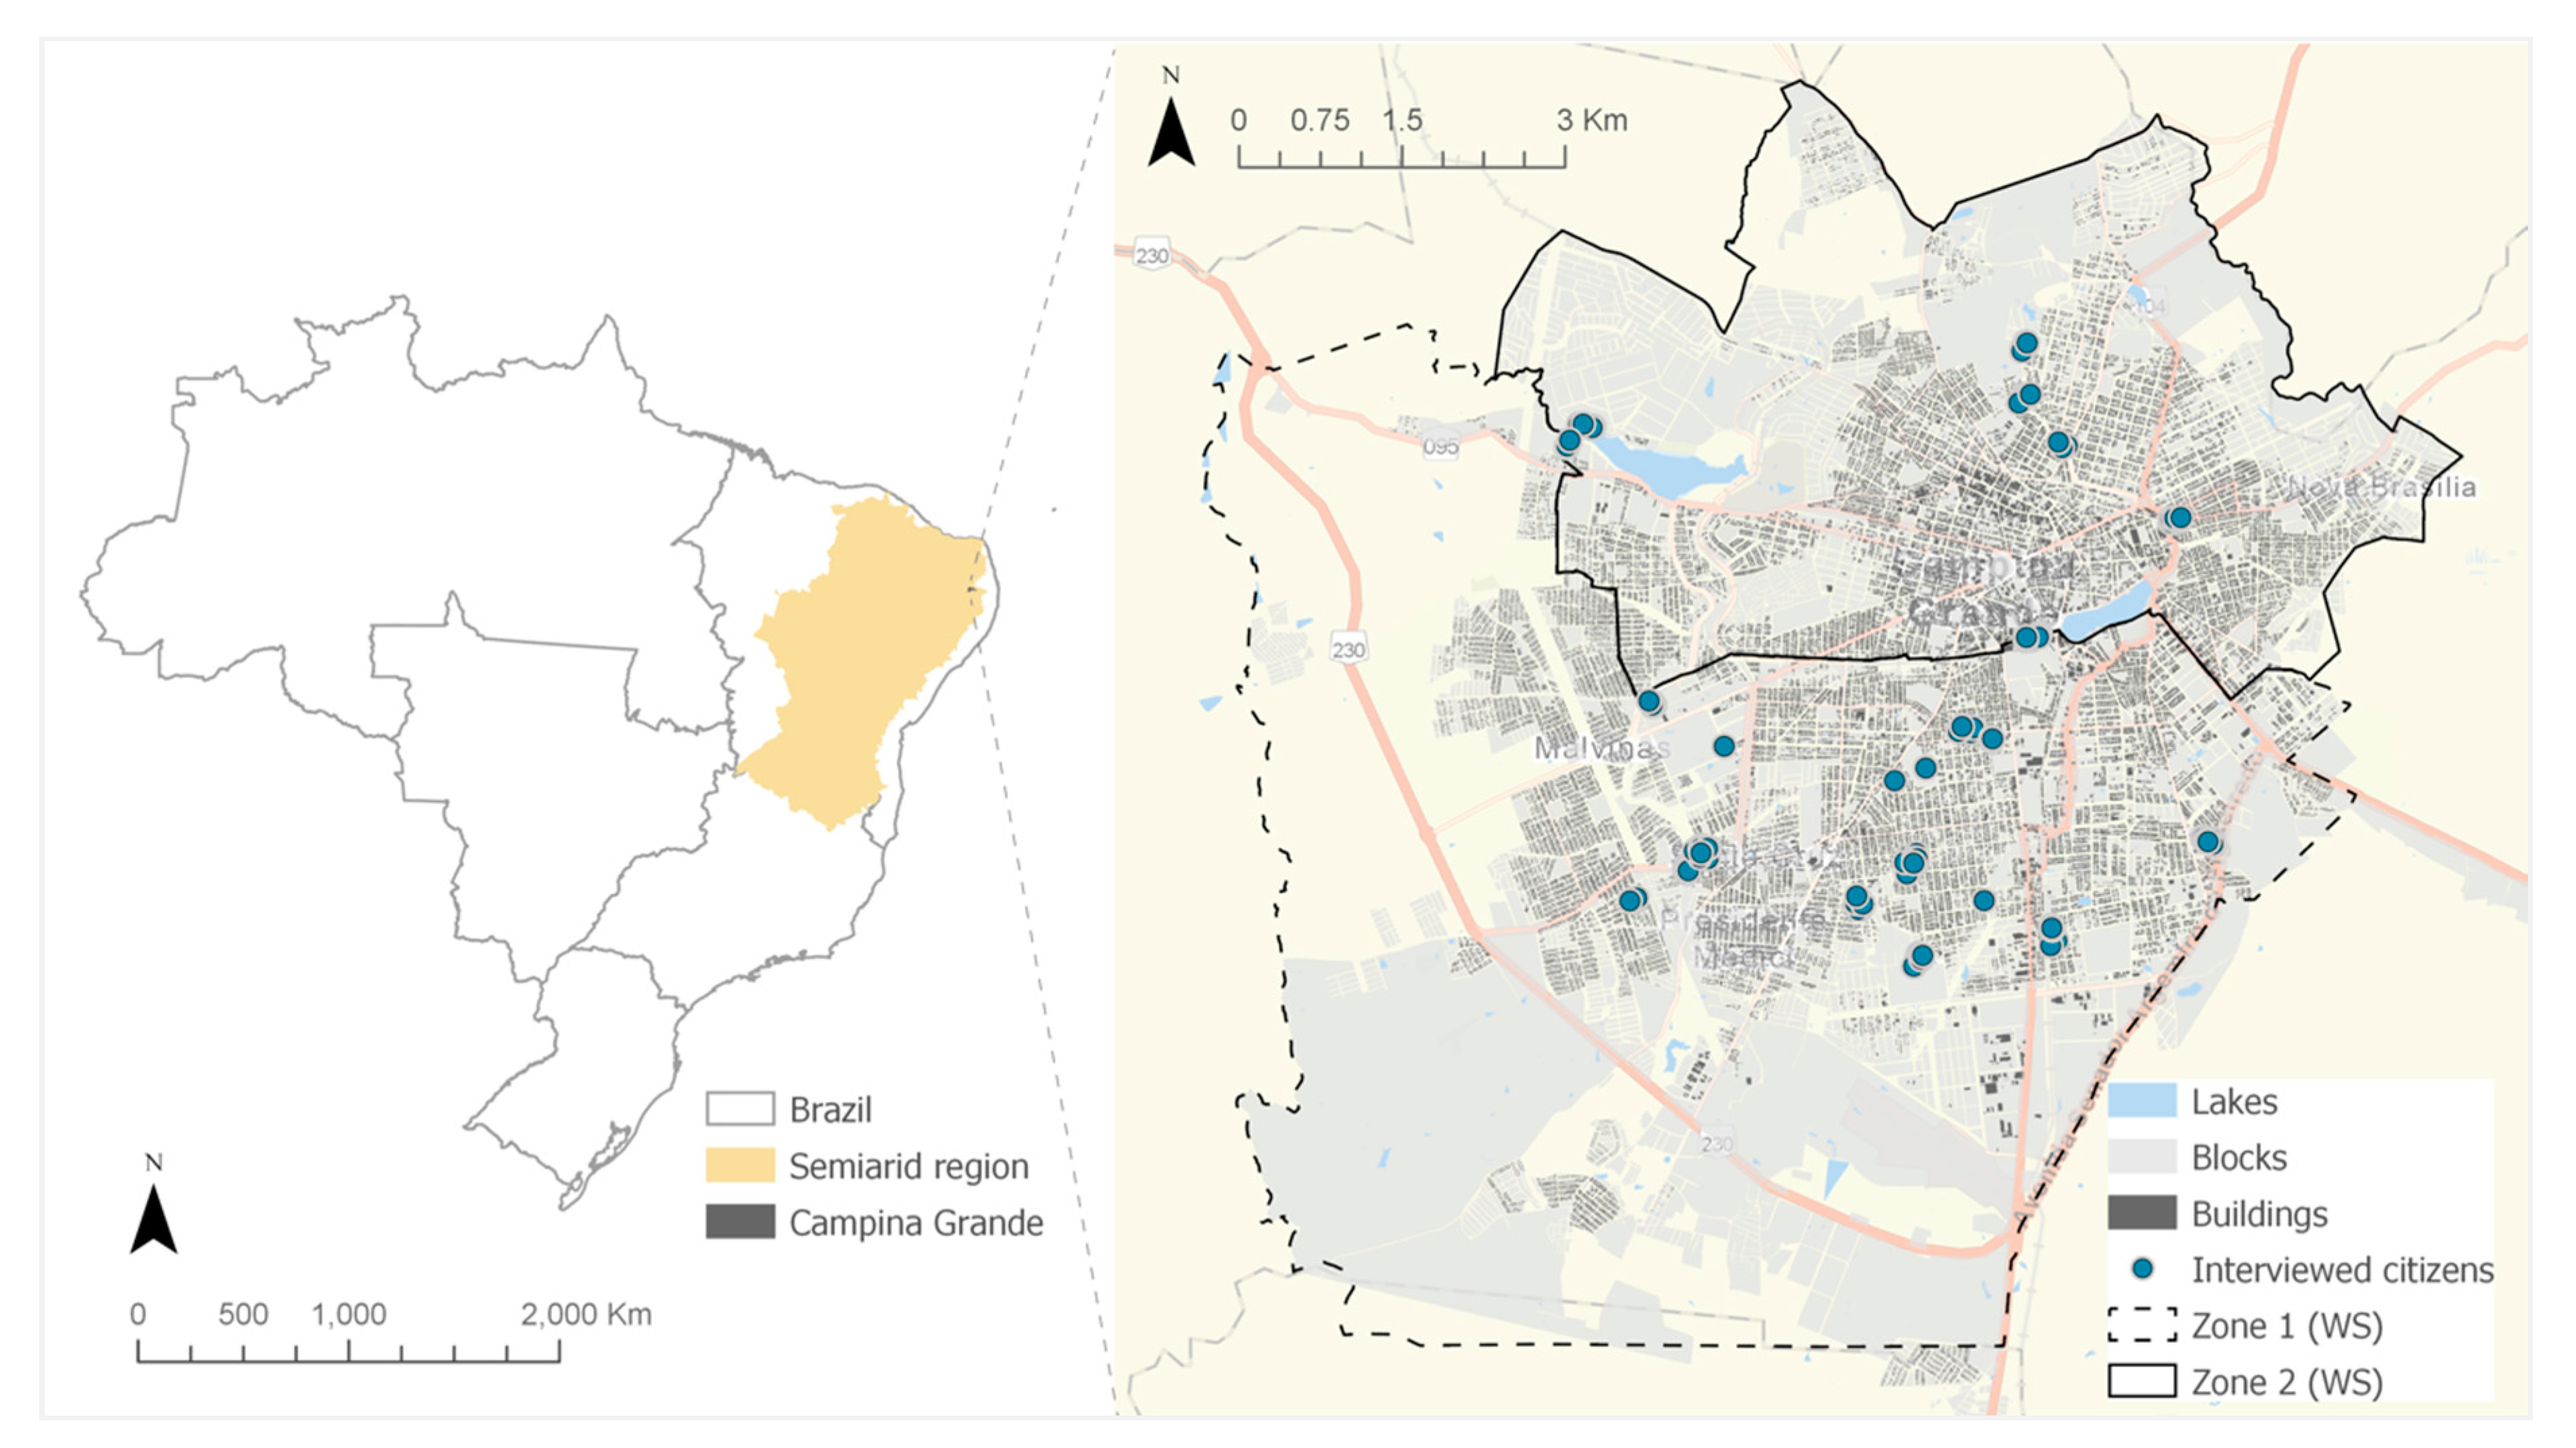
For this, we developed a place-based citizen science methodology [
26,
27] with the participation of stakeholders including residents, authorities, and specialists. A total of 199 participants collaborated in our project, plus 10 from the project team. The context in the study is Campina Grande, Brazil; it is a city with multiple-hazard occurrence (i.e., flooding and water shortage), which implies more complexity in management [
28]. The city has low public participation in the management and issues related to legislation and governance, such as integration between water resources and urban planning [
29]. This study is built upon answering this question: How can we improve the uptake of coping capacity strategies, in the future, when residents face multiple hazards? Particularly, our study aims to understand more deeply the social vulnerabilities in the multi-hazard context by answering two research questions:
In what way are the risk perception (RP) and coping capacity (CC) of residents similar (or different) when facing flooding and water shortage?
What are the main preferences of mitigation strategies to mitigate the hazards?
This paper is organised as follows. First, the case study is presented along with the socio-spatial context of floods and water shortage. Then, aspects of the place-based citizen science framework are explained. Thirdly, the differences and similarities of the risk perception and coping capacity (RQ1) and mitigation (RQ2) of each hazard are detailed. Afterwards, a discussion about the key societal challenges for improving coping capacity is offered by looking at the impacts into vulnerability and resilience. Finally, the study draws up some conclusions about the management of multiple hazards.
3. The Socio-Spatial Context
Since each hazard has a spatial scale but only becomes a disaster with the component of social interaction (e.g., see the disaster risk definition from IPCC [
2]), we classified the complex system (i.e., the city) with a socio-spatial view (
Figure 2). This analysis was inspired with the perspectives presented by Ruiter et al. [
21], in which temporal and spatial scales were discussed for consecutive hazards (more details are available in [
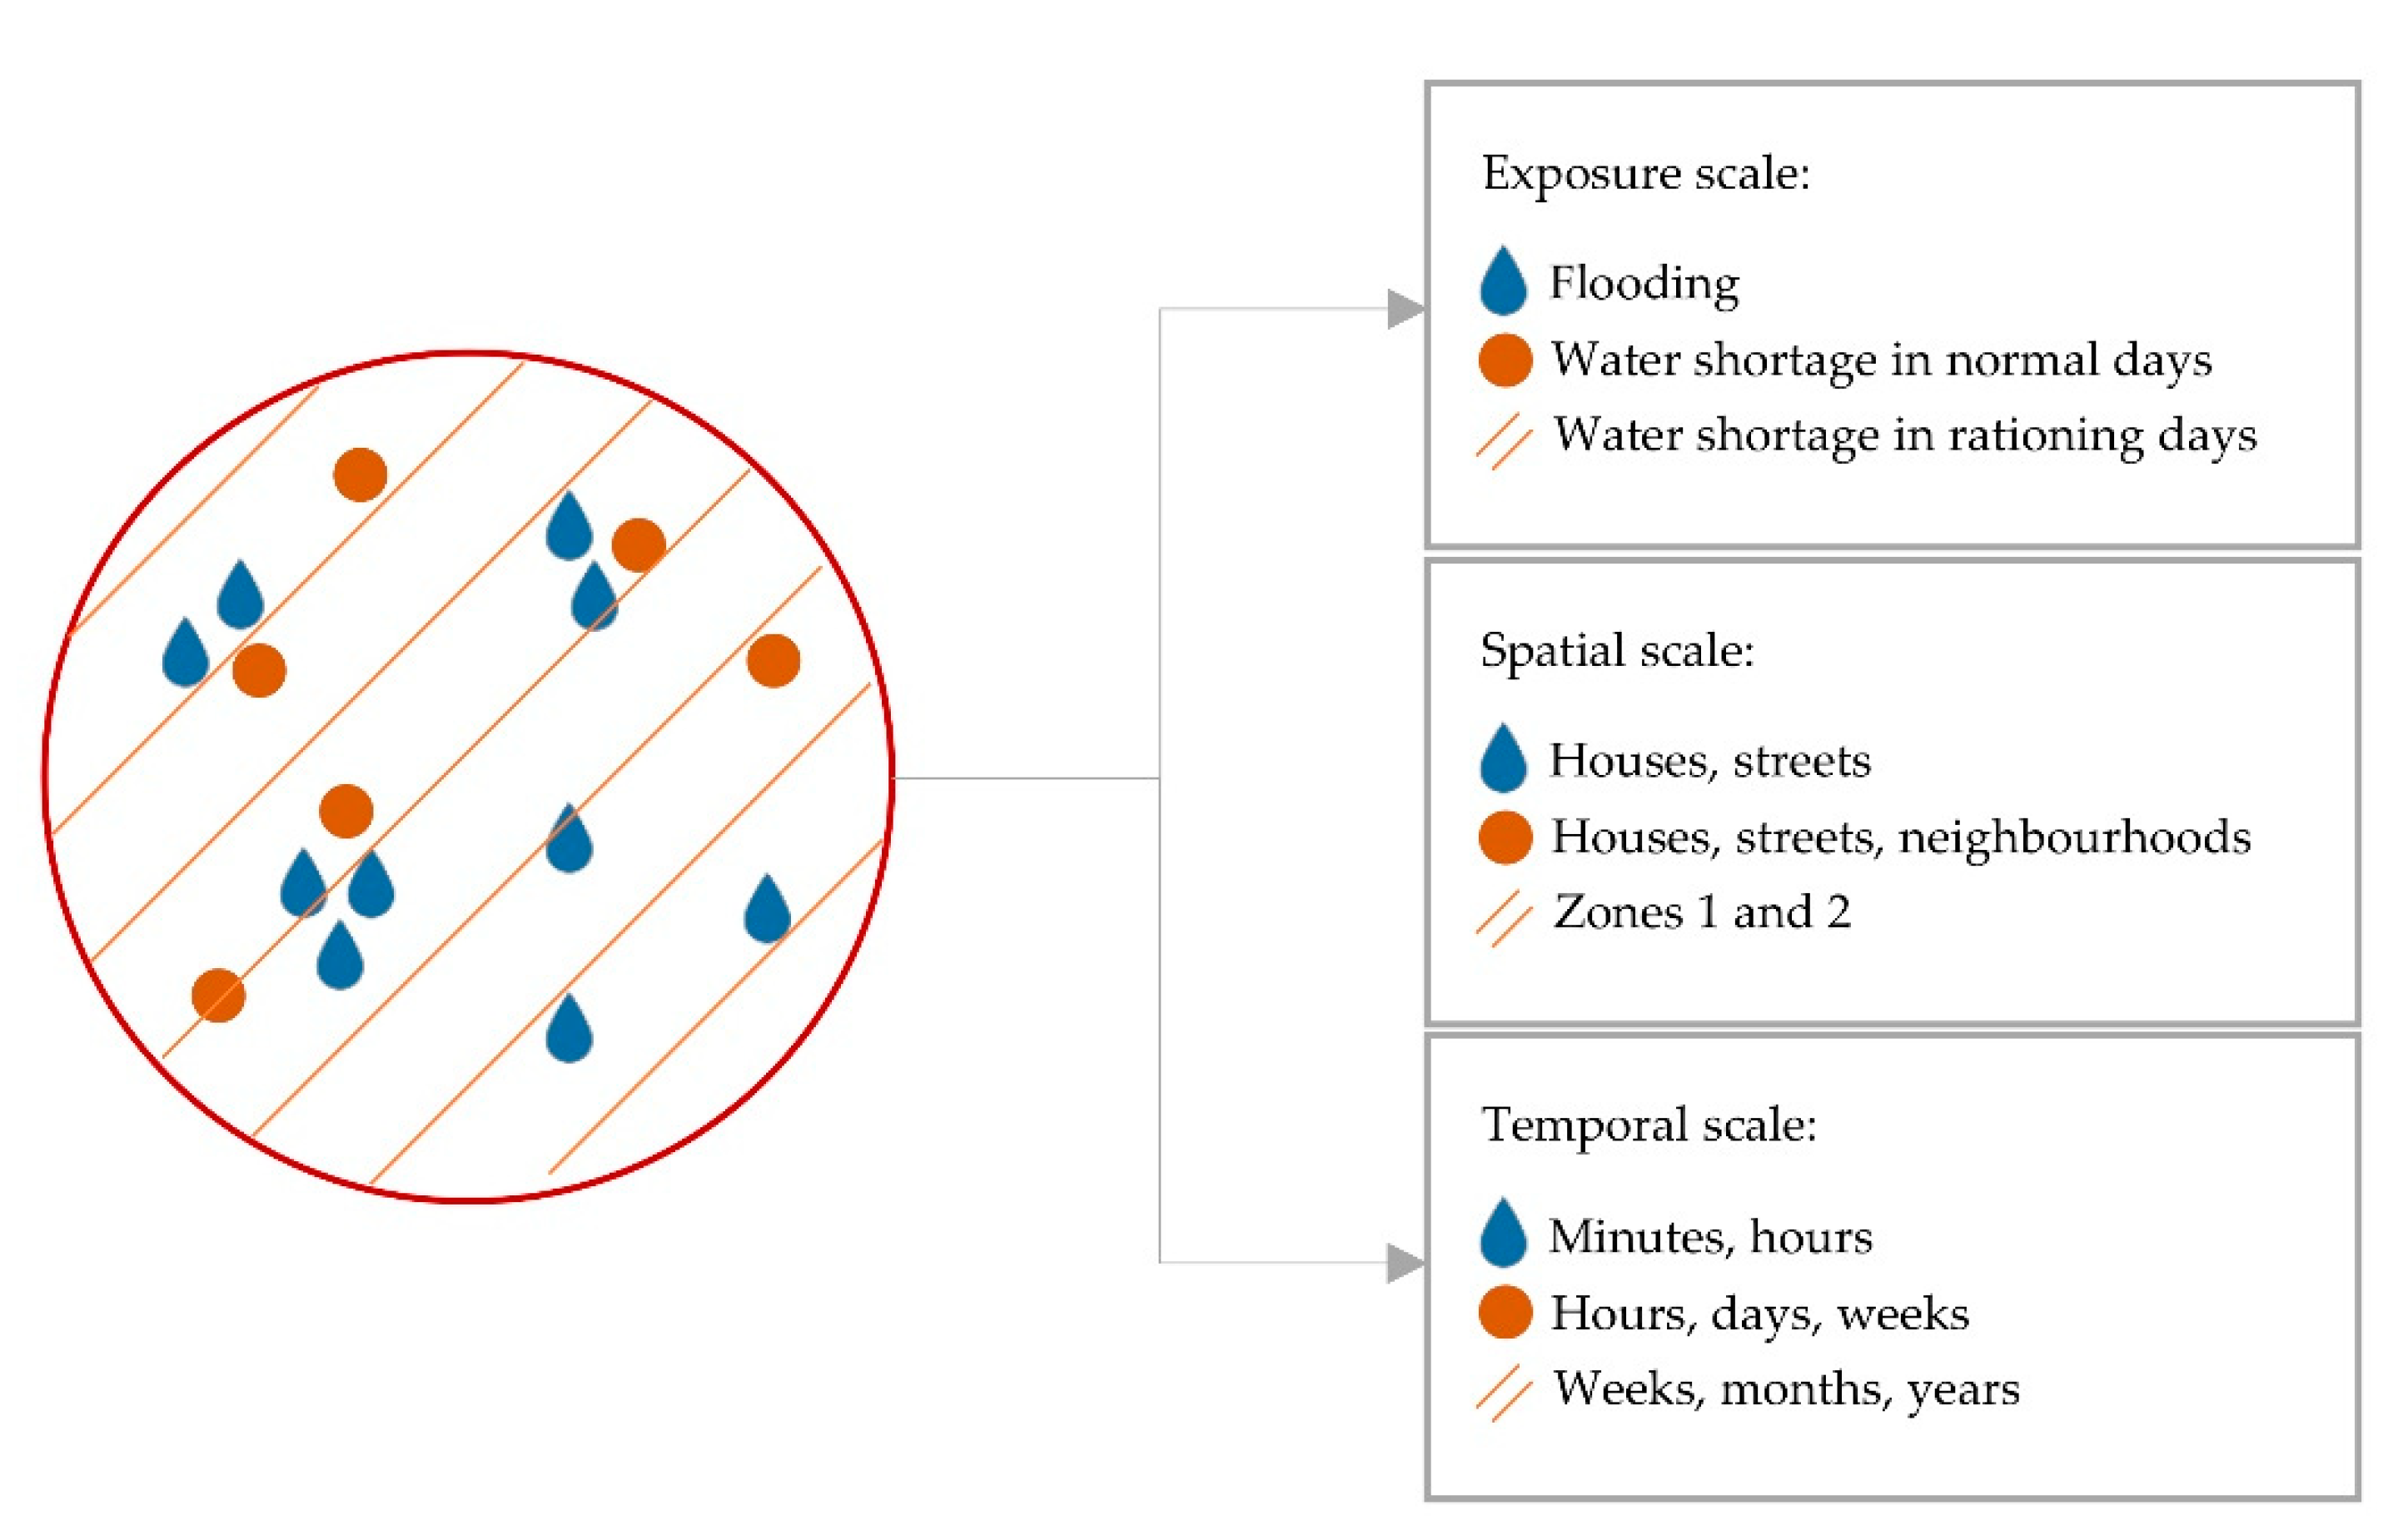
21]). Our approach presents an analysis for flooding and water shortage (WS) not only according to the temporal and spatial scales, but also concerning the social view (or exposure scale) as an attempt to better characterise the view from the residents who are forced to cope with hazards in different scales. The analysis can be applied to multiple hazards and different characteristics.
Figure 2 illustrates that flooding can take place in only a few minutes or hours (temporal scale). Moreover, flooding can create impacts to specific households (and streets) in the spatial scale. Damages can be indirect or direct, depending mainly on the vulnerabilities at the time of the hazard occurrence. On the other hand, water shortage can have two different behaviours. First, there are specific places (spatial scale) in the city that can have a lower water supply in normal days (i.e., not in the dry season) due to losses and problems in the network [
32]. This can last for hours, days, and weeks. However, in the dry season (i.e., rationing days), due to management choices, the whole city is exposed to the hazard, which can last for weeks, months, and years.
Citizens are expected to face and cope with hazards of various different nature and spatial and temporal scales. On one side, the population located only in a part of the city is exposed to flooding and WS on normal days, but on other days (or months, years), the whole city can be exposed to the hazard of WS on rationing days. Due to the character of the hazards, flooding can happen in dry years or in a period of a lack of water on normal days, which makes the same population exposed to more than one hazard on the same temporal scale.
Although WS and flooding generate direct and indirect impacts to the exposed population, we suggest that other factors are sources of vulnerabilities that may increase the damages. Particularly, we highlight that the way which citizens cope with the event can increase or decrease the vulnerabilities. If a community implements sufficient coping responses, the impact of the hazard event may be attenuated [
1]. For example, housing conditions (i.e., building materials) can increase the effects of flooding. On the other hand, rainwater harvesting can reduce the impacts for WS (and flooding). Vulnerabilities are considered as a combination of behaviours and attitudes that may influence the actions (or choices) for hazards mitigation in the socio-spatial context. Here, we analyse the vulnerabilities as “key societal challenges” faced by the exposed population that have a crucial role for increasing the resilience [
15].
4. Methodology
Citizen science terminologies are dynamic and change over time [
33]. Throughout this study, the definition of citizen science (CS) provided by Lewentein (2016) is used. The author characterised CS as a science to society and also as participatory citizen science, where people mostly contribute observations or efforts for the scientific enterprise (a complete description is detailed in [
33]). In this paper, the place-based citizen science is used as a tool that provides more means to understand the social environment in which disasters take place [
34]. Our method is based on three steps detailed below.
The citizen science was conceptualised in a participatory approach, i.e., Project PLANEJEEE (abbreviated from
Planeje Eventos Extremos in Portuguese, translated as “to plan extreme events”), from May to June 2019. The project had the participation of 172 residents and 27 specialists and policymakers in different collaboration strategies, including surveys, informal meetings, workshops, and discussion groups. The sample size for residents’ participation was calculated through the simplified Yamane’s formula [
35]. Data from the Geological Survey of Brazil (CPRM) show that 2156 citizens were in the risk areas of Campina Grande in 2014. From this, the sample size with a minimum of 96 people with an error acceptance of 10% was determined using Equation (1).
where
n is the sample size,
N is the total number of residents, and
e is the error acceptance value. Data were obtained to cover other areas of this research, but only results related to the comparison of social vulnerabilities of residents are discussed here.
- 2.
Questionnaire conceptualisation
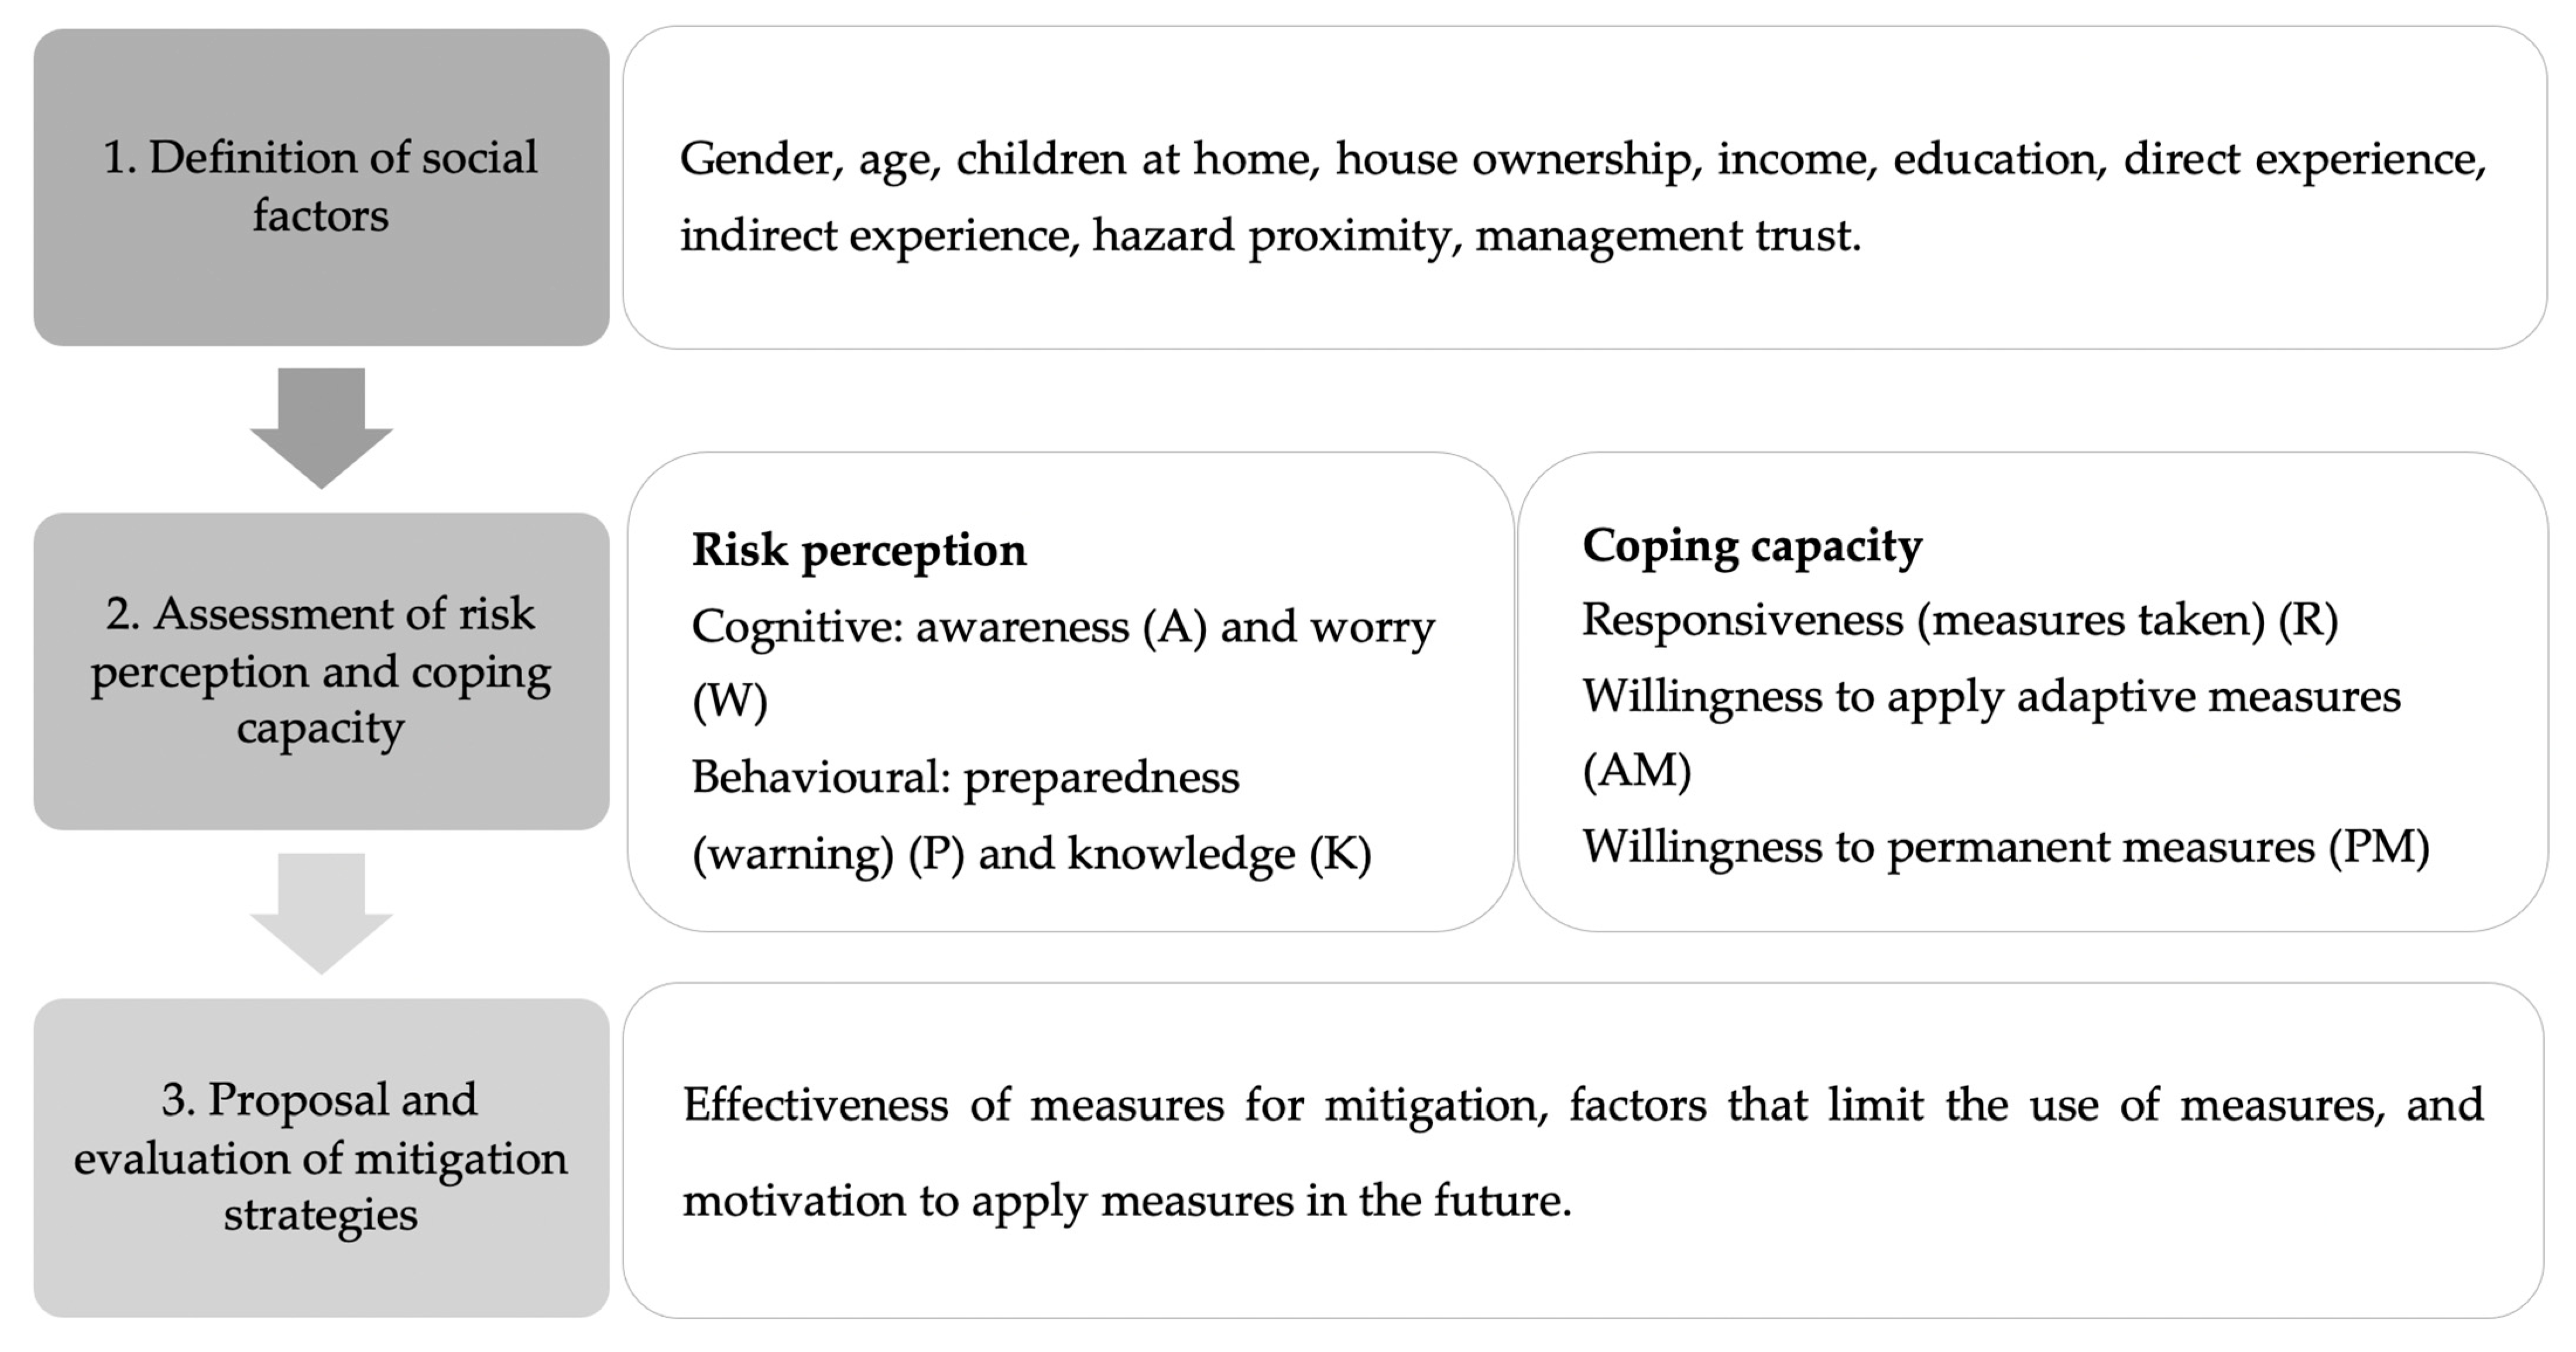
The questionnaires were given to all stakeholders and intended to cover three main areas (
Figure 3) from the definition of social factors to the proposal and evaluation of mitigation strategies. Residents participated according to their geographic location. Since water shortage occurs in the whole city and flooding occurs localised in the municipality (
Figure 1 and
Figure 2), we applied the questionnaire to residents mainly in danger of flooding, with the premise that those areas will also be affected by water shortage. From the 172 respondents, 95% experienced flooding before, and 96% experienced water shortage before. The questionnaire had two sections, i.e., flooding and water shortage, each with 30 questions that aimed to reflect the indicators spread in each area of analysis (
Figure 3). During the participatory approach, the city was not facing rationing periods. However, due to the intermittent supply issues, many residents face a water supply reduction on “normal days” (see more details in the socio-spatial context in
Section 3). The participatory approach and survey application had the support of undergraduate and postgraduate students at the Universidade Federal de Campina Grande (UFCG) and the Civil Defence.
- 3.
The analysis of risk perception and coping capacity (RQ1), and preferences of mitigation measures (RQ2)
The risk perception (RP) and coping capacity (CC) were analysed with socio-psychological indicators. The indicators aimed to express how people perceive the risk before the occurrence (i.e., RP) and how they cope (i.e., CC) with adaptive and permanent measures in their household. Coping and adaptive capacity were analysed at the household level (i.e., measures that citizens can apply them in their home), and the mitigation capacity at the city scale (i.e., measures applied in the urban area). The third area of analysis (
Figure 3) evaluated how likely the residents would agree with some measures to reduce the impacts of flooding and water shortage. Here, we aimed to understand how the residents see the effectiveness of mitigation measures.
Respondents could answer the questions with a 1–5 Likert scale, expressing how likely they agreed with the options (i.e., 5 as expressing strong agreement and 1 as least agreement). The answers were plotted in a RP and CC wheel that accounts for answers for both hazards and facilitate comparisons in the next section of this paper. The influence of each social factor (
Figure 3) was analysed on the RP and CC indicators according to Wilcoxon Z and Mann–Whitney U tests, in which
p-values lower than 0.05 are considered as significant [
36].
5. Results
This section is divided into three main phases. First, the results obtained with the social factors are presented. Secondly, the analysis of risk perception and coping capacity and, thirdly, the perceived effectiveness of mitigation measures are presented and discussed.
5.1. The Social Factors
Social factors were divided in four groups: (i) socio-economical, (ii) informational, (iii) geographical, and (iv) contextual and cultural. The choice of social groups was based on studies of [
36,
37,
38,
39,
40,
41,
42]; full details are presented in
Table 1.
5.1.1. Socio-Economical Factors
The majority of respondents were female (65%). From the total, 38% of the respondents were over 55 years old, and 80% of the residents received fewer than 2 wages per month. In addition, 12.2% were illiterate, 48.3% completed only the first grade in school, and only 8.2% had a university degree.
Most respondents (75.3%) own property. Other questions were also asked that were intended to survey details about living conditions; it was found that 94% were houses and 69.8% of the residents lived in the same place for more than ten years. About the number of people in households, 48.2% had more than four people living in the property with at least one child in 47% of the properties. These questions were essential to further evaluate the previous experiences with the hazards and the choice of application of coping and adaptive measures at the household level.
5.1.2. Information and Geographical Factors
From the 172 residents, 94.8% confirmed having faced flooding before (i.e., indirect experience) and 75.46% affirmed the flooding reached inside their properties (i.e., direct experience). They were also asked whether they had any damage and whether they had to be removed from their households in any of the experiences, in which respectively 43.6% and 63% answered positively for these questions. Even though the selection of areas was mainly flooding based, 95.9% of the residents confirmed to also have issues with water shortage (i.e., direct experience).
5.1.3. Contextual Factors
Another question was aimed to evaluate how the residents trusted in the management bodies to manage each hazard; the residents could answer with the 1 to 5 Likert scale. Responses showed that 51.2% and 37.8% have “very low” (score 1 of the Likert scale) trust in public authorities to manage flooding and water shortage, respectively. From this, it is possible to see that residents trust more in the management of water shortage than flooding.
5.2. Risk Perception and Coping Capacity
The risk perception analysis was based on four indicators that cover the cognitive and behavioural factors of residents (
Figure 3). Each indicator was analysed with specific questions that are detailed in
Table A1 (
Appendix A).
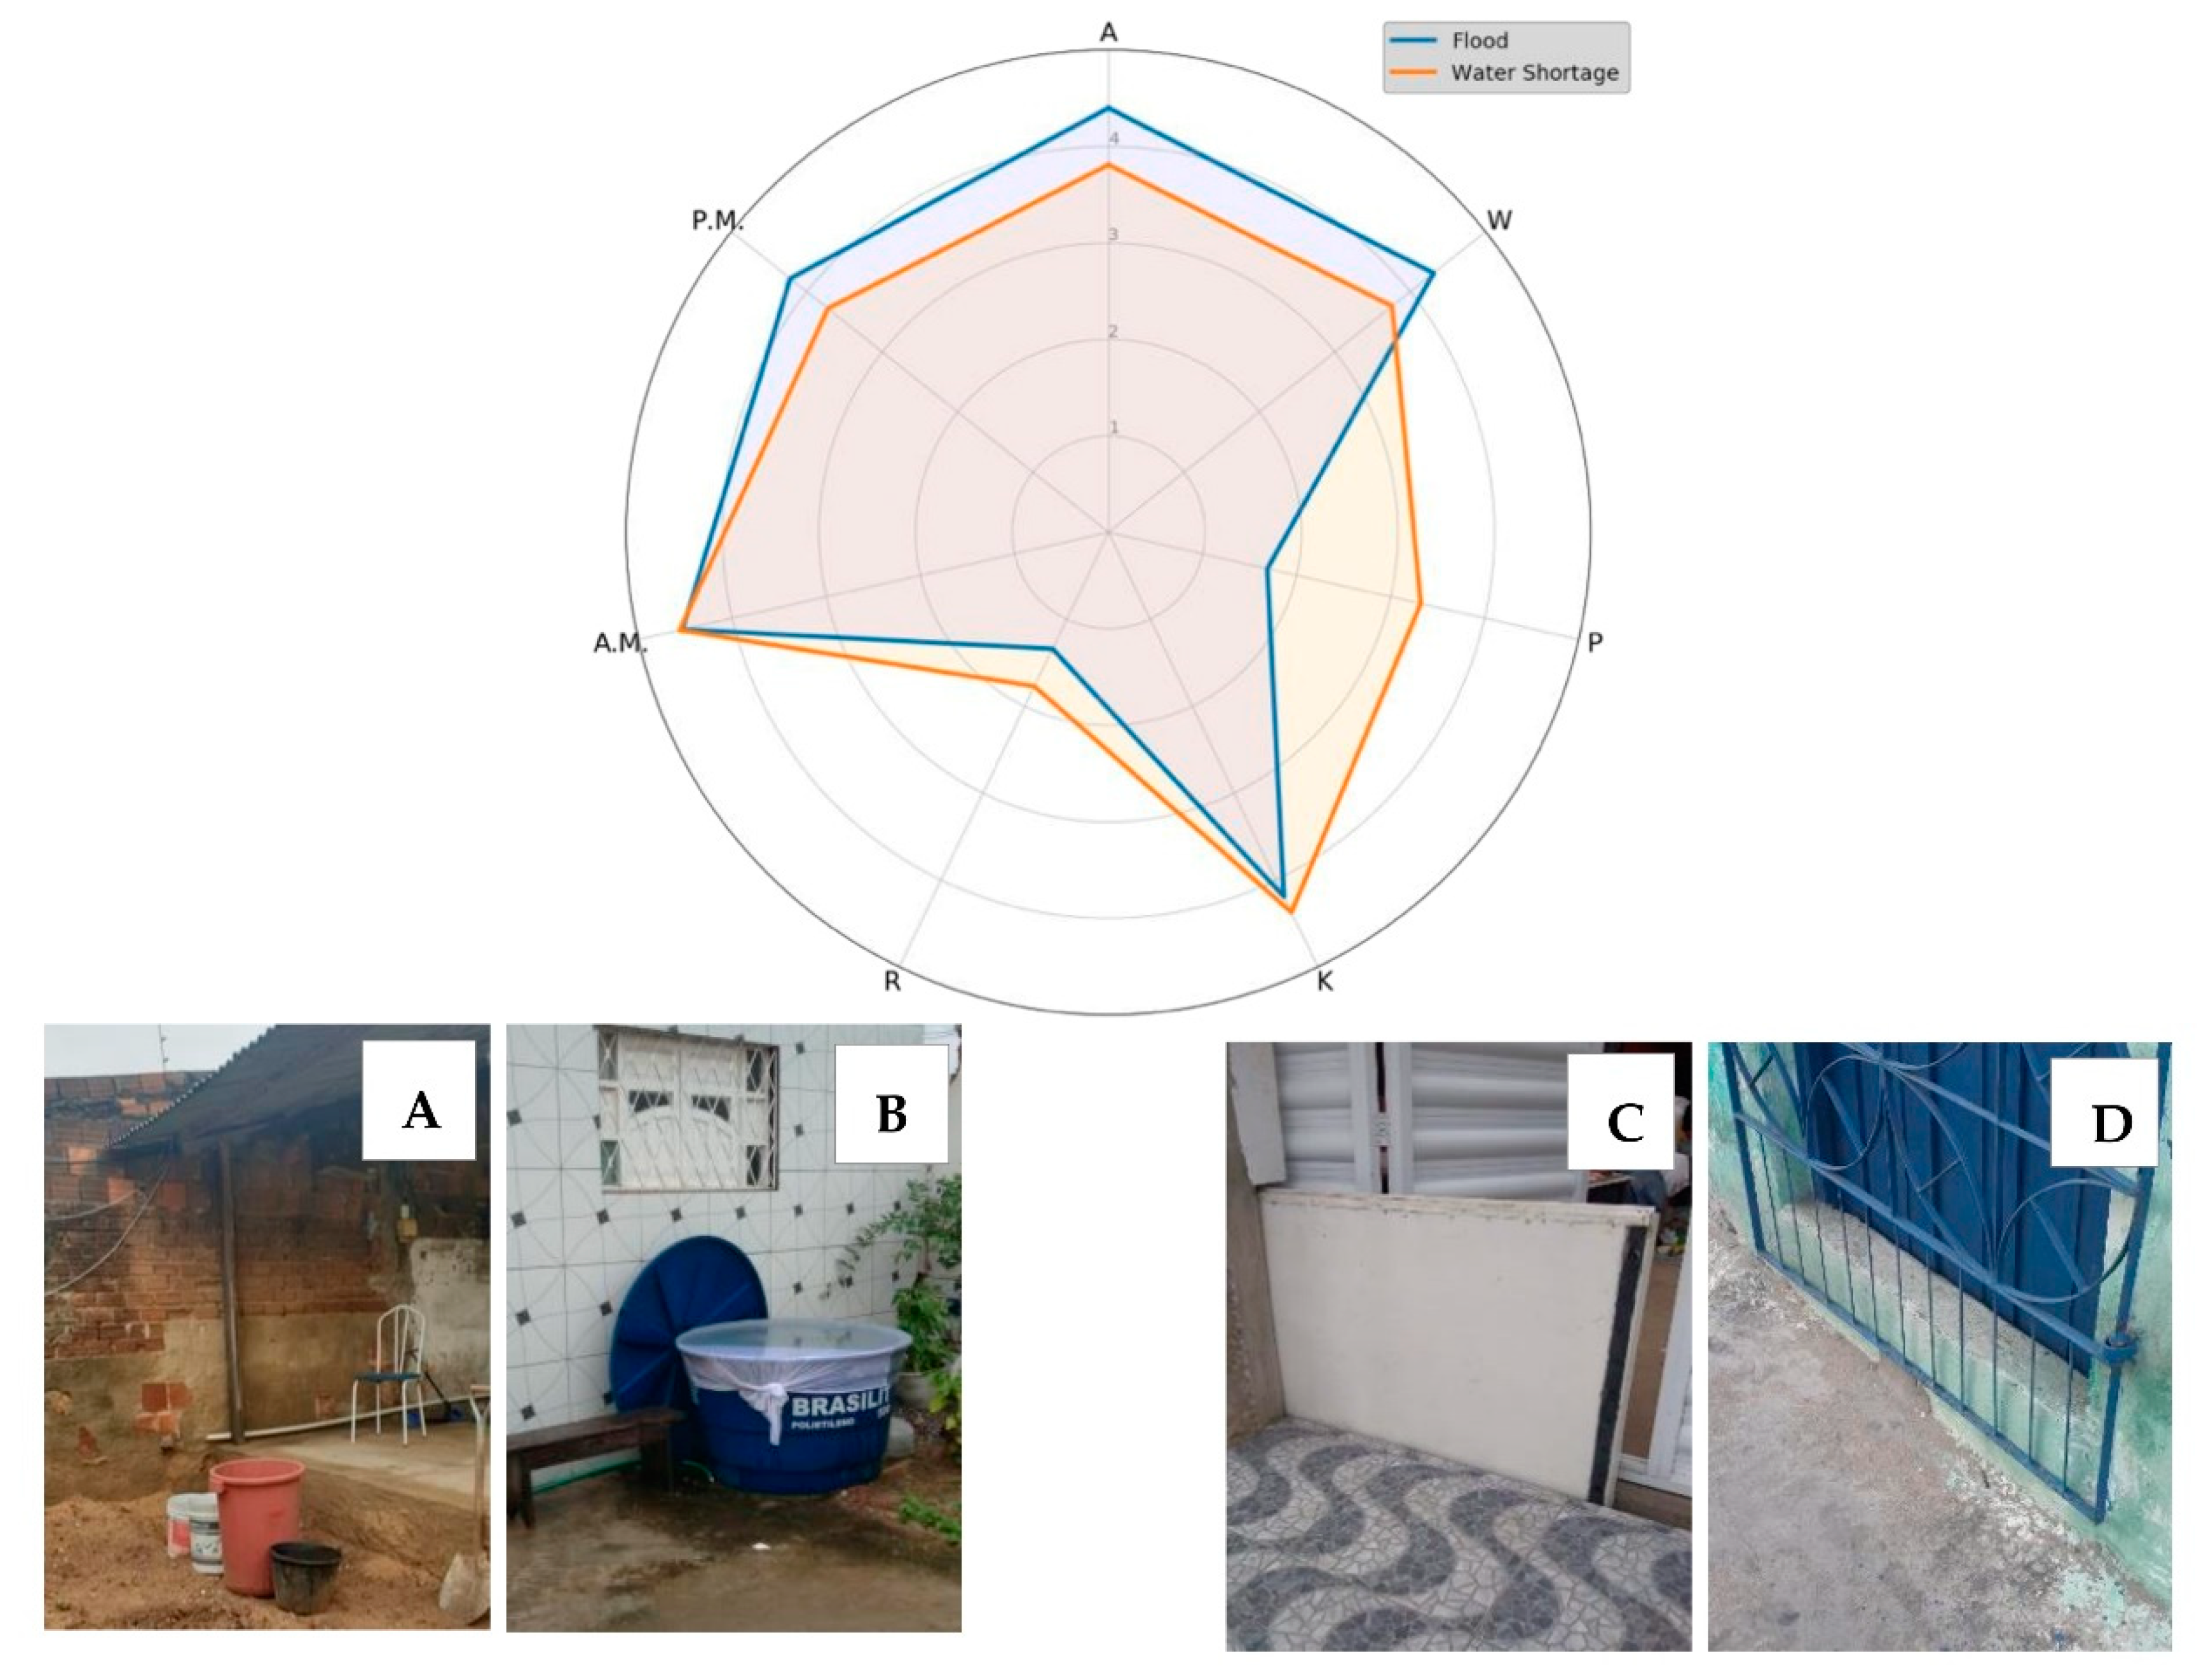
Figure 4 shows the mean answers of each indicator to the water-related hazards. Overall, two indicators, i.e., awareness and worry, had high mean values in both hazards (
Figure 4), with slightly higher values for the flooding. This indicates that residents consider the flood and WS events as very severe and are very worried (from 4 to 5 on the Likert scale) about other similar events in the next 10 years.
In both hazards, the lower answers can be seen in the preparedness indicator (P). Preparedness generally refers to activities that improve the readiness to respond to a disaster, and we focus here on community preparedness and early warning systems. This is a broad concept, and many activities can fall under its umbrella, but it is distinct from hazard mitigation, which typically involves specific investments undertaken to lower damages from an event. For this question, we asked the respondents how likely they are to receive warnings before the extreme event. The mean answer for flooding was 1.7 (standard deviation (SD) = 1.24; variation (CV) = 73.26) and 3.32 for water shortage (SD = 1.60; CV = 48.09). Answers show that residents receive more warnings for water shortage than for flooding, which was expected due to the different temporal scales of the hazards.
Risk communication and warnings are considered as critical social problems in risk management [
37]. Communication has uncountable benefits since it can better prepare the residents before, during, and after the hazard. According to Kelman [
23], in the case of a disaster, it is extremely important to provide enough information for residents to enable them to prepare and protect themselves before the disaster occurrence. Another study from Nguimalet [
42] emphasised the need for preparedness; this is not only restricted to “warnings” but also decentralised decision-making and effective engagement, especially in developing countries. To better understand the societal challenges, we asked how the residents are usually informed about extreme weather events; 49.6% and 16.8% affirmed that they use television and social media, respectively. Since the PLANEJEEE project had mixed age respondents (
Table 1), these options can indicate ways to inform people about the hazards’ occurrence effectively.
The answers of knowledge indicator show that people think that they can apply measures for protecting and reducing hazards impacts at home, with a slightly higher answer to water shortage (i.e., M 4.37WS; M 4.19F). This does not necessarily mean that they will apply measures, but it does show that residents know it is possible to protect themselves from the hazards.
Three questions analysed the coping capacity for the household level. First, residents were asked whether they have coping measures in place to avoid the extreme event (responsiveness indicator). The main answers showed 1.34 for flooding (SD 1.21 and CV 91.94) and 1.77 for water shortage (SD 1.11 and CV 62.62). This indicates that although people agree that they can apply measures at their homes (i.e., knowledge indicator), consider the hazard very severe (i.e., awareness indicator), and are very worried about other events in the future (i.e., worry indicator), they do not have many protection measures at the household level. In addition, we asked them what the main factors that can limit the use of measures by the population were. Money was considered as the main constraint, where 57% scored 1 (1 to 5 Likert scale). About the motivation to apply the measures in the future, the majority answered that they would be keen to use more measures with a tax relief (49.4% answered 4 and 43% answered 5 scales). Other motivations such as “if I knew it was really going to be effective” and “if a strong flooding or water shortage happened” also had high means (M = 4.33 and M = 4.30, respectively).
During the survey application in the PLANEJEEE project, some mitigation measures were seen in the households. Examples are water butts and tanks (
Figure 4A,B) for water shortage and barriers for flooding (
Figure 4C,D). Other questions asked about their willingness to apply adaptive measures (AM) or permanent measures (PM) in the future, and residents answered that they would be keen to do it in both hazards.
The second phase of risk perception and coping capacity was the analysis of the influence of each social factor, according to Wilcoxon Z and Mann–Whitney U tests. In risk perception, for flooding, the residents with direct (
p = 0.000
F) and indirect experience (
p = 0.000
F), house ownership (
p = 0.028
F), and hazard proximity (
p = 0.037) presented more differences in the awareness indicator. For WS, the influence was given by direct experience (
p = 0.000
WS), income (
p = 0.041
WS) and age (
p = 0.048
WS). Full details can be seen in
Table A2 in
Appendix B. Although this analysis shows that independent socio-economical, informational, geographical, and contextual groups have an influence on RP indicators, which express the importance of considering different social information, the analysis also indicates that a different type of social constraint influenced each cognitive and behaviour indicator. It mainly suggests the importance of analysing the influence of diverse social indicators to RP and CC.
Similar behaviour is seen in coping capacity. For responsiveness, house ownership (p = 0.003F), age (p = 0.009F), and direct experience (p = 0.000F) were representative for flooding. However, no social group was influenced by the answers for WS responsiveness. For applying adaptive measures in the household, only management trust was representative (p = 0.010F). Education (p = 0.022F) was seen to influence permanent measures for flooding and age (p = 0.05WS) for WS. In summary, the influence analysis shows that social groups are interrelated with RP and CC in different ways to each extreme event, which highlights the need to build more multi-disciplinary analyses to provide more understanding in how/what/why social factors influence the perception and adaptability.
5.3. Preferred of Strategies to Mitigate the Hazards
Residents were asked how they see the efficiency of structural and non-structural measures for reducing flooding and water shortage, including infiltration and retention, as well as grey and green strategies (
Table 2). For flooding, the lowest efficiencies were found related to the green measures (items C–F), mainly to the use of green roofs (M = 2.99). In addition, the highest variances were also seen in these options (CV > 25%), which indicates that residents have less agreement in these options. The highest efficiencies are mainly related to management actions, such as the maintenance of existing measures (item B) and improvement of awareness and preparedness of residents (items H and I). This is an indication that residents prefer proven technologies [
43]. The analysis shows that green and infiltration measures are less supported as ways to reduce flooding in comparison with structural measures (item A). For water shortage, both management and structural measures (items J–O) are seen as effective with very low variance in answers (CV lower than 20%). The residents appreciate the high efficiency of rainwater harvesting to mitigate the effects of water shortage (M = 4.31), but they do not consider it as effective for flooding (M = 3.75).
These results can be an indication of the need for preparing the personnel and residents for the advantages of strategies such as green infrastructure (GI) and nature-based solutions (NbS) [
44]. In 2020, the IUCN defined NbS as “actions to protect, sustainably manage and restore natural or modified ecosystems, which address societal challenges (e.g., climate change, food and water security or natural disasters) effectively and adaptively, while simultaneously providing human well-being and biodiversity benefits”. We argue that another critical point for implementing NbS in disaster planning is social participation. Exchange of information will be possible when individuals who experience risky situations report their experiences and solutions; on the other hand, policymakers can provide knowledge to citizens. The proposal of solutions must take social justice into account [
45,
46] and provide co-benefits [
47].
6. Discussion
In general, the results show that residents had severe experiences with flooding and water shortage in the past. However, even though residents present high awareness and worry to both hazards (
Figure 4), the number of coping measures in place (i.e., responsiveness) is low. Mondino, et al. [
48], highlighted that previous experience influences risk awareness not only directly but also indirectly through the knowledge that was gained from that experience. Residents seem to have high knowledge on protecting themselves from hazards in the future, but they rarely effectively apply any measure, which makes us conclude that having previous experience (direct or indirect) is not enough for people to protect themselves from hazards.
The WS and flooding socio-spatial complex (
Figure 2) pose even more complexity to the analysis since, depending on the nature of hazards, a person can contribute to reducing disasters’ effects without having experienced them before. For example, flooding can be minimised with the implementation of adaptive measures in households located upstream, which means that people without experience may be asked to apply adaptive or mitigation measures in their houses to reduce flooding downstream.
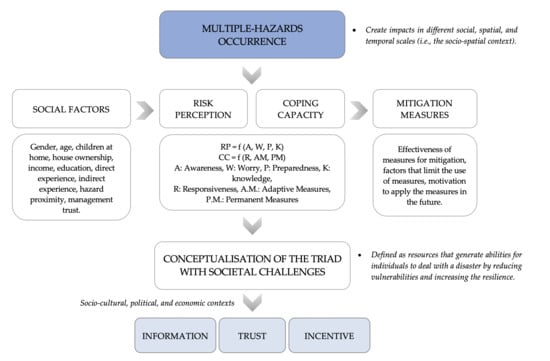
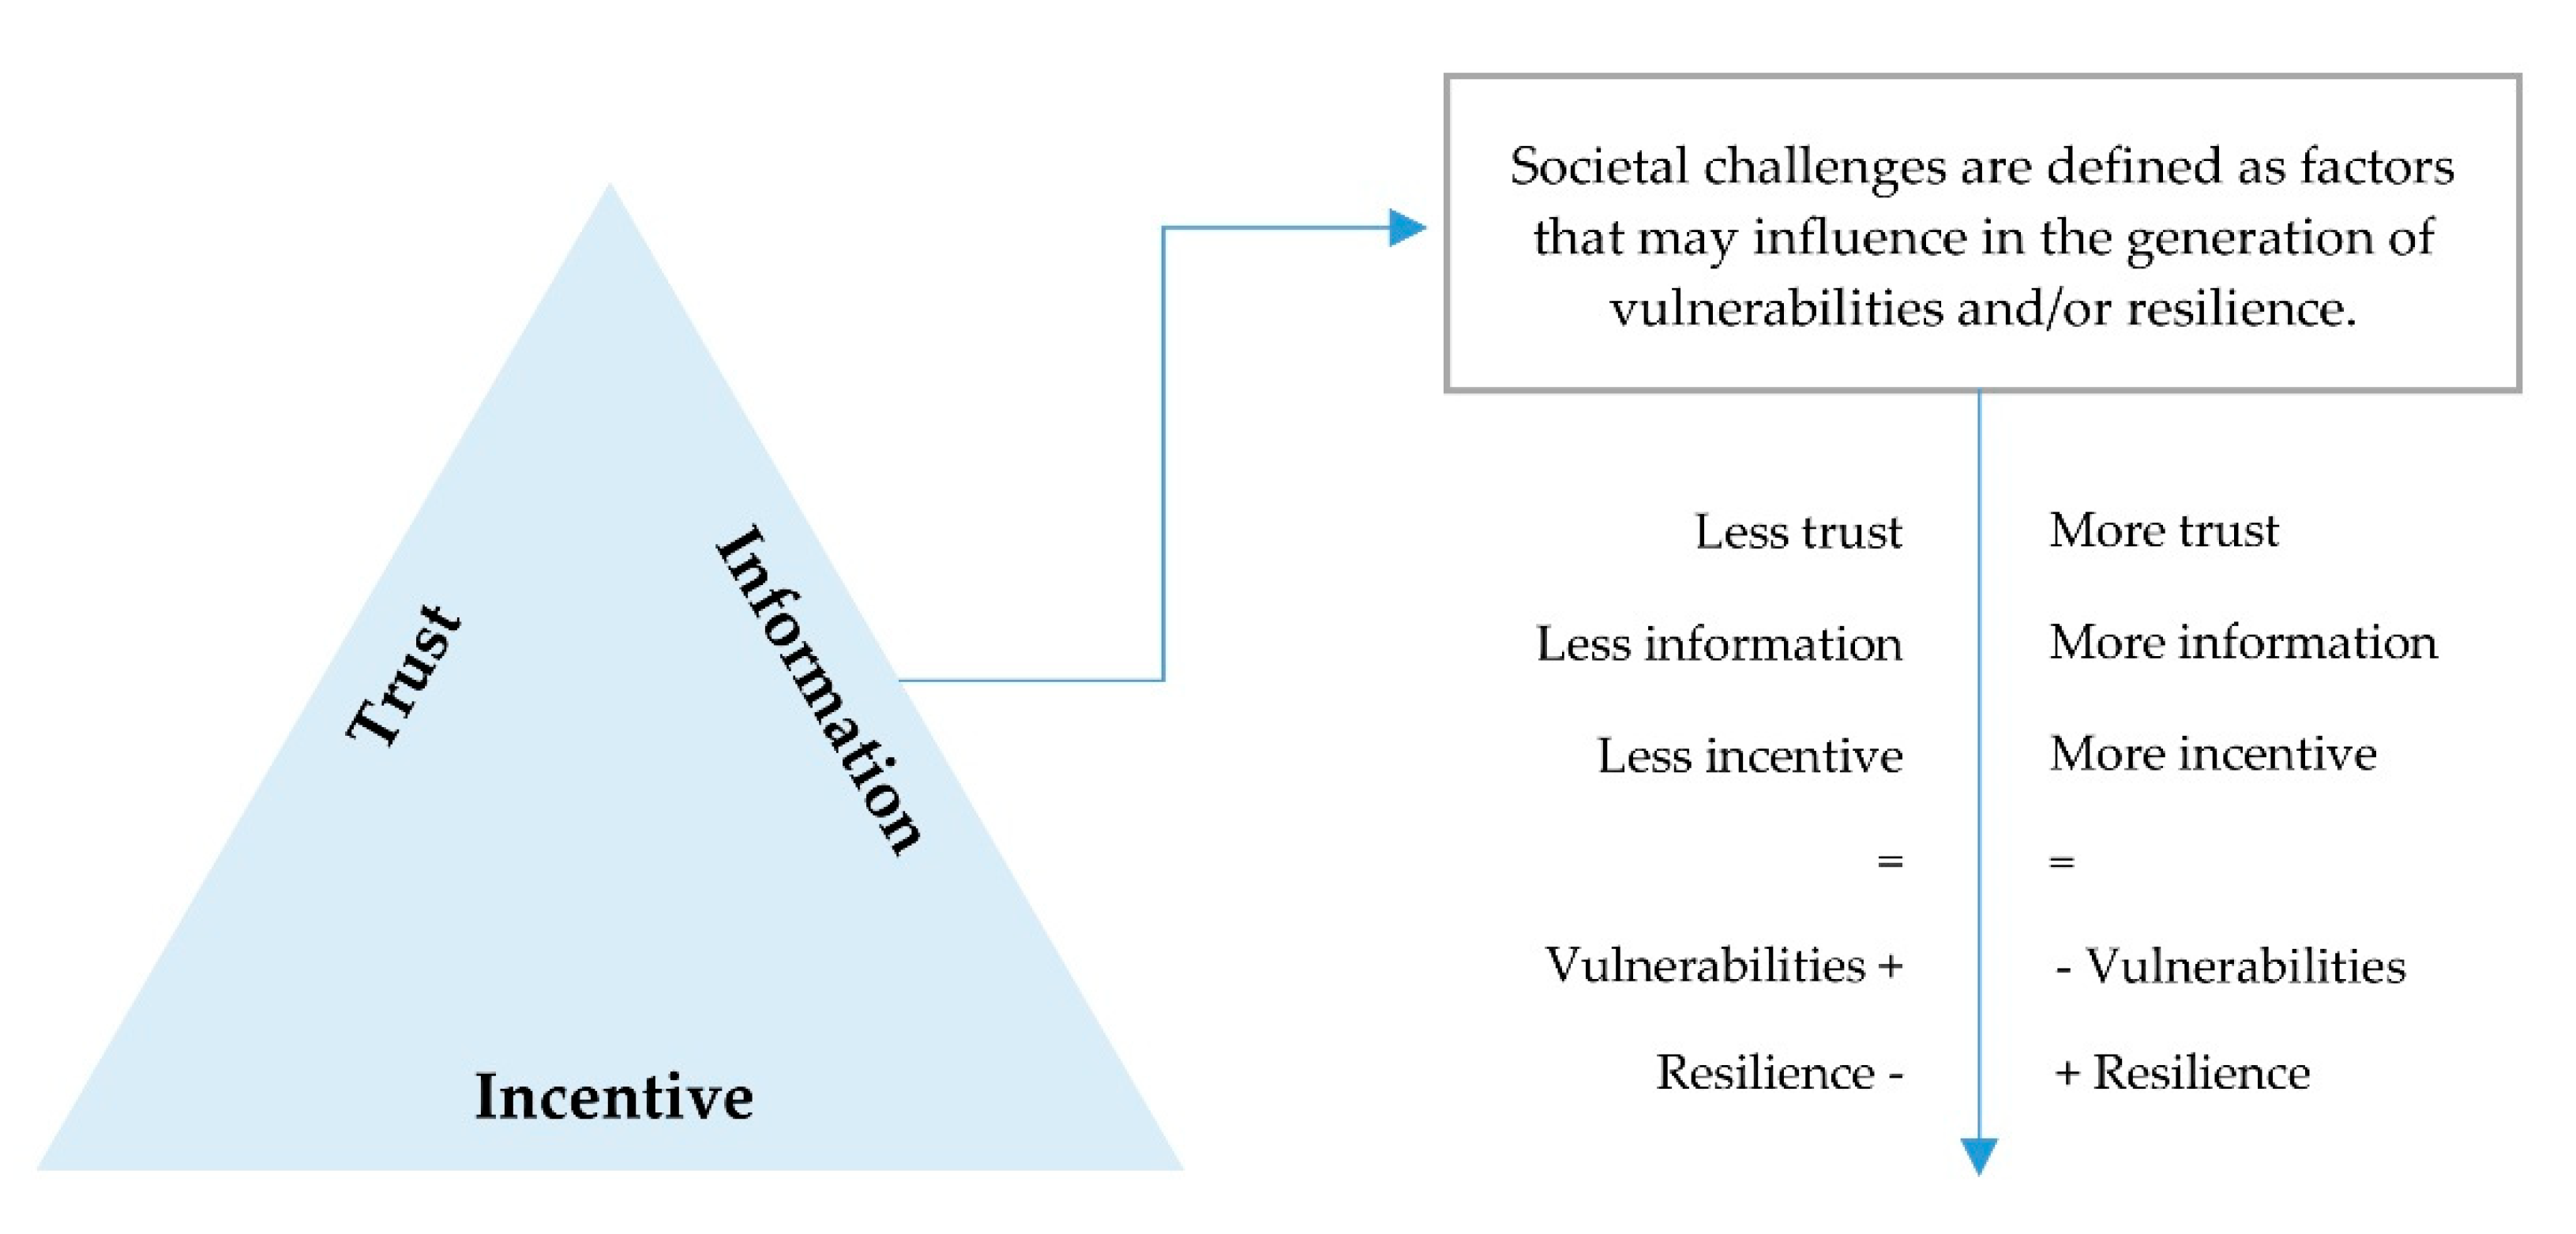
In light of this discussion, we suggest that three main societal challenges, namely information, incentive, and trust, should be integrated to increase the uptake of measures for hazards mitigation (
Figure 5). Here, we use the definition of societal challenges as resources that generate abilities for individuals to deal with disasters [
15]. Therefore, those with greater resources are less vulnerable and more resilient (
Figure 5). As said before, findings were produced in line with the integrated planning of water shortage and flooding but can also be applied to hazards of other nature.
6.1. The Role of Information
Although the knowledge obtained from the previous experience is essential [
48], people need more information throughout the hazard. For this, some questions must be answered to provide information before (e.g., how can I know the hazard will occur?), during (e.g., how should I proceed?) and after the disaster (e.g., how can I prepare for the next event?). Due to the mixed spatial and temporal dynamics, specific challenges of the study case will be discussed, with an aim to enhance the disaster risk reduction.
The first issue is the access to climate-related information. Effective communication and appropriate choices based on information can create a difference in hazard impacts [
23]. In the Campina Grande case, the availability of information in the pre-disaster phase is low in both WS (M = 3.2) and flooding (M = 1.8). Since 2014, the National Water Agency (ANA) of Brazil provides a Drought Monitor (
Monitor das Secas in Portuguese) for critical regions in the territory. The monitor is a reference for the development and adoption of public policies to reduce drought in the country [
49]. Similarly, the National Centre of Alert and Monitoring of Natural Disasters (CEMADEN) provides mappings of drought and flooding in the Brazilian cities [
50]. However, this information is more restricted to the academics and authorities, which means that more efforts should be made to deliver this information to residents. In addition, authorities must find appropriate ways to improve the accessibility and usefulness of information provided to facilitate their adaptation [
51].
Another specific challenge is that, even though people are aware of flooding, approximately 65% of the respondents still live in risk-prone areas. When asked about the reasons for that, they mainly selected “I don’t have money to move”, “I don’t have anywhere else to go”, and “I got used to the situation”. This context shows that there is a need not only to provide more information but also to consider other factors, such as the availability of other land, economic power, and personal desire to reduce the vulnerabilities. A study by Danso and Addo [
52] investigated the reasons that residents continued to live in unsafe flood areas in Ghana. Although they were knowledgeable of the risk they faced, the main reasons cited were land affordability, easy land accessibility, and the quest to preserve ancestral lands. This is evidence that different social and cultural contexts can interfere with the ability to make choices, even when the level of information is high. In Campina Grande, temporary relocation was made to reduce risk of disasters in the past. While temporary or permanent relocation is a viable strategy, it is important to ask whether they will be moving to a place with sufficient access to water and other amenities [
42].
Moreover, an information and educational movement can foster the outdated idea that floods in arid and semiarid regions are very unlikely [
53]. Since the flooding does not occur regularly, there is an underestimation of flood risks, as floods are a local disaster in some cities and therefore only affect specific social classes. The event takes place in a short time, and people can believe that the damage is not that great. Those that are affected have become familiar with the event and simply try to live with the impacts generated. Concerning WS, some studies have observed a naturalisation of water under-consumption by residents who have extensive experiences of living with water scarcity (i.e., these people think it is “normal” to have a lack of water) [
54]. In contrast, this behavioural change lasts only during periods of severe drought or until the following year [
55], meaning that information about WS may decline over the years after a severe drought, and people will only feel its impacts on the next drought disaster when the information will have little influence in the time.
The last societal challenge is the need to enhance the understanding of the effectiveness of green interventions. Although mitigation solutions can be suggested in different scales to the city, the process of adaptation involves more than only proposing new technologies [
51]. Ward et al. [
20] suggested that a critical problem is a lack of understanding of how the underlying technologies and mechanisms can influence overall flood and drought risk at local and regional scales. Wright et al. [
24] suggested that for resilience, citizens’ attitudes and behaviours to flood and water infrastructure must change so that they can better understand and appreciate the multiple benefits of blue and green infrastructure. In terms of bridging the gap between science and decision-making, it is essential to construct a mutual dialogue and learning mechanism among stakeholders to facilitate the mission of adaptation to climate change by reducing disaster risks [
56].
6.2. The Role of Trust
The political and socio-cultural context is also a significant aspect in the research of risk perception and coping capacity, but it is often neglected [
7,
39]. There is a relationship between coping capacity and trust in the management, whereas there is a common belief that authorities are primarily responsible for the protection and thus obliged to release the residents from flood protection responsibility [
57]. A similar situation was characterised by Fuchs et al. [
39], in which respondents believe that authorities are the only responsible for managing floods. These conditions represent challenges that were already in place before the extreme event. For example, people have a level of trust before the extreme event (the lack of or abundance of rainfall) take place in the socio-spatial system [
1]. This means that high local confidence in climate-related information provides enough time for residents’ preparation before the disaster [
20]. On the other hand, mistrust in forecasting can delay the time for people to prepare.
In Campina Grande, trust is higher for management in WS than in flooding (
Table 1). People have a high degree of confidence in the water supply systems, as they believe that the authorities will join efforts for solutions, regardless of the investments applied (for example, the transposition of flows from distant places) that may be linked to the universal right to water. As seen in
Figure 4A,B, people have water tanks and water butts in their homes, but this does not necessarily indicate a lack of confidence in management. In fact, it is an indicator that they know about the inefficiency of the service, regardless of drought disasters. People want to protect themselves against phenomena that generate intermittences in the water service [
58], such as hydraulic oscillations and piping ruptures. In addition, we consider the spatial and temporal scales to influence the way people trust in management.
In floods, due to the low trust in the municipal management actions, coping measures are more easily seen (
Figure 4C,D), but mainly flood barriers. Residents are willing to accept greater responsibility for the risk of floods (i.e., to apply more measures), as they do not believe that the government will do so. For example, residents shared a lack of proper information and warning before the flooding, and also a lack of belief that changes will be made before the next events. This is particularly important because if residents are to be asked to take on greater responsibility concerning their local environments, then there is a need to build relationships based on two-way dialogue and mutual representation [
59]. Trust will interfere directly with the way that people believe in each other in times of crisis or agree on coordinated action from management to confront threats [
60].
6.3. The Role of Incentives
Addressing societal challenges requires strong leadership and involvement of the government in planning for adaptation and implementing measures to facilitate adaptation at the local level [
51]. Incentives are defined with two main applications: to provide means for more coping capacity and to encourage more collaboration. These issues are mainly related to the way the management, legislation, and stakeholder collaboration is performed.
The participation of stakeholders throughout environmental decision-making is an established principle [
61], and significant value is given in including stakeholders in the process from early on, all the way from problem structuring through to problem analysis and the interpretation of results. According to Cinner et al [
60], the formal and informal relationship between individuals, communities, and organisations can help people deal with change by providing social support and access to knowledge and resources. The defining characteristic of institutions is their capacity for stability and resistance to changes, including thinking, which means that encouraging people to participate in planning can generate changes in the administrative routines and professional cultures of the institutions responsible for planning. For example, while recovering from water-related hazards, not only will residents be asked to take individual actions, but agencies will also be asked to coordinate short-term recovery and long-term resilience strategies [
60].
In Campina Grande, 75.6% affirmed that they could support and collaborate with the planning of WS and flooding. To assess what residents think participation is, we asked them how they can participate in the planning. A different range of answers was collected, involving mainly “reporting the lawbreakers”, “keeping the city clean”, “sharing my opinion, ideas and experiences”, and “saving water”. In general, people feel more encouraged to support WS and flooding management. The main criticisms were given related to flooding, such as, “The city council forgot about us, and there is only monitoring when the flood is occurring”. We asked how some factors could facilitate their participation in management. The options with higher percentages were “if I received a monetary incentive”, “if I knew the authorities would listen to me”, and “if I knew my help was being used in the planning”, with the mean being at 3.89, 4.41, and 4.44, respectively.
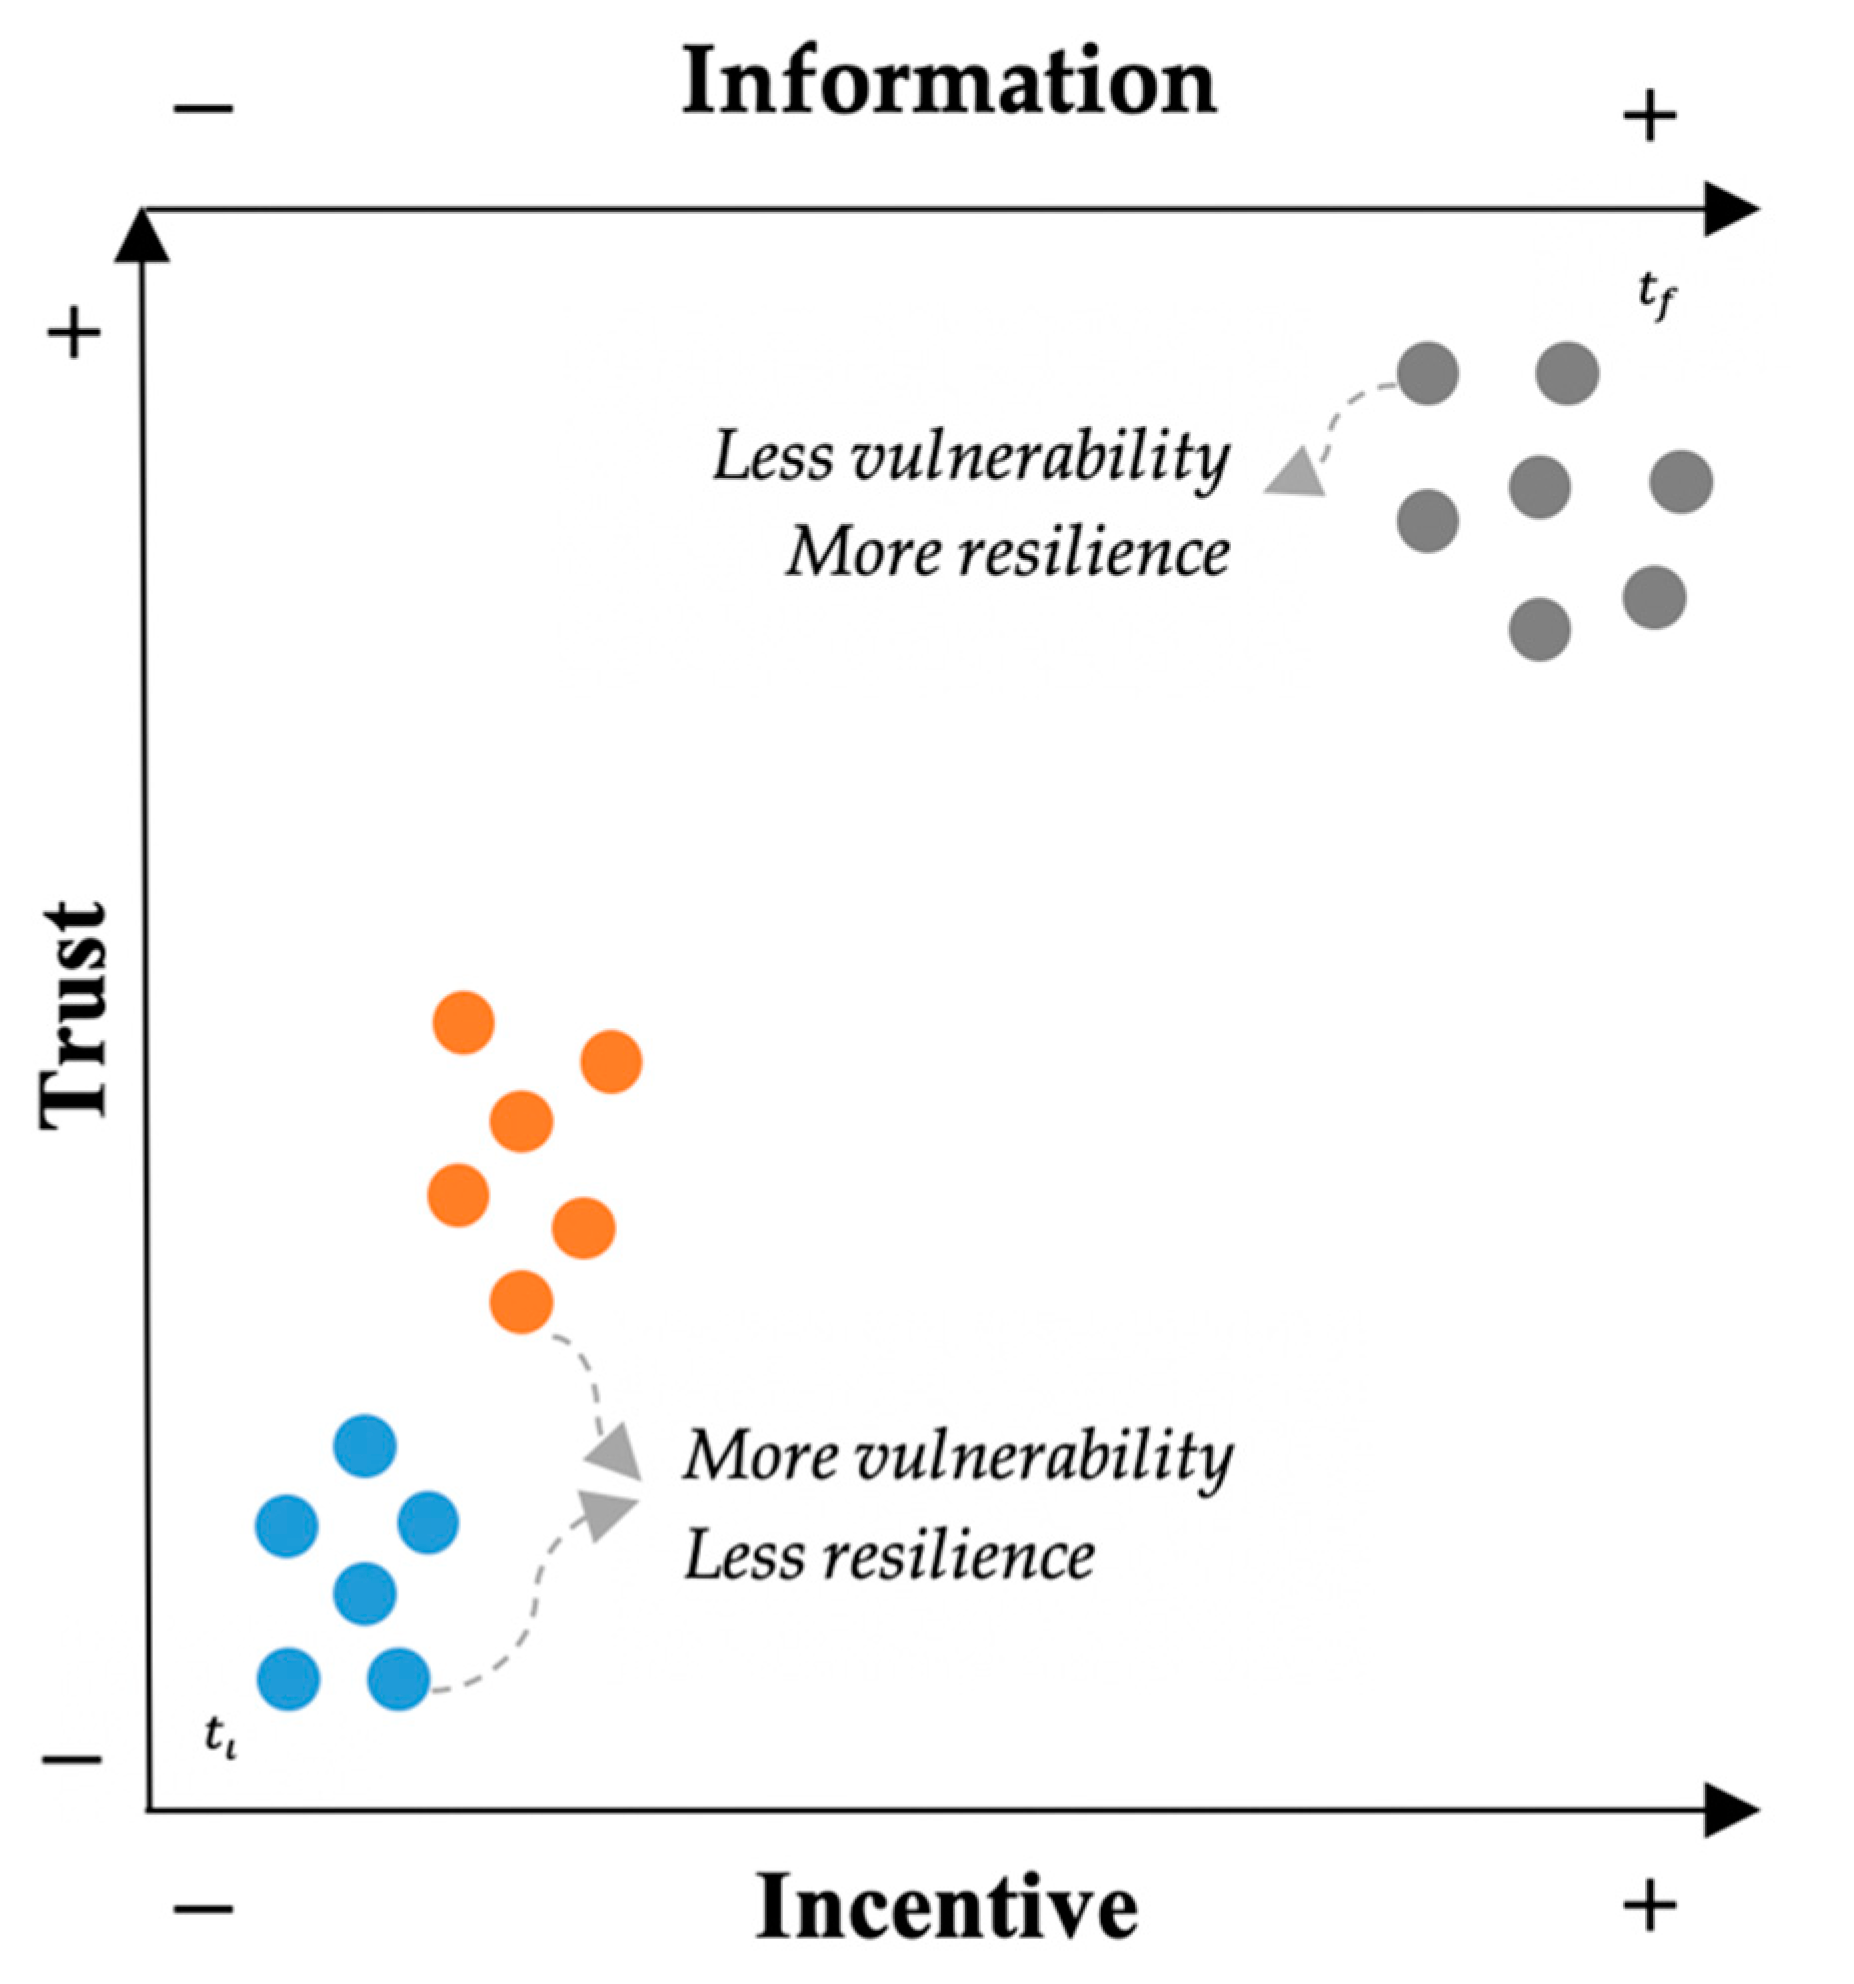
Even though the city faces both hazards, the findings obtained in this study show that residents are subjected to different levels of societal challenges in the socio-spatial system. As an attempt to illustrate the current situation of both water-related hazards, the triad of challenges is plotted in
Figure 6. Levels of information, trust, and incentive are expressed on an increasing scale, where “−” and “+” represent lower and higher levels, respectively, to the current (
) and the future (
). The analysis is fundamental since each challenge performs specific functions, as detailed previously, that together must integrate a network of important resources to mitigate water scarcity and floods. Notably, the plot emphasises that there are differences in terms of social vulnerabilities to each extreme event.
For the current time (), the residents appear to have more trust, information, and incentive to WS than to flooding, which makes the overall condition of flooding worse (indicated by the blue) than water shortage (orange). Consequently, we recommend that these specific challenges must be tackled to improve the services and reduce vulnerabilities in each water challenge. For the future (), the grey dots illustrate how the reduction of social challenges may reduce the vulnerabilities and increase resilience.
In Brazil, drought and flood disasters have severely affected the country in recent decades [
62,
63,
64]. Between 1991 and 2012, 39,000 natural disasters were recorded, 84% of which are associated with water, whether drought or flood [
65]. Between the years 2012 and 2017, the northeast region of the country that integrates the state of Paraíba passed through the worst drought period of the last 50 years [
66]. Between 2014 and 2016, major national metropolises, such as São Paulo, recorded the highest temperatures in the previous 70 years and a severe water crisis [
67]. In 2014, the Amazon region suffered one of the biggest floods in recent years [
68]. On the other hand, studies confirmed that the process of facing risks in Brazil, in general, is still capable of delays or absence of actions by authorities or individuals [
69]. The human capacity to respond to and recover from disasters in Brazil lacks structures and indicators to assess the situation for the whole country [
70]. In addition, the Brazilian society’s lack of confidence in the agencies and bodies responsible for risk management and the absence of a plan to engage the public in the decision-making process are relevant points raised. In this way, our work contributes to the field by finding key societal challenges according to the residents’ view. This is particularly important since public involvement is still limited in the Brazilian context, mainly due to the centralised access to information and low participation in decision-making consultation exercises [
69].
7. Conclusions
The understanding of the social context in which disaster occurs provides conditions to face them, especially for less developed regions. Disasters act upon vulnerability and exposure to create risk; however, this context can be worsened when more than one hazard is in place. In that context, this study builds a place-based citizen science approach to more deeply comprehend the social context in which multiple water-related hazards take place. The study case is Campina Grande, a city located in the semiarid region of Brazil that suffers from water shortage and flooding. The methodology is based on a participatory approach, the PLANEJEEE project, which had the collaboration of 172 residents and 27 authorities and specialists.
Throughout the study, a combination of subjective (i.e., surveys, workshops) and objective (i.e., Wilcoxon and Mann–Whitney tests) methods were supported. The methodology was built upon the premise that vulnerabilities are influenced by actions and behaviours, which can increase or decrease resilience. The preliminary analysis indicated that hazards have differences in spatial, temporal, and social scales, which must be taken into account for a proper investigation into the perception and coping capacity of residents. For this, we presented an innovative perspective with a socio-spatial representation (
Figure 2).
The findings show that residents have a high risk perception of flooding and water shortage. High levels of awareness and worry regarding both hazards were found (
Figure 4), which indicates that residents had severe experiences in the past and fear new experiences in the future. However, even though they affirmed to believe that coping measures can reduce the risk, low coping and adaptive capacity were found.
In this sense, linking the relationship between risk perception and the social risk formula [
71], we consider that the way people perceive risk is more related to the social vulnerability experienced by the participants. Individuals become more interested in assuming environmental attitudes that transform their own space with the understanding of their own weaknesses to certain disasters, although coping is limited due to the number of resources available. However, the individuals’ own location (i.e., territorial exposure) also characterises them as more or less vulnerable, that is, the vulnerability is specific to the site; for example, the poorest residents may occupy areas close to drainage channels, or their low standard housing limits the construction of water reservoirs. An approach to the social amplification of risk [
69] assumes that the dangers and their material characteristics are real enough, but they interact with a series of psychological, social, and cultural processes. The interests of economic groups transform risk statements. This results in the intensification or attenuation of your perception. The low coping capacity of the present time shows that residents face strong economic and cultural barriers. However, for the future, economic and social incentives can provide motivations to increase adaptive capacity. In addition, other issues such as the inadequate early warning system, low communication, and low understanding of mitigation measures emerged in the analysis.
Finally, we conceptualised a triad of societal challenges that should be integrated to increase the coping capacity and to mitigate multiple hazards in the future. Looking at the triad of societal challenges that formed, findings suggest that previous experience alone (i.e., direct and indirect) is not enough to increase coping capacity. The social challenges are expressed in three areas, i.e., information, trust, and incentives, that form a network of resources to reduce social vulnerability and increase resilience. It is essential to mention that measures to improve preparedness, risk perception, awareness, information, and trust can be beneficial for both extremes, but these do not always result in vulnerability-reducing actions [
20]. Future studies must analyse deeply how each class of social factors influence the ability to cope and perceive risk for multiple hazards. Multidisciplinary analyses are suggested to account for the interdependencies between hazards [
21].
Since extreme weather events are very likely to become more common in the future [
37], we believe these findings can assist scientists and policy makers to establish societal challenges to improve risk perception and coping capacity through the analysis of different social, spatial, and temporal scales of multiple hazards, thereby increasing resilience.

 ,
, 


