1. Introduction
The United States (U.S.) has more than 19,000 airports (5104 public, 14,263 private, and 288 military airports), ranging from large hubs to non-hubs and reliever airports [
1]. Airfields within these airports consist of pavements such as runways, taxiways, aprons, parking areas for aircraft and vehicles, and air- and land-side roads that support the smooth, safe movement of aircraft and service/operation vehicles. Some of these structures are paved, typically with asphalt or concrete surfaces, and others are unpaved. The Federal Aviation Administration (FAA) has taken measures to improve safety, enhance efficiency, reduce costs, increase resilience, and improve the sustainability of the infrastructure of U.S. airfields by using a life-cycle cost analysis (LCCA) methodology to quantify and compare costs to improve the efficient use of the economic resources needed for expanding and preserving the airfield system. However, a life-cycle assessment (LCA) approach for evaluating the environmental impact of decisions regarding airfield infrastructure has yet to be fully developed and applied. The first step, development of a framework for LCA of airfield airside infrastructure, has been completed [
2].
A key to understanding environmental impacts of existing systems and the future impacts of decisions is quantification of those impacts considering the full life cycle and complete system boundaries. LCA is a methodology used to identify and quantify the life cycle environmental impacts of a product, process, or system. It involves:
Setting the goals and scope for an assessment
Inventorying the flows of materials, energy, and other resources into the system, and the waste and pollution out of the system
Using the flows to calculate impact indicators,
Interpreting the impact indicator values, and
Reporting the results to support decision-making.
When applied correctly to civil infrastructure systems, LCA can be used for comparing alternative decisions, benchmarking operations, tracking of progress towards goals and comparison with peers, and for analysis of the potential improvements from proposed changes in policy, practice, or new technologies. When done properly with a full system and complete life cycle analysis, LCA can also identify potential negative unintended consequences of changes in policy, practice, and implementation of new technologies. LCAs should be used in conjunction with other decision-making criteria and information to provide comprehensive decision support regarding designs, asset management, and operation strategies.
There are studies that have highlighted the importance of a life cycle approach for environmental assessment of airport infrastructures [
3,
4,
5,
6]. However to date, the literature contains few LCA studies for airfield pavement and other airfield infrastructure than for other types of transportation infrastructure. Most of the existing literature examining airfields with a life cycle perspective has focused mainly on transportation modes comparison [
4,
5,
6,
7,
8], LCCA [
9,
10,
11], environmental assessments [
12,
13,
14], and exclusively on greenhouse gas (GHG) emissions [
5,
15,
16,
17]. There are a few tools [
18,
19] used by the US airports (in-house) to estimate GHG emissions for different life cycle stages, and with different systems boundaries and functional units for a variety of purposes. Detailed and well-scoped airfield pavement LCA studies were unavailable in the literature.
The lack of airfield LCAs is surprising considering that airfield pavements and road pavements are generally similar, and road pavements have a much larger literature. Commercial airfields have much heavier wheel loads than heavy-duty highways, but in orders of magnitude fewer load repetitions. Some of the major differences include: use of thicker layers for pavements at commercial airports to support the heavier wheel loads and a need to reduce maintenance in order to limit shutdowns; and typically a more constrained set of pavement materials used for airfields because of higher safety risks from pavement failure. Concrete airfield pavements tend to have thicker concrete layers than do roads to limit cracking for the heavy loads. Asphalt airfield pavements on the other hand tend to have thinner asphalt layers but thicker aggregate base layers to protect the subgrade soil from rutting compared to asphalt highway pavements. Therefore, airfield pavements have quite different relative proportions of the materials used in the different layers compared to roads, which results in different kinds of conclusions. Additionally, the greater conservatism of airfield pavement designers includes a more conservative approach to the use of recycled materials compared with road pavements.
1.1. Objectives of the Airfield LCA Case Study
The objective of this study is to demonstrate the use of the LCA framework that was recently developed for the FAA which is intended for use by U.S. airports to perform airfield LCAs [
2]. The airfield LCA framework was built upon the previously completed LCA development work for roads and highways (Federal Highway Administration pavement LCA framework [
20]) focusing on the unique scope of airfields; set up the analysis capability for the FAA within the framework; review gaps in data and tools for the FAA to perform LCA for airfields; and demonstrate the use of the developed framework in several U.S. airport case studies. The framework can be used to evaluate alternatives intended to improve life cycle environmental sustainability for runways, overruns, taxiways, aprons, parking areas, other pavement structures, landscaping, drainage, fencing, and other airside non-building features.
In order to demonstrate the use of the airfield LCA framework, several airports were contacted by the University of California Pavement Research Center (UCPRC) and Atkins Consultants across the U.S. and several possible case studies were discussed based on completed or current projects at the airports. All the airports contacted showed interest in being able to quantify the environmental impacts of different structural and material design alternatives, and overall project evaluations for decision support. The comparison of alternative pavement designs by Nashville International Airport (BNA) with help from Atkins is presented as a case study in this paper.
The International Organization for Standardization (ISO) set up a series of standards for conducting LCA [
21,
22]. This paper is formatted based on the guidelines provided in ISO 14040 [
21] which states that the LCA should include four phases: goal and scope definition, inventory analysis, impact assessment, and interpretation.
1.2. Goal and Scope Definition
The goal and scope of this case study is to perform LCA of asphalt and concrete pavement design alternatives and determine within each pavement type the most environmentally-friendly option. Pavement types were not compared because the expected maintenance cycles were not provided: it was assumed that the surface maintenance would be the same for all asphalt surfaced alternatives, and the same for all concrete surfaced alternatives.
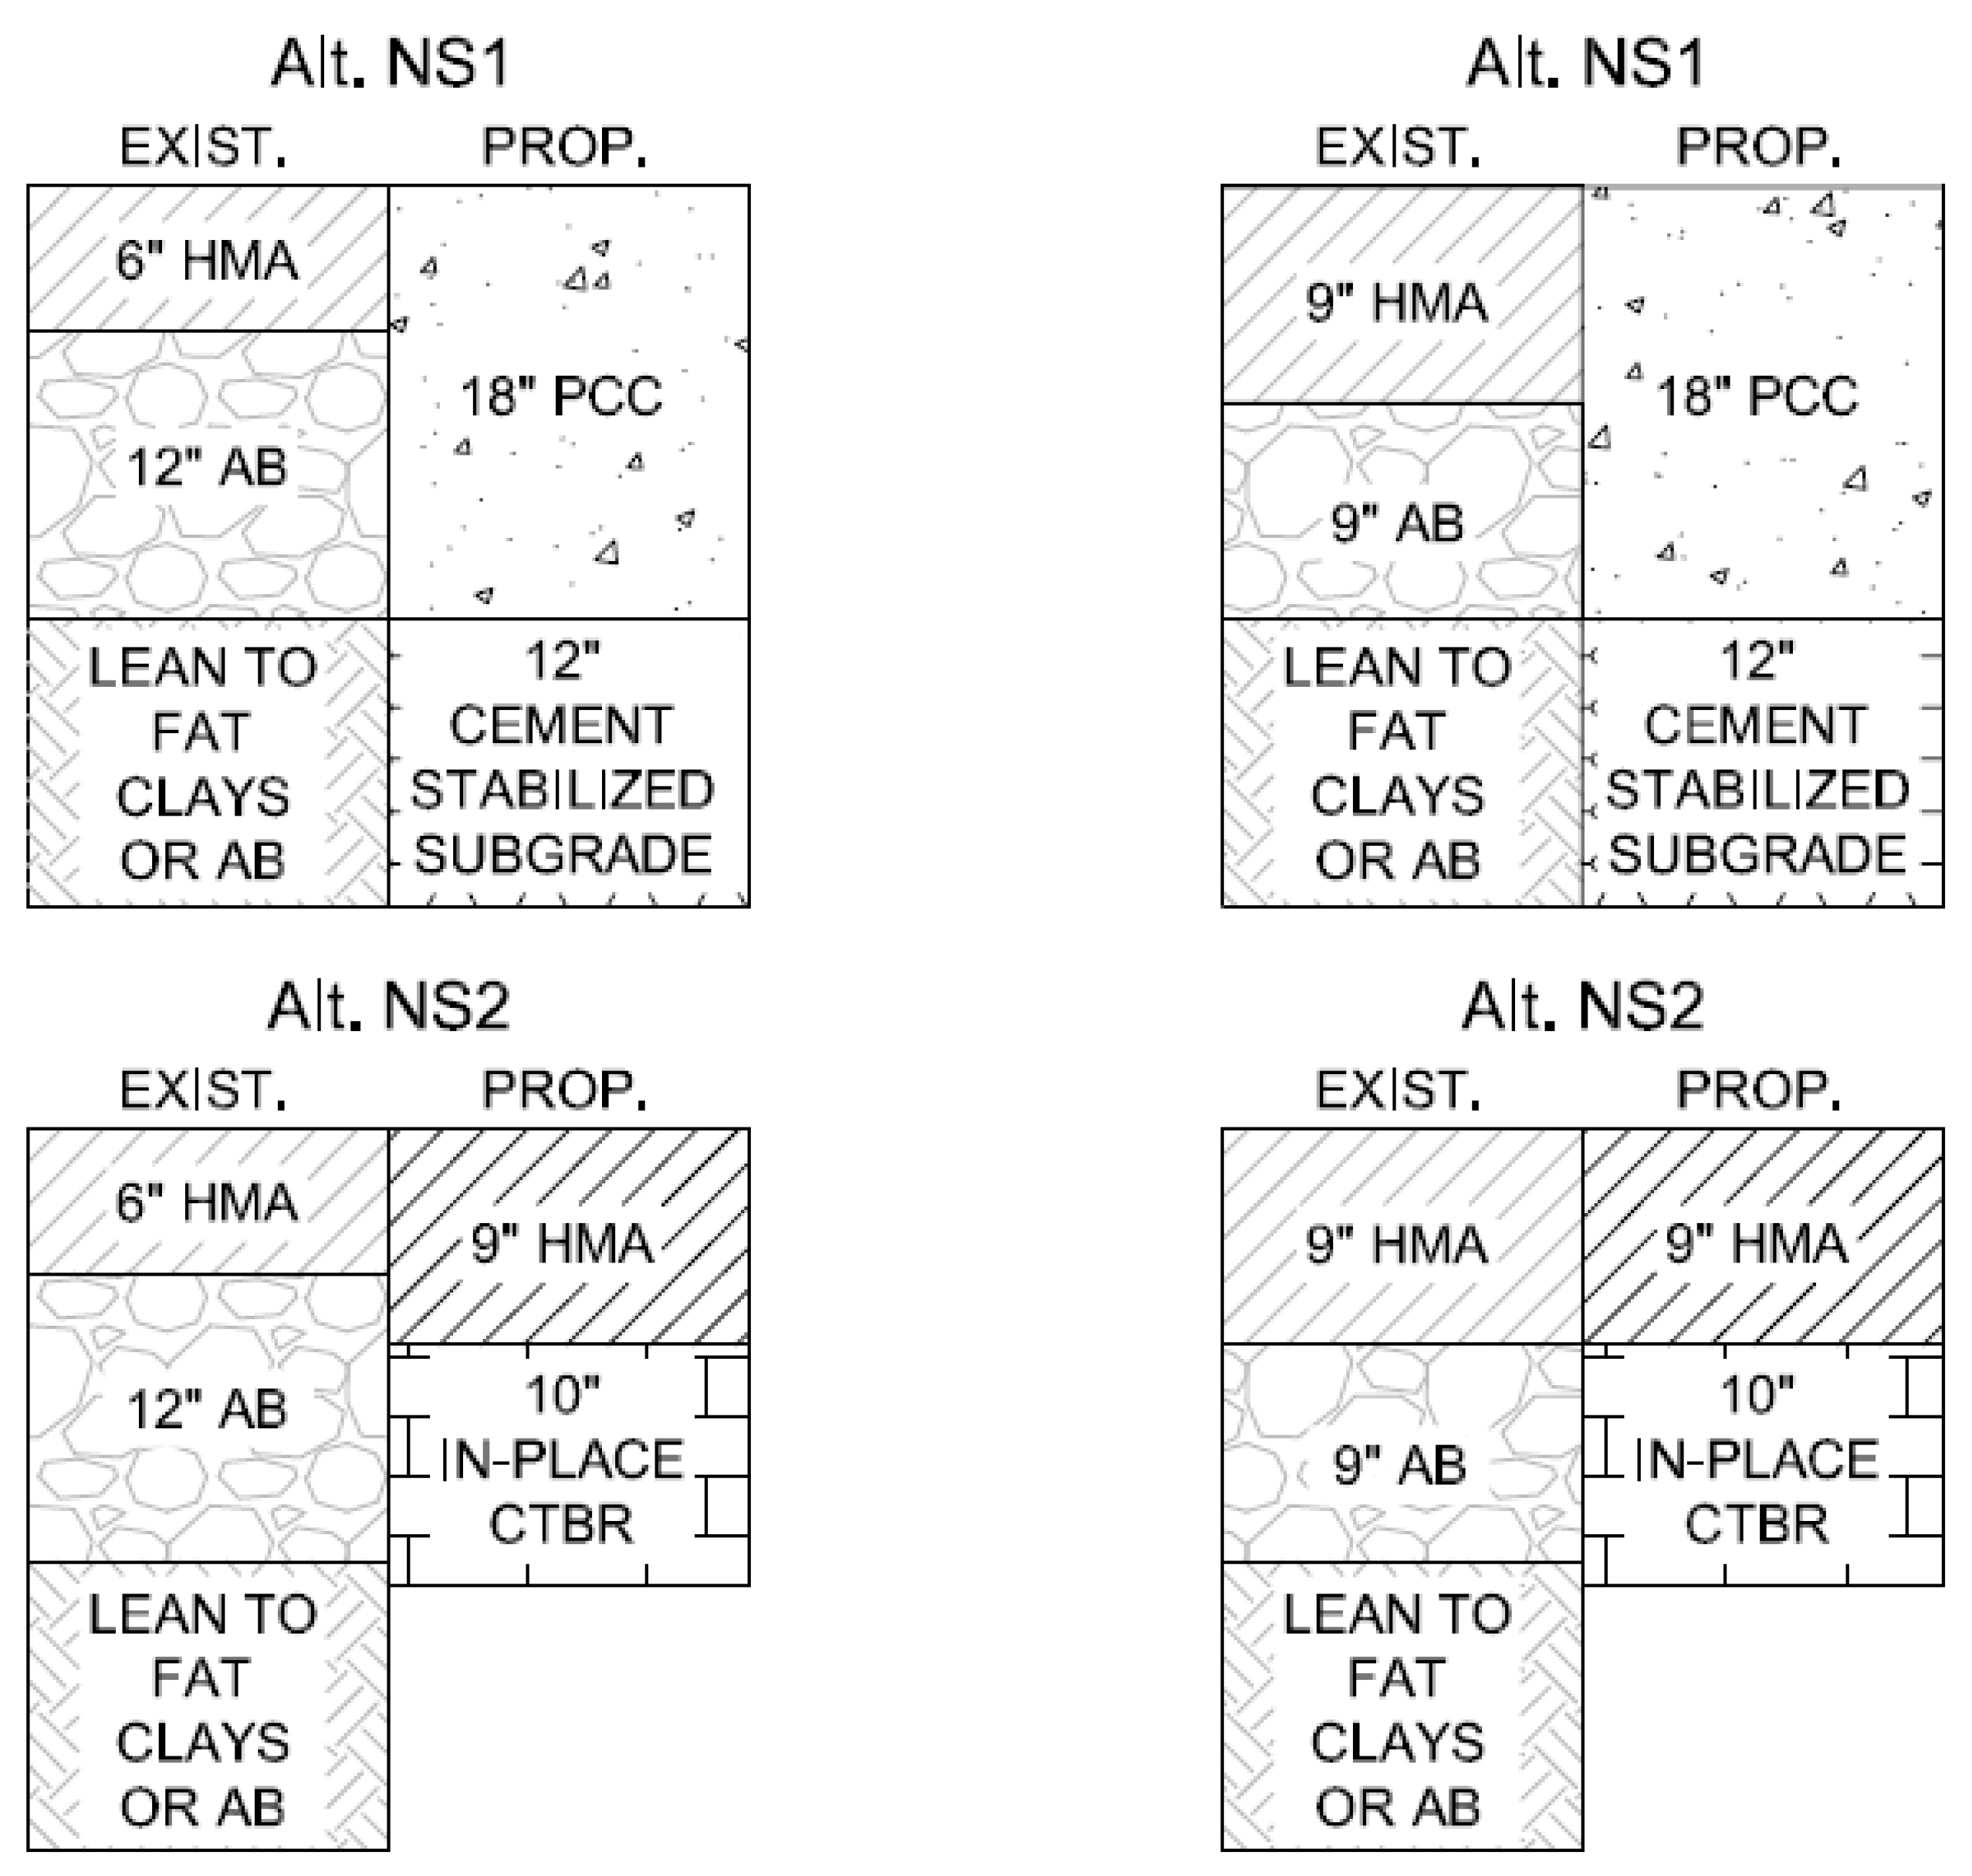
Information for this case study was gathered from a reconstruction project on Taxiway Sierra, which was completed in 2016. BNA was interested in the concrete and asphalt pavement cross section alternatives that they expected to deliver same functional performance. Several asphalt and concrete pavement design alternatives were proposed and, based on the least cost from LCCA, one concrete cross section and one asphalt pavement cross section were selected. The UCPRC and Atkins, BNA’s consultant on the project, decided that the goal of the study would be to use LCA to identify a concrete and an asphalt pavement design cross-section that has the lowest environmental footprint from among the design alternatives that were considered in the LCCA done by BNA. In order to achieve the goal, the environmental impacts of all seven pavement design alternatives, four concrete and three asphalt, were evaluated and the results compared within each pavement type, i.e., asphalt sections were compared with other asphalt sections, and concrete sections were compared with other concrete sections. The existing pavement structures (EXIST.) and the proposed pavement structures (PROP.) are presented in
Figure 1 and
Figure 2. The sections shown in
Figure 1 are the “non-standard” pavement design alternatives (Alt. NS1 to Alt. NS2) that are based on standard engineering practices, but which are not commonly used.
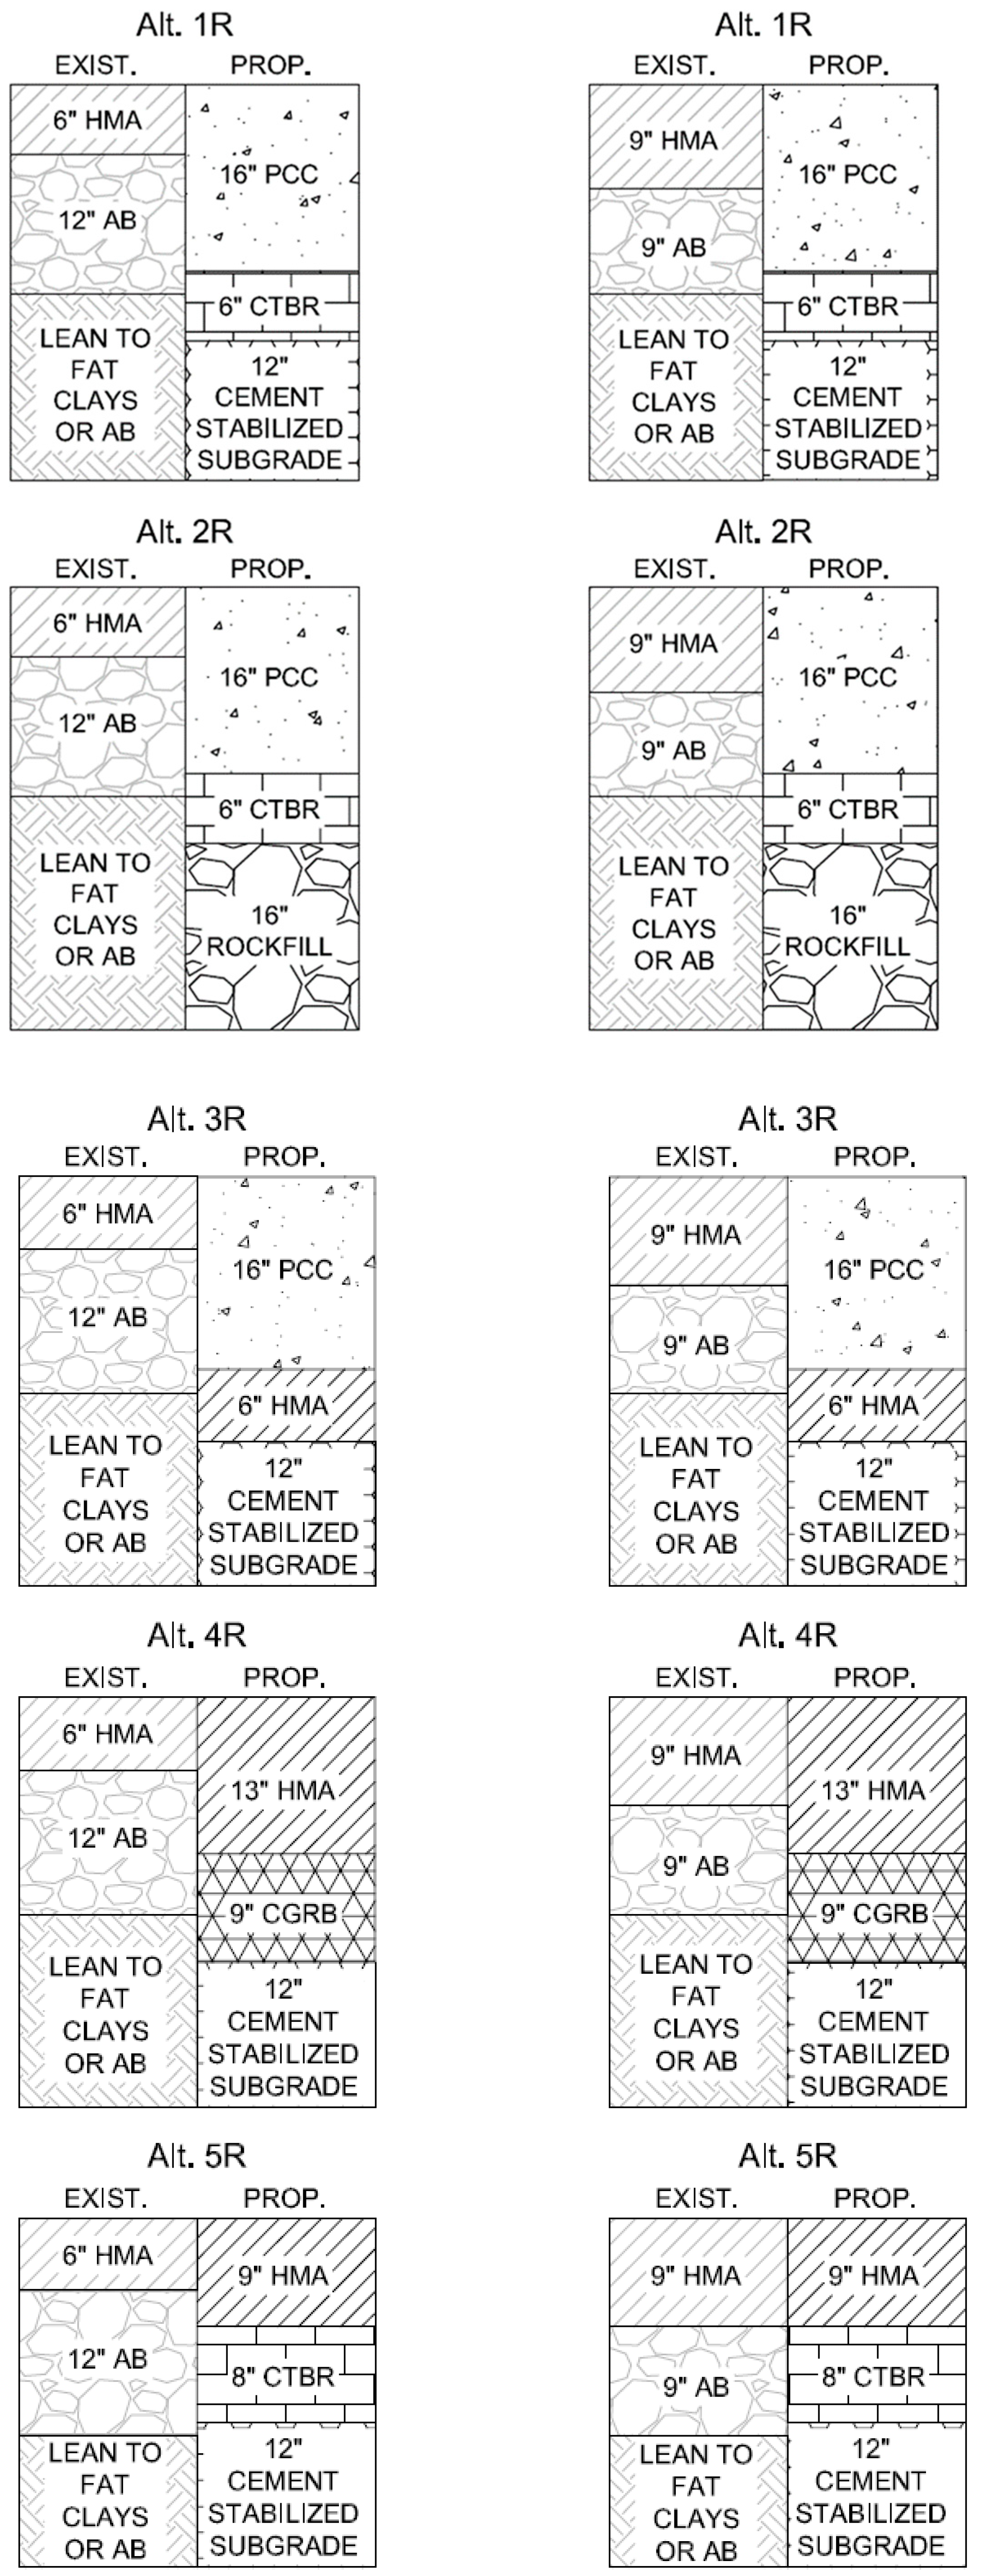
Figure 2 presents the standard design alternatives (Alt. 1R to Alt. 5R) that are used by the airport.
This is an example of a comparative LCA study. This type of study is used to compare different pavement design alternatives, and the results can be used with LCCA to help airports make more informed decisions regarding both sustainability and cost. It is very important to note that comparisons must consider the complete life cycles of the alternatives being compared, not just one part of the life cycle, such as initial construction or the use stage, unless it is ascertained that stages of the life cycle that will not be in the scope are identical. For this case study, each of the alternative pavement cross sections within each pavement type (asphalt and concrete) was reasonably assumed to have the same maintenance cycle, time to next rehabilitation, use stage, and end-of-life scenario. This assumption was based on designing each alternative cross section to meet these assumptions. This means that the materials, construction, and transportation stages were the only parts of the life cycle that differed. The concrete and asphalt cross sections cannot be compared to each other because they will likely have different results for the stages of the life cycle that were not included in the scope of the study.
The scope of the study was therefore what is termed as cradle to laid, in which the materials and construction stages of the life cycle of the pavements and the transportation of materials are considered. The functional unit defined for the case study was the construction of a taxiway sub-lot where the sub-lot length was set as 30 m (100 ft) and the width as 15 m (50 ft). A functional unit of this type can be scaled for pavements that have varying widths or thicknesses, and could also be used for airside vehicle roads, shoulders, drainages, and aprons.
After discussing with the FAA and the airport, the following impact indicators were calculated for the case study:
Global warming potential (GWP),
Photochemical O3 creation potential (POCP)
Atmospheric particulate matter with a diameter of less than 2.5 micrometers (PM2.5)
Primary energy demand from nonrenewable sources consumed as energy (PED-NR)
Primary energy demand from renewable sources consumed as energy (PED-R)
Primary energy demand for materials made from energy sources not consumed as energy (PED-FS), including both renewable and nonrenewable sources, also called feedstock energy; none of the energy sources used as materials in these case studies were renewable, with all the feedstock energy being related to petroleum-based products.
The first three indicators were selected from the TRACI set of impact indicator models [
23]. POCP and PM
2.5 are two of the major impacts that affect human health and quality of life in urban areas, whereas GWP is a global issue. The locations of the POCP and PM
2.5 emissions are summed across all emission locations in the system. Some of the emission locations may be far from the project location, such as those from extraction and refining of oil to make asphalt and fuel for construction and transportation equipment, and those from the manufacture of cement. The division of PED into three parts was adapted and simplified from the European EN 15804 [
24] approach that is also recommended in the FHWA pavement LCA framework [
20].
1.3. Assumptions and Data Used for the Case study
For electrical energy, the electricity mix generation data for the State of Tennessee was gathered from the U.S. Energy Information Administration [
25]. The electricity mix was used for modeling electricity impacts in GaBi ([
26]; life cycle inventory and impact assessment software) for different materials and processes for the airport using common information for each source of electrical energy.
Table A1 in the
Appendix A shows the fuel and natural gas life cycle impact assessments (LCIA) and primary energy demands (PED) for declared units of these input flows that were used to prepare impact assessments for the material and construction stages of the alternative designs.
Table A1 also includes the transportation impacts used in the case study for a declared unit of 1000 kg-km of materials being transported by a 24 metric ton (tonne) truck. A national average mixing temperature for hot mix asphalt (HMA) of 177 °C (350 °F) was used to determine the environmental impacts from the production of HMA. In the U.S., natural gas or fuel oil is commonly used for heating the HMA ingredients in asphalt mixing plants. Natural gas was assumed to be the fuel used in the asphalt mixing plants for this study based on the assumption that the use of fuel oil would generally be prohibited or otherwise considered unacceptable in urban areas near major airports such as BNA.
The allocation method used for recycled or reclaimed materials, such as reclaimed asphalt pavement (RAP), was the “cut off” approach. This means that the impacts of producing the material that will be recycled in the project of interest are attributed to the previous project, and only the impacts of removal (milling), transporting, and processing the material for the current project are included in the impact analysis.
2. Life Cycle Inventory Analysis
With the permission of BNA, Atkins shared documents with the UCPRC related to the taxiway reconstruction project. Pavement cross-section designs for the different proposed asphalt and concrete alternatives extracted from the Taxiway Sierra reconstruction project drawings and the engineer’s final report were shown earlier in
Figure 1 and
Figure 2. A total of seven design alternatives were proposed, including five standard designs and two non-standard designs. Four of the alternatives were concrete pavements and three were asphalt pavements. The cross-section information of the pavement design alternatives and material quantities based on the functional unit are summarized in tabular form in
Table 1.
Table 2 summarizes mix designs for the different materials used in the pavement design alternatives that were extracted from the job mix formula (JMF) documents and the engineer’s final report. The construction information, such as the lift thicknesses, were extracted from the specification documents.
Table A2 in the
Appendix A includes the material production plant and quarry locations that were collected from the documents, and the average material transport distances between the different facilities determined using Google Maps™.
The electricity mix of 2015 for Tennessee [
25] was used to calculate the impacts for the materials production processes and is presented in
Table A3 in the
Appendix A. Using the inventory data from
Table A3, the GaBi database was used to calculate the LCI and LCIA for the production of 1 MJ of electrical energy. The total energy consumed (combination of the primary energy from renewable and nonrenewable resources) and selected TRACI impact indicator results are presented in
Table A4 in the
Appendix A.
UCPRC material and construction equipment LCIs [
27] were used where data were unavailable. The environmental impacts of recycled/reclaimed aggregates in cement-treated base with reclaimed aggregate (CTBR) and crushed graded reclaimed base (CGRB) were considered to be the same as those of RAP which is a reasonable assumption as only the impacts of construction activities to pulverize the old surface to obtain reclaimed materials plus transportation to the plant were assigned to RAP. The impacts from the cement (based on the cement contents) were added to the impacts of CTBR and cement treated sub-grade (CSS). The transportation of CTBR from the plant to the site was also considered in the analysis. CTBR material was assumed to be prepared at a plant and the impacts of plant processing were assumed to be the same as of cold central plant recycling (CCPR). The plant processing impacts of HMA, PCC, and CCPR were taken from environmental life cycle assessment for pavements tool (eLCAP) [
28].
4. Interpretation
Some general observations from the case study are made in this section followed by discussing and interpreting the results (presented in
Section 3) from each pavement type.
Energy, GHG, and PM
2.5 for all the concrete and asphalt pavement design alternatives were always found to be the highest for the material stage when compared to the construction stage and materials transportation (
Appendix A,
Table A5). This is primarily due to the high emissions associated with producing the binders for the construction materials: asphalt binder is made from oil which has high impacts from crude extraction and refining processes and the energy needed to heat asphalt for mixing with aggregates, and Portland cement which has high emissions from the process of calcination which converts minerals into material that when mixed with water will cement aggregates together. Wang et al. performed LCA of different pavement design alternatives for an airport and also arrived at a similar conclusion: the energy consumption and GHG emissions from the production of binding agents (asphalt binder and cement) were comparatively high in the material stage even though their mass percentages are small in the mixes [
17].
Impacts from transportation of materials, though small in this case study due to shorter distances, can be sometimes higher than other life cycle stages as can be found in literature [
29]. Shorter transport distances and reduced material transportation can reduce environmental impacts therefore, locally available materials use, including recycling of pavement materials on-site of the airfield where they can give same or better functional performance should be preferred. This was one of the arguments that was made for the NS2 design alternative because it was intended to keep trucks out of the local streets by not removing the existing subgrade.
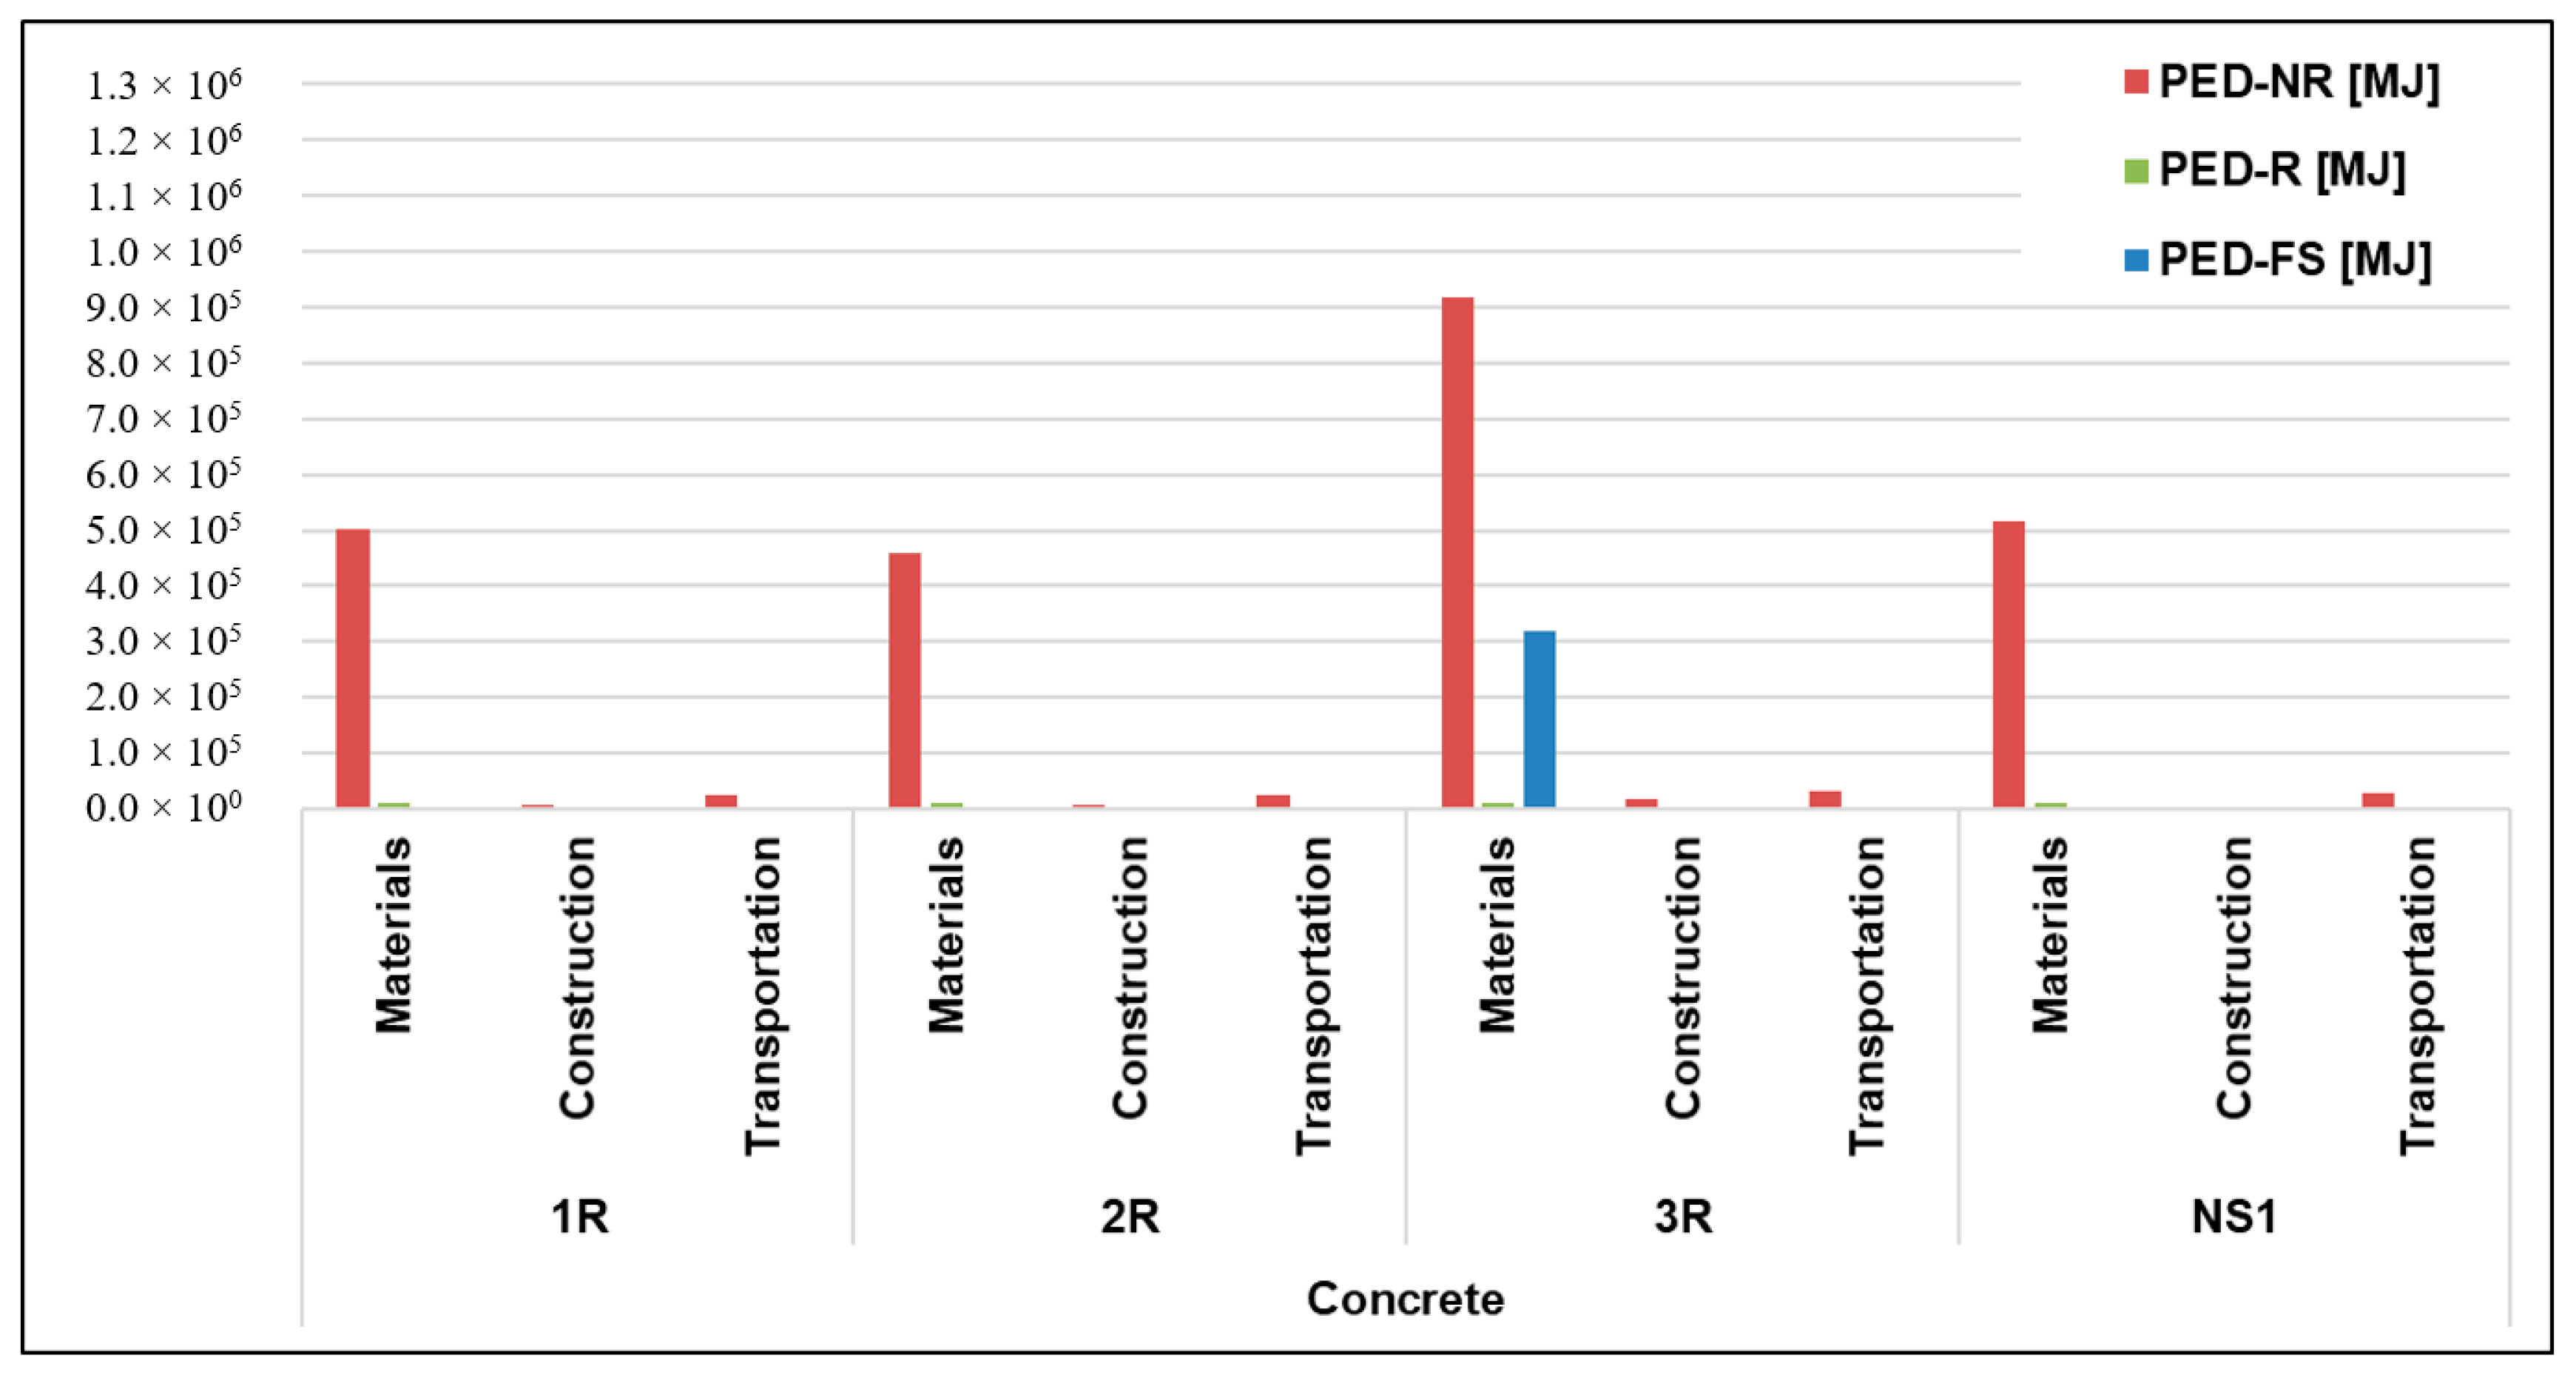
POCP (smog) is mainly produced from the burning of fossil fuels, therefore the trends of POCP were observed to be similar to that of the nonrenewable energy (PED-NR) as can be seen in
Figure 5 and
Figure 6. Interestingly, POCP was seen to be always higher for the construction stage of the HMA pavement design alternatives (4R, 5R, and NS2) which was mainly due to high smog formation from burning of the fuel in the construction equipment i.e., there are pieces of equipment working for long periods in HMA construction.
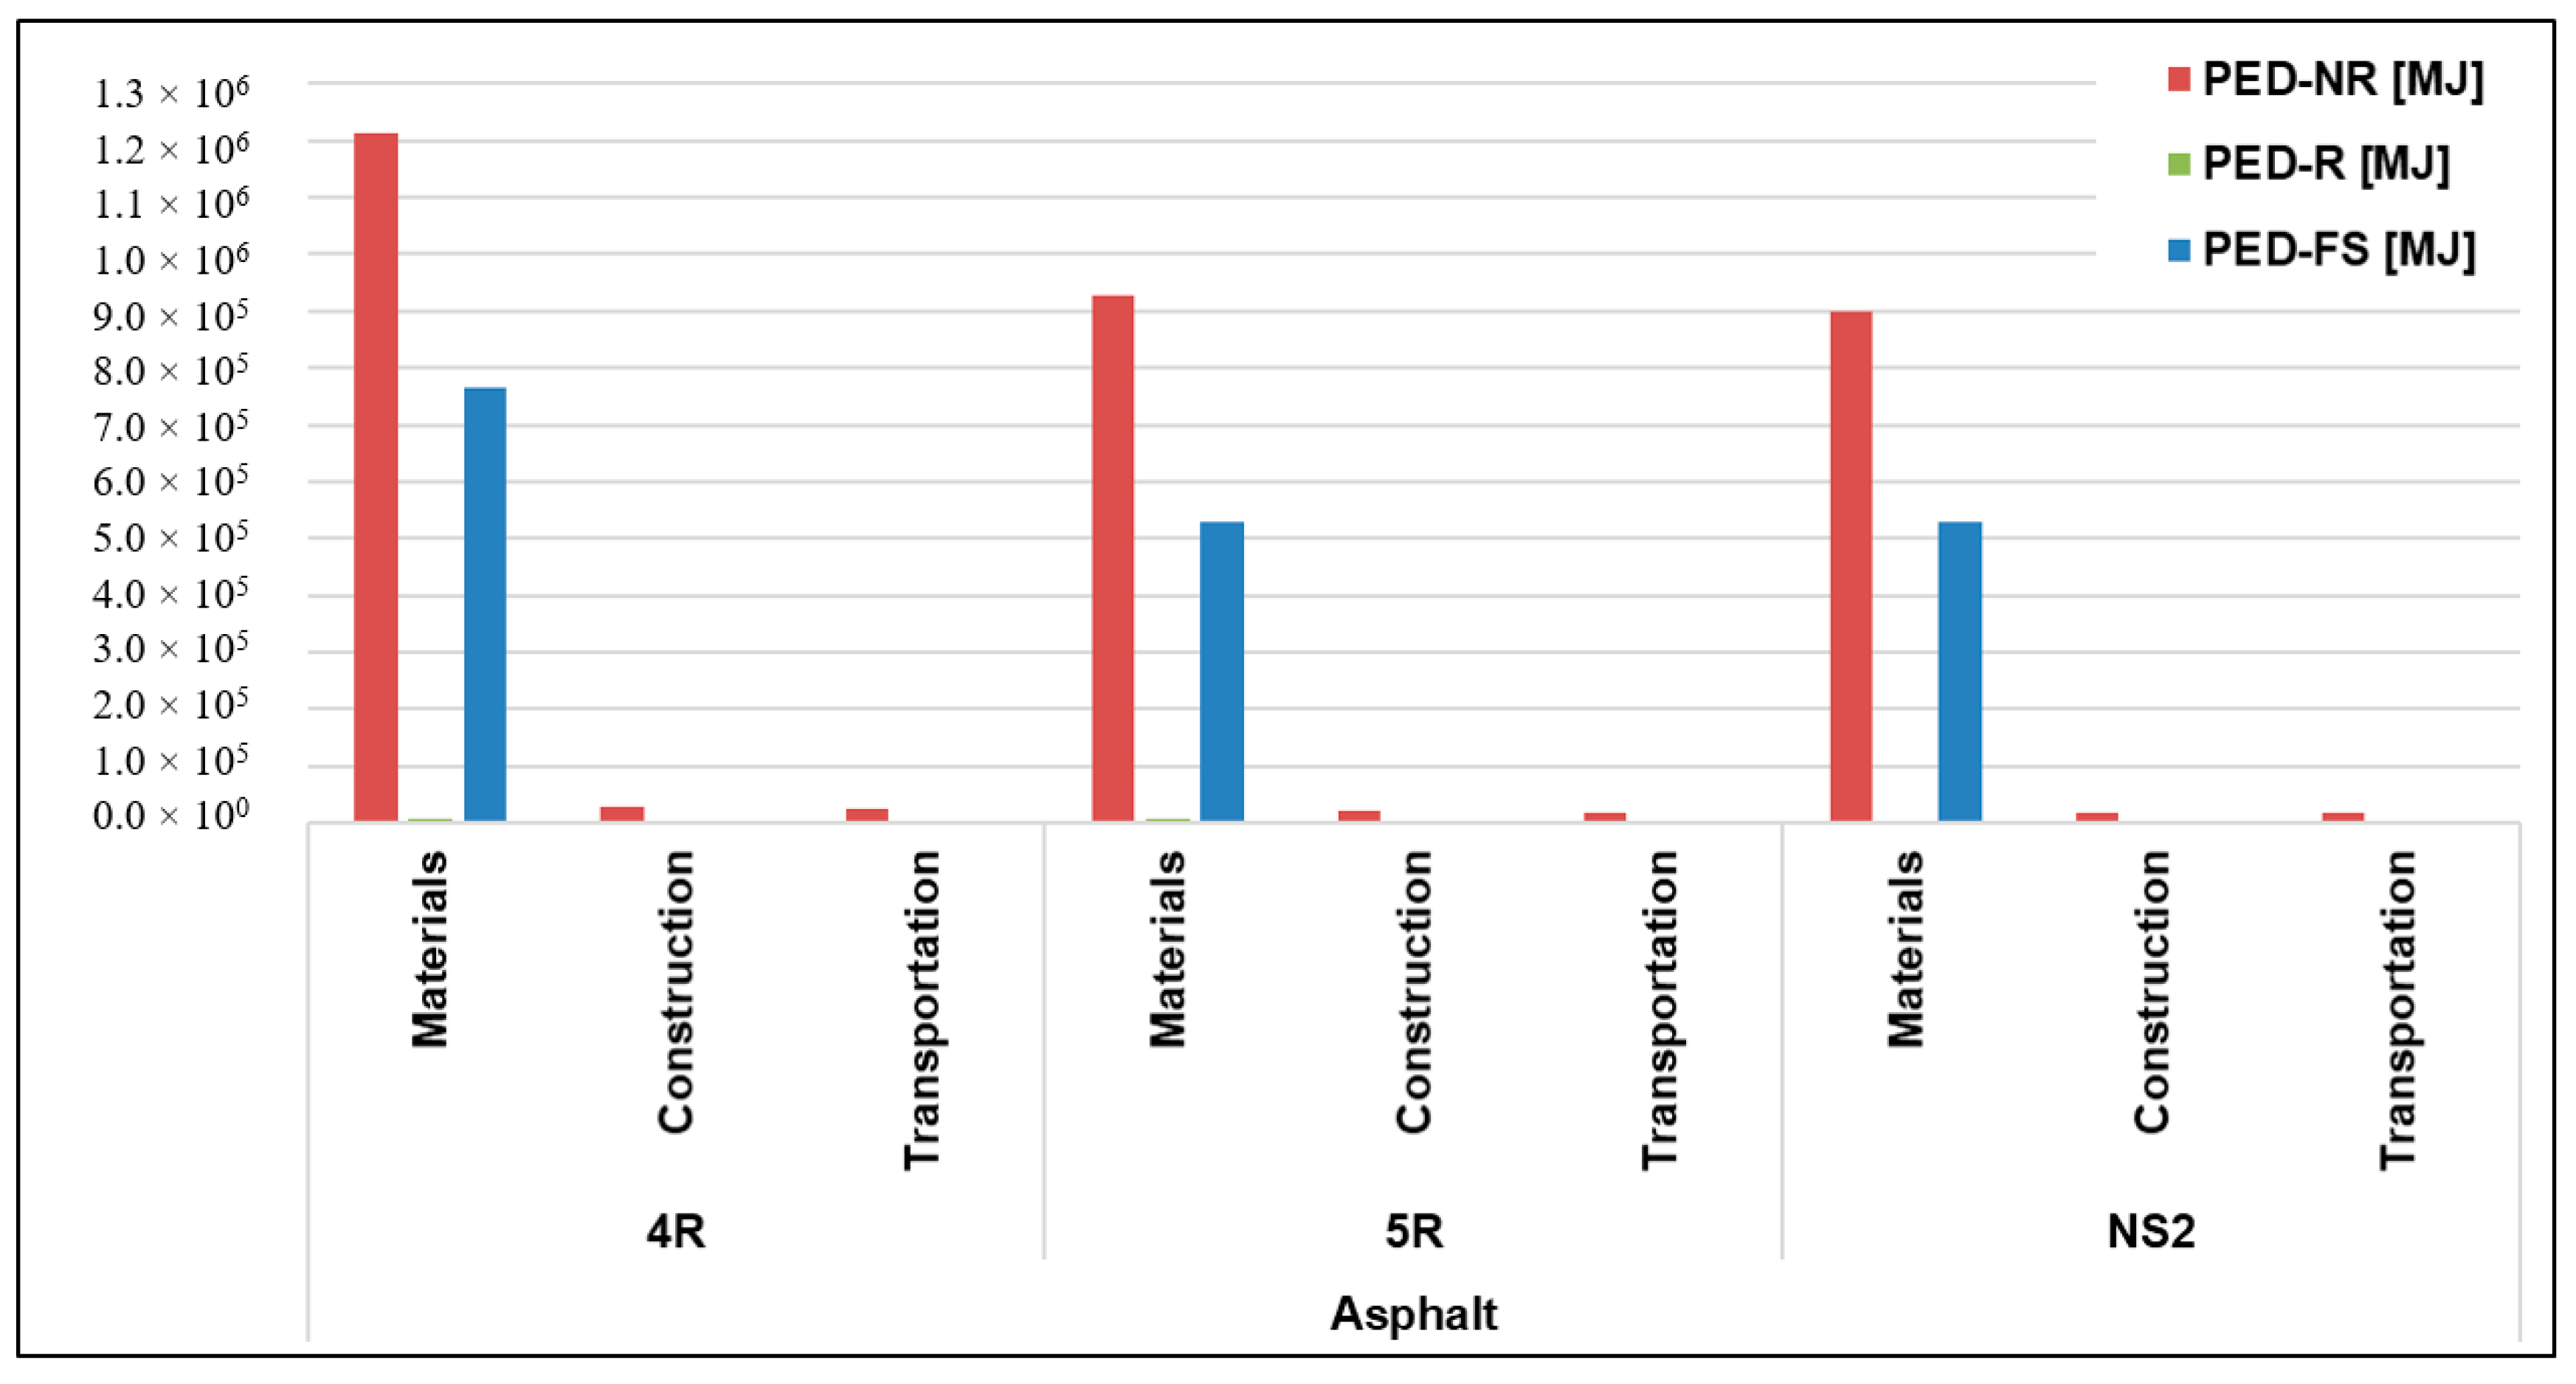
Asphalt binder was used in the HMA layers of 3R, 4R, 5R, and NS2 and was the only material that had feedstock energy (PED-FS), meaning potential energy sources that are used as a material i.e., the asphalt binder could potentially have been burned as an energy source. Thus, only those design alternatives showed PED-FS values.
The emissions from the renewable energy (PED-R) usage are very small (zero if the construction and installation of infrastructures that produce renewable energy are not considered in the analysis) and in this study a small quantity of PED-R in electricity mix is used in the material stage. The magnitude difference between the two energies (PED-NR and PED-R) can clearly be seen in
Figure 5 and
Figure 6; nonrenewable energy resources are being used in all the life cycle stages thus having high values.
4.1. Concrete Pavement Design Alternatives
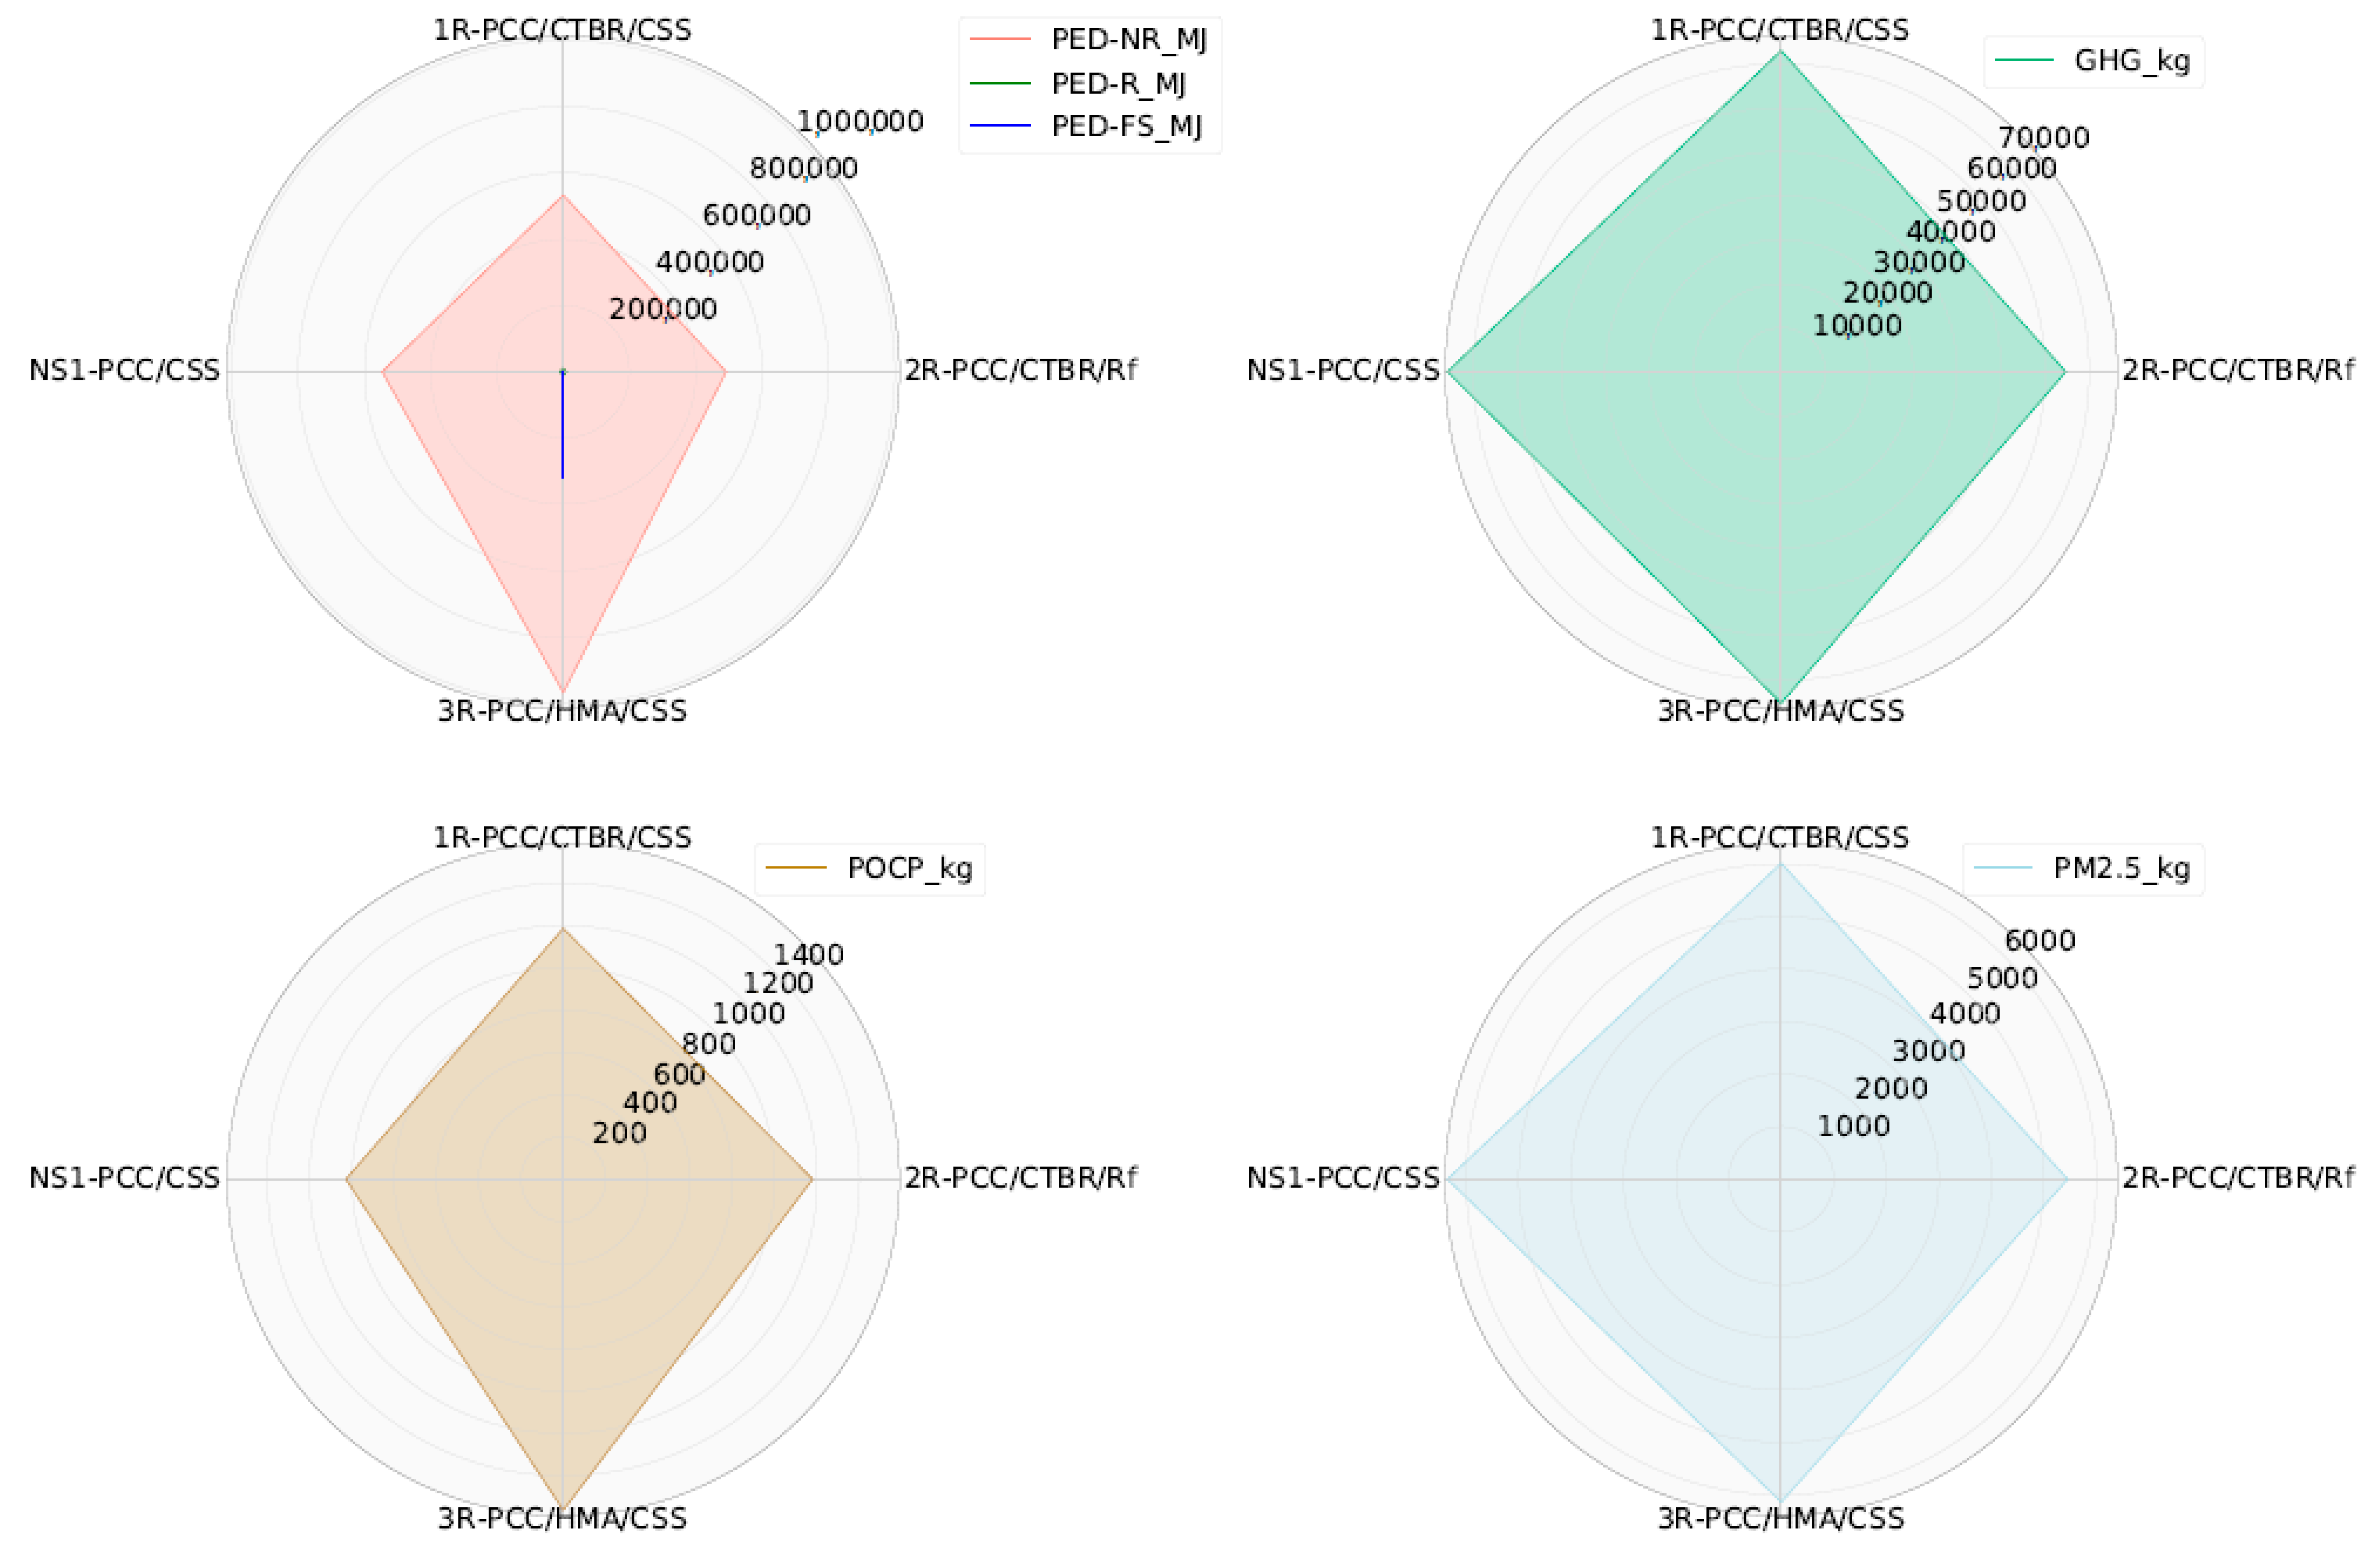
A comparison of the four concrete pavement design alternatives (1R, 2R, 3R, and NS1) showed that the energy impacts from all the life cycle stages of 3R were the highest as can be seen in
Figure 3. PED-NR for all the alternatives were in the range of 43% to 49% lower than those of 3R. This is because 3R has a cross-section of a thick PCC surface layer underlain by HMA and CSS. The greater cement and asphalt binder contents in this alternative compared to the others are contributing to the greater energy impacts for this alternative. It is also to be noted that only 3R has feedstock energy (PED-FS) use as this is the only concrete design alternative which has a layer of HMA underneath. The energy impacts from transportation and construction were the highest for 3R because large quantities of several materials would be transported to the mix plants and the construction site, and more construction equipment and time are needed to build the cross-section. The materials production stage was the dominant life cycle stage across all concrete pavement design alternatives, accounting for more than 95% of total GHG emissions.
On the contrary, 3R might not be the worst alternative when GHG and PM
2.5 emissions are considered as can be seen in
Figure 5 where NS1 shows the highest impacts. However, the differences in GHG and PM
2.5 between all the concrete pavement design alternatives are within 15% of NS1. The impacts are higher for NS1 primarily due to the fact that it has a concrete surface layer that is approximarily 12% thicker (46 cm [18 in]) compared to all other alternatives (40 cm [16 in]) which results in more cement being used. Furthermore, the cement content in the CSS layer of NS1 is also higher (6%) compared to other alternatives that have a cement content of 4%.
Alternative 2R had the least environmental impacts (energy, GHG and PM2.5). This is because the 2R design alternative had subgrade of rockfill (Rf) whereas all other concrete design alternatives had cement stabilized subgrade (CSS) layer. Hence, reduced cement content use explains this difference. Decision support in selection of the design alternative based on 30-year LCCA suggests 1R to be the most cost-effective alternative; however, if environmental considerations are prioritized, then the alternative 2R is preferable.
4.2. Asphalt Pavement Design Alternatives
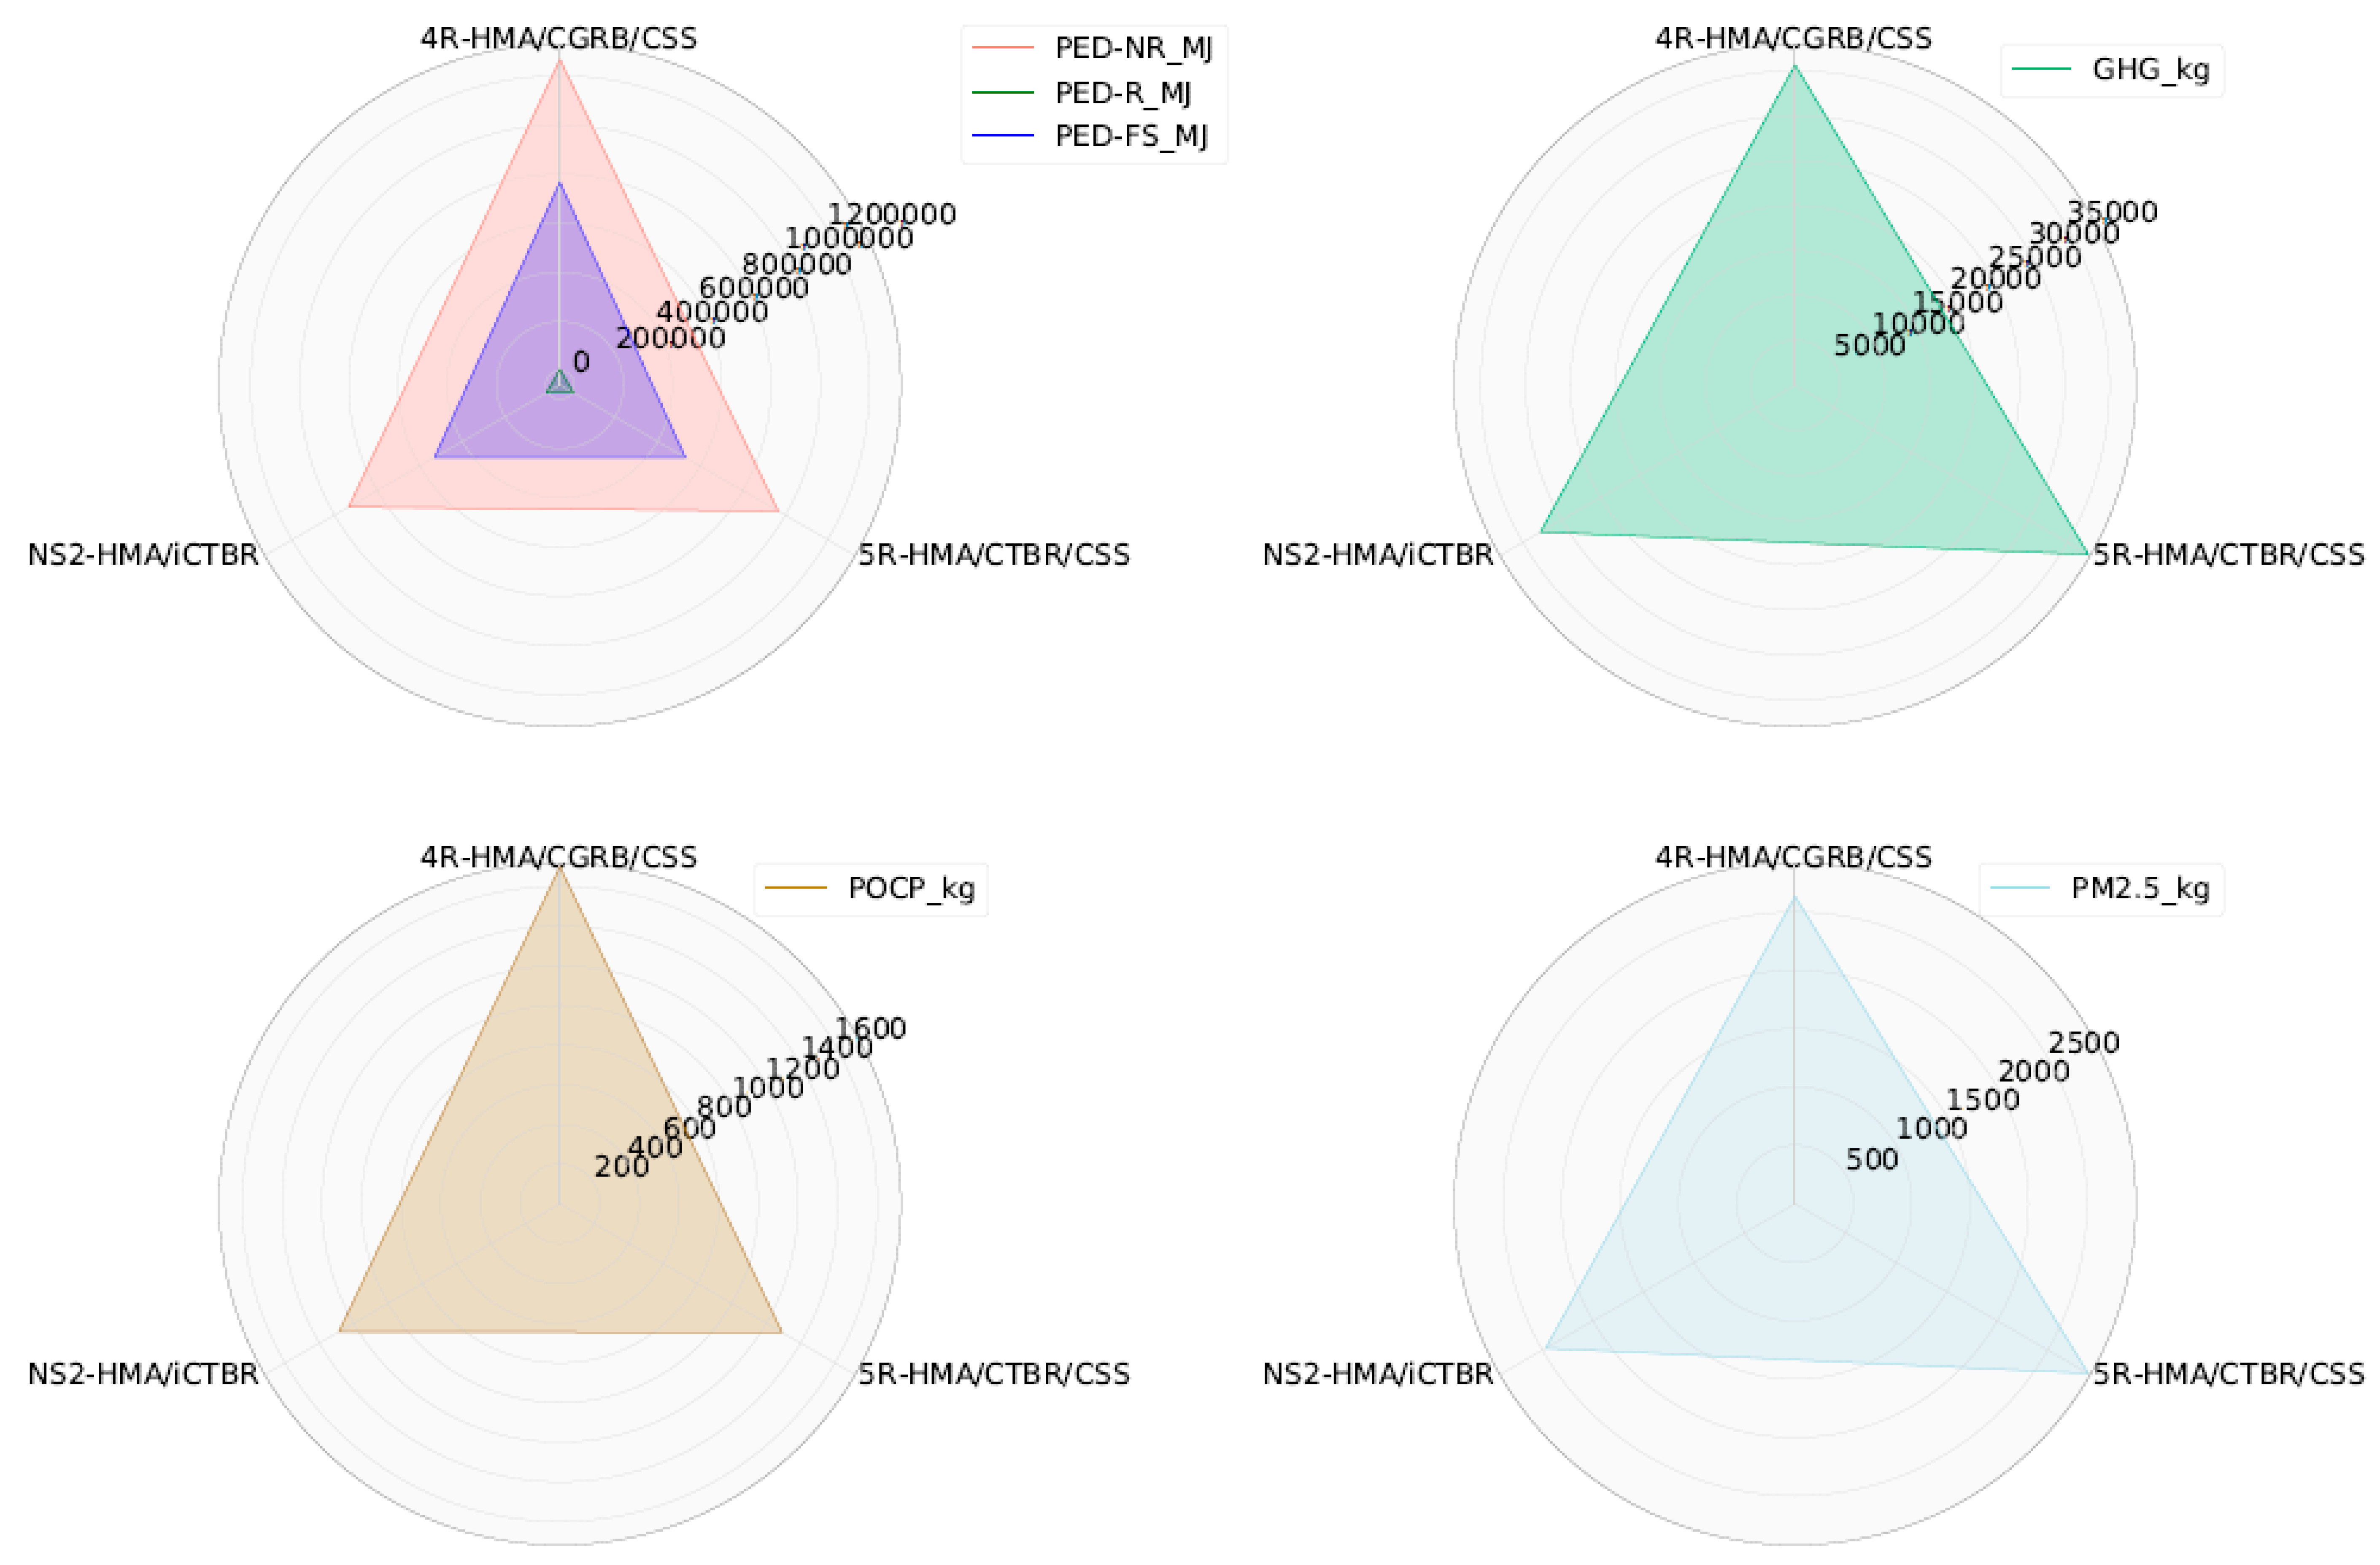
Of the three asphalt alternatives (4R, 5R, and NS2), NS2 had the smallest and 5R had the largest environmental impact for the TRACI indicators (GWP and PM
2.5) as can be seen in
Figure 6. Alternative 5R not only had cement stabilized subgrade but also had a sub layer of cement treated recycled base, thus large cement content use was the reason behind higher GHG and PM
2.5 emissions for 5R. PED-NR for 5R and NS2 were 24% to 27% lower than 4R, respectively, whereas the difference between 5R and NS2 was about 3.4%. The explanation for this small difference of 3.4% is that 5R uses CTBR which is a CCPR mix whereas NS2 has in-place mixed CTBR eliminating transportation of large quantities of CTBR materials. Furthermore, 5R also has an extra cement stabilized subgrade which NS2 does not. Alternative 4R had the highest amount of a potential energy source used as a material, feedstock energy (PED-FS) in the asphalt binder which is a direct reflection of the amount of asphalt binder in a cross-section as can be seen in
Figure 4.
As with the concrete alternatives, transportation and construction were not major contributors to any impact category other than smog formation, and in this category construction from equipment use was consistently the dominant contributor; 50%, 49%, and 46% of total smog formation for 4R, 5R, and NS2, respectively (
Appendix A,
Table A5). The materials production stage was the dominant life cycle stage across all asphalt pavement design alternatives, accounting for more than 90% of total GHG emissions. 4R had the thickest cross-section compared to all the other asphalt pavement design alternatives. The energy impacts from transportation and construction were the highest for 4R because large quantities of materials would be transported to the mix plants and the construction site, and more construction equipment and time are required to build the thick cross-section.
NS2 had the least environmental impacts (energy, GHG, and PM
2.5) as can be seen in
Figure 6. NS2 has the thinnest HMA layer, shared with 4R, the least amount of cement stabilized material, and the cement stabilized material is mixed in place. Alternative 5R shows the highest impacts, mainly due to the high usage of cement in sub-layers of the asphalt pavement in 5R. This is the only design alternative among the asphalt pavements that has two layers that use cement stabilization (CTBR and CCS).
In a 30-year LCCA, it was determined that NS2 was the most economical option. As discussed here, LCA (cradle-to-laid) results also determined that NS2 was the most environmentally feasible option.
5. Conclusions
The material stage was observed to have high environmental impacts for all the pavement design alternatives when compared to the construction stage and transportation of the materials. However if the material transportation distances are longer, the transportation of materials can show higher environmental impacts than the material stage due to high use of the fossil fuels for hauling.
GHG and PM2.5 impacts were observed to be more important in all the pavement design alternatives in which high cement content was used. This is mainly because of high impacts associated with the cement production. These indicators are also influenced by the thickness of asphalt stabilized materials. The relative contribution of POCP impacts on the other hand were notably high for the construction stage for all the pavement design alternatives that had an HMA layer. Smog formation is usually linked to fossil fuel burning in construction equipment, which operates for relatively long periods of time as asphalt layers are built in lifts that are seldom more than 75 mm (3 inches) thick, as well as oil extraction and refining.
Major take aways from this case study include:
- -
Reduced use of cement brings down energy use, GHG, and PM2.5 emissions. Alternative supplementary cementitious materials in concrete mixes that give same or better functional performance should be considered for airfield pavements.
- -
Reduced use of asphalt binder also brings down environmental indicators. Methods of materials and structural design that give same or better functional performance with reduced use of asphalt binder should be considered.
- -
Reducing use of imported fossil fuels and supporting renewable energy use can bring down enviromental loads significantly as nonrenewable resource use is one of the major source behind all the impacts.
- -
In-place and on-site recycling in this case study showed reduction in enviromental impacts compared to off-site central plant recycling mainly due to a reduction in the impacts from transportation of the materials. Thus, in-place and on-site recycling techniques should be further studied and implemented if applicable to airfield pavements.
This case study showed that performing LCA provides opportunities for airports to consider energy use and environment-related impacts in the decision-making process. LCCA is already being performed by most major airports in the U.S. The use of LCA (environmental assessment) along with LCCA (economic assessment) can help the airports in making well-informed and optimal decisions, such as the selection of more viable pavement design alternatives.

 ,
, 

