Abstract
Improving indoor environment quality and making urban centres in tropical regions more sustainable has become a challenge for which computational models for the prediction of thermal sensation for naturally ventilated buildings (NVBs) have major role to play. This work performed analysis on thermal sensation for non-residential NVBs located in Brazilian tropical warm-humid climate and tested the effectiveness of suggested adaptive behaviours to mitigate warm thermal sensation. The research method utilized transient computational fluid dynamics models coupled with a dynamic model for human thermophysiology to predict thermal sensation. The calculated results were validated with comparison with benchmark values from questionnaires and from field measurements. The calculated results for dynamic thermal sensation (DTS) seven-point scale showed higher agreement with the thermal sensation vote than with the predicted mean vote. The test for the suggested adaptive behaviours considered reducing clothing insulation values from 0.18 to 0.32 clo (reducing DTS from 0.1 to 0.9), increasing the air speed in 0.9 m/s (reducing DTS from 0.1 to 0.9), and applying both suggestions together (reducing DTS from 0.1 to 1.3) for five scenarios with operative temperatures spanning 34.5–24.0 °C. Results quantified the tested adaptive behaviours’ efficiency showing applicability to improve thermal sensation from slightly-warm to neutral.
1. Introduction
Seven out of ten of the most populated mega-cities [1] are in both developing countries [2] and hot-dry or warm-humid regions based on Köppen–Geiger world climate classification [3]. An unprecedented growth in the number of room air-conditioning (RAC) systems installed in cellular office’s and apartment’s buildings has been observed in those cities and countries [4]. This has been happening due to a combination of rise in income and reduction of RAC acquisition price but also due to increasing expectations for thermal comfort and low thermal performance under hot weather of most of the constructions in these locations. The tendency of growth in the RAC systems may be accentuated by the rising number of companies and individuals opting for home office activities during and after the COVID-19 pandemic [5].
Improving the quality of the indoor environment and living conditions and making buildings more sustainable in established urban centres have become challenges which demand the attention of today’s architects, engineers, and urban planners. In that sense, natural ventilation has a major role to play, being not only restricted to indoor air quality by supplying fresh air to dilute pollutants but also by delivering thermal comfort and curbing unnecessary energy consumption with RAC [6,7].
Thermal comfort is defined in the ASHRAE Standard 55: Thermal Environmental Conditions for Human Occupancy [8] (p. 3) as “a condition of mind that expresses satisfaction with the thermal environment and is assessed by subjective evaluation”. Although the achievement of thermal comfort would be of individual and subjective perception, there are several approaches and models to assess the environmental and physiological variables which define thermal sensation. The mostly known model is the Fanger’s seven points scale, which categorizes thermal sensation ranging from −3 (cold) to +3 (hot), with zero for neutral thermal sensation [9]. The predicted mean vote (PMV), which utilizes this scale, and the predicted percentage of dissatisfied (PPD), derived from the PMV, are calculated combining subjective and individual parameters, such as metabolic rate and clothing thermal insulation level, and environmental conditions, such as the mean radiant temperature, air temperature, air relative humidity, and air speed. The calculation of PMV and PPD indices are described in standards and supported by procedures to classify measurement accuracy and reduce errors and noises which may impact on the overall calculated indices [8,10,11,12].
Fanger’s model was initially designed and suitable for office buildings with heating, ventilation, and air conditioning (HVAC) systems located in temperate climatic regions. Reviews of initial Fanger’s model consider the capacity of individuals to adapt to adverse environmental conditions [13,14]. The adaptation would be triggered by physiological, psychological, and behavioural responses to the environment [15]. The thermophysiological responses would happen via the passive and active self-regulatory systems of the human body [16]. The psychological response would be related to increased thermal acceptability for residents of locations with wider hot climatic conditions, and for occupants of naturally ventilated environments, as opposed to HVAC environments [17,18,19]. Moreover, the behavioural responses would happen by changing the activity performed and the clothing levels, by actively controlling the environment opening/closing windows in naturally ventilated environments, and by switching on/off mechanical fans [14]. Fanger and Toftum [20] proposed an extension of the PMV model for naturally ventilated buildings in warm climates based on reported high tolerance to warm environments for occupants on naturally ventilated buildings (NVBs). The extension considered an expectancy factor (e) to be multiplied by the initial PMV index, ranging from 1.0 (high expectancy) for HVAC buildings located in regions with short warm seasons, to 0.5 (low expectancy) for NVBs located in regions with constant warm climates, with 09-07 (moderate expectancy) for a majority of NVBs located in regions with warm summer season. Humphreys and Nicol [21] suggest an adjust on the PMV values to reduce bias related to discretization resulting of generalizations for individual body characteristics, errors in field measurements, and discrepancies due to the round-up of values.
Based on the so-called adaptive behaviour, the operative temperature setpoints were adjusted for wider ranges and personalized for NVBs in several standards [8,11,12] and for national ranges of climatic regions, as in the Chinese model [22] and the Indian model [23]. The last review for the standard ASHRAE-55 provides the corresponding acceptable increase in the operative temperature with the rise in the air speed whilst maintaining thermal comfort sensation of +0.50 (PMV), as in ASHRAE-55 [8] (Figure 5.2.3.1). The relationship between operative temperature and air speed applies to individuals performing activity level corresponding to 1.10 met and with clothing insulation values of 0.5–1.0 clo, and for an environment with humidity rate of 0.10 kg H2O/kg DRY AIR. Further, there is no indication of upper limit to air speed, considering that local control is available and adaptive behaviour is possible to be performed by the occupants.
Several analytical tools and computational models are aimed at assisting on the prediction of thermal sensation indices. Some tools are useful for prompt diagnosis, such as the CBE Thermal Comfort Tool [24]. Conversely, to deal with the complex interaction of the human thermoregulation system with the environment for thermal sensation and environmental analysis in detail, complex computational models which integrate human thermophysiology with computational fluid dynamics (CFD) simulation are indicated. Examples of these models range from the simplified nodal thermoregulatory model proposed by Gagge et al. [25] and modelled in CFD by Murakami et al. [26], the CBR Comfort Model from Huizenga et al. [27] coupled with CFD by Voelker et al. [28], and the IESD-Fiala Model [29,30,31] coupled with CFD by Cropper et al. [32]. With variations, these models consider heat transfer throughout the body layers (such as bones, circulatory system, inner core, muscles, fat, and skin) and the thermal regulatory responses to predict results for skin temperature, radiant temperature, body metabolic rate, sweat moisture production, wetted skin area, evaporation due to skin and respiration, blood flow rates, and the PMV and PPD thermal sensation indexes, in addition to detailed airflow rates, air speed, particle concentration dispersion, convective and radiant heat changes, and qualitative analysis based on the visualization of the results for a given environment. These models require the selection of initial values for metabolic rate based on the activity level, clothing insulation level, and for environmental data for operative temperature, relative humidity, and air speed. With these models, adaptive behaviour could be considered by reducing the informed activity and clothing levels, changing the opening arrangement for natural ventilation, and increasing the air speed simulating the effect of a fan in the environment.
The computational models are useful to evaluate thermal sensation for environments with difficult access to perform continuous field measurements, such as hospitals, operation theatres, penitentiaries, or even residences where the continuous monitoring of field measurement during night-time and on weekends could be inconvenient for the occupants. Further, this method is particularly suitable for investigations related to thermal sensation comprising parametric solutions and varied scenarios, and covering multiple locations in continental-size countries, for which field measurement would be costly and difficult to implement. Conversely, to produce reliable results for airflow rate, air speed and for the prediction of thermal sensation, CFD simulations require both expertise in the execution and validation of results with field measurement or chamber experiments [33,34]. To date there are few studies informing both examples of validation and practical applications of CFD simulations coupled with thermal sensation models to investigate the efficacy of adaptive behaviour for individuals living in tropical hot-humid climates.
2. Objectives
The main objective of this work is to evaluate the effectiveness of a coupled model to predict thermal comfort sensation for occupants of naturally ventilated buildings located in Brazilian tropical warm-humid climatic regions. A secondary objective of this work comprises to test additional parameters to simulate adaptive behaviours with the coupled models and perform an analysis on the impact of each parameter on the calculated results.
To meet the intended objectives, simulations were carried out with transient CFD models coupled with a model of human thermophysiology for the prediction of thermal sensation. The computational coupled models were validated and calibrated with the comparison of calculated results with benchmark values reported in the literature for thermal sensation indices obtained with field measurement and with questionnaires answered by volunteers.
This paper is structured as follows: Section 1 provides an introduction to the research problem; Section 2 states the main objective; Section 3 describes the research method; Section 4 shows the results for the validation exercise and for the potential improvements with adaptive behaviour, and presents a discussion highlighting aspects and practical applications, and the conclusions are presented in Section 5.
3. Methodology
The methodological approach utilized in this work consisted of two stages: a validation exercise (Stage 1) and an analysis for testing adaptive behaviour (Stage 2). A description of each stage and of the parameters analysed for each simulated scenario is shown in Figure 1 (the lists of the scenarios for each stage with detailed setup parameters are provided later in this section). For Stage 1 the validation exercise comprised the comparison of calculated results for dynamic thermal sensation (DTS) and PPD with benchmark values from experimental data for thermal sensation votes (TSV) and unacceptable votes (UV), from surveys with volunteers, and for PMV and PPD, from field measurements, informed in Lamberts and Andreasi [35] and Andreasi, Lamberts and Cândido [36]. The calculated results were obtained with transient CFD simulations coupled with the IESD/Fiala model of human thermophysiology for the prediction of thermal sensation. The experimental results were reported in the referenced literature [35,36] to have been obtained with measured data and questionnaires answered by volunteers from three cities located in Brazilian hot-humid climatic region. For Stage 2, parameters to simulate adaptive behaviour were added to the coupled models to be tested and to identify their efficacy to improve thermal sensation under warm-humid climatic conditions. Before presenting the scenarios considered for each stage, some considerations are shown for the overall setup and quality check for the CFD models, for the thermal sensation model, and for the modelling of virtual ceiling fan.
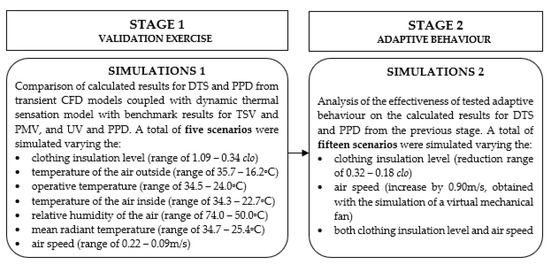
Figure 1.
Schematic representation of the research method and the stages performed for this work.
3.1. Overall Setup and Quality Check for the CFD Simulations
The CFD models utilized in both Stage 1 and Stage 2 were built and meshed with ANSYS ICEM R16.0 [37] and solved with ANSYS CFX R19.1 [38] using a high-performance computing facility. The CFX solves the conservation law equations using the finite volume method from Versteeg and Malalasekera [39]. Simulations were performed in transient mode using small time-steps of 1s for periods of 15 min. The iterative convergence values were set as 1e-05 root mean square (RMS) for residual targets. Satisfactory results are reported for convergence values ranging from three to four orders of magnitude decrease for normalized residuals [34,40,41]. The turbulence model utilized was the Shear Stress Transport (SST). The SST is based on a two-equation for eddy-viscosity (k-ω) solution with automatic near-wall function. When compared with other models, such as the Reynolds-Averaged Navier–Stokes (RANS), the Renormalization Group (RGN), and the Reynolds Stress Model (RSM), several authors report the superior capacity of the SST turbulence model to solve with accuracy and robustness complex fluid dynamics problems, such as the downward vortex produced by a ceiling fan [32,42,43,44,45,46].
The three-dimensional model utilized in this work represents a room with respective dimensions for width, length, and height of 4.0 × 6.0 × 3.0 m, totalizing 24.0 m2 of floor area and 72.0 m3 of internal volume. Meshes were built using unstructured elements combining tetrahedra, pyramids, and wedges with ten layers of prisms added adjacent to all boundaries to accurately model the near-wall heat and mass transfer and to accommodate wall functions. A procedure to verify the grid independence of the solutions and to estimate the averaged numerical uncertainty due to discretization errors was performed: the Fine Grid Convergence Index (GCIfine) method, proposed by Celik et al. [34] and reviewed in Hadjukiewicz et al. [47]. The GCIfine is based on Richardson extrapolation to determine the level of grid independence and its impact on the spatial convergence of a CFD solution [48]. The procedure consists of a statistical comparison of averaged values for key variables (points monitored during the simulations) between three grid solutions, and an example for grid independence check is presented here (Table 1). The results for the calculated GCIfine (Table 2) show that the averaged numerical uncertainty between the coarse Grid 1 and the medium Grid 2 is 1.70%, while between the medium Grid 2 and the fine Grid 3 is 0.4%. This means that the solution for Grid 2 shows considerable reduction on the numerical uncertainty due to discretization errors when compared to Grid 1, but there is no significant improvement when compared with Grid 3. Conversely, the computing time for Grid 2 solutions was 34% smaller than the required for Grid 3 solutions. For this reason, the criteria to create the mesh utilized for Grid 2 was adopted for all CFD models utilized in this work. Further mesh quality check was performed for the Grid 2 utilizing quality criteria described in ANSYS [40,41], and the calculated values were within the required ranges (Table 3). An example of mesh created with the Grid 2 solution and applied to the three-dimensional models utilized in this work is shown in Figure 2. The cross-section of the room illustrates the virtual manikin in a seated position and the ceiling fan (Figure 2a), and the amplified figure shows details of the mesh surrounding the head the virtual manikin (Figure 2b).

Table 1.
Parameters used for the discretization error calculation.
Table 2.
Grid refinement factor and sample calculations of discretization errors and GCIfine [34].
Table 3.
Mesh quality check and quality criteria described in ANSYS [40,41].
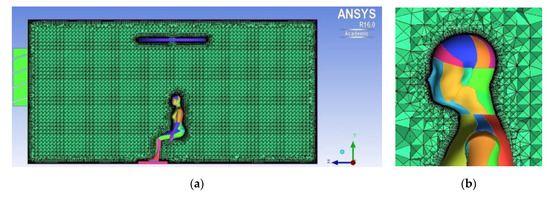
Figure 2.
Example of mesh solution for Grid 2: cross-section with the virtual human manikin on the seated position (a) and detail of the mesh around the body of the virtual manikin (b).
3.2. The Thermal Sensation Model
The computational model for the prediction of thermal comfort sensation utilized in this work is the IESD/Fiala version 1.4.0, a Linux based solver which models the human thermophysiology for the prediction of thermal sensation [16,29,30,31]. This model is named here as “thermal sensation model”. This model runs coupled with the transient CFD simulation and considers the heat transfer throughout the body and with the virtual environment to predict thermoregulatory responses for the passive and the active systems (Figure 3).
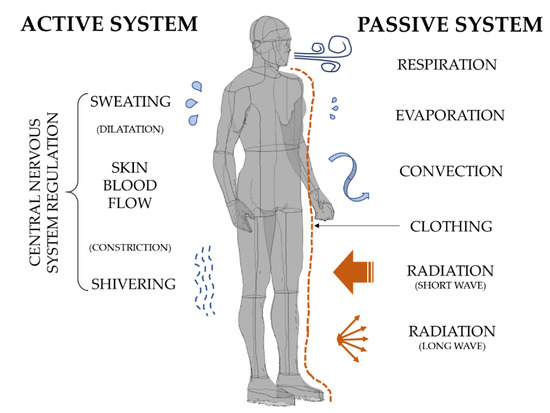
Figure 3.
Schematic diagram showing the human body active and the passive thermoregulation systems considered in the thermal sensation model, based on Fiala et al. [16].
The interaction between the thermal sensation model and the CFD model happens via a virtual manikin and is described in Cropper et al. [32]. During the coupled simulation data is continuously exchanged between both models for pre-established time-steps until the convergence criteria is achieved (Figure 4). The manikin is multi-segmented in 59 parts (for the standing or seated positions) or 50 parts (lying on a horizontal surface). In this work, the manikin on the seated position is utilized for the coupled simulations. Further description for this generic human body considers Dubois-area of 1.86 m2, weight of 73.5 kg with 15% of fat content, basal metabolism of 87 W with basal evaporation from the skin of 18 W, and circulatory capacity of 4.9 L/min [32]. As output, the thermal sensation model informs, in addition to DTS and PPD indices, results for hypothalamus temperature, mean skin temperature, mean radiant temperature, body metabolic rate, sweat moisture production, wetted skin area, evaporation due to skin and respiration, and blood flow rates.
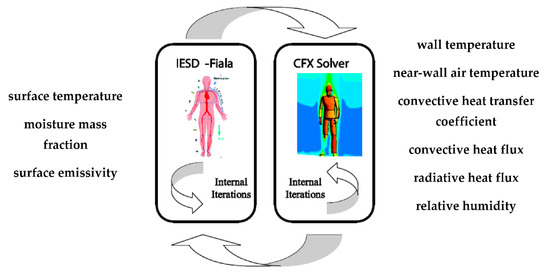
Figure 4.
Schematic diagram showing the data exchanged during the coupled simulation between the CFD model and the thermal sensation model. Source: Cropper et al. [32].
To start the coupled simulation, the user selects from a list of options the garment ensembles and enters initial values for activity level, air relative humidity (RH, in %), air temperature inside (Tinside, in °C), air temperature outside (Toutside, in °C), mean radiant temperature (Tradmean, in °C), and air speed (Vair, in m/s). The options for garment ensembles, and their corresponding estimated clothing insulation values, are the following: nude (0.00 clo), briefs (0.04 clo), summer (0.23 clo), casual (0.43 clo), casual with thin sweater (0.63 clo), casual with thick sweater (0.76 clo), suit (1.00 clo), and winter (1.40 clo). The estimated clothing insulation values were based on a list available in the standard ASHRAE-55 [8] (Table 5.2.2.2B and Table 5.2.2.2C), and no insulation value was added for the chair. The clothing insulation values (Icl, in clo) for each simulated scenario were calculated with the calculated results for mean skin temperature (Tskin,m, in °C), mean clothing surface temperature (Tcl,m, in °C), and overall dry heat loss (HDRY, in W/m2) with the ambient, utilizing Equations (1) and (2) from Havenith et al. [49].
where R is radiant heat loss, C is convective heat loss, M is metabolic rate, W is effective mechanical power, Eres is evaporative respiratory heat loss, Cres—convective respiratory heat loss, E is evaporative heat loss, and S is body heat loss (all terms in W/m2).
Icl = (Tskin,m − Tcl,m)/(0.155 × HDRY)
HDRY = R + C = M − W − Eres − Cres − E − S
The DTS calculated by the IESD/Fiala model is based on the rate of change of the mean skin temperature (dTskin,m/dt, in °C), the body core temperature (G, in °C), and the hypothalamus temperature (Thy, in °C), to drive the body thermoregulation system and define the overall thermal sensation (Equations (3) and (4)) [16].
DTS = 3 tanh{[((0.11 dTskin,m/dt) + 1.91(dTskin,m/ dtmax)e−0.681t)/(1+G)] + M(Tskin,m − 34.4) + G}
G = 7.94 exp [(−0.902/(Thy − 36.6)) + (7.612/(Tskin,m − 38.4))]
Although the mechanisms of heat transfer over the body and within the environment are one, the calculation for the PMV and the PPD thermal sensation indices follow a different approach. These indices are calculated utilizing parameters for the individual characteristics for clothing level and physical activity level and for the environment for air temperature, mean radiant temperature, air speed, and air relative humidity (Equations (5) and (6)) [8,11].
where pa is the water vapour partial pressure (in Pa), ƒcl is cloting surface area factor, and hc is convective heat transfer coefficient (in W/m2 K).
PMV = [0.303 exp(−0.036 M) + 0.028] × {(M − W) − 3.05 × 10⁻³ [5733 − 6.99 (M − W) − pa]
− 0.42 [(M − W) − 58.15] − 1.7 × 10⁻⁵ M (5867 − pa) − 0.0014 M (34 − Tinside)
− 3.96 × 10⁻⁸ ƒcl [(tcl + 273)4 − (Tradmean + 274)4] − ƒcl hc (tcl − Tinside)}
− 0.42 [(M − W) − 58.15] − 1.7 × 10⁻⁵ M (5867 − pa) − 0.0014 M (34 − Tinside)
− 3.96 × 10⁻⁸ ƒcl [(tcl + 273)4 − (Tradmean + 274)4] − ƒcl hc (tcl − Tinside)}
PPD = 10 − 95 exp (−0.03353 PMV4 − 0.2179 PMV2)
In addition to the DTS informed by the coupled simulation, this work utilizes two methods to improve and adjust the calculated PMV indices: the extended model (here identified as DTSe), proposed by Fanger and Toftum [20], and the adjustment model (here identified as DTSa), proposed by Humphreys and Nicol [21]. While the former model utilizes an expectancy factor (e) ranging from 0.5–1.0 according to the climatic region (continuous hot weather or hot season) and type of building (air conditioned, mostly air conditioned, mostly naturally ventilated, or naturally ventilated) (Equation (7)), the latter utilizes environmental and occupant parameters to reduce bias related to discretization, which may result in overestimation of PMV (Equations (8) and (9)).
where DDTS is a dimensionless factor, based on the operative temperature (Toperative, in °C), relative humidity inside, occupant metabolic rate and clothing insulation level, and air temperature outside.
DTSe = e DTS
DTSa = 0.8 (DTS − DDTS)
DDTS = −4.03 + 0.0949Toperative + 0.00584 (RH) + 1.201(met × clo) + 0.000838 (Tair outside)2
3.3. Modelling the Virtual Ceiling Fan
Stage 2 comprised the simulation of transient CFD models to reproduce the air speed and the flow field created by actual mechanical ceiling fan devices. The modelling parameters utilized are described in Babich et al. [44]. In the models utilized for this work, the virtual ceiling fan was modelled with the shape of a flat, hollow cylinder with height 5.0 cm, radius 60.0 cm and centre hole with radius 5.0 cm assigned as an individual body interfacing with the air from the outer domain (Figure 5).
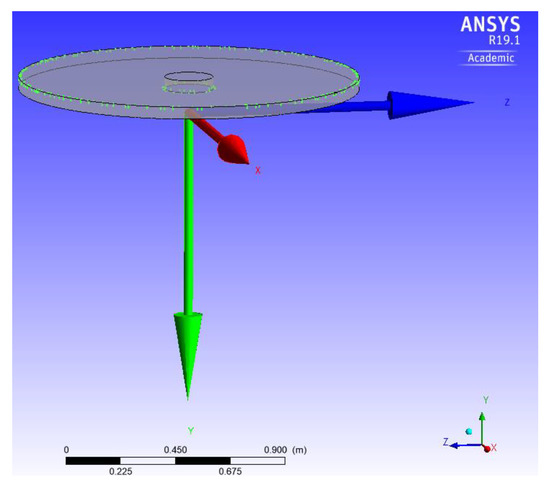
Figure 5.
Schematic representation of a virtual ceiling fan as modelled in the CFD simulations.
To predict the airflow field produced by a ceiling fan with rotational speed equivalent to 290 RPM (rotation per minute of the blades), the respective momentum sources were assigned for the axial, radial and theta components of the flat cylinder: 5.5 kg/m2s2, 0.0 kg/m2s2 and 0.8 kg/m2s2. A test with the selected values shows that the virtual fan predicts an airflow rate of 1.13 m3/s and an air speed of approximately 0.90 m/s monitored in the jet core zone at the vertical axis of the ceiling fan and at 1.0m above the floor. The predicted flow rate is comparable to the flow rate produced by typical three- or four-blades ceiling fans operating at low-speed mode (with electric power of 25 W and efficiency of 0.045 (m3/s)/W) informed in Procel [50], a catalogue for energy consumption efficiency label for ceiling fans available in the Brazilian market. The air movement created by a ceiling fan contributes to reduce the temperature stratification in a room [51] and acts directly on the skin causing cooling thermal sensation with enhanced convection [52]. According to ASHRAE-55 [8], the cooling effect produced with an air speed of 0.90 m/s could maintain a thermal sensation of PMV +0.5 whilst the operative temperature is risen in up to 3.40 °C, for individuals with some local control over the air speed, wearing clothing insulation value of 0.50 clo, and performing an activity level of 1.1 met, as in ASHRAE-55 [8] (Figure 5.3.3.A).
3.4. The Scenarios for the Validation Exercise (Stage 1)
To perform the validation exercise proposed for Stage 1, the boundary conditions for the CFD models reproduced both the ambient conditions (operative temperature, air temperature inside and outside, air relative humidity inside, and air speed) and the occupant conditions (metabolic rate for informed activity levels and clothing insulation levels) for a total of five scenarios for NVB. The scenarios were organized in descending order for operative temperature. The monitored data were reported in the referenced literature [35,36] to have been measured during spring and autumn seasons in three non-residential indoor environments consisting of open-plan rooms occupied by the Brazilian Armed Forces and located in the Brazilian State of Mato Grosso do Sul, characterised by hot-humid climate. The authors reported a comprehensive analysis on thermal sensation. Values for TSV and for occupant’s unacceptable votes (UV), obtained with 1.301 questionnaires, and for PMV and PPD indices, calculated according to ISO standards [10,11,53], were used as benchmark for comparison with the results calculated in this work. The list of the scenarios with the ambient and the occupant setup parameters utilized for the coupled simulations for Stage 1 is given in Table 4.
Table 4.
List of the scenarios with setup parameters for the ambient and for the occupants from the reference [35,36] utilized for the coupled simulations for Stage 1.
The virtual domain for the CFD models reproduced the ambient conditions and the occupants clothing and activity levels. Conversely, the virtual environment was discretized and did not reproduce the actual shapes and physical dimensions of the several rooms from the reported surveys, the ventilation systems, other occupants, furniture, and heat sources which may have happened during the field measurements. An assumption made in this work is that, although the actual thermal sensation is influenced by the whole characteristics of the environment, the PMV and PPD indices for thermal sensation are calculated by analytical models based on the interaction between four ambient conditions and two individual characteristics (refer to Equations (5) and (6)). For this reason, by reproducing the reported ambient conditions and the occupant characteristics in the coupled simulations, it is expected that the comparison of the calculated results for the prediction of thermal sensation will show agreement with the values reported in the referenced literature [35,36].
3.5. The Scenarios for the Application and Test of Adaptive Behaviour (Stage 2)
To simulate and test the effectiveness of the application of suggested adaptive behaviour, the scenarios from Stage 1 had some parameters modified for the simulations performed for Stage 2. Specific sets of simulation were carried out considering, first, the impact with the reduction for the clothing insulation value; second, the impact with the controlled increase of the local air speed; and finally, the impact of both suggested adaptive behaviours applied together. While the first application for adaptive behaviour was based on the selection of garment ensembles with lower clothing insulation level than the utilized for the previous stage, the second application was carried out with the introduction in the model of a virtual ceiling fan to produce controlled air movement and increase forced convective heat loss. Changes for the metabolic rate were not considered since the values utilized for the previous stage were informed in the referenced literature as indicated for the activity level performed by the actual occupants. The list of the scenarios with the ambient and the occupant setup parameters utilized for the coupled simulations for Stage 2 is given in Table 5.
Table 5.
List of the scenarios with the ambient and occupant setup parameters from reference [35,36] and the modified parameters to test adaptive behaviour (Stage 2).
4. Results, Analysis, and Discussion
In this section, the results obtained for the validation exercise (Stage 1) and for the application and test for adaptive behaviour (Stage 2) are presented and analysed and are followed by a discussion about the application of the models to adjust the thermal sensation indices.
4.1. Results for the Validation Exercise (Stage 1)
The results obtained for the validation exercise are presented and analysed here. First, a qualitative analysis for the flow field over the manikin is shown for one scenario, followed by a quantitative analysis for the five scenarios simulated. Then, the comparison between the benchmark values for TSV, PMV, UV, and PPD, from the referenced literature [35,36], with the calculated results for DTS and PPD, from the CFD simulations coupled with thermal sensation model, is provided. Further, results for the adjusted thermal sensation (DTSa) and from the extended thermal sensation (DTSe), calculated with the DTS, are also brought to the comparison in this section.
The qualitative analysis for the selected scenario 2 (Figure 6) reveals that the flow field around the manikin resulted in low mean air speed (0.12 m/s) which is similar to the value reported for this scenario (0.15 m/s). A vertical plume of hot air developed on the vertical axis above the seated manikin, being slightly disturbed by local flow near the ceiling. The flow throughout the window clearly indicates a buoyancy-driven pattern. The calculated operative temperature was equal to the informed: 33.3 °C. The clothing insulation value calculated with the resulting environmental conditions, the manikin mean skin temperature and moisture production and based on the selected option of garment ensemble (casual) was 0.46 clo, while the value informed for this scenario was 0.34 clo. As shown later in this section, the respective thermal sensation indices from the referenced literature (TSV) and from the coupled simulation (DTS) for this scenario were identical (+2) or very close, if showed with one decimal place (+1.9 and +1.8), defining warm thermal sensation.
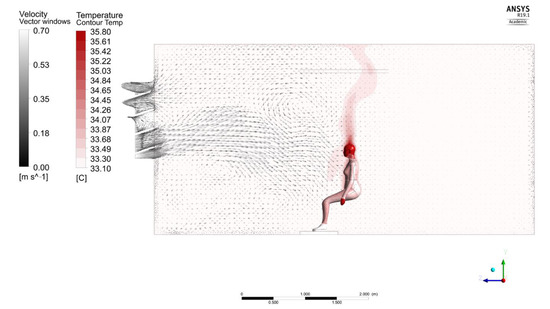
Figure 6.
Flow field, air speed, air temperature and surface temperature on the manikin (scenario 2).
The calculated operative temperature, air speed, and clothing insulation values for the five scenarios simulated for Stage 1, and the respective measured values, are shown in Table 6. The comparison for the values for operative temperature showed an average variation of ±0.30 °C and a maximum variation of 0.60 °C (scenario 5). The values for air speed showed an average variation of ±0.07 m/s and a maximum variation of 0.14 m/s (scenario 3), and the updated values for clothing insulation were close to the ones in the reference, with an average variation of ±0.09 clo and a maximum variation of 0.13 clo (scenario 5). In terms of percentual variation between the calculated results and the reference values, the respective averaged percentages for operative temperature, air speed, and clothing insulation were: ±1%, ±111% and ±15%. While for operative temperature and clothing insulation the percentages were low, the high percentual variation for air speed could reside in two facts: the overall speeds informed were all lower than 0.22 m/s, and a difference of 0.10 m/s could imply twofold results; the values informed in the referenced literature suggested one measurement with undisclosed position, while the results from the CFD simulation refer to the averaged values based on the global range of speed for the environment.
Table 6.
Measured values from the reference [35,36] and calculated results (CFD) for air temperature inside, air speed, and clothing insulation level for Stage 1.
The benchmark values for TSV and PMV [35,36] and the calculated values for DTS, DTSa, and DTSe, from the CFD simulations, are shown in Table 7. The results for DTSa were calculated based on the DTS utilizing adjustment equations [21] (refer to Equations (7) and (8)), and the results for DTSe were calculated utilizing expectancy factors [20] (refer to Equation (9)). In this work, the results for thermal sensation indices are shown with one decimal place to give more precision to the analysis. As described in Lamberts and Andreasi [35] and Andreasi, Lamberts, and Cândido [36], divergences were observed between the TSV and the PMV indices, with the former index overestimating hot sensation. For scenario 1, a difference of 1.6 was informed between the TSV and the PMV indices. For this same scenario, the divergence between the TSV and the calculated DTS was 0.6, and this was the highest difference found between these two indices. Further, all the calculated results for DTS felt between the values for the voted TSV and the measured PMV, being closer to the latter ones. On average, the difference found between the TSV and the DTS values was of ±0.3. Identical values, or the nearest values, were found between the voted TSV and the calculated dynamic thermal sensation with DTSe = 0.7 for scenario 1, DTS for scenario 2, DTSe = 0.9 for scenario 3, DTSe = 0.6 for scenario 4, and DTSa for scenario 5. The extended moderate expectancy factors for the DTSe ranging from 0.9–0.7 were suggested for NVBs located in regions with warm summer season [20], which agrees with the description of the locations of the buildings mentioned in the referenced literature. Conversely, there were no identical values between the informed PMV and the calculated DTS. On average, the difference found between the PMV and the DTS values was of 0.7.
Table 7.
Thermal sensation for the five scenarios for Stage 1: benchmark values for TSV and PMV from the reference [35,36], calculated results (CFD) for DTS, adjusted results (DTSa) [21], and expanded results (DTSe) utilizing five expectancy factors [20].
The comparison of the PPDDTS (based on the DTS) with the benchmark values for unsatisfied votes (UV) and for the PPDPMV (based on the PMV) [35,36] showed the same trend described for the thermal sensation (Figure 7). The PPDPMV were overestimated (reaching almost 100% of dissatisfied for two scenarios) and greater than both the percentages informed for UV and for PPDDTS in four out of five scenarios analysed: The exception was the scenario 5, for the lowest operative temperature. The PPDDTS were close to the UV in four out of five scenarios, showing an average variation of 9%.
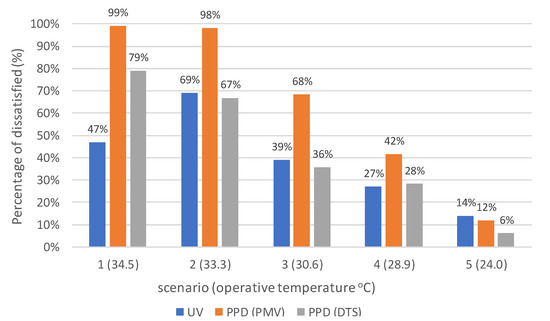
Figure 7.
Percentages of UV (unaccepted votes) and PPD (calculated with the results for PMV), from the benchmark values [35,36], and for PPD (calculated with the results for DTS), from the coupled simulations, for five scenarios in Stage 1.
A statistical analysis was carried out to quantify the correlation strength between the benchmark values and the calculated results, utilizing the correlation coefficient (r) and the coefficient of determination (R2) measurements. These measurements identify the statistical strenght based on the linear association between either two series of data with the same metric or a serie of data compared to an independent variable [54]. The significance value is provided in a scale ranging from +1.00 (perfect correlation) to −1.00 (reverse correlation), on which zero means absence of correlation [55]. The comparison of the benchmark values for TSV with the informed PMV and with the calculated results for DTS, DTSa, and DTSe for five expectancy factors (Figure 8) shows that the highest correlation values were found for the DTSa (R2 = 0.95 and r = 0.97), while the lowest correlation values were found for the PMV (R2 = 0.88 and r = 0.94). The comparison of the values for thermal sensation (benchmark values for TSV and PMV and calculated values for DTS, DTSa, and DTSe) with the respective operative temperatures utilized as an independent variable (Figure 9) shows that the correlation values for DTS (R2 = 0.989 and r = 0.994) were marginally higher than those for TSV (R2 = 0.917 and r = 0.958), and the lowest correlation was found for the PMV (R2 = 0.961 and r = 0.980). Further statistical analysis was carried out to identify which of the calculated values for the predicted thermal sensation (DTS, DTSa, and DTSe for five expectancy factors) shows the strongest statistical agreement with the benchmark value for the voted thermal sensation (TSV) (Table 8). In addition to the standard deviation, the correlation coefficient and the coefficients of determination, other five methods were utilized: the Mean Bias Error (MBE), the Normalized Mean Bias Error (NMBE), the Root Mean Square Error (RMSE), and the Coefficient of Variation of the Root Mean Square Error (CVRMSE). The results were also compared with calibration criteria from ASHRAE Guideline 14 [56] and from the International Performance Measurement and Verification Protocol (IPMVP) [57]. The analysis of the results showed that, when compared with the benchmark values for TSV, the prediction for the dynamic thermal sensation utilizing the extended expectancy factor of 0.8 (DTSe = 0.8) presented the highest statistical strength for five out of six criteria, and this demonstrates that the best adjustment for the calculated thermal sensation was achieved for a moderate expectancy factor [20].
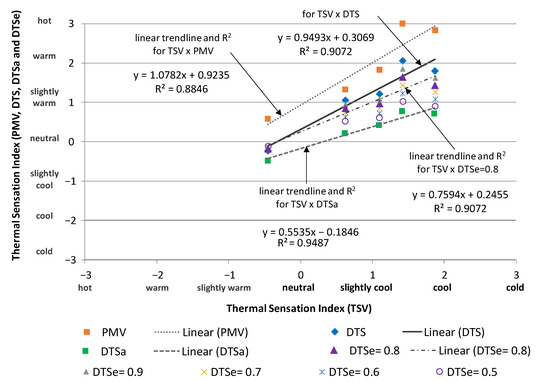
Figure 8.
Comparison of the benchmark values for TSV with the PMV, from the reference [35,36], and with the calculated results for DTS, DTSa, and DTSe, from the coupled simulations for Stage 1.
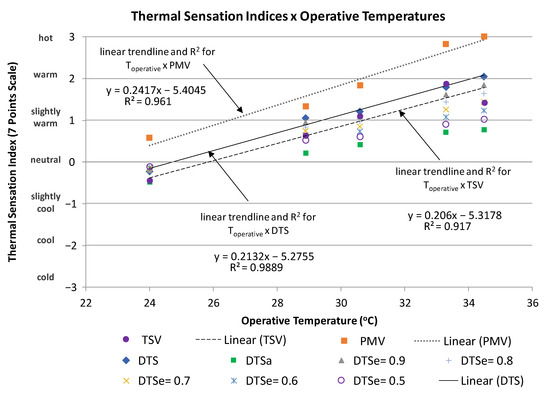
Figure 9.
Comparison of the values for operative temperature with the benchmark values for TSV and PMV, from the reference [35,36], and with calculated results for DTS, DTSa, and DTSe, from the coupled simulations for Stage 1.
Table 8.
Statistical strength between the benchmark values for TSV, from the reference [35,36], with the PMV values, also from the reference, and with the calculated results for DTS, DTSa, and DTSe, from the coupled simulations for Stage 1, for eight criteria of quantitative analysis.
To conclude, the calculated results for Stage 1 for dynamic thermal sensation and for predicted percentage of dissatisfied showed good agreement with the voted thermal sensation indices from the referenced literature, demonstrating that the thermal sensation model predicts well thermal sensation. The level of agreement was improved after extending the DTS values with a moderate expectancy factor ranging from 0.9–0.7, category suggested for NVBs located in regions with warm summer season [20].
4.2. Results for the Application and Test for Adaptive Behaviour (Stage 2)
In this section, the results obtained for the testing of adaptive behaviours with the coupled simulation models are presented and analysed. The objective was to identify and quantify potential reduction on the thermal sensation indices calculated in the previous stage. The coupled simulations performed for Stage 2 considered the reduction in the clothing insulation value, the increase in the air speed, and both actions combined. The calculated results for Stage 2 are presented for DTS (Figure 10) and the respective PPD (Figure 11), and for DTSe utilizing an expectancy factor of 0.8 (Figure 12), to best fit to indoor environments for NVBs located in regions with warm summer season, and the respective PPD (Figure 13). Further, an analysis is provided comparing ambient temperature, body temperature, and body moisture production with the tested adaptive behaviours for the five scenarios covered in Stage 2 (Figure 14).
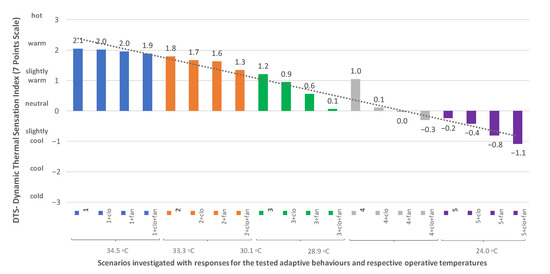
Figure 10.
Results for the DTS index with the three variants for suggested adaptive behaviours: reduction in the clothing insulation value, increase in the air speed, and both actions.
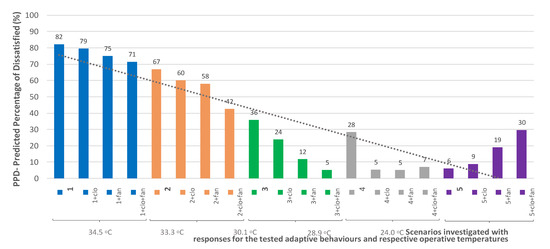
Figure 11.
Results for PPD based on the DTS for three suggested adaptive behaviours: reduced clothing value, increased air speed, and both actions.
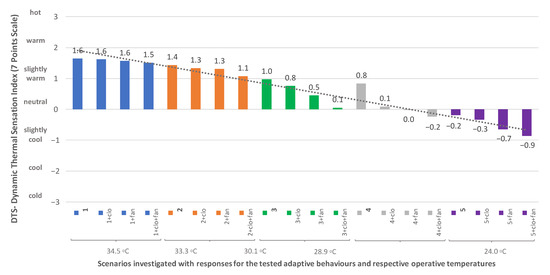
Figure 12.
Results for the extended DTSe with moderate expectancy factor of 0.8 [20] for three suggested adaptive behaviours: reduced clothing value, increased air speed, and both actions.
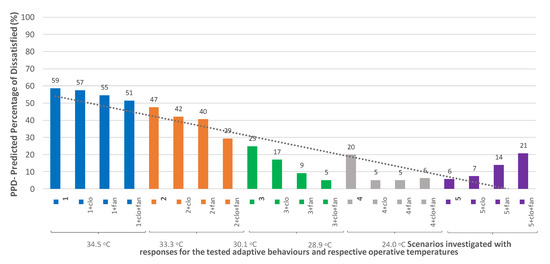
Figure 13.
Results for PPD based on the extended DTSe with moderate expectancy factor of 0.8 [20] for three tested adaptive behaviours: reduced clothing value, increased air speed, and both actions.
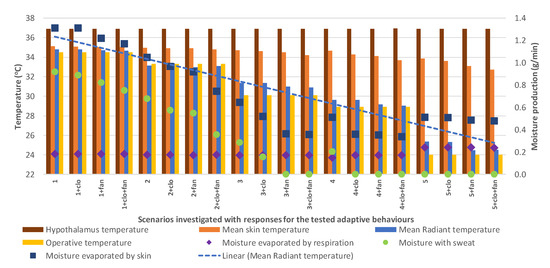
Figure 14.
Initial results for five scenarios analysed and the corresponding results based on three suggested adaptive behaviours (reduced clothing value, increased air speed, and both actions) for operative temperature, hypothalamus temperature, mean skin temperature, mean radiant temperature, sweat, and moisture evaporated by respiration and by the skin.
The reduction in the clothing insulation level was achieved selecting different garment ensembles from the available options (refer to Section 3.2—The thermal sensation model—for details). The change from casual (with an averaged value of 0.46 clo) to summer (with an averaged value of 0.21 clo), resulted on an averaged decrease in the clothing insulation level of 0.25 clo, which was applied to scenarios 1, 2 and 3 (with respective operative temperatures of 34.5, 33.3, and 30.1 °C). The respective reductions on the DTS for these three scenarios were nil, −0.1, and −0.3, with similar reductions observed for DTSe. The respective reductions in terms of PPD were 3% for scenario 1, 7% for scenario 2, and 12% for scenario 3, based on DTS results, and 2% for scenario 1, 5% for scenario 2, and 8% for scenario 3, based on the extended DTSe results. The change from “casual with thin sweater” (with an averaged value of 0.64 clo) to “casual” resulted in an averaged decrease of 0.18 clo and was applied to scenario 4 (operative temperature of 28.9 °C), decreasing the DTS in 0.9 and the PPD in 23%. For the DTSe, the respective decreases were 0.7 and 15%. The change from casual with thick sweater (with an averaged value of 0.94 clo) to casual with thin sweater reduced the clo in 0.32. When applied to scenario 5 (operative temperature of 24.0 °C), the reduction in the clothing value decreased the DTS in 0.2 and increased the PPD in 3%, while for the DTSe the respective values were decrease of 0.1 and increase of 1%.
The increase of 0.9 m/s in the air speed (refer to Section 3.3—Modelling the virtual ceiling fan—for details), decreased the DTS in −0.1, −0.2, −0.6, −1.0, and −0.6 (for DTS) and in nil, −0.1, −0.5, −0.8, and −0.5 (for DTSe) for the respective scenarios 1, 2, 3, 4, and 5. In terms of PPD, the respective reductions in the percentages were 7%, 9%, 24%, and 23%, with increase of 13% on the PPD for the scenario 5 (for DTS) and 4%, 7%, 20%, and 15%, with increase of 8% on the PPD for the scenario 5 (for DTSe).
The combined test for the reduction in the clothing insulation level and the increase in the air speed decreased the predicted DTS indices from a minimum of 0.3 (from +2.1 to +1.9) for scenario 1 to a maximum of 1.3 (from +1.0 to −0.3) for scenario 4, whose respective operative temperatures were 34.5 and 28.9 °C. For the extended DTSe values, the respective decreases were smaller: 0.1 (from +1.6 to +1.5) for scenario 1 and 1.2 (from +1.0 to −0.2) for scenario 4. For scenario 5, the slightly cold thermal sensation was increased from −0.2 to −1.1 for DTS and from −0.2 to −0.9 for DTSe. For the PPD based on the DTS, the smallest and greatest decreases found were of 11% (scenario 1) and of 31% (scenario 3), and for scenario 5 the PPD increased from 6% to 30%. For the PPD index based on the extended DTSe, the respective smallest and greatest decreases found were 1% (scenario 1) and 20% (scenario 3), while an increase of dissatisfied occupants of 15% was noticed for scenario 5.
The variation for the body hypothalamus temperature, mean skin temperature, the mean radiant temperature, and the body moisture production, with the tested adaptive behaviours and for the operative temperatures utilized in each scenario covered for Stage 2 is shown in Figure 13. Variations on the hypothalamus temperature, responsible for triggering the human body active thermoregulation responses for sweating, ranged between 36.92–36.88 °C. Conversely, a wide range was found for the perimetral body temperatures among the investigated scenarios: 35.5–32.7 °C for the mean skin temperature and 34.8–24.5 °C for the mean radiant temperature. The decrease noticed for the body moisture production with sweat was of up to threefold and in the moisture evaporated by the skin was of up to fivefold. A trendline characterized by a descending diagonal shows how the combination of the progressive reduction in the operative temperature and adoption of the suggested adaptive behaviours act on the switch from warm to slightly cool thermal sensation throughout the five scenarios investigated. The values for scenario 1 showed the highest mean skin temperature and mean radiant temperature, with the highest moisture production by sweating and evaporation via skin and respiration, with little variation in the body temperature and moisture production for any of the tested adaptive behaviours. The decrease in the clothing level (0.25 clo) and the increase in the air speed (0.9 m/s, applied for the five scenarios) did little to alleviate the warm thermal sensation predicted for this scenario, with operative temperature of 34.5 °C. For scenarios 3 and 4, the respective operative temperatures and reduction in the clothing level were 30.1 and 28.9 °C, and 0.25 and 0.18 clo. The mean skin temperature and mean radiant temperature were both reduced in 0.5 °C for scenario 3, and respectively in 1.0 and 0.6 °C, for scenario 4. The moisture production evaporated via the skin reached the lowest level and the moisture production with sweat ceased. For these same scenarios, the resulting DTS was reduced from slightly warm to neutral thermal sensation. When compared to scenario 4, moisture production evaporated by respiration and evaporated by the skin increased for scenario 5, whilst no sweat was perceived and body skin and radiant temperatures and ambient operative temperatures were respectively reduced by 1.0, 4.5, and 4.9 °C. The respective operative temperature and reduction in the clothing lever for scenario 5 were 24.0 °C and 0.32 clo. This may have happened because the body thermoregulation active system increased skin moisture to compensate faster evaporation due to both forced convection and moisture adjustment for an environment delivering slightly cool thermal sensation [58]. In conclusion, the results presented in this section demonstrate that the actions taken for the application of adaptive behaviours allowed to quantify the potential and the effectiveness for each suggested adaptation.
4.3. Discussion about the Application of the Models to Adjust Thermal Sensation Indices
The results for DTS calculated with the coupled simulation for both Stage 1 and Stage 2 were adjusted utilizing two methods from the literature: the expectancy factor (DTSe), proposed by Fanger and Toftum [20], and the adjustment model (DTSa) proposed by Humphreys and Nicol [21]. While the latter model utilizes expectancy factors to extend the thermal sensation based on the climate (hot weather seasonal or constant) and type of building operation (predominantly NVB or HVAC), the former model proposes adjustments to reduce the effect of discretization which could imply in overestimation of hot thermal sensation (for further detail refer to Section 3.2—The thermal sensation model). Therefore, the application of one model would not exclude the other since their theories are grounded and approach different subjects to enhance the predicted thermal sensation. Conversely, if both models were applied together, a given thermal sensation index could be reduced to 30–10% of its initial value. For example, the calculated DTS with the coupled simulation for scenario 1 was of +2.1. The benchmark value from the referenced literature for this scenario was TSV= +1.4. With the application of these models individually, the calculated thermal sensation would become: +0.8, for DTSa, and +1.4, for DTSe (for low expectancy factor of 0.7). For the combined application of these models, the resulting thermal sensation would be +0.5, representing 26% of initial value for the DTS.
5. Conclusions
The objectives of this work were (i) to perform an analysis on thermal sensation for occupants of non-residential naturally ventilated buildings located in Brazilian tropical warm-humid climatic region utilizing as research method transient computational fluid dynamics (CFD) simulation coupled with a dynamic human thermophysiology model for the prediction of thermal sensation, and (ii) to test additional parameters to simulate adaptive behaviours and analyse their impact on the results and their effectiveness to mitigate warm and slightly-warm thermal sensations.
Computational simulations were validated with the comparison of calculated results for dynamic thermal sensation (DTS) and predicted percentage of dissatisfied (PPD) with benchmark results from literature [35,36] for thermal sensation votes (TSV) and unacceptable votes (UV), from surveys, and for predicted mean vote (PMV) and PPD, from field measurements and calculated according to ISO standards [10,11,12].
The comparison of the calculated results with the benchmark values showed that the calculated DTS agreed more with the TSV than with the PMV. The same value with one decimal place for TSV and DTS was observed for one scenario out of five analysed. The same values were also found between the TSV and the adjusted dynamic thermal sensation (DTSa) for one scenario and for three scenarios for TSV and the extended dynamic thermal sensation (DTSe) when utilizing a moderate expectancy factor ranging from 0.9–0.7. No similar values were found between the measured PMV and the calculated DTS, the adjusted DTSa, or the extended DTSe and the measured PMV values.
The application and test of adaptive behaviours for the five validated scenarios allowed to quantify the effectiveness of each solution in the reductions of warm thermal sensation. The simulated adaptive behaviours consisted in the reduction the clothing insulation value range of 0.18–0.32 clo, the increase in the air speed of 0.9m/s introducing a virtual ceiling fan in the 3D models, and the combined application of both suggestions. Operative temperatures spanned 34.5–24.0 °C.
The single test for the reduction of the clothing values resulted in decreases for the DTS ranging from 0.1 to 0.9 and for the PPD from 3% to 23%. The single test for the increase in the air speed resulted in decreases for the DTS ranging from 0.1 to 1.0 and for the PPD from 7% to 24%. The combined application of both tested adaptive behaviours resulted in decreases for the DTS from 0.1 to 1.3 and the PPD from 9% to 31%.
The most efficient results happened for the scenario with operative temperature of 28.9 °C, for which the thermal sensation changed from slightly warm to neutral. The reduction in the clothing values, the increase in the air speed, and the combination of both resulted in the respective reductions in the DTS of 0.9, 1.0, and 1.3, and in the PPD of 23%, 23%, and 21%, which show that the effect on the thermal sensation observed with the tests individually was not summed when they were tested together. Further, the PPD increased in 2% for the tests combined. For the scenario with operative temperature of 24.0 °C, the tested adaptive behaviours increased the PPD from 6% to 30% and changed the thermal sensation from neutral to slightly cool. The least efficient results happened for the scenario with operative temperature of 34.5 °C, for which the thermal sensation was maintained as warm regardless the tested adaptive behaviours.
The combined application for the tested adaptive behaviours resulted in a wide range on the perimetral body temperatures and affected the body moisture production: The mean skin temperature range was 35.5–32.7 °C; the mean radiant temperature range was 34.8–24.5 °C; the body sweat production was reduced in up to three times, and the evaporation by the skin by up to five times.
The discussion raised aspects related to the selection of existing models to improve the calculated DTS either by utilizing adjustment equations to reduce bias on the values or by extending the values with factors which are more suitable to specific building operation and climatic condition.
In conclusion, this work evaluated the capacity of a computational coupled model to predict thermal sensation for occupants of naturally ventilated buildings in warm-humid regions and tested the effectiveness of tested adaptive behaviours in the calculated indices. This method could be particularly suitable for investigations related to thermal sensation comprising varied design solutions and multiple locations in continental-size countries which have large territories located in tropical zones and for which field measurement would be unfeasible.
Author Contributions
Conceptualization, L.C.d.F.; methodology, L.C.d.F.; software and validation, L.C.d.F.; writing—daft and editing, L.C.d.F.; writing—review, L.C.d.F., M.A.R., and L.S.F.P.; supervision, M.A.R.; project administration, L.C.d.F. All authors have read and agreed to the published version of the manuscript.
Funding
This research received no external funding.
Informed Consent Statement
Not applicable.
Acknowledgments
This work is part of the postdoctoral research: “Natural Ventilation and Thermal Comfort for Brazilian Residences”, performed at the School of Architecture and Urbanism at São Paulo University (FAU USP), Brazil. The researchers would like to express their gratitude to the Institute of Energy and Sustainable Development (IESD) at De Montfort University, UK, which developed the IESD/Fiala model, and to Doctor Paul Cropper, Research Associate from the School of Architecture, Building & Civil Engineering (SABCE) at Loughborough University, UK, for the support with the transient CFD simulations coupled with the IESD/Fiala.
Conflicts of Interest
The authors declare no conflict of interest.
References
- United Nations Department of Economic and Social Affairs Population Dynamics. Available online: https://population.un.org/wpp/ (accessed on 28 January 2019).
- UN. United Nations Population Division World Urbanization Prospects: The 2018 Re-Vision. 2018. Available online: https://population.un.org/wup/ (accessed on 9 May 2020).
- Beck, H.E.; Zimmermann, N.E.; McVicar, T.R.; Vergopolan, N.; Berg, A.; Wood, E.F. Present and future Köppen-Geiger climate classification maps at 1-km resolution. Sci. Data 2018, 5, 180214. [Google Scholar] [CrossRef] [PubMed]
- OECD/IEA. The Future of Cooling. Opportunities for Energy-Efficient Air Conditioning. Organisation for Economic Co-operation and Development. International Energy Agency. Available online: http://www.iea.org/publications/freepublication/The_Future_of_Cooling.pdf (accessed on 22 May 2018).
- WEF. Resuming Operations and Business Activity Post-COVID-19. Advanced Manufacturing Action Group. World Economic Forum-WEF Briefing Paper in Collaboration with McKinsey. Available online: http://www3.weforum.org/docs/WEF_Resuming_operations_and_business_activity_post_COVID19.pdf (accessed on 3 July 2020).
- Givoni, B. Climate Considerations in Building and Urban Design, 1st ed.; John Wiley & Sons: Hoboken, NJ, USA, 1998; ISBN -13 978-0471291770. [Google Scholar]
- Awbi, H.B. Ventilation of Buildings, 2nd ed.; Spon Press: London, UK, 2003; ISBN 9780419210801. [Google Scholar]
- ASHRAE. ASHRAE/ANSI Standard-55. Thermal Environmental Conditions for Human Occupancy; American Society of Heating and Air-Conditioning Engineers: Atlanta, GA, USA, 2017; ISSN 1041-2336. [Google Scholar]
- Fanger, P.O. Thermal Comfort; Danish Technical Press: Copenhagen, Denmark, 1970; ISBN 9780070199156. [Google Scholar]
- ISO 7726. Ergonomics of the Thermal Environment—Instruments for Measuring Physical Quantities; International Standard Organization: Geneva, Switzerland, 1998. [Google Scholar]
- ISO 7730. Ergonomics of the Thermal Environment—Analytical Determination and Interpretation of Thermal Comfort Using Calculation of the PMV and PPD Indices and Local Thermal Comfort Criteria; International Standard Organization: Geneva, Switzerland, 2005. [Google Scholar]
- prEN 15251 CEN/TC 156. Criteria for the Indoor Environment Including Thermal, Indoor Air Quality, Light, and Noise; Version 2.1c.; European Standard: Brussels, Belgium, 2005. [Google Scholar]
- De Dear, R.; Brager, G.S.; Cooper, D. Developing an Adaptive Model of Thermal Comfort and Preference. ASHRAE 1997. RP-884 Final Report. Available online: https://escholarship.org/uc/item/4qq2p9c6 (accessed on 18 September 2020).
- De Dear, R.J.; Brager, G.S. Thermal comfort in naturally ventilated buildings: Revisions to ASHRAE Standard 55. Energy Build. 2002, 34, 549–561. [Google Scholar] [CrossRef]
- Höppe, P. Different aspects of assessing indoor and outdoor thermal comfort. Energy Build. 2002, 34, 661–665. [Google Scholar] [CrossRef]
- Fiala, D. Physiological modeling for technical clinical and research applications. Front. Biosci. 2010, 2, 939–968. [Google Scholar] [CrossRef]
- Scheatzle, D.G.; Wu, H.; Yellott, J. Extending the summer comfort envelope with ceiling fans in hot arid climates. ASHRAE Trans. 1989, 95, 269–280. [Google Scholar]
- Mallick, F.H. Thermal comfort and building design in the tropical climates. Energy Build. 1996, 23, 161–167. [Google Scholar] [CrossRef]
- Indraganti, M. Behavioural adaptation and the use of environmental controls in summer for thermal comfort in apartments in India. Energy Build. 2010, 42, 1019–1025. [Google Scholar] [CrossRef]
- Fanger, P.O.; Toftum, J. Extension of the PMV model to non-air-conditioned buildings in warm climates. Energy Build. 2002, 34, 533–536. [Google Scholar] [CrossRef]
- Humphreys, M.A.; Nicol, J.F. The validity of ISO-PMV for predicting comfort votes in every-day thermal environments. Energy Build. 2002, 34, 667–684. [Google Scholar] [CrossRef]
- Professional Standard of the People’s Republic of China. Evaluation Standard for Indoor Thermal Environment in Civil Buildings; GB/T 50785-2012; China Building Industry Press: Beijing, China; Ministry of Housing and Urban-Rural Development: Beijing, China, 2012. [Google Scholar]
- Manu, S.; Shukla, Y.; Rawal, R.; Thomas, L.E.; De Dear, R. Field studies of thermal comfort across multiple climate zones for the subcontinent: India Model for Adaptive Comfort (IMAC). Build. Environ. 2016, 98, 55–70. [Google Scholar] [CrossRef]
- Tartarini, F.; Schiavon, S.; Cheung, T.; Hoyt, T. CBE Thermal Comfort Tool: Online tool for thermal comfort calculations and visualizations. SoftwareX 2020, 12, 100563. [Google Scholar] [CrossRef]
- Gagge, A.; Stolwijk, J.; Hardy, J. Comfort and thermal sensations and associated physiological responses at various ambient temperatures. Environ. Res. 1967, 1, 1–20. [Google Scholar] [CrossRef]
- Murakami, S.; Kato, S.; Zeng, J. Numerical thermoregulation-model JOS for evaluation of thermal comfort. In Proceedings of the Roomvent 2007: SANVAC, Helsinki, Finland, 13–15 June 2007. [Google Scholar]
- Huizenga, C.; Hui, Z.; Arens, E. A model of human physiology and comfort for assessing complex thermal environments. Build. Environ. 2001, 36, 691–699. [Google Scholar] [CrossRef]
- Völker, C.; Alsaad, H. Simulating the human body’s microclimate using automatic coupling of CFD and an advanced thermoregulation model. Indoor Air 2018, 28, 415–425. [Google Scholar] [CrossRef]
- Fiala, D. Dynamic Simulation of Human Heat Transfer and Thermal Comfort. Ph.D. Thesis, De Montfort University, Leicester, UK, 1998. [Google Scholar]
- Fiala, D.; Lomas, K.; Stohrer, M. Computer prediction of human thermoregulatory and temperature responses to a wide range of environmental conditions. Int. J. Biometeorol. 2001, 45, 143–159. [Google Scholar] [CrossRef]
- Fiala, D.; Lomas, K.; Stohrer, M. First Principles Modeling of Thermal Sensation Responses in Steady-State and Transient Conditions. ASHRAE Trans. 2003, 109, 179. [Google Scholar]
- Cropper, P.C.; Yang, T.; Cook, M.; Fiala, D.; Yousaf, R. Coupling a model of human thermoregulation with computational fluid dynamics for predicting human–environment interaction. J. Build. Perform. Simul. 2010, 3, 233–243. [Google Scholar] [CrossRef]
- Franke, J.; Hellsten, A.; Schlünzen, H.; Carissimo, B. Best Practice Guideline for the CFD Simulation of Flows in the Urban Environment. COST Action 732. Quality Assurance and Improvement of Microscale Meteorological Models; Meteorological Institute: Hamburg, Germany, 2007; ISBN 3-00-018312-4. [Google Scholar] [CrossRef]
- Celik, I.B.; Ghia, U.; Roache, P.J.; Freitas, C.J.; Coleman, H.; Raad, P.E. Procedure for Estimation and Reporting of Uncertainty Due to Discretization in CFD Applications. J. Fluids Eng. 2008, 130, 078001. [Google Scholar] [CrossRef]
- Lamberts, R.; Andreasi, W.A. Thermal Comfort in Buildings Located in Regions of Hot and Humid Climate of Brazil. Laboratory of Energy Efficiency in Buildings, LABEEE. UFSC. 2009. Available online: https://www.researchgate.net/publication/242253258_Thermal_comfort_in_buildings_located_in_regions_of_hot_and_humid_climate_of_Brazil/references (accessed on 10 May 2020).
- Andreasi, W.A.; Lamberts, R.; Candido, C. Thermal acceptability assessment in buildings located in hot and humid regions in Brazil. Build. Environ. 2010, 45, 1225–1232. [Google Scholar] [CrossRef]
- ANSYS ICEM CFD R16.0. ANSYS, Inc. Available online: www.ansys.com/ (accessed on 26 March 2018).
- ANSYS CFX R19.1. ANSYS, Inc. Available online: https://www.ansys.com/products/fluids/ansys-cfx (accessed on 26 March 2018).
- Versteeg, H.K.; Malalasekera, W. An Introduction to Computational Fluid Dynamics—The Finite Volume Model, 2nd ed.; Pearson: London, UK, 2007; ISBN 978-0-13-127498-3. [Google Scholar]
- ANSYS, Inc. Lecture 7: Mesh Quality & Advanced Topics. Introduction to ANSYS Meshing. 15.0 Release. 2015. Available online: www.ansys.com/ (accessed on 20 June 2020).
- ANSYS, Inc. Lecture 5: Prism Meshing. Introduction to ANSYS ICEM CFD. 14.0 Release. 2012. Available online: www.ansys.com/ (accessed on 20 June 2020).
- Streblow, R. Thermal Sensation and Comfort Model for Inhomogeneous Indoor Environments. Ph.D. Thesis, Aachen University, Aachen, Germany, 28 May 2010. [Google Scholar]
- Peren, J.I.; Van Hooff, T.; Leite, B.; Blocken, B. CFD simulation of wind-driven upward cross ventilation and its enhancement in long buildings: Impact of single-span versus double-span leeward sawtooth roof and opening ratio. Build. Environ. 2016, 96, 142–156. [Google Scholar] [CrossRef]
- Babich, F.; Cook, M.; Loveday, D.; Cropper, P. Numerical Modelling of Thermal Comfort in Non-Uniform Environments Using Real-time Coupled Simulation Models. Proc. Build. Simul. Optim. 2016, 4–11. Available online: https://hdl.handle.net/2134/22632 (accessed on 2 November 2019).
- Babich, F.; Cook, M.J.; Loveday, D.; Rawal, R.; Shukla, Y. Transient three-dimensional CFD modelling of ceiling fans. Build. Environ. 2017, 123, 37–49. [Google Scholar] [CrossRef]
- Sabatino, R. A Coupled CFD and Thermoregulation Model to Evaluate Thermal Comfort Criteria in Asymmetrical Thermal Environments Created by Ceiling Fan Heating Systems. Ph.D. Thesis, Università degli Studi di Salerno, Fisciano, Italy, 2018. [Google Scholar]
- Hajdukiewicz, M.; Geron, M.; Keane, M.M. Formal calibration methodology for CFD models of naturally ventilated indoor environments. Build. Environ. 2013, 59, 290–302. [Google Scholar] [CrossRef]
- Roache, P.J. Quantification of Uncertainty in Computational Fluid Dynamics. Annu. Rev. Fluid Mech. 1997, 29, 123–160. [Google Scholar] [CrossRef]
- Havenith, G.; Heus, R.; Lotens, W.A. Resultant clothing insulation: A function of body movement, posture, wind, clothing fit and ensemble thickness. Ergonomics 1990, 33, 67–84. [Google Scholar] [CrossRef]
- Procel. Ventiladores de Teto.Selo Procel: Programa Nacional de Conservação de Energia Elétrica. Centro Brasileiro de Informação de Eficiência Energética. Eletrobrás. 6 August 2019. Available online: http://www.procelinfo.com.br/ (accessed on 22 October 2019).
- Santamouris, M. Ventilation for Comfort and Cooling: The State of the Art. In Building Ventilation: The State-of-the-Art; Santamouris, M., Wouters, P., Eds.; Earthscan: London, UK, 2007; pp. 217–246. [Google Scholar] [CrossRef]
- Chandra, S.; Fairey, P.; Houston, M. Cooling with Ventilation. A Product of the Solar Technical Information Program; Solar Energy Research Institute, Department of Energy: Cocoa, FL, USA, 1986. [Google Scholar]
- ISO 10551. Ergonomics of the Thermal Environment—Assessment of the Influence of the Thermal Environment Using Subjective Judgement Scales; International Standard Organization: Geneva, Switzerland, 1995. [Google Scholar]
- Naghshpour, S. Statistics for Economics. Business Expert Press: New York, NY, USA, 2012; p. 475. [Google Scholar]
- Croft, A.; Davison, R. Foundation Maths, 5th ed.; Pearson: Harlow, UK, 2010. [Google Scholar]
- ASHRAE. ASHRAE/ANSI Guideline 14. Measurement of Energy Demand and Savings; American Society of Heating and Air-Conditioning Engineers: Atlanta, GA, USA, 2002. [Google Scholar]
- US Department of Energy. International Performance Measurement & Verification Protocol—IPMVP. Concepts and Options for Determining Energy and Water Savings; International Performance Measurement & Verification Protocol Committee: Washington, DC, USA; US Department of Energy: Washington, DC, USA, 2002; Volume I, p. 92, DOE/GO-102002-1554.
- Koop, L.K.; Tadi, P. Physiology, Heat Loss (Convection, Evaporation, Radiation); StatPearls: Treasure Island, FL, USA, 2020. Available online: https://www.ncbi.nlm.nih.gov/books/NBK541107/ (accessed on 20 October 2020).


Publisher’s Note: MDPI stays neutral with regard to jurisdictional claims in published maps and institutional affiliations. |
© 2020 by the authors. Licensee MDPI, Basel, Switzerland. This article is an open access article distributed under the terms and conditions of the Creative Commons Attribution (CC BY) license (http://creativecommons.org/licenses/by/4.0/).