Article

Processes in the Unsaturated Zone by Reliable Soil Water Content Estimation: Indications for Soil Water Management from a Sandy Soil Experimental Field in Central Italy

Dipartimento di Fisica e Geologia, Università degli Studi di Perugia, Via Pascoli s.n.c., 06123 Perugia, Italy
*
Author to whom correspondence should be addressed.
Sustainability 2021, 13(1), 227; https://doi.org/10.3390/su13010227
Submission received: 12 December 2020 / Revised: 23 December 2020 / Accepted: 25 December 2020 / Published: 29 December 2020

Abstract

:
Reliable soil moisture data are essential for achieving sustainable water management. In this framework, the performance of devices to estimate the volumetric moisture content by means dielectric properties of soil/water system is of increasing interest. The present work evaluates the performance of the PR2/6 soil moisture profile probe with implications on the understanding of processes involving the unsaturated zone. The calibration at the laboratory scale and the validation in an experimental field in Central Italy highlight that although the shape of the moisture profile is the same, there are essential differences between soil moisture values obtained by the calibrated equation and those obtained by the manufacturer one. These differences are up to 10 percentage points for fine-grained soils containing iron oxides. Inaccurate estimates of soil moisture content do not help with understanding the soil water dynamic, especially after rainy periods. The sum of antecedent soil moisture conditions (the Antecedent Soil moisture Index (ASI)) and rainfall related to different stormflow can be used to define the threshold value above which the runoff significantly increases. Without an accurate calibration process, the ASI index is overestimated, thereby affecting the threshold evaluation. Further studies on other types of materials and in different climatic conditions are needed to implement an effective monitoring network useful to manage the soil water and to support the validation of remote sensing data and hydrological soil models.

Graphical Abstract

1. Introduction

In the effort to achieve most of the United Nation (UN) Sustainable Development Goals (SDGs), it is necessary to move towards a sustainable use and management of the soil-water system [1]. For achieving sustainable water management, the monitoring of soil moisture content is mandatory in the understanding of processes involving the unsaturated zone (e.g., infiltration, migration of pollutants, etc.) [2]. As reported by Vanclooster [3], the monitoring is linked to the modeling of soil processes and space-based environmental monitoring systems can give benefits, such as rapid and effective adaptation of the water sector [4]. In this framework, sustainable soil and water management objectives require reliable data. According to Escorihuela and Quintana–Seguí [5], reliable soil moisture data are essential in the Mediterranean region because they affect the characteristics of land processes such as droughts and floods. The ongoing climate change affecting this area decreased rainfall during the recharge period (autumn to spring period, e.g., [6,7,8]) and intensified extreme rainfall events [9]. As recently reported by Mimeau et al. [10], future scenarios indicate a further change of precipitation patterns in the coming years. These changes are associated with an intensification of extreme rainfall events alternating with long periods of drought, increasing the pressure on land with progressive degradation processes affecting soil productivity, irrigation, groundwater recharge, etc. [11]. The monitoring of the soil-water system is crucial in the efficiency of water use, while also improving the agricultural sustainability [12].
Soil moisture can be obtained by direct methods (thermo-gravimetric laboratory method, [13]) or indirect methods, most of which are based on the measurement of the dielectric properties of the soil-water system. The two methods are used locally, have advantages and disadvantages, and are complementary to each other.
The gravimetric method is the standard technique to measure the gravimetric water content (θg). It is also useful to calibrate the estimates of the indirect methods. It requires the soil sampling (destructive method), is time-consuming, and cannot be used for the monitoring in the field [14,15].
Indirect methods allow real-time and continuous monitoring of the volumetric water content (θ) and are more and more used in the latest years. Several instruments are available with different accuracy, costs (including the maintenance), the difficulty of installation, and response time [16]. Compared to the Time Domain Reflectometry (TDR), the Capacitance and Frequency Domain Reflectometry (FDR) allow, by means of the profile probe (PP), the estimation of spatial-temporal evolution of θ [17,18,19,20,21,22,23]. Moreover, PP can contribute to the implementation of an integrated monitoring system, also aiming to map the spatial variation of the soil water content coupled with other electromagnetic methods, such as the Ground Penetrating Radar, GPR [24,25]. Field investigations also help the calibration and validation of remote sensing data, enhancing the understanding of processes at large scales [26,27]. The quality of locally monitored data is the basis for the re-analysis of the soil water content data from satellites [28].
Although the using of capacitance and FDR profile probes is increasing, the calibration problem and performance of the instrumentations cannot be neglected, especially when they are to be applied in large sites [17,23,29,30,31,32,33,34,35]. In other words, the use of manufacturer equations to convert the electromagnetic properties of soils into θ may lead to incorrect assessments of the soil moisture content, with inevitable effects on soil water management and in the understanding of processes occurring in the unsaturated zone [23,36,37]. In this framework, the present work aims to contribute in evaluating the performance of the PR2/6 soil moisture profile probe with implications on devices operating at a frequency of 100 MHz. An experimental field in Central Italy is selected and the monitored data are presented and discussed, taking into account the equation used to estimate the soil water content, the antecedent rainfalls, and the modeled parameters of the unsaturated soil.

2. Materials and Methods

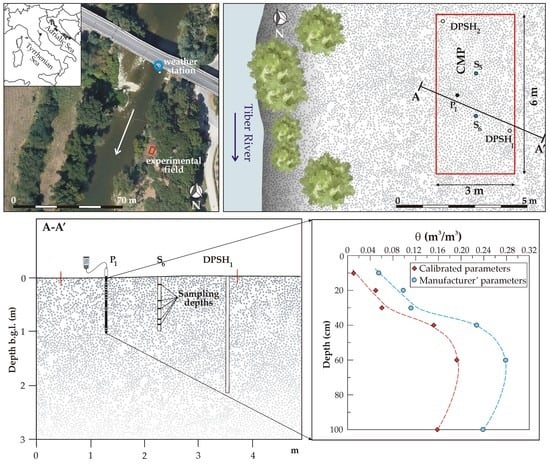
2.1. Experimental Field and Soil Characteristics

For the study, an experimental plot 18 m2 wide was selected. The site is located in Central Italy in the left bank of the Tiber River alluvial plain (43°07′33.60″ N–12°26′04.76″ E, Figure 1a), where a fine-grained soil widely outcrops (soil SB). According to the USDA (United States Department of Agriculture) classification, this soil is a loamy-sand deriving from the erosion of marly-calcareous-siliceous rocks (Flysch) widely outcropping in the Tiber River catchment (the mineralogical composition and organic matter content is shown in Table 1). The lithological model of the site has been reconstructed with the GPR survey [25], with the Dynamic Probe Super Heavy test (DPSH) and with sampling at different depths (0.15, 0.45, 0.60, 0.80, and 0.95 cm) aiming to obtain the main physical parameters of the soil (Figure 1b).
The site is equipped by a weather station (rainfall and temperature) managed by the Servizio Idrografico della Regione Umbria (Figure 1a) and by a PR2/6 profile probe (Delta-T Devices Ltd., Cambridge, UK), which constitutes an integrated monitoring system. The area is characterized by a mean precipitation of about 860 mm/year and mean annual temperature of 14.5 °C (1992–2019 period).
As shown in Figure 1c, the density of sands tends to increase with depth. Within the investigation range of the infiltration process (in the first-meter depth), there is homogeneous loose sand with dry unit weight (γd) of about 14.33 kN/m3 and void index (e) of 0.82 (data obtained on the soil samples collected from S6 and S5). These are young alluvial sediments related to the two important floods of the Tiber River occurred in November 2005 and in November–December 2010. The geotechnical characteristics of soil SB, together with some other non-plastic soils (sands and loamy sands of different nature), are shown in Table 1. As presented in the introduction section, to check the performance of measurements by indirect methods, the comparison of empirical equations to estimate θ values on similar materials can be useful. The results of this analysis will be presented in Section 3.1.

2.2. Monitoring of the Volumetric Water Content and Infiltration

2.2.1. The PR/2 Profile Probe

The PR2/6 capacitance profile probe allows the estimation of the soil volumetric water content (θ) at different depths. The device requires the installation of an access tube of 1.10 m length into the soil. A 9-volt battery generates a signal of 100 MHz (similar to FM radio), which is applied to six pairs of stainless steel rings placed at different depths (0.10, 0.20, 0.30, 0.40, 0.60, and 1.00 m). An electromagnetic field extends all around the device (Figure 2) and a data logger records the voltage output (V), which is converted into the square root of the dielectric constant ( ε ) by a six-order polynomial equation (Equation (1), [40]). The volumetric water content is then obtained by a soil calibration equation (Equation (2)), which contains two parameters, a0 (soil offset) and a1 (slope), as proposed by [41]. The dielectric constant (ε) obtained by the PR2/6 probe is the sum of soil real (ε’) and imaginary (ε”, dielectric loss) permittivity. It is known that for devices working at low frequencies (<1 GHz), the ε” can be affected by the water salinity and therefore influencing the estimates of θ. This problem cannot be neglected for effluent waters with electrical conductivity values higher than 1500–5000 μS/cm [42,43]. According to the PR2/6 manual [40], the probe has a very low intrinsic sensitivity to the salinity of effluent water when it is of an order of magnitude lower than that reported by the above reference studies. In these cases, the accuracy of measurements mainly depends on the proper choice of parameters a0 and a1 of Equation (2): in general, the manufacturer suggests to set a0 = 1.6 and a1 = 8.4 for mineral soils. The same parameters are suggested for other commercially available electromagnetic devices such as SM200, SM300, and Theta Probe ML2x. All these probes are produced by the Delta-T Devices, work at the same frequency of PR2/6 (100 MHz), and θ values are estimated from voltage outputs of sensors [44].
In this work, the column test has been used for the calibration of parameters a0 and a1 as already proposed by other studies [23,37]. Figure 2 summarizes the step-by-step procedure used for calibrating the PR2/6 probe. By using Equation (2), actual θ values are computed and related to √ε values for obtaining the best a0 and a1 parameters for the investigated soil.
ε = 1.125 5.53 V + 61.17 V 2 234.42 V 3 + 413.56 V 4 356.68 V 5 + 121.53 V 6
ε = a 0 + a 1 θ
where
θ = θ g · γ d γ w
θg = Mw/Ms (Mass of water/Mass of solids);
γd = Dry unit weight of soil (kN/m3);
γw = Unit weight of water (kN/m3).

2.2.2. Double Ring Infiltrometer

The Double Ring Infiltrometer (DRI) is a standardized technique [45] used to estimate the infiltration rate of water in fine-grained soils. The instrument is composed of two steel rings of different diameters: in this study, the inner ring is 30 cm wide while the outer ring is 60 cm. By using a Mariotte bottle, the volume of water needed to keep the water level in the inner rings constant (constant head) is measured over time. The water passing from the inner ring to the soil during a time-step (Δt) represents the infiltration rate (i, Equation (4)). The steady-state infiltration can be assumed as the saturated hydraulic conductivity of the soil (ks), even if the value obtained may be influenced by entrapped air in the voids, biological activity, size of rings, etc. [46].
i = V π · r 2 · Δ t
where:
  • i = infiltration rate (cm/s);
  • V = volume of added water (cm3) in each time-step (Δt);
  • Δt = time step (s);
  • r = radius of the inner ring (cm).

2.3. The Soil Water Characteristic Curve (SWCC)

Most of the information for the understanding of infiltration processes within the unsaturated soils is contained in the Soil Water Characteristic Curve (SWCC). The SWCC relates the matric suction (the difference between pore air pressure, ua, and pore water pressure, uw) and θ [47]. As reported by Lu and Likos [48], direct measurements of the matric suction are time-consuming, and often only a few data points of the SWCC are obtained [49]. In this work to reconstruct the SWCC of the soil SB outcropping in the experimental field, “The Soil Water Characteristics software (version 6.02.75)” is used (download page: https://hrsl.ba.ars.usda.gov/soilwater/Index.htm). This software, which has been developed by the USDA [50], estimates several hydrological soil properties based on the texture class, gravel fraction, organic matter, salinity, and compaction (dry unit weight). In detail, the program–by using the model developed by [51]–allows the estimation of the matric suction and some other essential parameters (residual volumetric water content, θr, and saturated volumetric water content, θs) that are useful to estimate the suction stress (σs). As reported by Lu and Likos [48], σs can be expressed in terms of normalized volumetric water content (or effective degree of saturation, Se) and matric suction (Equation (5)):
σ s = θ θ r θ s θ r · ( u a u w ) = S e · ( u a u w )
where:
  • σs = suction stress (kN/m2)
  • θ = volumetric water content (m3/m3)
  • θr = residual volumetric water content (m3/m3)
  • θs = saturated volumetric water content (m3/m3)
  • ua = pore air pressure (kN/m2)
  • uw = pore water pressure (kN/m2)
  • (ua − uw) = matric suction (kN/m2)
  • Se = effective degree of saturation (m3/m3).

3. Results

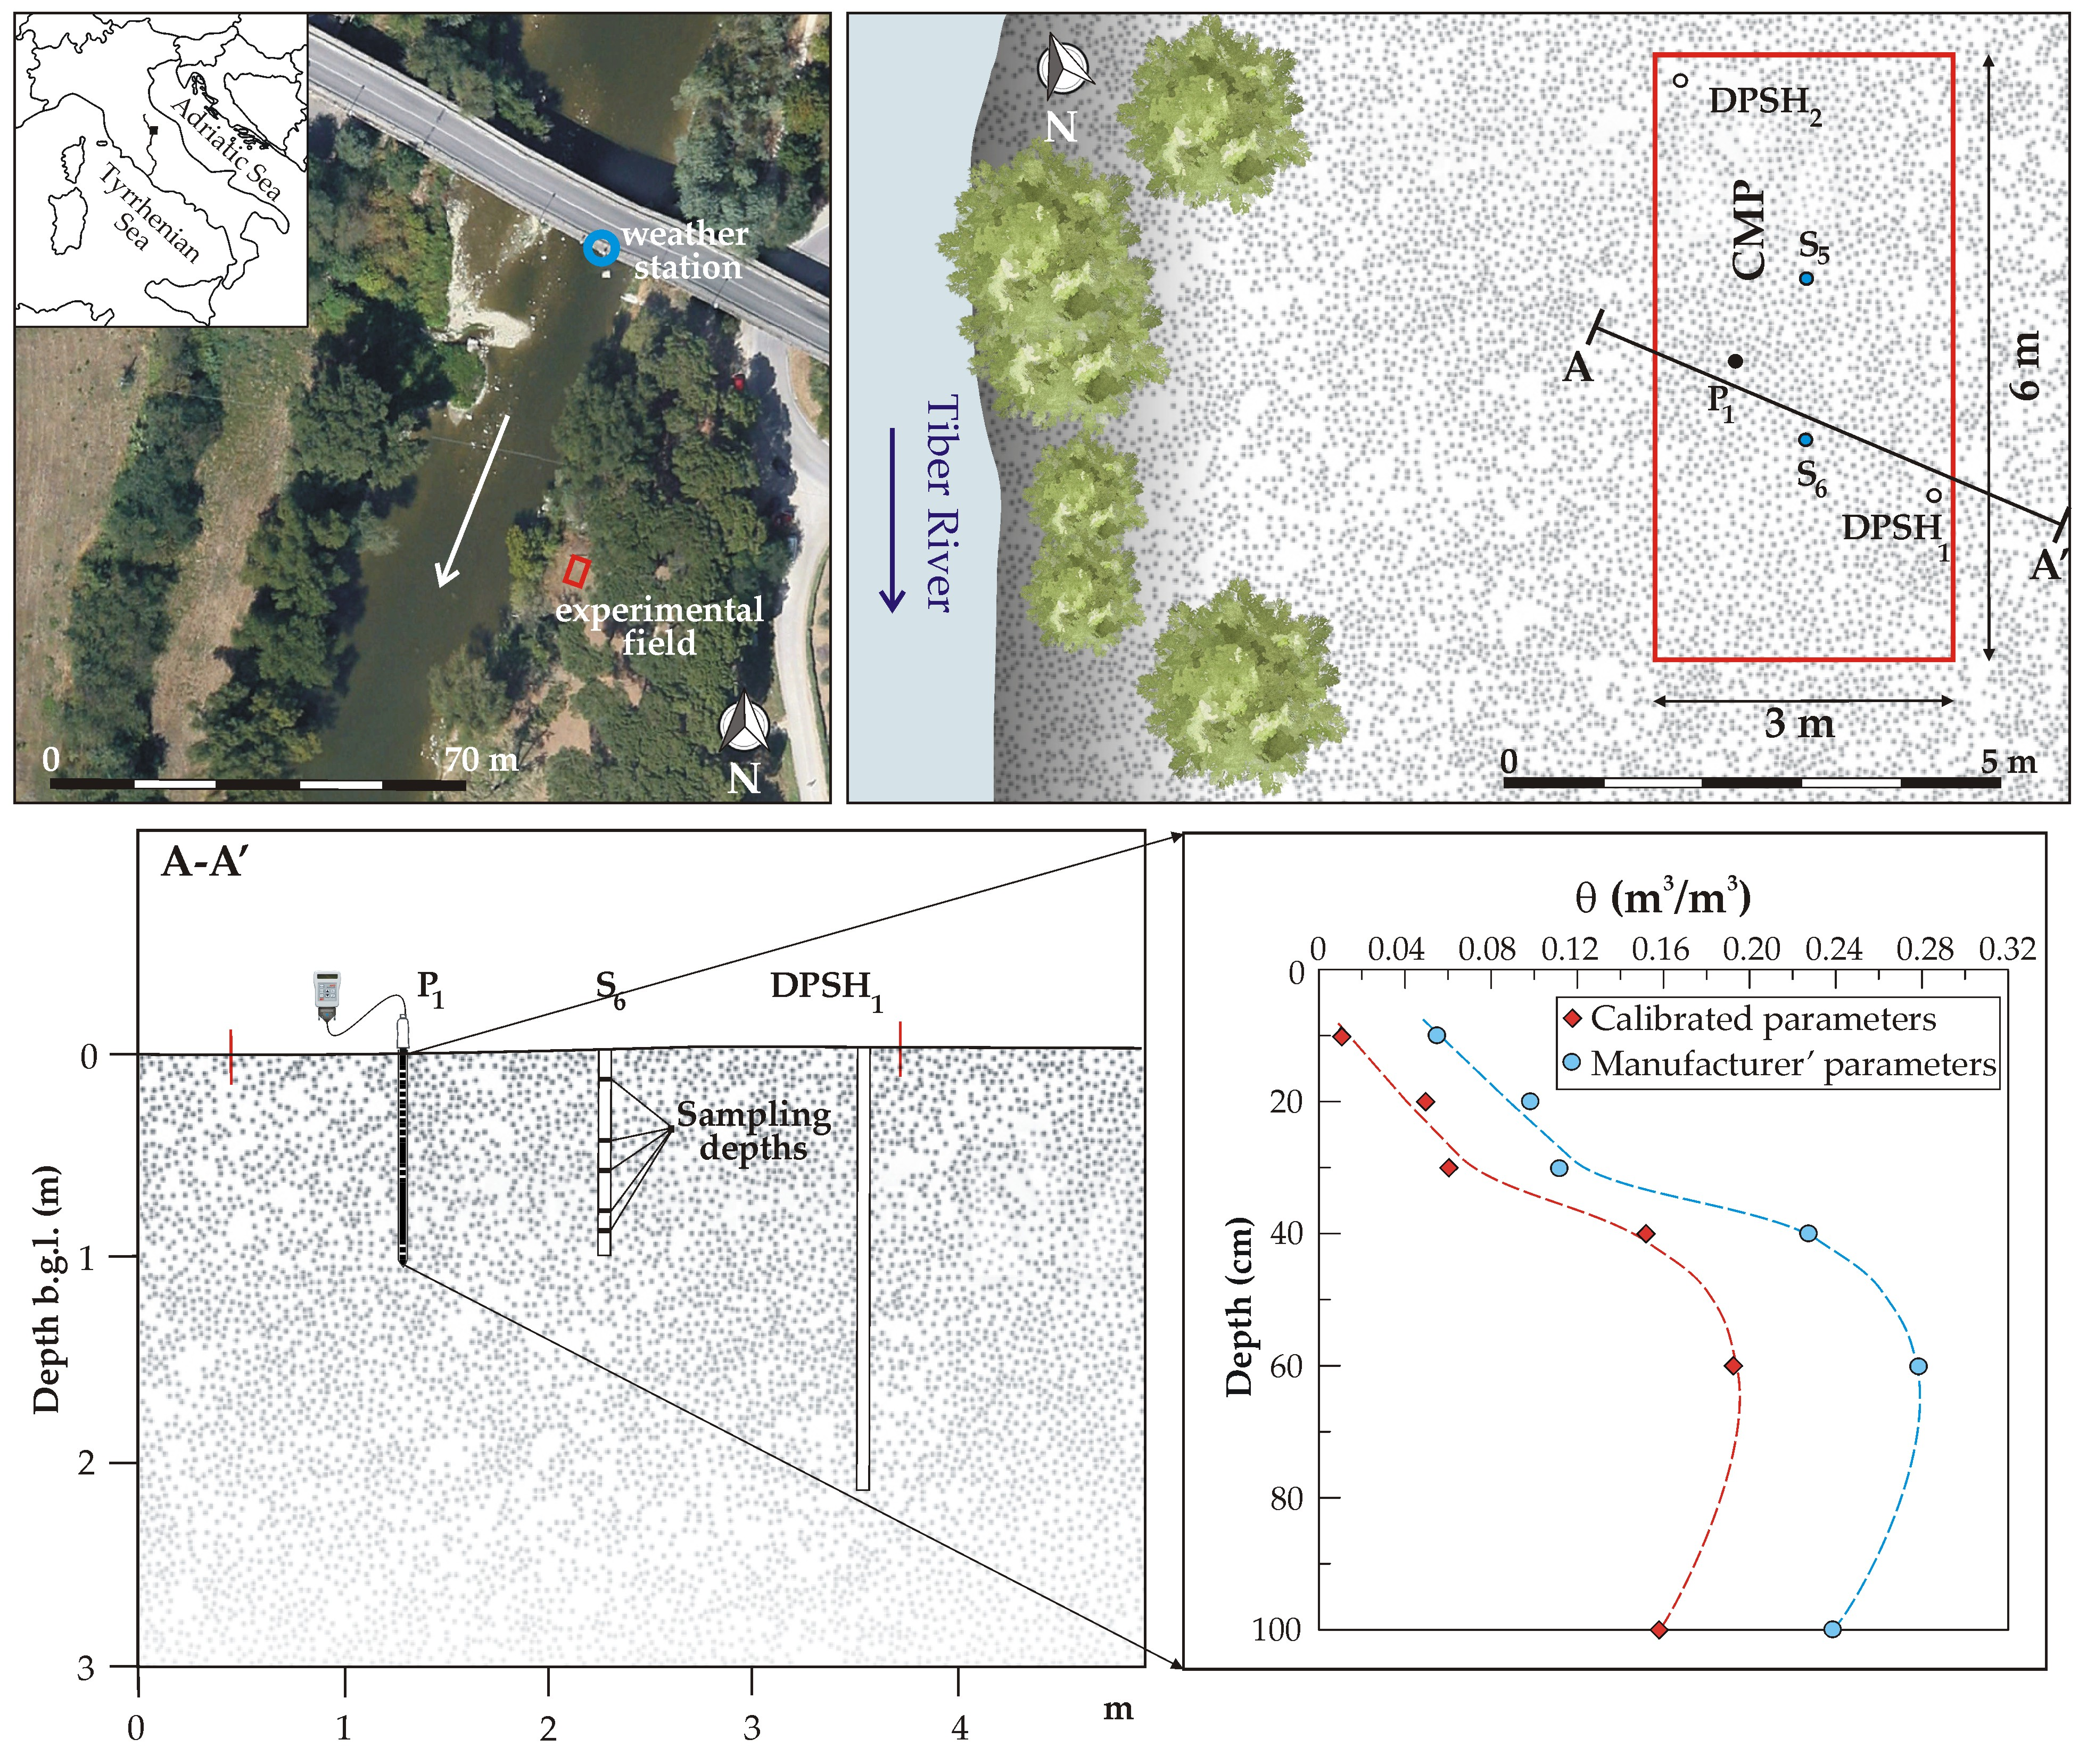
3.1. Calibration of PR2/6 Probe on Soil SB and Comparison with Other Sands

The step-by-step procedure presented in Figure 2 allowed the obtaining of reliable calibration curves for accurate estimates of θ values by the PR2/6 profile probe, an essential step before using the device in the field. Figure 3 shows the calibration curves with parameters a0 and a1 of Equation (2) for the different sands listed in Table 1, also referring to previous published data [23,30]. Figure 3 also shows the data of a new sand (soil SC) collected in a quarry located in the Paglia River alluvial plain, Central Italy (42°44′14.92″ N–12°06′38.13″ E, [52]). It is interesting to point out that the equations differ from that suggested by the manufacturer, which tends to overestimate the θ values.

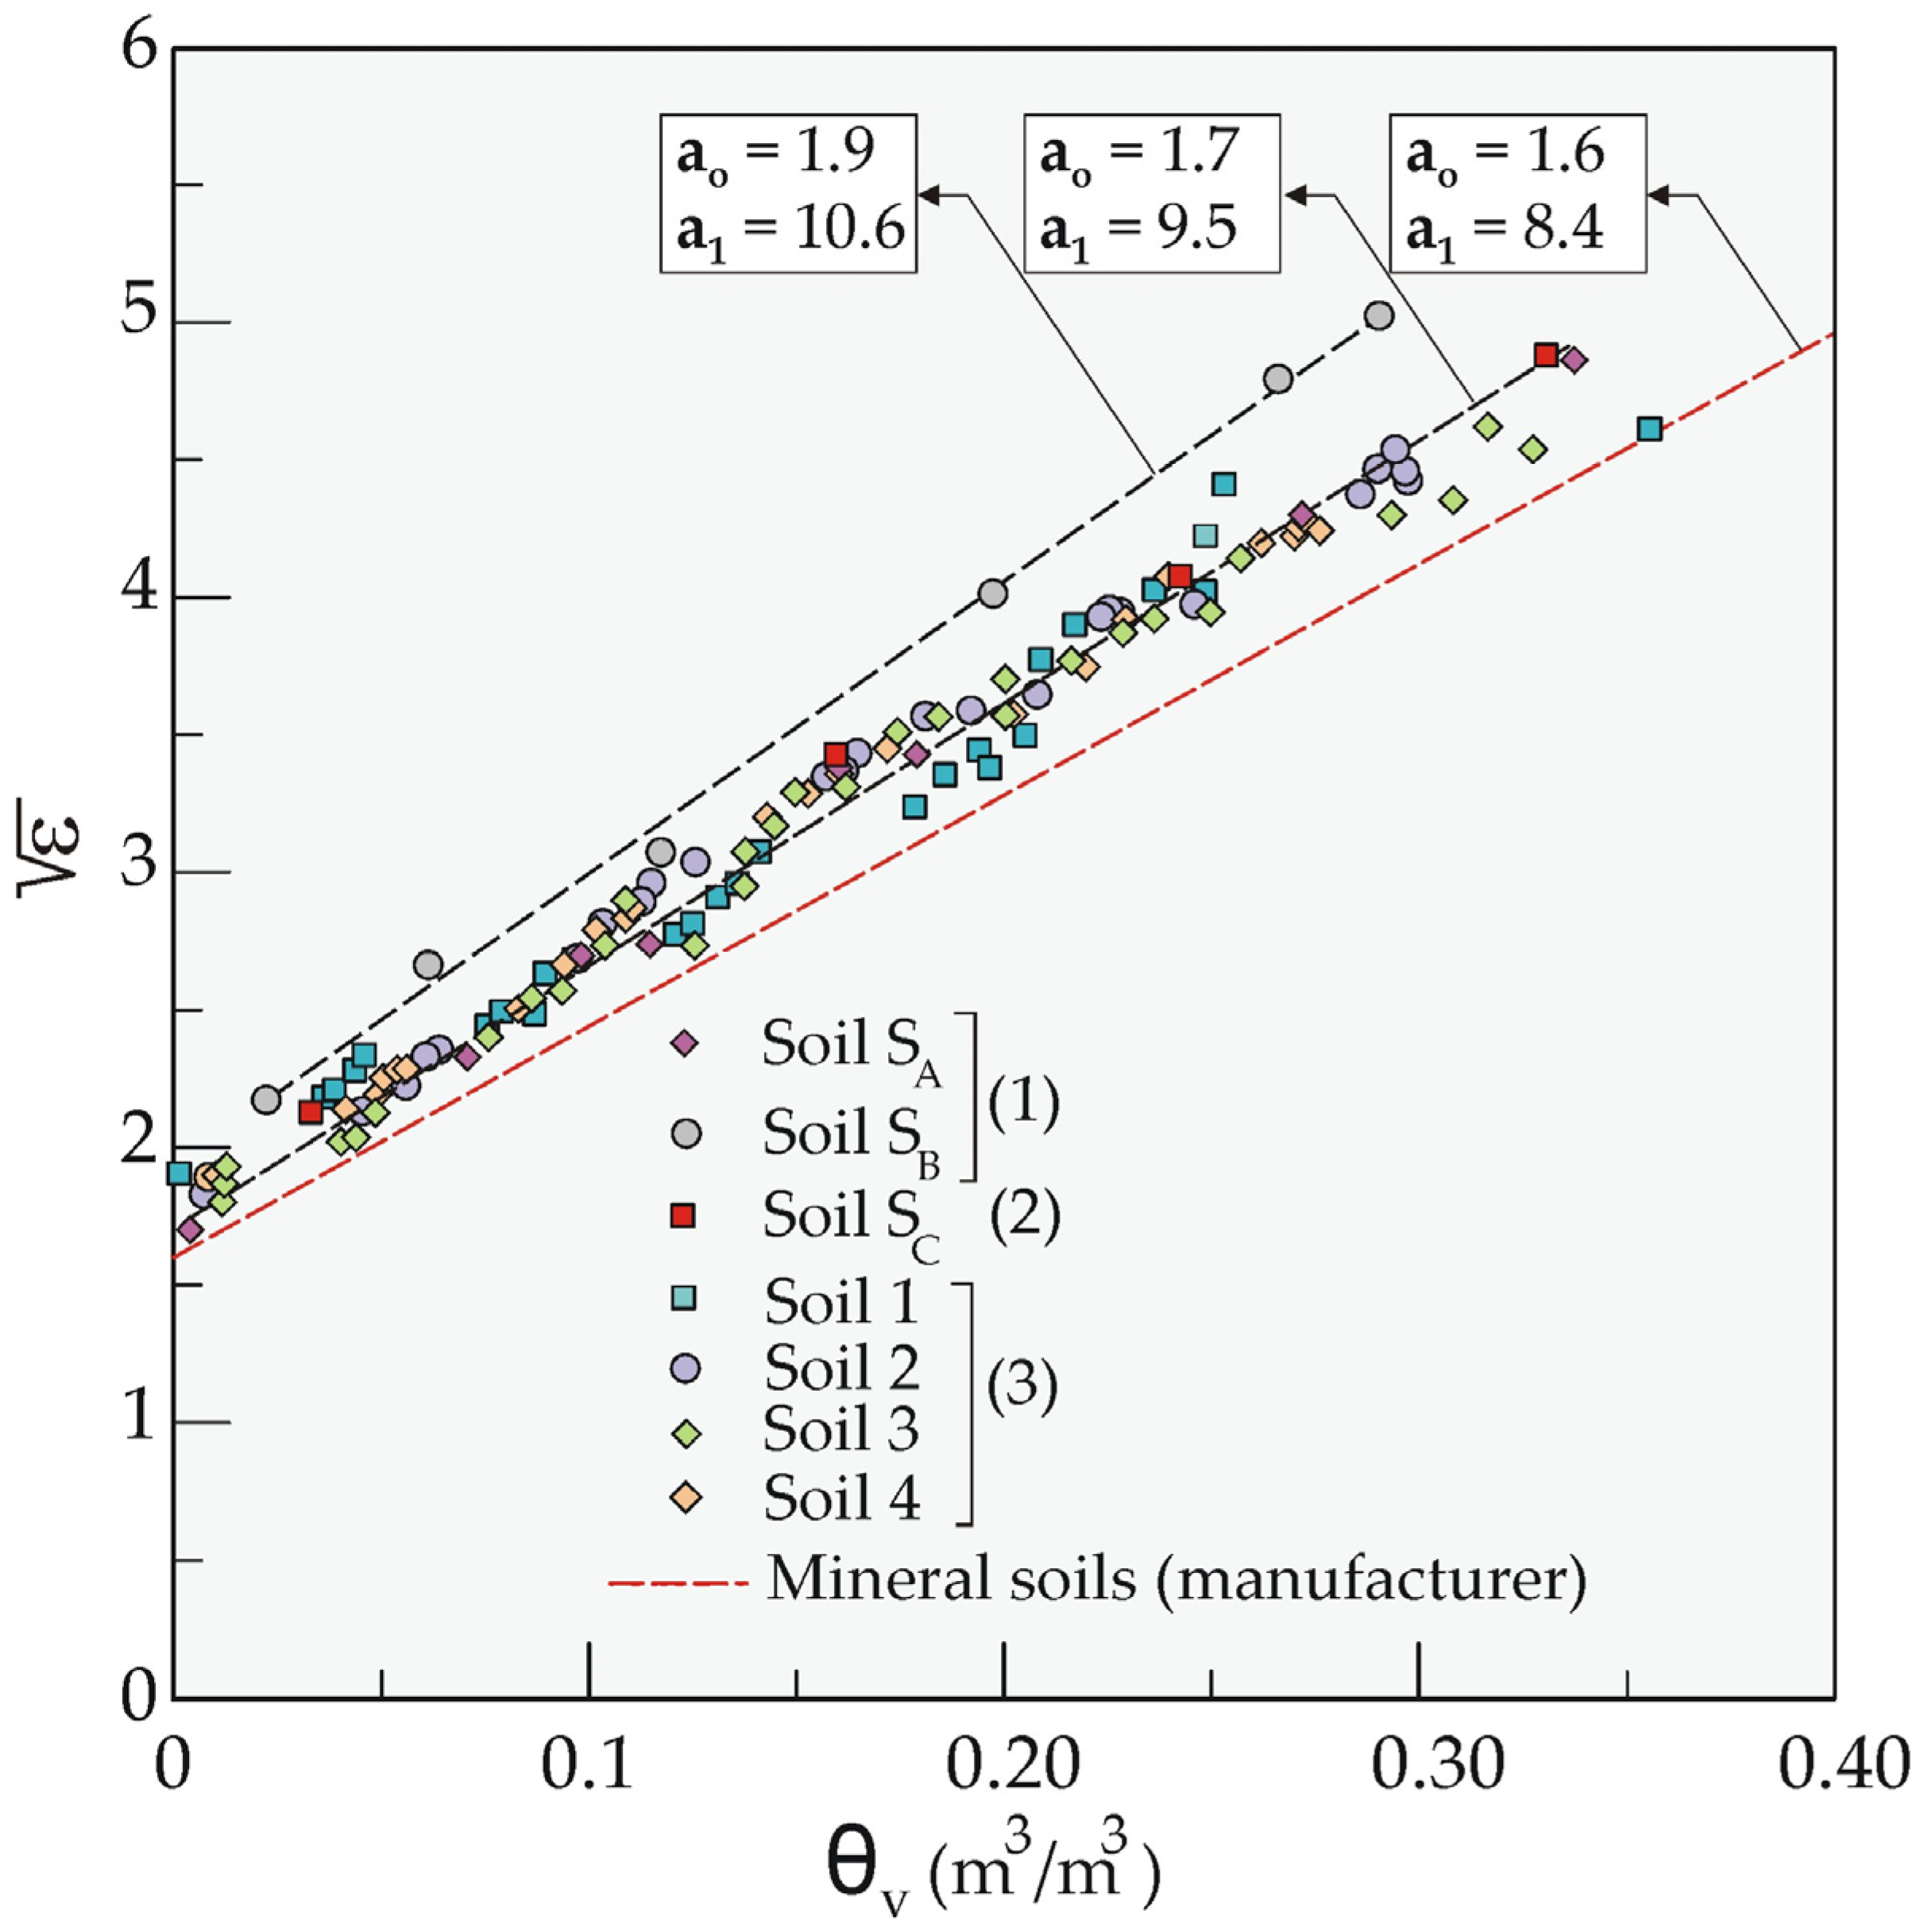
3.2. Soil Water Characteristic Curve of Soil SB and Infiltration Test

The Soil Water Characteristics software has been used to model hydrological soil properties of soil SB outcropping in the experimental field. The input parameters which has been set into the program are:
  • sand and clay fraction of 82% and 3%, respectively (Table 1);
  • organic matter content of 1.53% (Table 1);
  • electrical conductivity of the effluent fluids, 440 μS/cm [23];
  • dry unit weight (14.33 kN/m3).
Figure 4a shows the SWCC and the hydraulic conductivity curve of soil SB. The modeled residual volumetric water content, θr, and saturated volumetric water content, θs, were 3.0% and 44.9%, respectively. The estimated θs agrees with that calculated by applying the unit-weight relationship (Equation (6)), which provides a value of 45.5%. In the computation, the following data have been considered: γd = 14.33 kN/m3; e = 0.82; specific gravity, Gs = 2.63; γw = 9.81 kN/m3.
θ s = γ d · e G s · γ w
The modeled saturated hydraulic conductivity (ks) resulted in 3.4 × 10⁻³ cm/s (Figure 4a). Figure 4b shows the result of the DRI test carried out in the field at the end of July 2018. The initial θ value in the first 30 cm depth was about 5%. The infiltration curve is described by the Horton equation [53] and approaches to quasi-steady-state conditions after about 150 min, reaching a value of about 8.0 × 10⁻³ cm/s. Although the enclosure of air bubbles in the voids during infiltration prevents maximum saturation, the ks value obtained by the infiltrometer is of the same order of magnitude of the ks predicted by the SWC software.

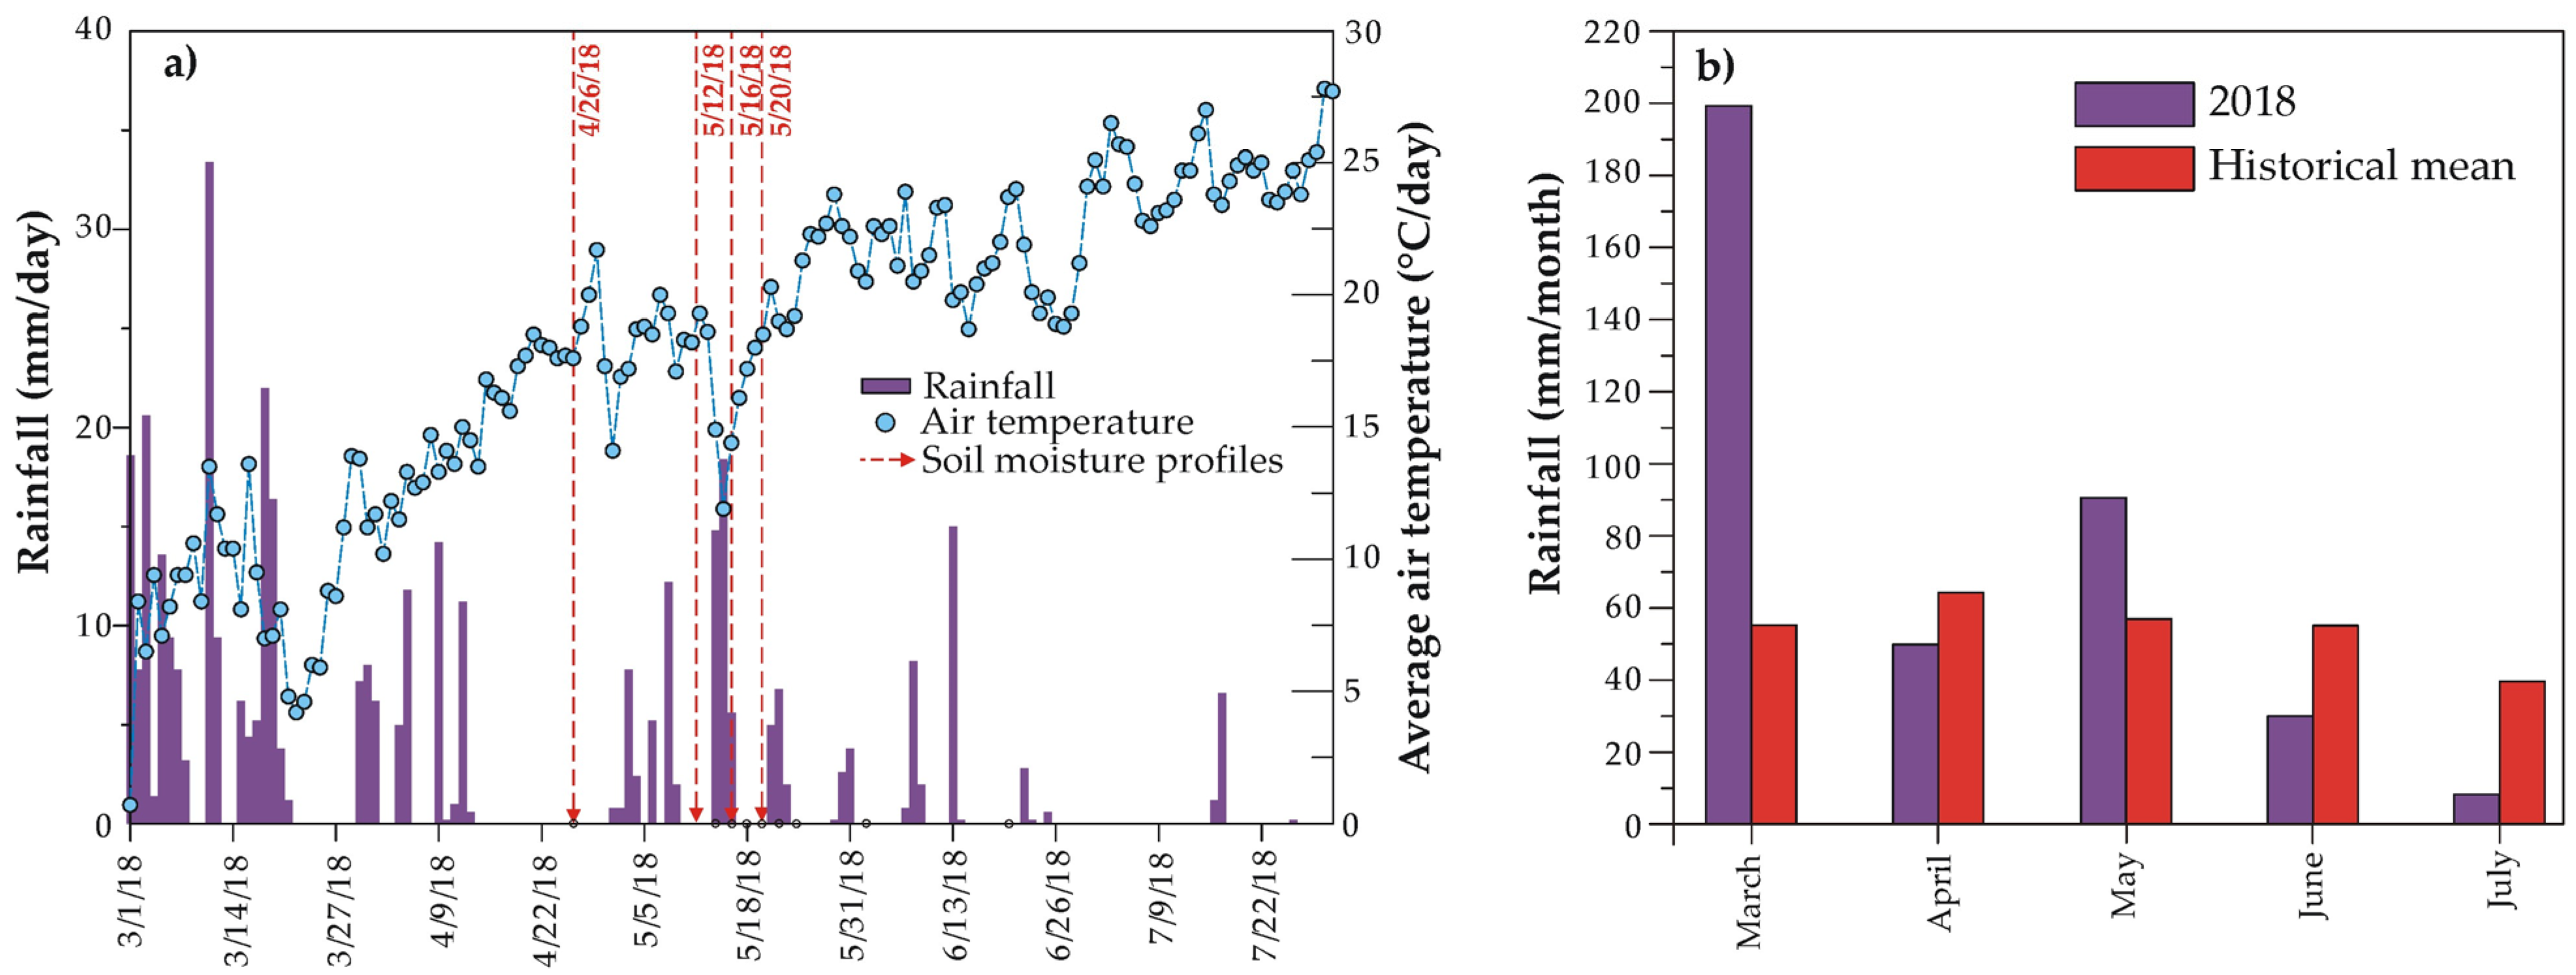
3.3. Precipitation Analyses and Soil Water Profiles

The monitoring of the spatial-temporal variations of soil water content with depth is important in different practical applications (hydrological, hydrogeological, and pedological). To check the response of the PR2/6 probe, the soil water profile dynamic has been analyzed during April–May 2018. Figure 5a shows the daily rainfall and temperature data recorded in the period by the weather station located less than 70 m from the experimental site (Figure 1a). In detail, March 2018 experienced very high precipitations, which were found to be more than three times higher than the historical mean (Figure 5b). In the subsequent months, rainfall data were in line with the historical mean, with a not negligible increase also found in May. During the observation period (late winter-spring months) the air temperature gradually increased, except for the two rainy periods of March and May 2018. In this framework, the temporal variations of soil water content with depth allow the understanding of processes during wetting and drying periods. Figure 5a also shows the location of four selected comprehensive water content measurements taken before and after important meteorological events. In order to have accurate water content data, each measure has been repeated at least seven times by setting the PR2/6 datalogger with both calibrated parameters and manufacturer ones (mineral soil).
Figure 6 shows the selected soil moisture profiles. Following we present the results obtained by setting the HHD datalogger of the PR2/6 probe with the calibrated parameters, moving the discussion about the differences obtained with the manufacturer’s parameters for mineral soils to the next section.
The first measurement refers to 26 April 2018 (Supplementary Materials), after about two weeks from the end of a very high rainfall period (Figure 6a). Due to the effect of the antecedent rainfalls (about 250 mm in two months), the moisture profile shows the typical shape of a wetting front moving downwards e.g., [54]. The low values in the shallow zone (the first 30 cm depth) are also due to the effect of the evapotranspiration (the air temperature increased of about 10 °C in the week before the measurement). The succession of rainy and dry periods in the following weeks introduced a lot of disturbing effects on the soil water profile. The precipitations occurred at the beginning and middle of May increased the volumetric water content in the first 30 cm depth of about 12 percentage points (Figure 6b,c). The water distribution in the first-meter depth has gradually assumed a constant profile with an effective degree of saturation (Se) of about 36% (Figure 6g). As shown in Figure 6d, after few days of no rainfall–coupled with a rise of evapotranspiration phenomena linked to the increase in temperature–the water profile tended to re-assume a shape similar to that recorded on 12 May 2018. Figure 6i–l also display the matric suction profiles during the same observation period, as obtained from the SWC software. In each measurement, the matric suction decreases with depth with maximum changes in the first 30 cm as affected by meteo-climatic conditions. For instance, between 26 April and 12 May, a mean decrease of 150 kPa is observed in the shallow zone.

4. Discussion

The performed analysis confirms that there is no unique relationship between dielectric properties of the medium ( ε ) and θ, even when the same instrument is used on similar materials (e.g., non-plastic soils). Most of the sands analyzed here tend to align on the calibration curve having a0 = 1.7 and a1 = 9.5, which differs from that of the manufacturer (mineral soils, a0 = 1.6 and a1 = 8.4). For this sand types (mainly composed by quartz and/or calcium carbonate, Table 1) the use of the manufacture parameters leads to a not excessive overestimation of θ values from 2 to 5 percentage points. In contrast, SB sands-coming from the experimental field-shows the highest parameters (a0 = 1.9 and a1 = 10.6), which in turn give θ values from 5 to 10 percentage points lower than those estimated by using the manufacturer’s parameters. The probe calibration is always necessary, but it is particularly important for capacitance probes working at low frequency, especially when used in a medium having high iron content. The iron content affects the imaginary component (ε”) of the dielectric constant of the soil/water system [55]. For these soils, the difference between actual and estimated values by the manufacturer parameters tends to increase as the degree of saturation of soil increases. Soil SB has an iron oxides content of about 6.5% [56] with minor contents of pyrite and chlorite. As reported by Robinson et al. [57], the iron oxide content, coupled with the length of sensor rods used, play an important role in capacitance probe working at 100 MHz, such as the PR2/6 probe. However, recent research has shown that the effects of iron content are more evident for instruments working at even lower frequencies (cf., a WET sensor working at 50 MHz, [55]).
The effects of an accurate calibration are also evident when analyzing the temporal variations of soil water content with depth in the experimental field. The use of the PR2/6 probe without an accurate calibration does not help the understanding of what is really happening in the soil. As shown in Figure 6a–d, although the shape of the moisture profiles is the same, there are essential differences between θ values obtained by the calibrated equation and those by the manufacturer one. Referring to Figure 6c, the difference between the two soil moisture profiles is exacerbated after rainy periods. Following to 40 mm of rain in three days (from 14 May to 16 May), the hydrogeological processes that occurred in the shallow soil (first 30 cm depth) increased the θ values from about 18% (calibrated parameters) to 27% (manufacturer parameters). In other words, the fraction of water actually occupied by free water into voids is much higher if the manufacturer equation is used. As presented by Haga et al. [58], the subsurface water dynamics also depends on the antecedent soil moisture conditions, which can be evaluated by using the Antecedent Soil moisture Index (ASI). The sum of ASI and precipitation (P) related to different stormflows allows the identification of threshold values (ASI + P, in mm) above which runoff significantly increases [59,60]. In general, the ASI index is estimated at catchment scale or on plot scale by using remote sensing data or indirect methods, such as TDR or capacitance probes: as illustrated, the calibration process is very important in the latter. An overestimation of the soil moisture affects the ASI index computation and therefore, the definition of reliable runoff thresholds. For example, referring to the middle May rainfall event, the ASI index calculated in the first 30 cm depth is 36 or 51 mm depending on whether the calibrated or factory parameters are used. As a result of rainfalls and processes occurring in the shallow soil (runoff, evapotranspiration, etc.), the water gradually infiltrates, producing the decrease of matric suction and the increase of the effective degree of saturation (Se). In detail, Se in the first 30 cm depth is overestimated of about 20 percentage points by using manufacturer parameters (Figure 6g). Although the information was obtained on a small plot, the results are important for soil water management. As Se increases, the soil tends to absorb much less water and thus increases the runoff, with practical implications in different disciplines, including soil science, geomorphology, hydrogeology, etc. [61]. The comprehension of landscape processes requires quantifying water and sediment fluxes, i.e., through a connectivity-based approach [61]. As illustrated, the antecedent soil moisture content regulates the partitioning of rainfall into infiltration and runoff, even though other components have to be carefully evaluated. As discussed by Zhao et al. [62], at a local scale, micro-relief acts similar to the vegetation cover, reducing the surface wash velocity and increasing the infiltration rate. These aspects are not considered in this paper since it focused on the effect of soil moisture reliability’s estimates. To improve the soil-water management, the concepts discussed in this study should be included. To achieve the SDGs, soil hydraulic properties and soil monitoring need to be assessed, indicating that better measurements and modeling approaches are crucial. According to [63,64], modern technological solutions can provide the needed data and information, but the harmonization of monitoring programs and measurement standards and protocols still needs to be completed. The present work contributes to these topics: good data and sustainable soil management practices contribute in mitigating the land degradation, moving towards a Land Degradation-Neutrality target (LDN), an important goal to increase sustainable land use [65,66].

5. Conclusions

The achieving of sustainable water management requires reliable soil moisture data, which are increasingly obtained by using electromagnetic methods. The laboratory and field-scale investigations provided useful recommendations on the use of the PR2/6 profile probe, and in general capacitance probes working at 100 MHz, to obtain reliable data for the understanding of some processes in the unsaturated zone made by fine-grained soils. The calibration parameters for the different soils considered are useful in various fields of application where the infiltration play a key role (groundwater recharge, erosion and runoff, irrigation, etc.). Particularly interesting is the results for the flyschoid sand (soil SB), which widely outcrops along the Central-Northern Apennines, confirming that the iron content deeply affects the soil moisture estimations. This aspect, which is often not carefully taken into account, inevitably leads to erroneous assessments, impacting the soil water management. After the calibration, the probe, coupled with the modeling of non-saturated parameters, can accurately describe the dynamic of water in soils. In this way, further studies on other types of materials and in different pedoclimatic conditions are needed to implement an effective monitoring network that is useful for managing the soil water and for supporting the validation of remote sensing data and hydrological soil models. The work contributes to the achievement of LDN goals, as electromagnetic tools are becoming increasingly popular in modern agricultural practices of sustainable soil management.

Supplementary Materials

The following are available online at https://www.mdpi.com/2071-1050/13/1/227/s1.

Author Contributions

Conceptualization, L.D.M.; methodology, L.D.M. and S.O.; formal analysis, L.D.M., A.S., and S.O.; investigation, L.D.M., A.S., and S.O.; data curation, L.D.M., and S.O.; writing—original draft preparation, L.D.M. and S.O.; writing—review and editing, L.D.M. and S.O.; funding acquisition, L.D.M. All authors have read and agreed to the published version of the manuscript.

Funding

This research was funded by Dipartimento di Fisica e Geologia of University of Perugia in the framework of the Project DIMBASE14.

Institutional Review Board Statement

Not applicable.

Informed Consent Statement

Not applicable.

Data Availability Statement

Data are contained in the supplementary material.

Acknowledgments

The geotechnical analyses were performed in the Laboratorio di Geologia Applicata of the University of Perugia. The authors are grateful for the technical support of Geosurveys Srl for DPSH tests. We would like to thank the anonymous Reviewers for their useful comments and suggestions.

Conflicts of Interest

The authors declare no conflict of interest.

References

  1. Keesstra, S.; Mol, G.; De Leeuw, J.; Okx, J.; De Cleen, M.; Visser, S. Soil-related sustainable development goals: Four concepts to make land degradation neutrality and restoration work. Land 2018, 7, 133. [Google Scholar] [CrossRef] [Green Version]
  2. O’Geen, A.T. Soil Water Dynamics. Nat. Educ. Knowl. 2013, 4, 9. Available online: https://www.nature.com/scitable/knowledge/library/soil-water-dynamics-103089121/ (accessed on 30 November 2020).
  3. Vanclooster, M. Moditored Unsaturated Soil Transport Processes as a Support for Large Scale Soil and Water Management. EGUGA, 3928. 2010, EGUGA.12.3928V. Available online: https://ui.adsabs.harvard.edu/abs/2010EGUGA.12.3928V/abstract (accessed on 30 November 2020).
  4. Cosgrove, W.J.; Loucks, D.P. Water management: Current and future challenges and research directions. Water Resour. Res. 2015, 51, 4823–4839. [Google Scholar] [CrossRef] [Green Version]
  5. Escorihuela, M.J.; Quintana-Seguí, P. Comparison of remote sensing and simulated soil moisture datasets in Mediterranean landscapes. Remote Sens. Environ. 2016, 180, 99–114. [Google Scholar] [CrossRef] [Green Version]
  6. Di Matteo, L.; Valigi, D.; Cambi, C. Climatic characterization and response of water resources to climate change in limestone areas: Considerations on the importance of geological setting. J. Hydrol. Eng. 2013, 18, 773–779. [Google Scholar] [CrossRef] [Green Version]
  7. Caloiero, T.; Veltri, S.; Caloiero, P.; Frustaci, F. Drought analysis in Europe and in the Mediterranean basin using the standardized precipitation index. Water 2018, 10, 1043. [Google Scholar] [CrossRef] [Green Version]
  8. Di Matteo, L.; Dragoni, W.; Maccari, D.; Piacentini, S.M. Climate change, water supply and environmental problems of headwaters: The paradigmatic case of the Tiber, Savio and Marecchia rivers (Central Italy). Sci. Total Environ. 2017, 598, 733–748. [Google Scholar] [CrossRef]
  9. Molinié, G.; Déqué, M.; Coppola, E.; Blanchet, J.; Neppel, L. Heavy precipitation in the Mediterranean basin. Observed trends, future projections (Sub-chapter 1.3.1.). In The Mediterranean Region under Climate Change: A Scientific Update; Thiébault, S., Moatti, J.P., Eds.; IRD Éditions: Marseille, France, 2016; Available online: https://books.openedition.org/irdeditions/23121#text (accessed on 22 December 2020).
  10. Mimeau, L.; Tramblay, Y.; Brocca, L.; Massari, C.; Camici, S.; Finaud-Guyot, P. Modeling the response of soil moisture to climate variability in the Mediterranean region. Hydrol. Earth Syst. Sci. Discuss. 2020, 1–29. [Google Scholar] [CrossRef]
  11. Visser, S.; Keesstra, S.; Maas, G.; De Cleen, M. Soil as a basis to create enabling conditions for transitions towards sustainable land management as a key to achieve the SDGs by 2030. Sustainability 2019, 11, 6792. [Google Scholar] [CrossRef] [Green Version]
  12. Keesstra, S.D.; Bouma, J.; Wallinga, J.; Tittonell, P.; Smith, P.; Cerdà, A.; Montanarella, L.; Quinton, J.N.; Pachepsky, Y.; van der Putten, W.H.; et al. The significance of soils and soil science towards realization of the United Nations Sustainable Development Goals. Soil 2016, 2, 111–128. [Google Scholar] [CrossRef] [Green Version]
  13. ASTM D2216-19. Standard Test Methods for Laboratory Determination of Water (Moisture) Content of Soil and Rock by Mass; ASTM International: West Conshohocken, PA, USA, 2019; Available online: https://www.astm.org/Standards/D2216 (accessed on 30 October 2020).
  14. Walker, J.P.; Willgoose, G.R.; Kalma, J.D. In situ measurement of soil moisture: A comparison of techniques. J. Hydrol. 2004, 293, 85–99. [Google Scholar] [CrossRef]
  15. Rudnick, D.R.; Djaman, K.; Irmak, S. Performance analysis of capacitance and electrical resistance-type soil moisture sensors in a silt loam soil. Trans. ASABE 2015, 58, 649–665. [Google Scholar] [CrossRef]
  16. Muñoz-Carpena, R.; Shukla, S.; Morgan, K. Field Devices for Monitoring Soil Water Content; Bulletin 343; University of Florida: Gainesville, FL, USA, 2004; 24p, Available online: https://citeseerx.ist.psu.edu/viewdoc/download?doi=10.1.1.514.6862&rep=rep1&type=pdf (accessed on 31 October 2020).
  17. Evett, S.R.; Tolk, J.A.; Howell, T.A. Soil profile water content determination: Sensor accuracy, axial response, calibration, temperature dependence, and precision. Vadose Zone J. 2006, 5, 894–907. [Google Scholar] [CrossRef]
  18. Kizito, F.; Campbell, C.S.; Campbell, G.S.; Cobos, D.R.; Teare, B.L.; Carter, B.; Hopmans, J.W. Frequency, electrical conductivity and temperature analysis of a low-cost capacitance soil moisture sensor. J. Hydrol. 2008, 352, 367–378. [Google Scholar] [CrossRef]
  19. Chow, L.; Xing, Z.; Rees, H.W.; Meng, F.; Monteith, J.; Stevens, L. Field performance of nine soil water content sensors on a sandy loam soil in New Brunswick, Maritime Region, Canada. Sensors 2009, 9, 9398–9413. [Google Scholar] [CrossRef]
  20. Kelleners, T.J.; Soppe, R.W.O.; Robinson, D.A.; Schaap, M.G.; Ayars, J.E.; Skaggs, T.H. Calibration of capacitance probe sensors using electric circuit theory. Soil Sci. Soc. Am. J. 2004, 68, 430–439. [Google Scholar] [CrossRef]
  21. Qi, Z.; Helmers, M.J. The conversion of permittivity as measured by a PR2 capacitance probe into soil moisture values for Des Moines lobe soils in Iowa. Soil Use Manag. 2010, 26, 82–92. [Google Scholar] [CrossRef]
  22. Adeyemi, O.; Grove, I.; Peets, S.; Norton, T. Advanced monitoring and management systems for improving sustainability in precision irrigation. Sustainability 2017, 9, 353. [Google Scholar] [CrossRef] [Green Version]
  23. Di Matteo, L.; Pauselli, C.; Valigi, D.; Ercoli, M.; Rossi, M.; Guerra, G.; Cambi, C.; Ricco, R.; Vinti, G. Reliability of water content estimation by profile probe and its effect on slope stability. Landslides 2018, 15, 173–180. [Google Scholar] [CrossRef]
  24. Weihermüller, L.; Huisman, J.A.; Lambot, S.; Herbst, M.; Vereecken, H. Mapping the spatial variation of soil water content at the field scale with different ground penetrating radar techniques. J. Hydrol. 2007, 340, 205–216. [Google Scholar] [CrossRef] [Green Version]
  25. Ercoli, M.; Di Matteo, L.; Pauselli, C.; Mancinelli, P.; Frapiccini, S.; Talegalli, L.; Cannata, A. Integrated GPR and laboratory water content measures of sandy soils: From laboratory to field scale. Constr. Build. Mater. 2018, 159, 734–744. [Google Scholar] [CrossRef]
  26. Brocca, L.; Hasenauer, S.; Lacava, T.; Melone, F.; Moramarco, T.; Wagner, W.; Dorigo, W.; Matgen, P.; Martínez-Fernández, J.; Llorens, P.; et al. Soil moisture estimation through ASCAT and AMSR-E sensors: An intercomparison and validation study across Europe. Remote Sens. Environ. 2011, 115, 3390–3408. [Google Scholar] [CrossRef]
  27. Morbidelli, R.; Corradini, C.; Saltalippi, C.; Brocca, L. Initial soil water content as input to field-scale infiltration and surface runoff models. Water Resour. Manag. 2012, 26, 1793–1807. [Google Scholar] [CrossRef]
  28. Naz, B.S.; Kollet, S.; Franssen, H.J.H.; Montzka, C.; Kurtz, W. A 3 km spatially and temporally consistent European daily soil moisture reanalysis from 2000 to 2015. Sci. Data 2015, 7, 1–14. [Google Scholar] [CrossRef] [PubMed] [Green Version]
  29. Rowlandson, T.L.; Berg, A.A.; Bullock, P.R.; Ojo, E.R.; McNairn, H.; Wiseman, G.; Cosh, M.H. Evaluation of several calibration procedures for a portable soil moisture sensor. J. Hydrol. 2013, 498, 335–344. [Google Scholar] [CrossRef]
  30. Robinson, D.A.; Gardner, C.M.K.; Cooper, J.D. Measurement of relative permittivity in sandy soils using TDR, capacitance and theta probes: Comparison, including the effects of bulk soil electrical conductivity. J. Hydrol. 1999, 223, 198–211. [Google Scholar] [CrossRef]
  31. Bogena, H.R.; Huisman, J.A.; Oberdörster, C.; Vereecken, H. Evaluation of a low-cost soil water content sensor for wireless network applications. J. Hydrol. 2007, 344, 32–42. [Google Scholar] [CrossRef]
  32. Domínguez-Niño, J.M.; Bogena, H.R.; Huisman, J.A.; Schilling, B.; Casadesús, J. On the accuracy of factory-calibrated low-cost soil water content sensors. Sensors 2019, 19, 3101. [Google Scholar] [CrossRef] [Green Version]
  33. Jiménez-de-Santiago, D.E.; Lidón, A.; Bosch-Serra, À.D. Soil water dynamics in a rainfed Mediterranean agricultural system. Water 2019, 11, 799. [Google Scholar] [CrossRef] [Green Version]
  34. Ferrarezi, R.S.; Nogueira, T.A.R.; Zepeda, S.G.C. Performance of Soil Moisture Sensors in Florida Sandy Soils. Water 2020, 12, 358. [Google Scholar] [CrossRef] [Green Version]
  35. Kim, H.; Cosh, M.H.; Bindlish, R.; Lakshmi, V. Field evaluation of portable soil water content sensors in a sandy loam. Vadose Zone J. 2020, 19, e20033. [Google Scholar] [CrossRef]
  36. ElNesr, M.N.; Alazba, A.A.; El-Farrah, M.A. Correcting inaccurately recorded data due to faulty calibration of a capacitance water content probe. Appl. Environ. Soil Sci. 2013, 530732. [Google Scholar] [CrossRef] [Green Version]
  37. Shaikh, J.; Yamsani, S.K.; Sekharan, S.; Rakesh, R.R. Performance Evaluation of Profile Probe for Continuous Monitoring of Volumetric Water Content in Multilayered Cover System. J. Environ. Eng. 2018, 144, 04018078. [Google Scholar] [CrossRef]
  38. ASTM D422-63(2007)e2. Standard Test Method for Particle-Size Analysis of Soils; ASTM International: West Conshohocken, PA, USA, 2007; Available online: https://www.astm.org/Standards/D422 (accessed on 30 October 2020).
  39. ASTM D2974—20e1. Standard Test Method for Particle-Size Analysis of Soils; ASTM International: West Conshohocken, PA, USA, 2019; Available online: https://www.astm.org/Standards/D2974.htm (accessed on 30 October 2020).
  40. Delta-T Devices Ltd. User Manual for the Profile Probe, Type PR2; Delta-T Devices Ltd.: Cambridge, UK, 2008; 48p, Available online: https://www.delta-t.co.uk/wp-content/uploads/2017/02/PR2_user_manual_version_5.0.pdf (accessed on 30 October 2020).
  41. Topp, G.C.; Davis, J.L.; Annan, A.P. Electromagnetic determination of soil water content: Measurement in coaxial transmission lines. Water Resour. Res. 1980, 16, 579–582. [Google Scholar] [CrossRef] [Green Version]
  42. Rüdiger, C.; Western, A.W.; Walker, J.P.; Smith, A.B.; Kalma, J.D.; Willgoose, G.R. Towards a general equation for frequency domain reflectometers. J. Hydrol. 2010, 383, 319–329. [Google Scholar] [CrossRef]
  43. Sevostianova, E.; Deb, S.; Serena, M.; VanLeeuwen, D.; Leinauer, B. Accuracy of two electromagnetic soil water content sensors in saline soils. Soil Sci. Soc. Am. J. 2015, 79, 1752–1759. [Google Scholar] [CrossRef]
  44. Vaz, C.M.; Jones, S.; Meding, M.; Tuller, M. Evaluation of standard calibration functions for eight electromagnetic soil moisture sensors. Vadose Zone J. 2013, 12, 1–16. [Google Scholar] [CrossRef]
  45. ASTM D3385-18. Standard Test Method for Infiltration Rate of Soils in Field Using Double-Ring Infiltrometer; ASTM International: West Conshohocken, PA, USA, 2018; Available online: https://www.astm.org/Standards/D3385.htm (accessed on 30 October 2020).
  46. Fatehnia, M.; Tawfiq, K.; Ye, M. Estimation of saturated hydraulic conductivity from double-ring infiltrometer measurements. Eur. J. Soil Sci. 2016, 67, 135–147. [Google Scholar] [CrossRef]
  47. Fredlund, D.G.; Rahardjo, H. Soil Mechanics for Unsaturated Soils; John Wiley & Sons: New York, NY, USA, 1993. [Google Scholar]
  48. Lu, N.; Likos, W.J. Unsaturated Soil Mechanics; John Wiley: New York, NY, USA, 2004; 556p. [Google Scholar]
  49. Wang, L.; Cao, Z.J.; Li, D.Q.; Phoon, K.K.; Au, S.K. Determination of site-specific soil-water characteristic curve from a limited number of test data–A Bayesian perspective. Geosci. Front. 2018, 9, 1665–1677. [Google Scholar] [CrossRef]
  50. Saxton, K.E.; Rawls, W.J. Soil water characteristic estimates by texture and organic matter for hydrologic solutions. Soil Sci. Soc. Am. J. 2006, 70, 1569–1578. [Google Scholar] [CrossRef] [Green Version]
  51. Saxton, K.E.; Rawls, W.J.; Romberger, J.S.; Papendick, R.I. Estimating generalized soil water characteristics from texture. Trans. Am. Soc. Agric. Eng. 1986, 50, 1031–1035. [Google Scholar]
  52. Di Matteo, L. Liquid limit of low-to medium-plasticity soils: Comparison between Casagrande cup and cone penetrometer test. Bull. Eng. Geol. Environ. 2012, 71, 79–85. [Google Scholar] [CrossRef]
  53. Horton, R.E. An approach toward a physical interpretation of infiltration capacity. Proc. Soil Sci. Soc. Am. 1940, 5, 399–417. [Google Scholar] [CrossRef]
  54. Fetter, C.W. Applied Hydrogeology; Waveland Press Inc.: New York, NY, USA, 2001. [Google Scholar]
  55. Kargas, G.; Londra, P.; Anastasatou, M.; Moustakas, N. The Effect of Soil Iron on the Estimation of Soil Water Content Using Dielectric Sensors. Water 2020, 12, 598. [Google Scholar] [CrossRef] [Green Version]
  56. Gubbiotti, F. Determinazione Sperimentale della Conducibilità Termica nei Materiali Sabbiosi in Funzione del Grado di Addensamento e del Contenuto in Acqua. Master’s Thesis, Università degli Studi di Perugia, Perugia, Italy, 2019. Unpublished. [Google Scholar]
  57. Robinson, D.A.; Bell, J.; Batchelor, C. Influence of iron minerals on the determination of soil water content using dielectric techniques. J. Hydrol. 1994, 161, 169–180. [Google Scholar] [CrossRef]
  58. Haga, H.; Matsumoto, Y.; Matsutani, J.; Fujita, M.; Nishida, K.; Sakamoto, Y. Flow paths, rainfall properties, and antecedent soil moisture controlling lags to peak discharge in a granitic unchanneled catchment. Water Resour. Res. 2005, 41, W12410. [Google Scholar] [CrossRef]
  59. Penna, D.; Mantese, N.; Hopp, L.; Dalla Fontana, G.; Borga, M. Spatio-temporal variability of piezometric response on two steep alpine hillslopes. Hydrol. Process. 2015, 29, 198–211. [Google Scholar] [CrossRef]
  60. Scaife, C.I.; Band, L.E. Nonstationarity in threshold response of stormflow in southern Appalachian headwater catchments. Water Resour. Res. 2017, 53, 6579–6596. [Google Scholar] [CrossRef]
  61. Keesstra, S.; Nunes, J.P.; Saco, P.; Parsons, T.; Poeppl, R.; Masselink, R.; Cerdà, A. The way forward: Can connectivity be useful to design better measuring and modelling schemes for water and sediment dynamics? Sci. Total Environ. 2018, 644, 1557–1572. [Google Scholar] [CrossRef]
  62. Zhao, L.; Hou, R.; Wu, F.; Keesstra, S. Effect of soil surface roughness on infiltration water, ponding and runoff on tilled soils under rainfall simulation experiments. Soil Tillage Res. 2018, 179, 47–53. [Google Scholar] [CrossRef]
  63. Tóth, G.; Hermann, T.; da Silva, M.R.; Montanarella, L. Monitoring soil for sustainable development and land degradation neutrality. Environ. Monit. Assess. 2018, 190, 57. [Google Scholar] [CrossRef] [PubMed] [Green Version]
  64. Morvan, X.; Saby, N.P.A.; Arrouays, D.; Le Bas, C.; Jones, R.J.A.; Verheijen, F.G.A.; Bellamy, P.H.; Stephens, M.; Kibblewhite, M.G. Soil monitoring in Europe: A review of existing systems and requirements for harmonization. Sci. Total Environ. 2008, 391, 1–12. [Google Scholar] [CrossRef] [PubMed]
  65. Dexter, A.R. Soil physical quality: Part I. Theory, effects of soil texture, density, and organic matter, and effects on root growth. Geoderma 2004, 120, 201–214. [Google Scholar] [CrossRef]
  66. Di Prima, S.; Rodrigo-Comino, J.; Novara, A.; Iovino, M.; Pirastru, M.; Keesstra, S.; Cerdà, A. Soil physical quality of citrus orchards under tillage, herbicide, and organic managements. Pedosphere 2018, 28, 463–477. [Google Scholar] [CrossRef] [Green Version]
Figure 1. (a) Location of the experimental field; (b) sketch of the survey site with the instruments used for the reconstruction of the geological model and for the monitoring of the infiltration process (DPSH = Dynamic Probe Super Heavy; S5 and S6 = sampling sites, P1 = PR2/6 profile probe); (c) lithological section with the details of the DPSH1 profile.
Sustainability 13 00227 g001
Figure 2. Step-by-step procedure for the calibration of PR2/6 probe used in this research. The compaction procedure used to compact soil in the column refers to [23].
Sustainability 13 00227 g002
Figure 3. Calibration curves for sandy soils of different nature (the main characteristics of soils are in Table 1). θ values are obtained on soil samples by the gravimetric method using Equation (3), following the procedure in Figure 2. (1) data obtained with the PR2/6 probe (taken from [23]); (2) unpublished data obtained with the PR2/6 probe (soil from Paglia River, Central Italy); (3) data obtained with the Theta probe (taken from [30]). PR2/6 and Theta probes work at the same frequency (100 MHz), and θ values are estimated from voltage outputs of sensors.
Sustainability 13 00227 g003
Figure 4. Hydraulic properties of soil SB outcropping in the experimental field. (a) Soil Water Characteristic Curve (SWCC) and hydraulic conductivity curves as modeled by the Soil Water Characteristic software [50]. (b) Infiltration rate obtained with the DRI test.
Sustainability 13 00227 g004
Figure 5. Daily rainfall and temperature data in the experimental field (Ponte Felcino weather station 2 probe) (a). Monthly rainfall data compared to the historical mean (b).
Sustainability 13 00227 g005
Figure 6. Profiles of volumetric water content (θ), effective degree of saturation (Se), and matric suction (ua − uw) for soil SB. The dashed red and blue curves are based on estimates of θ by using calibrated parameters (ao = 1.9 and a1 = 10.6) and manufacturer parameters (ao = 1.6 and a1 = 8.4), respectively. (a,e,i) Profiles recorded on 26 April 2018; (b,f,j) 12 May 2018; (c,g,k) 16 May 2018; (d,h,l) 20 May 2018.
Sustainability 13 00227 g006
Table 1. Geotechnical and mineralogical properties of soils. OM = Organic Matter according to ASTM standard [38]. Particle size distribution according to ASTM standard [39].
NameSourceOriginGrain Size (%)OM
(%)
Mineralogy
SandSiltClay
Soil SA[23]Nera River
(Central Italy)
95.253.451.300.37Carbonates with subordinate minerals (muscovite, gypsum)
Soil SB[23]Tiber River
(Central Italy)
82.4114.5931.53Flyschoid sand
(quartz, calcite, albite, chlorite muscovite, pyrite, and orthoclase)
Soil SCUnpublished dataPaglia River
(Central Italy)
94.613.901.490.23-
Soil 1[30]England and Northern Ireland99.3000.700.36Quartz
Soil 2[30]England and Northern Ireland97.202.400.401.07Quartz
Soil 3[30]England and Northern Ireland66.201.101.031.03Quartz
(>5% iron oxide/Kaolinite)
Soil 4[30]England and Northern Ireland95.504.200.302.06Quartz
Publisher’s Note: MDPI stays neutral with regard to jurisdictional claims in published maps and institutional affiliations.

