Evaluating Disruptive Innovation Project Management Capabilities


Abstract
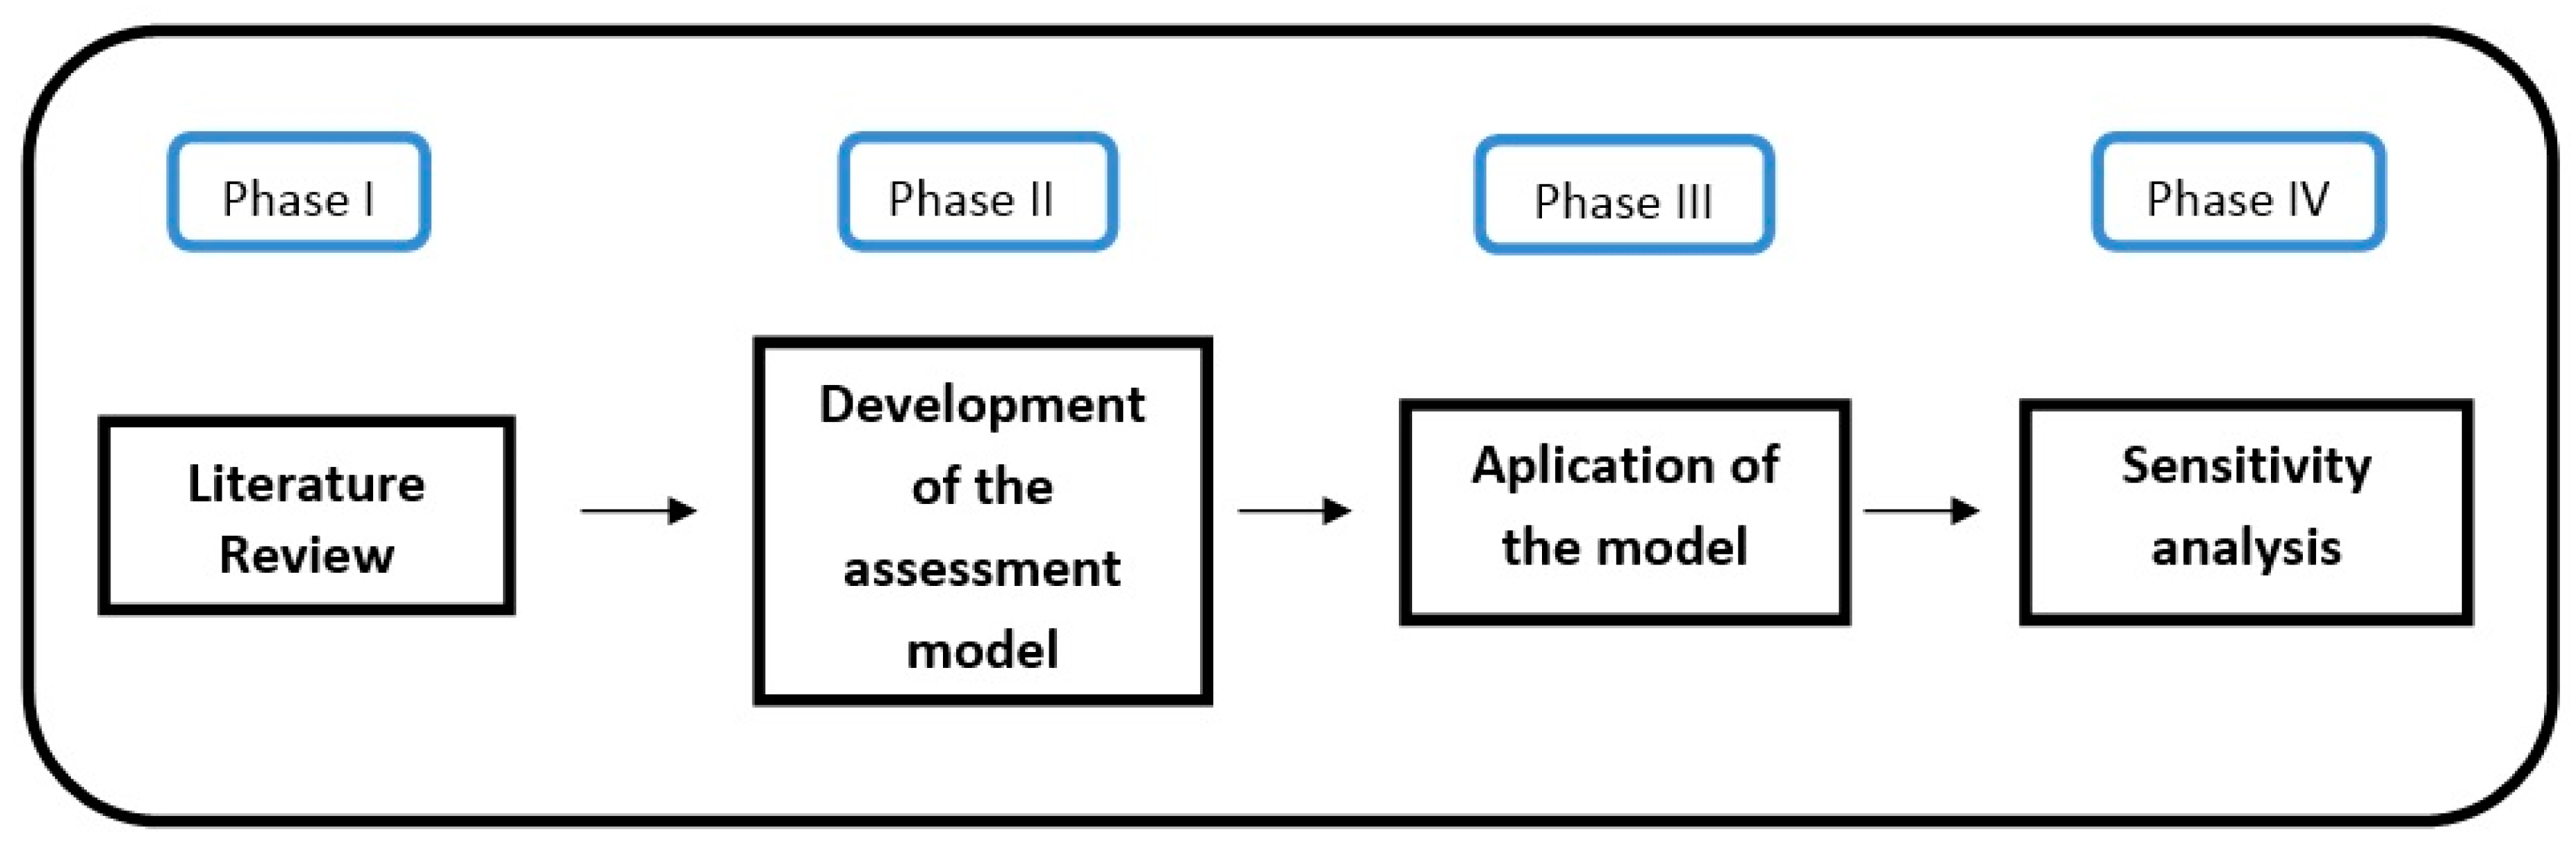
:1. Introduction
2. Phase 1: Literature Review
2.1. Results of the Literature Review
2.1.1. The Concept of Disruptive Innovation
- They have characteristics that are undesirable among other segments of users;
- Their technologies are unsuitable for use in mainstream applications;
- They are technologies that make the appearance of new markets possible;
- At first sight they appear cheaper and simpler than the mainstream applications;
- They anticipate future client needs, permitting a group of consumers to access a product or service to which they earlier had no access.
2.1.2. Evaluation of the Disruptiveness of an Innovation
2.1.3. The Concept of Disruptive Business Model
- Decentralized model: model of person-to-person interaction where consumers no longer need an intermediary body that centralizes the provision of goods and services, but do so directly between each other through digital platforms [56].
- The pop-up economy and superfluous markets: models that open up new markets and that transform our understanding of firms and markets, facilitating decision-making, automation, robotization and new manufacturing modalities [57].
3. Phase II: Methodology
- Definition of the evaluation tree, by means of a semi-systematic literature review.
- Quantification of the evaluation tree, calculating the weights by means of AHP pairwise comparison and characterization of the indicators by the design of the value functions or value tables.
- Application of the model to two case studies
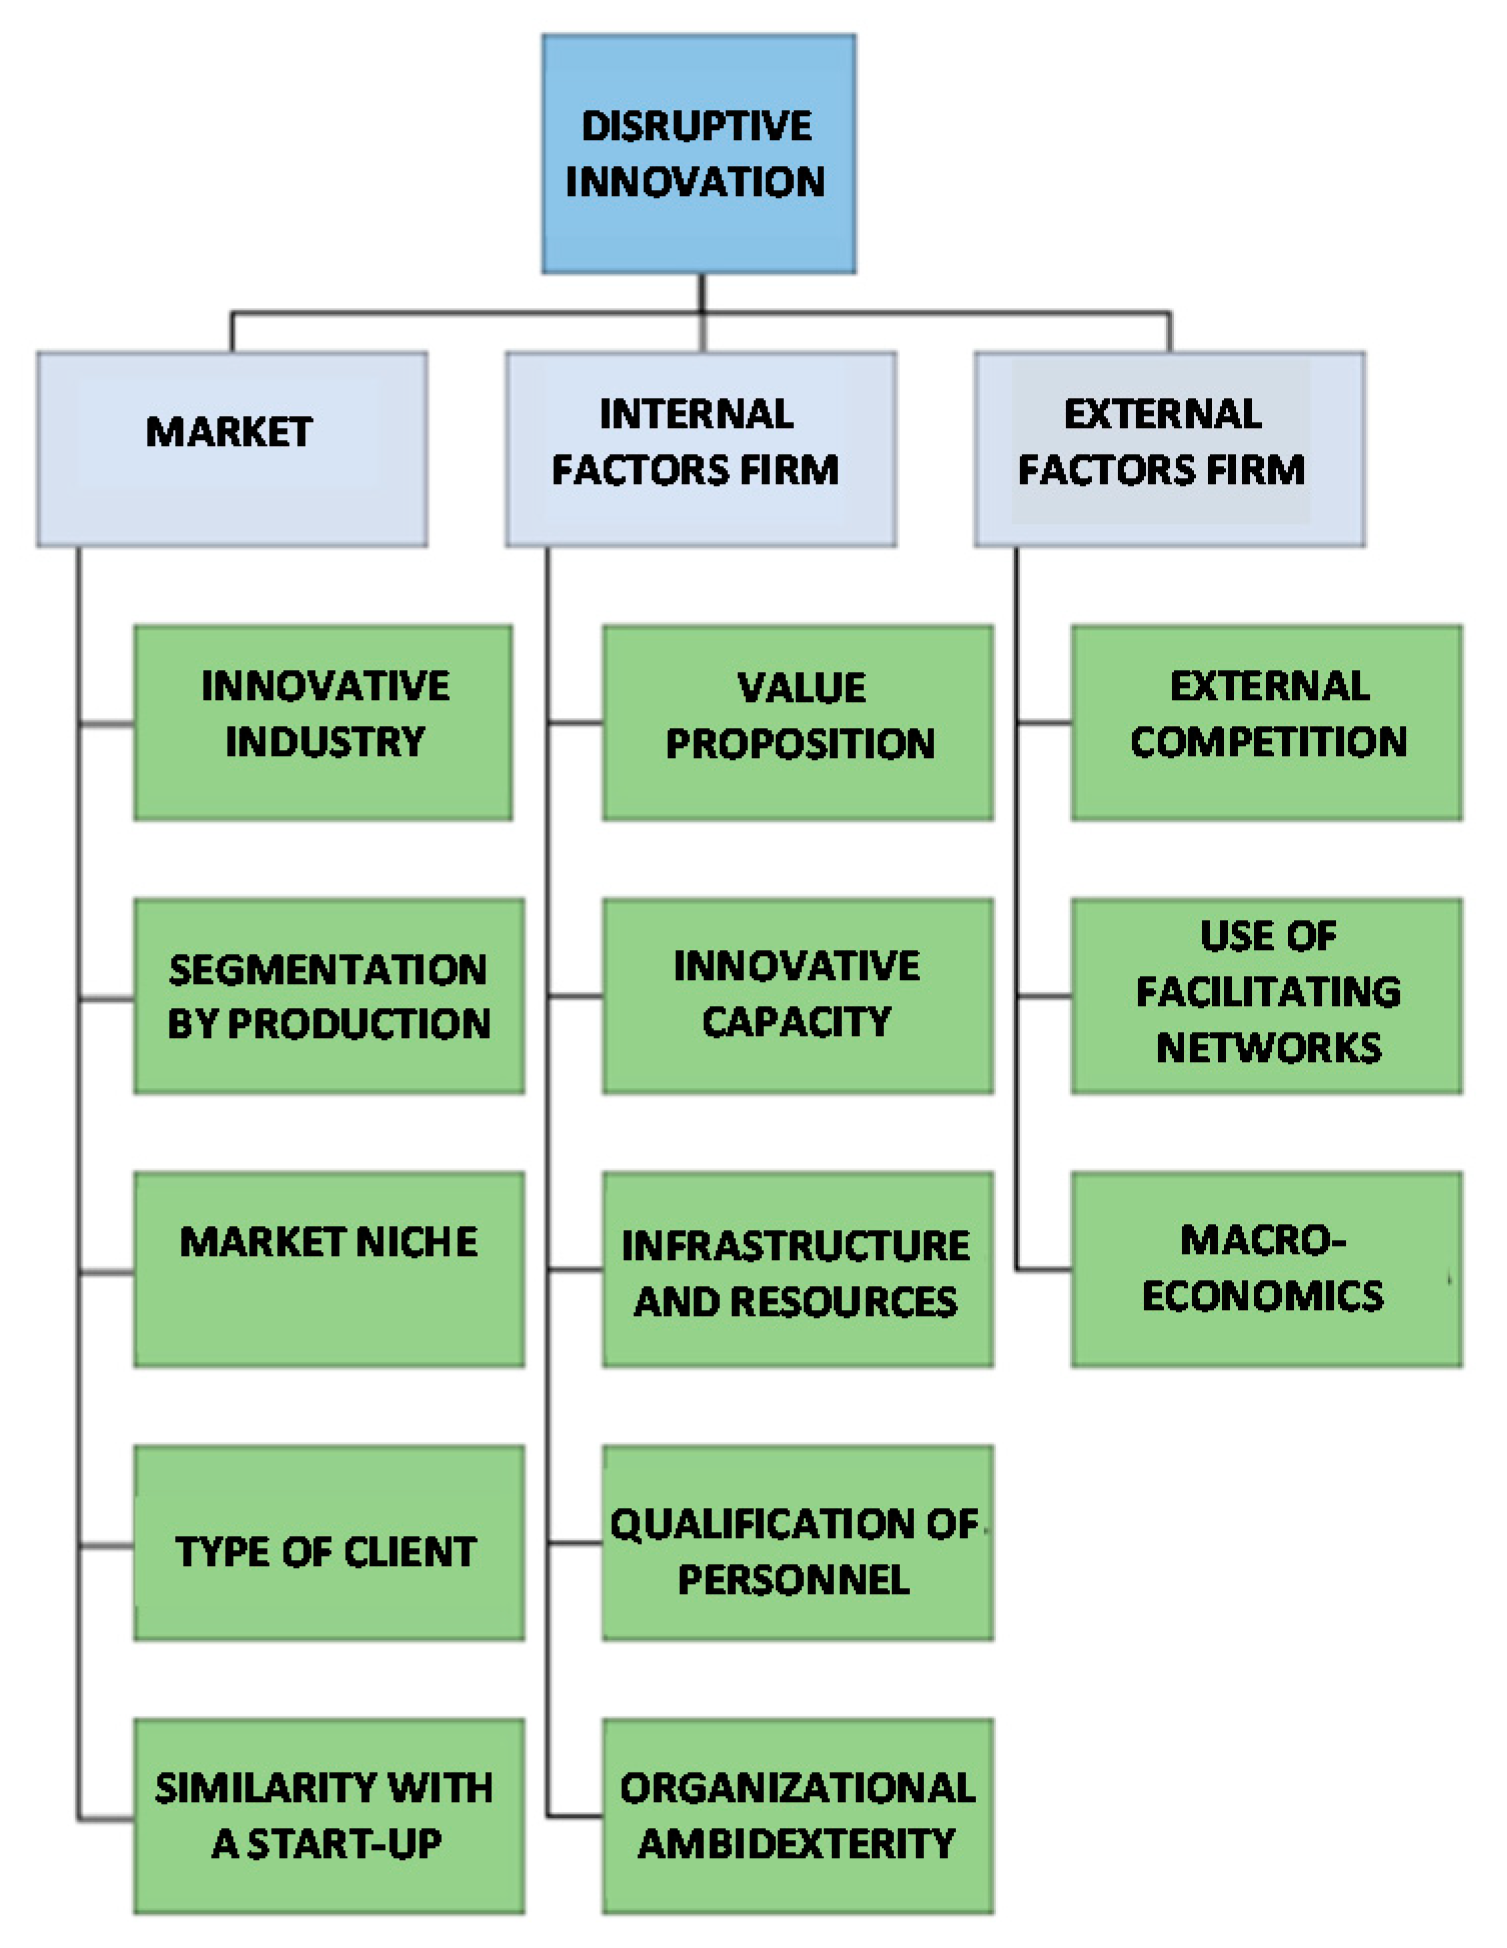
3.1. Definition of the Evaluation Tree
3.2. Description of the Criteria and Indicators
3.2.1. Market
Innovative Industry Indicator
Segmentation by Production Indicator
- (1)
- Market-directed innovation: entrepreneurial projects directed at designing products that respond to market gaps.
- (2)
- Innovation directed by the technology or by the product: the entrepreneurial project offers a new technology or product that the business is trying to place on the market or to pioneer its entry into the market.
Niche Market Indicator
Type of Client Indicator
Similarity to a Startup Indicator
3.2.2. Internal Factors of the Firm
Value Proposition Indicator
Innovation Capacity Indicator
Infrastructure and Resources Indicator
Qualification of Personnel Indicator
Organizational Ambidexterity Indicator
3.2.3. External Factors to the Firm
External Competitiveness Indicator
Use of Facilitating Networks Indicator
Macroeconomic Indicator
3.3. Description and Valuation of the Set of Indicators
4. Phase III: Application of the Model to Various Firms
4.1. Firm 1: Machine-Tooling Sector
4.2. Firm 2: Construction Sector
5. Results and Discussion
5.1. Innovative Industry
5.2. Segmentation by Production
5.3. Niche Market
5.4. Client Type
5.5. Similarity to a Startup
5.6. Value Proposition
5.7. Innovation Capacity
5.8. Infrastructure and Resources
5.9. Qualification of Personnel
5.10. Organizational Ambidexterity
5.11. External Competitiveness
5.12. Use of Facilitating Networks
5.13. Macroeconomy
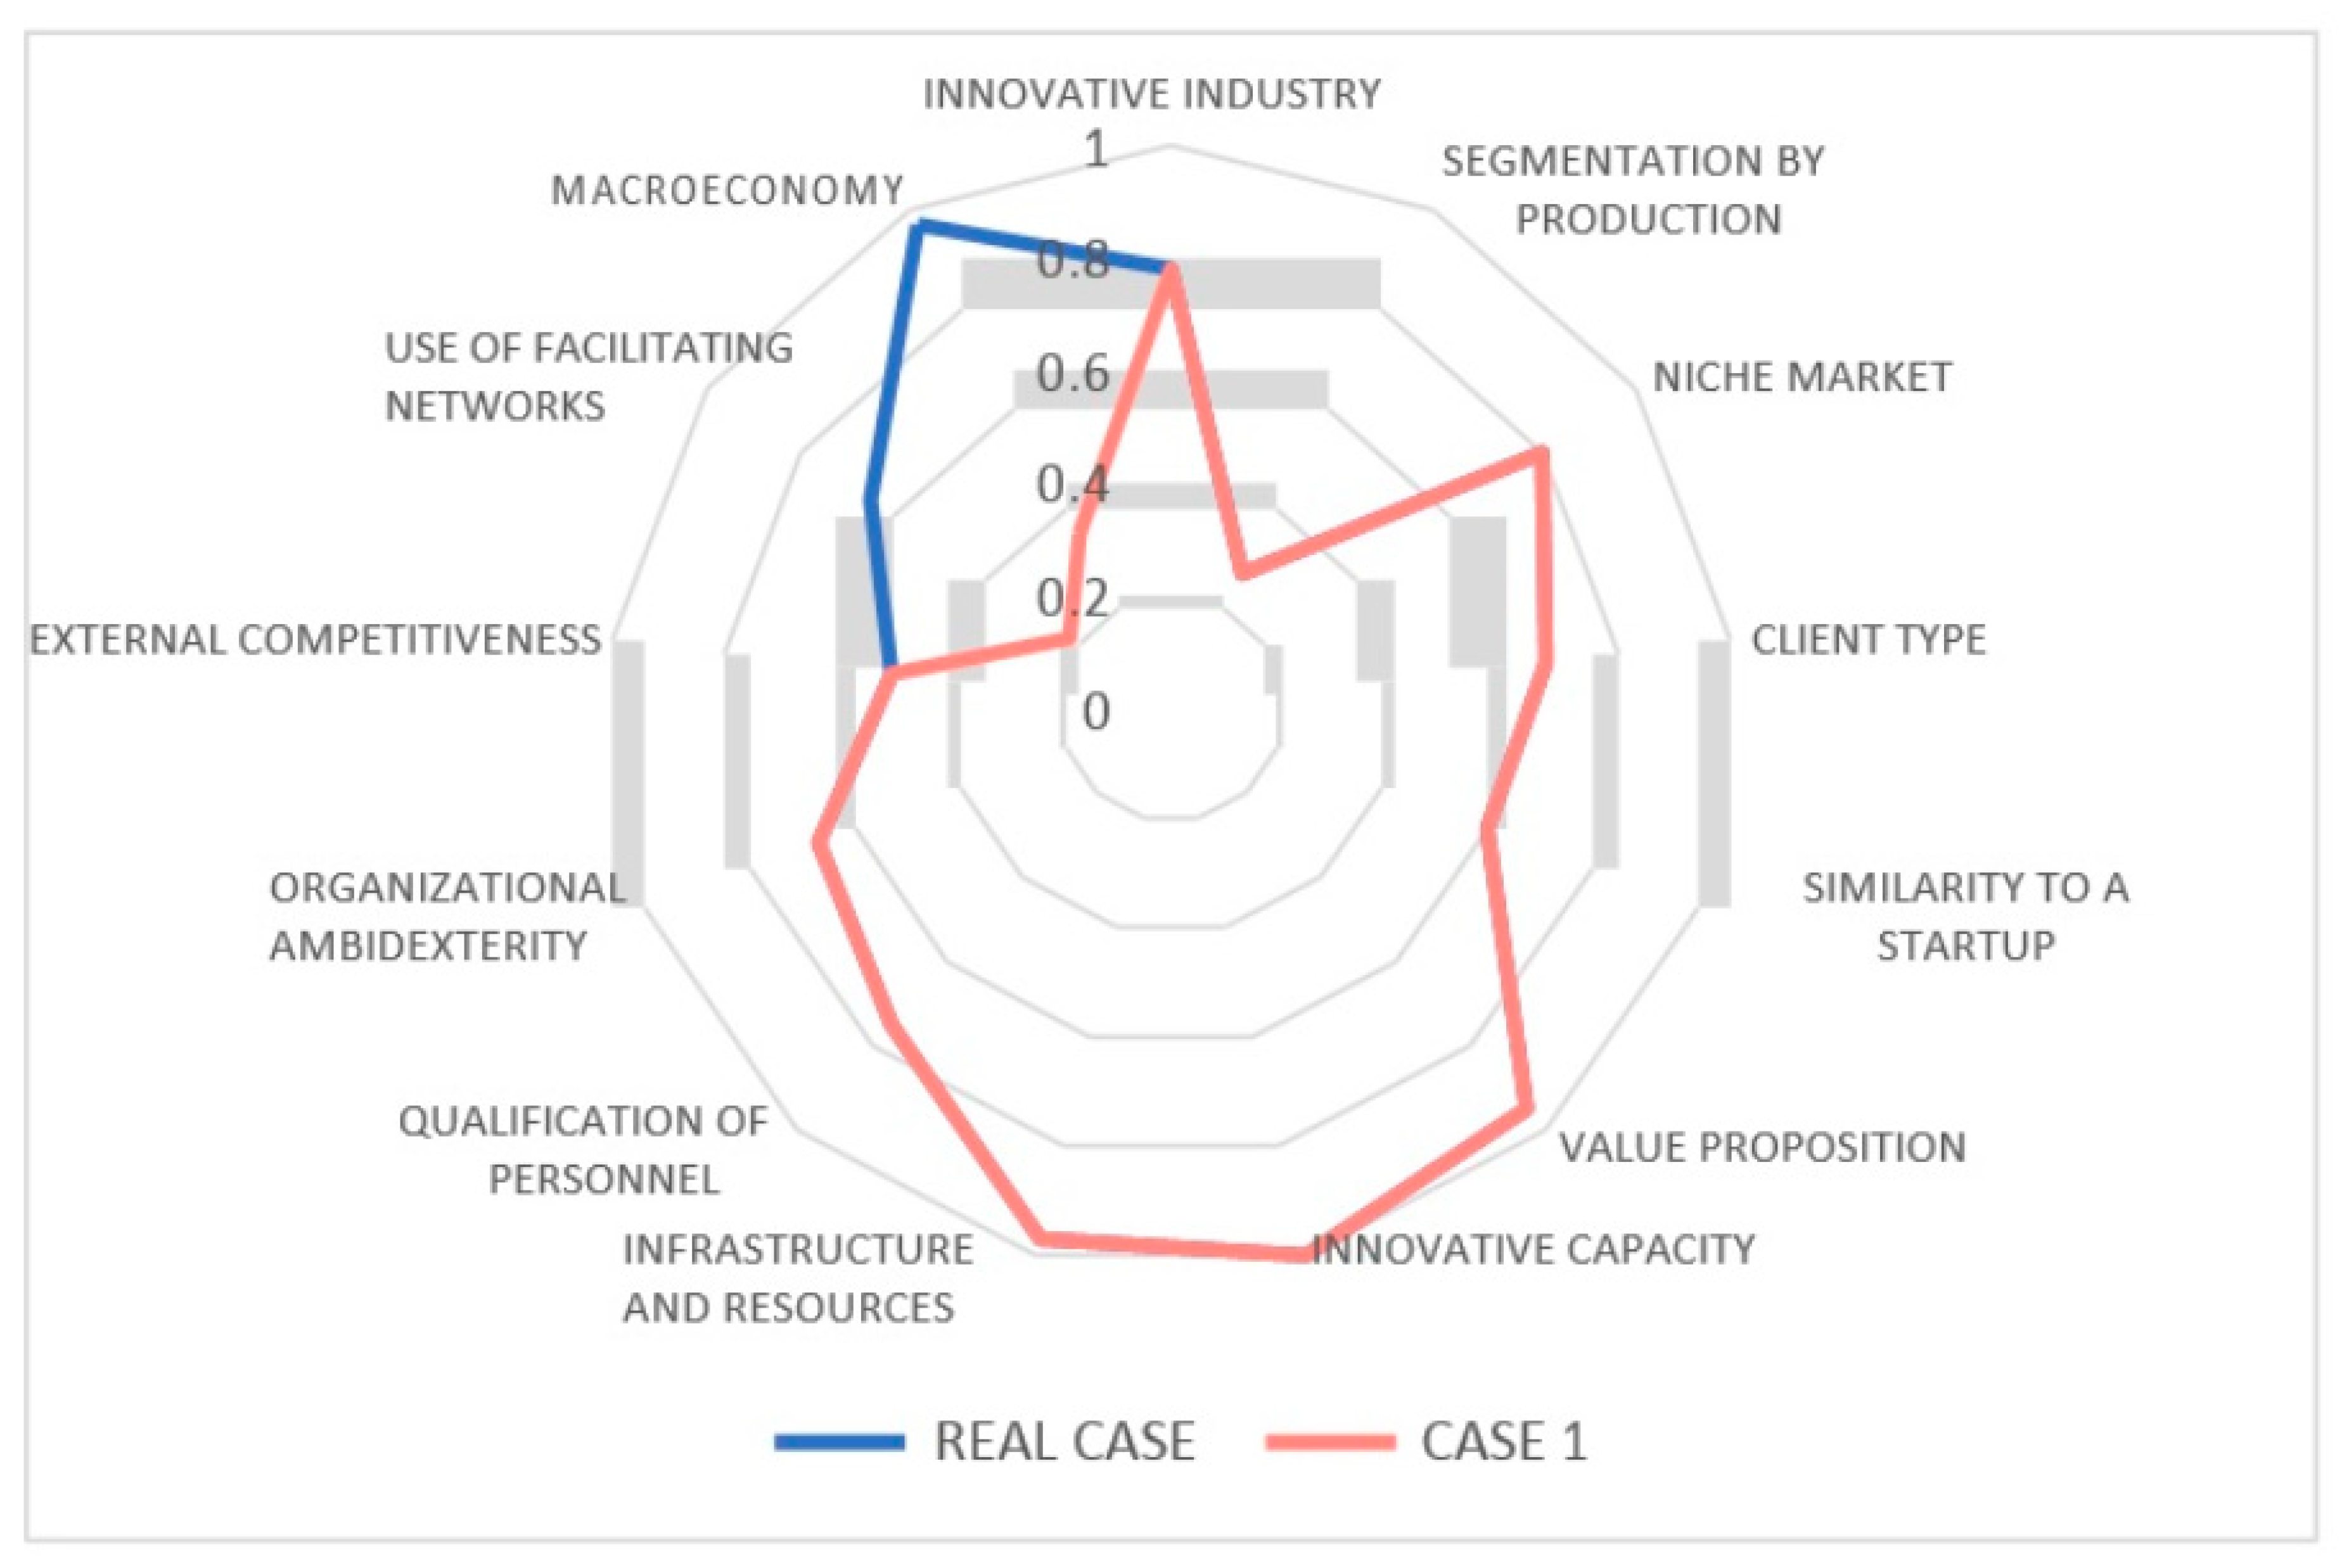
6. Phase IV: Sensitivity Analysis
7. Conclusions
8. Limitations and Future Lines of Work
Author Contributions
Funding
Institutional Review Board Statement
Informed Consent Statement
Data Availability Statement
Acknowledgments
Conflicts of Interest
References
- Christensen, C.; Johnston, C.; Barragree, A. After the Gold Rush: Patterns of Success and Failure on the Internet; Innosight, LLC: Lexington, MA, USA, 2000. [Google Scholar]
- Si, S.; Chen, H.; Liu, W.; Yan, Y. Disruptive Innovation, Business Model and Sharing Economy: The Bike-Sharing Cases in China. Manag. Decis. 2020. [Google Scholar] [CrossRef]
- Rasool, F.; Koomsap, P.; Afsar, B.; Panezai, B.A. A Framework for Disruptive Innovation. Foresight 2018. [Google Scholar] [CrossRef]
- Cozzolino, A.; Verona, G.; Rothaermel, F.T. Unpacking the Disruption Process: New Technology, Business Models, and Incumbent Adaptation. J. Manag. Stud. 2018, 55, 1166–1202. [Google Scholar] [CrossRef]
- Parida, V.; Sjödin, D.R.; Lenka, S.; Wincent, J. Developing Global Service Innovation Capabilities: How Global Manufacturers Address the Challenges of Market Heterogeneity. Res. Technol. Manag. 2015, 58, 35–44. [Google Scholar] [CrossRef] [Green Version]
- Project Management Institute. The Innovation Imperative; Project Management Institute: Newtown Square, PA, USA, 2020. [Google Scholar]
- Calabrò, A.; Vecchiarini, M.; Gast, J.; Campopiano, G.; De Massis, A.; Kraus, S. Innovation in Family Firms: A Systematic Literature Review and Guidance for Future Research. Int. J. Manag. Rev. 2019, 21, 317–355. [Google Scholar] [CrossRef]
- Wang, N.; Yao, S.; Wu, G.; Chen, X. The Role of Project Management in Organisational Sustainable Growth of Technology-Based Firms. Technol. Soc. 2017, 51, 124–132. [Google Scholar] [CrossRef]
- Guo, J.; Pan, J.; Guo, J.; Gu, F.; Kuusisto, J. Measurement Framework for Assessing Disruptive Innovations. Technol. Forecast. Soc. Chang. 2019, 139, 250–265. [Google Scholar] [CrossRef]
- Keller, A.; Hüsig, S. Ex Ante Identification of Disruptive Innovations in the Software Industry Applied to Web Applications: The Case of Microsoft’s Vs. Google’s Office Applications. Technol. Forecast. Soc. Chang. 2009, 76, 1044–1054. [Google Scholar] [CrossRef]
- Rafii, F.; Kampas, P.J. How to Identify Your Enemies before they Destroy You. Harv. Bus. Rev. 2002, 80, 115–123, 134. [Google Scholar]
- Si, S.; Chen, H. A Literature Review of Disruptive Innovation: What it is, how it Works and Where it Goes. J. Eng. Technol. Manag. 2020, 56, 101568. [Google Scholar] [CrossRef]
- Sainio, L.; Puumalainen, K. Evaluating Technology Disruptiveness in a Strategic Corporate Context: A Case Study. Technol. Forecast. Soc. Chang. 2007, 74, 1315–1333. [Google Scholar] [CrossRef]
- Hüsig, S.; Hipp, C.; Dowling, M. Analysing Disruptive Potential: The Case of Wireless Local Area Network and Mobile Communications Network Companies. R D Manag. 2005, 35, 17–35. [Google Scholar] [CrossRef]
- Si, S.; Zahra, S.A.; Wu, X.; Jeng, D.J. Disruptive Innovation and Entrepreneurship in Emerging Economics. J. Eng. Technol. Manag. 2020, 58, 101601. [Google Scholar] [CrossRef]
- Schiavi, G.S.; Behr, A.; Marcolin, C.B. Conceptualizing and Qualifying Disruptive Business Models. RAUSP Manag. J. 2019, 54, 269–286. [Google Scholar] [CrossRef]
- Wang, Z.; Ling, J.; Chok, J.I. Relational Embeddedness and Disruptive Innovations: The Mediating Role of Absorptive Capacity. J. Eng. Technol. Manag. 2020, 57, 101587. [Google Scholar] [CrossRef]
- Govindarajan, V.; Kopalle, P.K. The Usefulness of Measuring Disruptiveness of Innovations Ex Post in Making Ex Ante Predictions. J. Prod. Innov. Manag. 2006, 23, 12–18. [Google Scholar] [CrossRef]
- De Almeida Pereira, S.; Imbrizi, F.G.; de Freitas, A.D.G.; Alvarenga, M.A. Business Model as an Inducer of Disruptive Innovations: The Case of Gol Airlines. Int. J. Innov. 2015, 3, 28–42. [Google Scholar] [CrossRef]
- Hardman, S.; Steinberger-Wilckens, R.; van der Horst, D. Disruptive Innovations: The Case for Hydrogen Fuel Cells and Battery Electric Vehicles. Int. J. Hydrog. Energy 2013, 38, 15438–15451. [Google Scholar] [CrossRef]
- Klenner, P.; Hüsig, S.; Dowling, M. Ex-Ante Evaluation of Disruptive Susceptibility in Established Value networks—When are Markets Ready for Disruptive Innovations? Res. Policy 2013, 42, 914–927. [Google Scholar] [CrossRef]
- Dijk, M.; Wells, P.; Kemp, R. Will the Momentum of the Electric Car Last? Testing an Hypothesis on Disruptive Innovation. Technol. Forecast. Soc. Chang. 2016, 105, 77–88. [Google Scholar] [CrossRef] [Green Version]
- Brad, S.; Murar, M.; Brad, E. Methodology for Lean Design of Disruptive Innovations. Procedia CIRP 2016, 50, 153–159. [Google Scholar] [CrossRef] [Green Version]
- Nagy, D.; Schuessler, J.; Dubinsky, A. Defining and Identifying Disruptive Innovations. Ind. Mark. Manag. 2016, 57, 119–126. [Google Scholar] [CrossRef]
- Spieth, P.; Schneider, S. Business Model Innovativeness: Designing a Formative Measure for Business Model Innovation. J. Bus. Econ. 2016, 86, 671–696. [Google Scholar] [CrossRef]
- Schiavi, G.S.; Behr, A. Emerging Technologies and New Business Models: A Review on Disruptive Business Models. Innov. Manag. Rev. 2018, 15, 338–355. [Google Scholar] [CrossRef] [Green Version]
- Foss, N.J.; Saebi, T. Fifteen Years of Research on Business Model Innovation: How Far have we Come, and Where should we Go? J. Manag. 2017, 43, 200–227. [Google Scholar] [CrossRef] [Green Version]
- Habtay, S.R. A Firm-level Analysis on the Relative Difference between Technology-driven and Market-driven Disruptive Business Model Innovations. Creat. Innov. Manag. 2012, 21, 290–303. [Google Scholar] [CrossRef]
- Mitchell, D.W.; Coles, C.B. Business Model Innovation Breakthrough Moves. J. Bus. Strategy 2004, 25, 16–27. [Google Scholar] [CrossRef]
- Santos, J.; Spector, B.; Van der Heyden, L. Toward a Theory of Business Model Innovation within Incumbent Firms; INSEAD: Fontainebleau, France, 2009. [Google Scholar]
- Mao, J.; Su, F.; Wang, B.; Jarvenpaa, S.L. Responding in Kind: How do Incumbent Firms Swiftly Deal with Disruptive Business Model Innovation? J. Eng. Technol. Manag. 2020, 57, 101591. [Google Scholar] [CrossRef]
- Markides, C. Disruptive Innovation: In Need of Better Theory. J. Prod. Innov. Manag. 2006, 23, 19–25. [Google Scholar] [CrossRef]
- Karimi, J.; Walter, Z. Corporate Entrepreneurship, Disruptive Business Model Innovation Adoption, and its Performance: The Case of the Newspaper Industry. Long Range Plan. 2016, 49, 342–360. [Google Scholar] [CrossRef]
- Sosna, M.; Trevinyo-Rodríguez, R.N.; Velamuri, S.R. Business Model Innovation through Trial-and-Error Learning: The Naturhouse Case. Long Range Plan. 2010, 43, 383–407. [Google Scholar] [CrossRef]
- Aspara, J.; Hietanen, J.; Tikkanen, H. Business Model Innovation Vs Replication: Financial Performance Implications of Strategic Emphases. J. Strateg. Mark. 2010, 18, 39–56. [Google Scholar] [CrossRef]
- Yunus, M.; Moingeon, B.; Lehmann-Ortega, L. Building Social Business Models: Lessons from the Grameen Experience. Long Range Plan. 2010, 43, 308–325. [Google Scholar] [CrossRef]
- Sorescu, A.; Frambach, R.T.; Singh, J.; Rangaswamy, A.; Bridges, C. Innovations in Retail Business Models. J. Retail. 2011, 87, S3–S16. [Google Scholar] [CrossRef]
- Amit, R.; Zott, C. Value Creation in E-business. Strateg. Manag. J. 2001, 22, 493–520. [Google Scholar] [CrossRef]
- Bucherer, E.; Eisert, U.; Gassmann, O. Towards Systematic Business Model Innovation: Lessons from Product Innovation Management. Creat. Innov. Manag. 2012, 21, 183–198. [Google Scholar] [CrossRef]
- Khanagha, S.; Volberda, H.; Oshri, I. Business Model Renewal and Ambidexterity: Structural Alteration and Strategy Formation Process during Transition to a C Loud Business Model. R D Manag. 2014, 44, 322–340. [Google Scholar] [CrossRef]
- Casadesus-Masanell, R.; Zhu, F. Business Model Innovation and Competitive Imitation: The Case of Sponsor-based Business Models. Strateg. Manag. J. 2013, 34, 464–482. [Google Scholar] [CrossRef] [Green Version]
- Jin, B.E.; Shin, D.C. Changing the Game to Compete: Innovations in the Fashion Retail Industry from the Disruptive Business Model. Bus. Horiz. 2020, 63, 301–311. [Google Scholar] [CrossRef]
- Christensen, C.M. The Innovator’s Dilemma: When New Technologies Cause Great Firms to Fail; Harvard Business Review Press: Boston, MA, USA, 2013. [Google Scholar]
- Takamatsu, T.; Tomita, J. Disruptive Innovation. Ann. Bus. Adm. Sci. 2015, 14, 109–126. [Google Scholar] [CrossRef]
- Petzold, N.; Landinez, L.; Baaken, T. Disruptive Innovation from a Process View: A Systematic Literature Review. Creat. Innov. Manag. 2019, 28, 157–174. [Google Scholar] [CrossRef] [Green Version]
- Kostoff, R.N.; Boylan, R.; Simons, G.R. Disruptive Technology Roadmaps. Technol. Forecast. Soc. Chang. 2004, 71, 141–159. [Google Scholar] [CrossRef]
- Loza Matovelle, D.; Dabirian, R. Introducción a La Tecnología Disruptiva Y Su Implementación En Equipos Científicos. Rev. Politécnica 2015, 36, Y1. [Google Scholar]
- Hannibal, M.; Knight, G. Additive Manufacturing and the Global Factory: Disruptive Technologies and the Location of International Business. Int. Bus. Rev. 2018, 27, 1116–1127. [Google Scholar] [CrossRef]
- Anthony, S.D.; Johnson, M.W.; Sinfield, J.V.; Altman, E.J. The Innovator’s Guide to Growth: Putting Disruptive Innovation to Work; Harvard Business Press: Boston, MA, USA, 2008. [Google Scholar]
- Roy, R. Role of Relevant Lead Users of Mainstream Product in the Emergence of Disruptive Innovation. Technol. Forecast. Soc. Chang. 2018, 129, 314–322. [Google Scholar] [CrossRef]
- Paniagua, E. Future Trens Forum—Modelos De Negocios Disruptivos; Fundación Bankinter: Madrid, Spain, 2018. [Google Scholar]
- van den Broek, T.; van Veenstra, A.F. Governance of Big Data Collaborations: How to Balance Regulatory Compliance and Disruptive Innovation. Technol. Forecast. Soc. Chang. 2018, 129, 330–338. [Google Scholar] [CrossRef]
- Kaplan, A.; Haenlein, M. Digital Transformation and Disruption: On Big Data, Blockchain, Artificial Intelligence, and Other Things. Bus. Horiz. 2019, 62, 679–681. [Google Scholar] [CrossRef]
- Dogru, T.; Mody, M.; Suess, C. Adding Evidence to the Debate: Quantifying Airbnb’s Disruptive Impact on Ten Key Hotel Markets. Tour. Manag. 2019, 72, 27–38. [Google Scholar] [CrossRef]
- Guttentag, D.A.; Smith, S.L.J. Assessing Airbnb as a Disruptive Innovation Relative to Hotels: Substitution and Comparative Performance Expectations. Int. J. Hosp. Manag. 2017, 64, 1–10. [Google Scholar] [CrossRef] [Green Version]
- LEE Kuo Chuen, D.; Teo, E.G.S. Chapter 1—The Game of Dian Fu: The Rise of Chinese Finance. In Handbook of Blockchain, Digital Finance, and Inclusion; Lee Kuo Chuen, D., Deng, R., Eds.; Academic Press: Cambridge, MA, USA, 2018; pp. 1–36. [Google Scholar]
- Denis, G.; Alary, D.; Pasco, X.; Pisot, N.; Texier, D.; Toulza, S. From New Space to Big Space: How Commercial Space Dream is Becoming a Reality. Acta Astronaut. 2020, 166, 431–443. [Google Scholar] [CrossRef]
- del Caño, A.; Gómez, D.; de la Cruz, M.P. Uncertainty Analysis in the Sustainable Design of Concrete Structures: A Probabilistic Method. Constr. Build. Mater. 2012, 37, 865–873. [Google Scholar] [CrossRef]
- Hosseini, S.A.; Pons, O.; de la Fuente, A. A Combination of the Knapsack Algorithm and MIVES for Choosing Optimal Temporary Housing Site Locations: A Case Study in Tehran. Int. J. Disaster Risk Reduct. 2018, 27, 265–277. [Google Scholar] [CrossRef] [Green Version]
- Pons, O.; de la Fuente, A. Integrated Sustainability Assessment Method Applied to Structural Concrete Columns. Constr. Build. Mater. 2013, 49, 882–893. [Google Scholar] [CrossRef]
- Hosseini, S.A.; de la Fuente, A.; Pons, O. Multi-Criteria Decision-Making Method for Assessing the Sustainability of Post-Disaster Temporary Housing Units Technologies: A Case Study in Bam, 2003. Sustain. Cities Soc. 2016, 20, 38–51. [Google Scholar] [CrossRef]
- Piñero, I.; San-José, J.T.; Rodríguez, P.; Losáñez, M.M. Multi-Criteria Decision-Making for Grading the Rehabilitation of Heritage Sites. Application in the Historic Center of La Habana. J. Cult. Herit. 2017, 26, 144–152. [Google Scholar] [CrossRef]
- Saaty, T.L.; Vargas, L.G. The Seven Pillars of the Analytic Hierarchy Process. In Models, Methods, Concepts & Applications of the Analytic Hierarchy Process, 2nd ed.; Köksalan, M., Zionts, S., Eds.; Springer: New York, NY, USA, 2012; pp. 23–40. [Google Scholar]
- Saaty, T.L. Fundamentals of Decision Making and Priority Theory with the Analytic Hierarchy Process; Rws Publications: Pittsburgh, PA, USA, 2000. [Google Scholar]
- Li, M.; Porter, A.L.; Suominen, A. Insights into Relationships between Disruptive Technology/Innovation and Emerging Technology: A Bibliometric Perspective. Technol. Forecast. Soc. Chang. 2018, 129, 285–296. [Google Scholar] [CrossRef]
- Arora, A.; Fosfuri, A.; Gambardella, A. Los Mercados De Tecnologías En La Economía Del Conocimiento. Rev. Int. Defic. Soc. 2002, 171. [Google Scholar]
- Gambardella, A.; Giarratana, M.S. General Technological Capabilities, Product Market Fragmentation, and Markets for Technology. Res. Policy 2013, 42, 315–325. [Google Scholar] [CrossRef]
- Quereda, P.F.; Díaz, P.J.C. Conociendo Al Consumidor Innovador: Análisis De Sus Rasgos Y Características. ICE Rev. Econ. 2011, 860, 131–146. [Google Scholar]
- González, I.S.; del Canto, J.G. Los Factores Determinantes De Las Inversiones Empresariales En I D. Econ. Ind. 1998, 319, 63–76. [Google Scholar]
- Gandini, A.; Garmendia, L.; Prieto, I.; Álvarez, I.; San-José, J. A Holistic and Multi-Stakeholder Methodology for Vulnerability Assessment of Cities to Flooding and Extreme Precipitation Events. Sustain. Cities Soc. 2020, 63, 102437. [Google Scholar] [CrossRef]
- Zubizarreta, M.; Cuadrado, J.; Orbe, A.; García, H. Modeling the Environmental Sustainability of Timber Structures: A Case Study. Environ. Impact Assess. Rev. 2019, 78, 106286. [Google Scholar] [CrossRef]
- Oses, U.; Rojí, E.; Cuadrado, J.; Larrauri, M. Multiple-Criteria Decision-Making Tool for Local Governments to Evaluate the Global and Local Sustainability of Transportation Systems in Urban Areas: Case Study. J. Urban Plann. Dev. 2017, 144, 04017019. [Google Scholar] [CrossRef]
- San José, J.; Garrucho, I.; Cuadrado, J. The First Sustainable Industrial Building Projects. Proc. ICE-Munic. Eng. 2006, 159, 147–153. [Google Scholar] [CrossRef]
- Chang, C.; Wu, C.; Lin, C.; Chen, H. An Application of AHP and Sensitivity Analysis for Selecting the Best Slicing Machine. Comput. Ind. Eng. 2007, 52, 296–307. [Google Scholar] [CrossRef]
- Delgado, M.G.; Sendra, J.B. Sensitivity Analysis in Multicriteria Spatial Decision-Making: A Review. Hum. Ecol. Risk Assess. 2004, 10, 1173–1187. [Google Scholar] [CrossRef]
- Chen, H.; Kocaoglu, D.F. A Sensitivity Analysis Algorithm for Hierarchical Decision Models. Eur. J. Oper. Res. 2008, 185, 266–288. [Google Scholar] [CrossRef]
- Chen, Y.; Yu, J.; Khan, S. The Spatial Framework for Weight Sensitivity Analysis in AHP-Based Multi-Criteria Decision Making. Environ. Model. Softw. 2013, 48, 129–140. [Google Scholar] [CrossRef]


| Authors | Year | |
| [13] | 2007 | Different value propositions of other applications on the market that change the added value for customers, create new markets or customer groups and construct a logic for new forms of earnings. |
| [14] | 2005 | Cheap, simple, initially lower performing and then fast improving. They are only useful in remote or emerging markets. Consumers first reject them. |
| [15] | 2020 | They disrupt established models or redefine the meaning of value creation and acquisition. They focus on developing a more concise technology that is not valued within the mainstream markets. They enter the mainstream market as the technology is gradually improved. |
| [9] | 2019 | They enable a new set of product features different from those associated with mainstream technologies and are initially inferior to the latter in certain attributes. Over time, the performance of disruptive technologies surpasses that of the dominant technologies and they eventually ‘invade’ the mainstream markets. |
| [16] | 2019 | They bring a very different value proposition to the market and deliver products and services of greater simplicity, convenience, affordability and lower costs. |
| [1] | 2000 | Key feature: they lock customers in a new way; they do not follow the traditional trajectory of improving the performance valued by mainstream consumers; they improve performance along parameters different from the traditional ones. |
| [17] | 2020 | They start out in low-profit margin businesses or low-end markets. Over time, their performance continues to improve to a level that satisfies the mainstream clientele. They provide an appropriate innovation approach for SMEs through new market discovery and facilitate a “covert” attack on the incumbents. |
| [18] | 2006 | Their attributes are not valued among mainstream consumers because of their weaker performance; they provide a new value proposition to attract new customer segments and customers more sensitive to price; they sell at lower prices; they penetrate from a niche market into the mainstream market. |
| [10] | 2009 | Their performance is worse that the established attributes, they are cheaper, simpler, more comfortable or more reliable, they address current non-consumers, they are based on standard components, their business model is significantly different, their value network has a low overlap. |
| [19] | 2015 | They usually begin within small companies with low profit margins and little or no concern with existing organizational structures. Disruptive innovations are those that bring or emphasize unexploited attributes of products and services already offered on the market, unlike traditional forms. |
| [20] | 2013 | They provide better service than incumbent technologies and they change the way in which those technologies are used. |
| [21] | 2013 | They possess better value within one dimension (or more) that are orthogonal to those of existing products and, hence, are desired by some niche customers. Disruptive innovations are typically cheaper, simpler, smaller and, frequently, more convenient to use. |
| [22] | 2016 | Their performance is usually below that of mainstream products but lower price or unique features compensate it. They can provide significant competitive advantage to firms. Advantages may stem from being a quick mover or a quick follower. |
| [23] | 2016 | They use low-cost technology while ensuring high technical quality, key features and facilitate high service quality. They are easy to use. |
| [24] | 2016 | An innovation with “good enough” functionality that has a low cost. An innovation that changes the performance metrics, or consumer expectations, of a market by providing radically new functionality, discontinuous technical standards, and new forms of ownership. |
| Reference | Year | Characteristics of Disruptive Business Models |
| [15] | 2020 | They focus on building a new activity system in which new partners and activities are configured in an unprecedented way compared to existing business models. |
| [16] | 2019 | They arise to replace existing business models, redefining an existing product or service and how it is delivered to customers, through new technologies and innovation processes. They bring radical change to the market, disrupting leading and stabilized companies, making their existing business models obsolete. |
| [19] | 2015 | Characterizing elements of Disruptive Business Models: the search to reach a new business segment and new target audience; the proposition of benefits, convenience and low-value to customers; the inherent risk of changes and the need for the maintenance of organizational intellectual assets. |
| [25] | 2015 | They are conceptualised as a new-to-the-firm change in at least one out of three business model dimensions: (a) a firm’s value offering, (b) a firm’s value creation architecture, and (c) a firm’s revenue model logic. |
| [26] | 2018 | They are created when the exploration of emerging technologies is not adequately leveraged in today’s models, requiring new forms of business organization. Characteristics: differentiated value to consumers, competitive advantage, the opening of new markets and the obsolescence of existing business models. |
| [27] | 2017 | Designed, novel, non-trivial changes to the key elements of a firm’s business model and/or the architecture linking these elements. |
| [28] | 2012 | They are customer centric. They involve constant market experimentation and learning. They are path dependent. |
| [29] | 2004 | They are business model replacements that provide product or service offerings to customers and end users that were not previously available. |
| [30] | 2009 | They are based on a reconfiguration of activities in the existing business models of a firm that is new to the product/service market in which the firm competes. |
| [31] | 2020 | They redefine value creation and value capture of an industry, threaten the competitive positions of incumbent firms, and even disrupt them. |
| [32] | 2006 | They concern the discovery of a fundamentally different business model in an existing business. |
| [33] | 2016 | They imply Risk-taking behavior, proactive behavior, innovative behavior, and the extent of autonomy |
| [34] | 2010 | They require entrepreneurs and managers to (1) understand the “deep truth” about the fundamental needs of customers and how competitors are or are not satisfying those needs; (2) understand all technical and organizational possibilities for improvements; (3) make many informed guesses about the future behavior of customers and competitors as well as about costs; and, (4) make requisite adjustments to the existing business model only after considerable trial and error learning. |
| [35] | 2010 | They are initiatives to create novel value by challenging existing industry-specific business models, roles and relations in certain geographical market areas. |
| [36] | 2010 | They are about generating new sources of profit by finding novel value proposition/value constellation combinations. |
| [37] | 2011 | They signal a change beyond current practice in one or more elements of a retailing business model (i.e., retailing format, activities, and governance) and their interdependencies, thereby modifying the retailer’s organizing logic for value creation and appropriation. |
| [38] | 2001 | They innovate business models by redefining content (adding new activities), structure (linking activities differently), and governance (changing parties). |
| [39] | 2012 | They are defined as a process that deliberately changes the core elements of a firm and its business logic. |
| Reference | Year | Characteristics of Disruptive Business Models |
| [40] | 2014 | They can range from incremental changes within individual components of business models, to the extension of the existing business model, the introduction of parallel business models, right through to the disruption of the business model, which may entail replacing the existing model with a fundamentally different one. |
| [41] | 2013 | They refer to the search for new logics of the firm and new ways to create and to capture value for stakeholders; they focus primarily on finding new ways to generate revenues and to define value propositions for customers, suppliers, and partners. |
| [12] | 2020 | They build a new activity system in which new partners and activities are configured in an unprecedented way compared to existing business models, and they disrupt established models or redefine the meaning of value creation and acquisition. |
| [42] | 2020 | They create value by making changes to an organization’s value propositions and to its underlying operating model. They require no new technologies or brand-new markets, yet they can be disruptive enough to change the game in an industry, due to their unique value propositions and operating models. |
| Qualification | Assessed Weight |
|---|---|
| Higher Education qualifications (PhD, Master’s Degrees) | 40% |
| (Bachelor Degrees/Diplomas) | 35% |
| Vocational courses High-level technicians | 20% |
| Low-level technicians | 5% |
| Unqualified | 0% |
| Weight Requirements | Criteria | Weights Criteria | Indicators | Weight Indicators | Indicator Values Machine-Tooling |
|---|---|---|---|---|---|
| 0.24 | MARKET FACTORS | 1 | Innovative industry | 0.15 | 0.78 |
| Segmentation by production producción | 0.10 | 0.27 | |||
| Niche market | 0.27 | 0.8 | |||
| Client type | 0.24 | 0.67 | |||
| Similarity to a Startup | 0.24 | 0.6 | |||
| 0.67 | INTERNAL FACTORS | 1 | Value proposition | 0.2 | 0.95 |
| Innovative capacity | 0.24 | 1 | |||
| Infrastructure and resources | 0.12 | 0.97 | |||
| Qualification of personnel | 0.12 | 0.75 | |||
| Organizational ambidexterity organizacional | 0.32 | 0.67 | |||
| 0.09 | EXTERNAL FACTORS | 1 | External competitiveness | 0.64 | 0.5 |
| Use of facilitating networks redes facilitadoras | 0.28 | 0.65 | |||
| Macroeconomy | 0.11 | 0.97 |
| Weight Requirements | Criteria | Weight Criteria | Indicators | Weight Indicators | Value Indicators Construction |
|---|---|---|---|---|---|
| 0.24 | MARKET FACTORS | 1 | Innovative industry | 0.15 | 0.88 |
| Segmentation by production | 0.10 | 0.204 | |||
| Niche market | 0.27 | 0.434 | |||
| Client type | 0.24 | 0.33 | |||
| Similarity to a Startup | 0.24 | 0.27 | |||
| 0.67 | INTERNAL FACTORS | 1 | Value proposition | 0.2 | 0.78 |
| Innovative capacity | 0.24 | 0.5 | |||
| Infrastructure and resources | 0.12 | 0.79 | |||
| Qualification of personnel | 0.12 | 0.26 | |||
| Organizational ambidexterity | 0.32 | 0 | |||
| 0.09 | EXTERNAL FACTORS | 1 | External competitiveness | 0.64 | 0.67 |
| Use of facilitating networks | 0.28 | 0.13 | |||
| Macroeconomy | 0.11 | 0.14 |
| Real Case | Case 1 | Variation 1 | |
|---|---|---|---|
| Innovative Industry | 0.78 | 0.78 | 0 |
| Segmentation by Production | 0.27 | 0.27 | 0 |
| Market Niche | 0.8 | 0.8 | 0 |
| Client Type | 0.67 | 0.67 | 0 |
| Similarity to a Startup | 0.6 | 0.6 | 0 |
| Value Proposition | 0.95 | 0.95 | 0 |
| Innovative Capacity | 0.01 | 0.01 | 0 |
| Infrastructure and Resources | 0.97 | 0.97 | 0 |
| Qualification of Personnel | 0.75 | 0.75 | 0 |
| Organizational Ambidexterity | 0.67 | 0.67 | 0 |
| Exsternal Competition | 0.5 | 0.5 | 0 |
| Use of Facilitating Networks | 0.65 | 0.22 | −0.43 |
| Macroeconomy | 0.97 | 0.35 | −0.62 |
| Final Indicator | 0.78 | 0.77 | −0.01 |
| Weight Requirements | Criteria | Weight Criteria | Indicators | Weight Indicators | Indicators Firm 1 |
|---|---|---|---|---|---|
| 0.67 | MARKET FACTORS | 1 | INNOVATIVE INDUSTRY | 0.15 | 0.78 |
| SEGMENTATION BY PRODUCTION | 0.10 | 0.27 | |||
| NICHE MARKET | 0.27 | 0.8 | |||
| CLIENT TYPE | 0.24 | 0.67 | |||
| SIMILARITY TO A STARTUP | 0.24 | 0.6 | |||
| 0.24 | INTERNAL FACTORS | 1 | VALUE PROPOSITION | 0.2 | 0.95 |
| INNOVATIVE CAPACITY | 0.24 | 1 | |||
| INFRASTRUCTURE AND RESOURCES | 0.12 | 0.97 | |||
| QUALIFICATION OF PERSONNEL | 0.12 | 0.75 | |||
| ORGANIZATIONAL AMBIDEXTERITY | 0.32 | 0.67 | |||
| 0.09 | EXTERNAL FACTORS | 1 | EXTERNAL COMPETITION | 0.64 | 0.5 |
| USE OF FACILITATING NETWORKS | 0.28 | 0.65 | |||
| MACROECONOMY | 0.11 | 0.97 |
| Weight Requirements | Criteria | Weight Criteria | Indicators | Weight Indicators | Indicators Firm 1 |
|---|---|---|---|---|---|
| 0.09 | MARKET FACTORS | 1 | INNOVATIVE INDUSTRY | 0.15 | 0.88 |
| SEGMENTATION BY PRODUCTION | 0.10 | 0.204 | |||
| NICHE MARKET | 0.27 | 0.434 | |||
| CLIENT TYPE | 0.24 | 0.33 | |||
| SIMILARITY TO A STARTUP | 0.24 | 0.27 | |||
| 0.24 | INTERNAL FACTORS | 1 | VALUE PROPOSITION | 0.2 | 0.78 |
| INNOVATIVE CAPACITY | 0.24 | 0.5 | |||
| INFRASTRUCTURE AND RESOURCES | 0.12 | 0.79 | |||
| QUALIFICATION OF PERSONNEL | 0.12 | 0.26 | |||
| ORGANIZATIONAL AMBIDEXTERITY | 0.32 | 0 | |||
| 0.67 | EXTERNAL FACTORS | 1 | EXTERNAL COMPETITION | 0.64 | 0.67 |
| USE OF FACILITATING NETWORKS | 0.28 | 0.13 | |||
| MACROECONOMY | 0.11 | 0.14 |
Publisher’s Note: MDPI stays neutral with regard to jurisdictional claims in published maps and institutional affiliations. |
© 2020 by the authors. Licensee MDPI, Basel, Switzerland. This article is an open access article distributed under the terms and conditions of the Creative Commons Attribution (CC BY) license (http://creativecommons.org/licenses/by/4.0/).
Share and Cite
Zubizarreta, M.; Ganzarain, J.; Cuadrado, J.; Lizarralde, R. Evaluating Disruptive Innovation Project Management Capabilities. Sustainability 2021, 13, 1. https://doi.org/10.3390/su13010001
Zubizarreta M, Ganzarain J, Cuadrado J, Lizarralde R. Evaluating Disruptive Innovation Project Management Capabilities. Sustainability. 2021; 13(1):1. https://doi.org/10.3390/su13010001
Chicago/Turabian StyleZubizarreta, Mikel, Jaione Ganzarain, Jesús Cuadrado, and Rafael Lizarralde. 2021. "Evaluating Disruptive Innovation Project Management Capabilities" Sustainability 13, no. 1: 1. https://doi.org/10.3390/su13010001
APA StyleZubizarreta, M., Ganzarain, J., Cuadrado, J., & Lizarralde, R. (2021). Evaluating Disruptive Innovation Project Management Capabilities. Sustainability, 13(1), 1. https://doi.org/10.3390/su13010001