Article

Operational Lifecycle Carbon Value of Bus Electrification in Macau

1
School of Finance, Capital University of Economics and Business, Zhangjialukou 121, Fengtai Distinct, Beijing 100191, China
2
School of Economics and Management, Beihang University, Xueyuan Road 37, Haidian Distinct, Beijing 100191, China
*
Author to whom correspondence should be addressed.
Sustainability 2020, 12(9), 3784; https://doi.org/10.3390/su12093784
Submission received: 20 March 2020 / Revised: 1 May 2020 / Accepted: 4 May 2020 / Published: 6 May 2020
(This article belongs to the Section Economic and Business Aspects of Sustainability)

Abstract

:
The economic value of carbon emission reduction in the electrification of buses is of concern in practical and academic fields. The aim of this paper, which focuses on direct and indirect carbon emissions, is to study the economic value of the carbon emission reduction of bus electrification in an operational lifecycle carbon footprint, with the empirical data sourced from the bus electrification in Macau. First, it proposes the methodology to evaluate the operational lifecycle carbon value of bus electrification (OLCVBE). Second, it analyses the distinct impacts of internal determinants on OLCVBE. Third, it discusses the determinants’ characteristics for OLCVBE. The results indicate that (1) OLCVBE may be a carbon debt, but it is not a carbon asset in some situations; (2) OLCVBE is determined by the carbon emission coefficients of both electric power and fossil fuel, buses’ electric or fossil fuel consumption levels, buses’ terminations, carbon price and discounted rate; and (3) as a comparison, electric power’s embedded carbon emission coefficient has the biggest impact on OLCVBE, then carbon price and the electric consumption have the second or third biggest impacts, and the annual driving distance of buses has relative less impact. This paper provides a new perspective to study the economic and environmental effects of bus electrification.

1. Introduction

Mitigation in public transport has been noticed by people in practice and in academia in recent years [1,2]. One possible way for public transport to reduce carbon emissions is to replace fossil fuel-powered buses (FFBs) with battery electric buses (BEBs) [3]. BEBs have few direct carbon emissions on road, but they need electric power to provide energy [4,5]. As carbon dioxide will be emitted in the production process of electric power, BEBs actually have indirect or embedded carbon emissions in a much wider view [
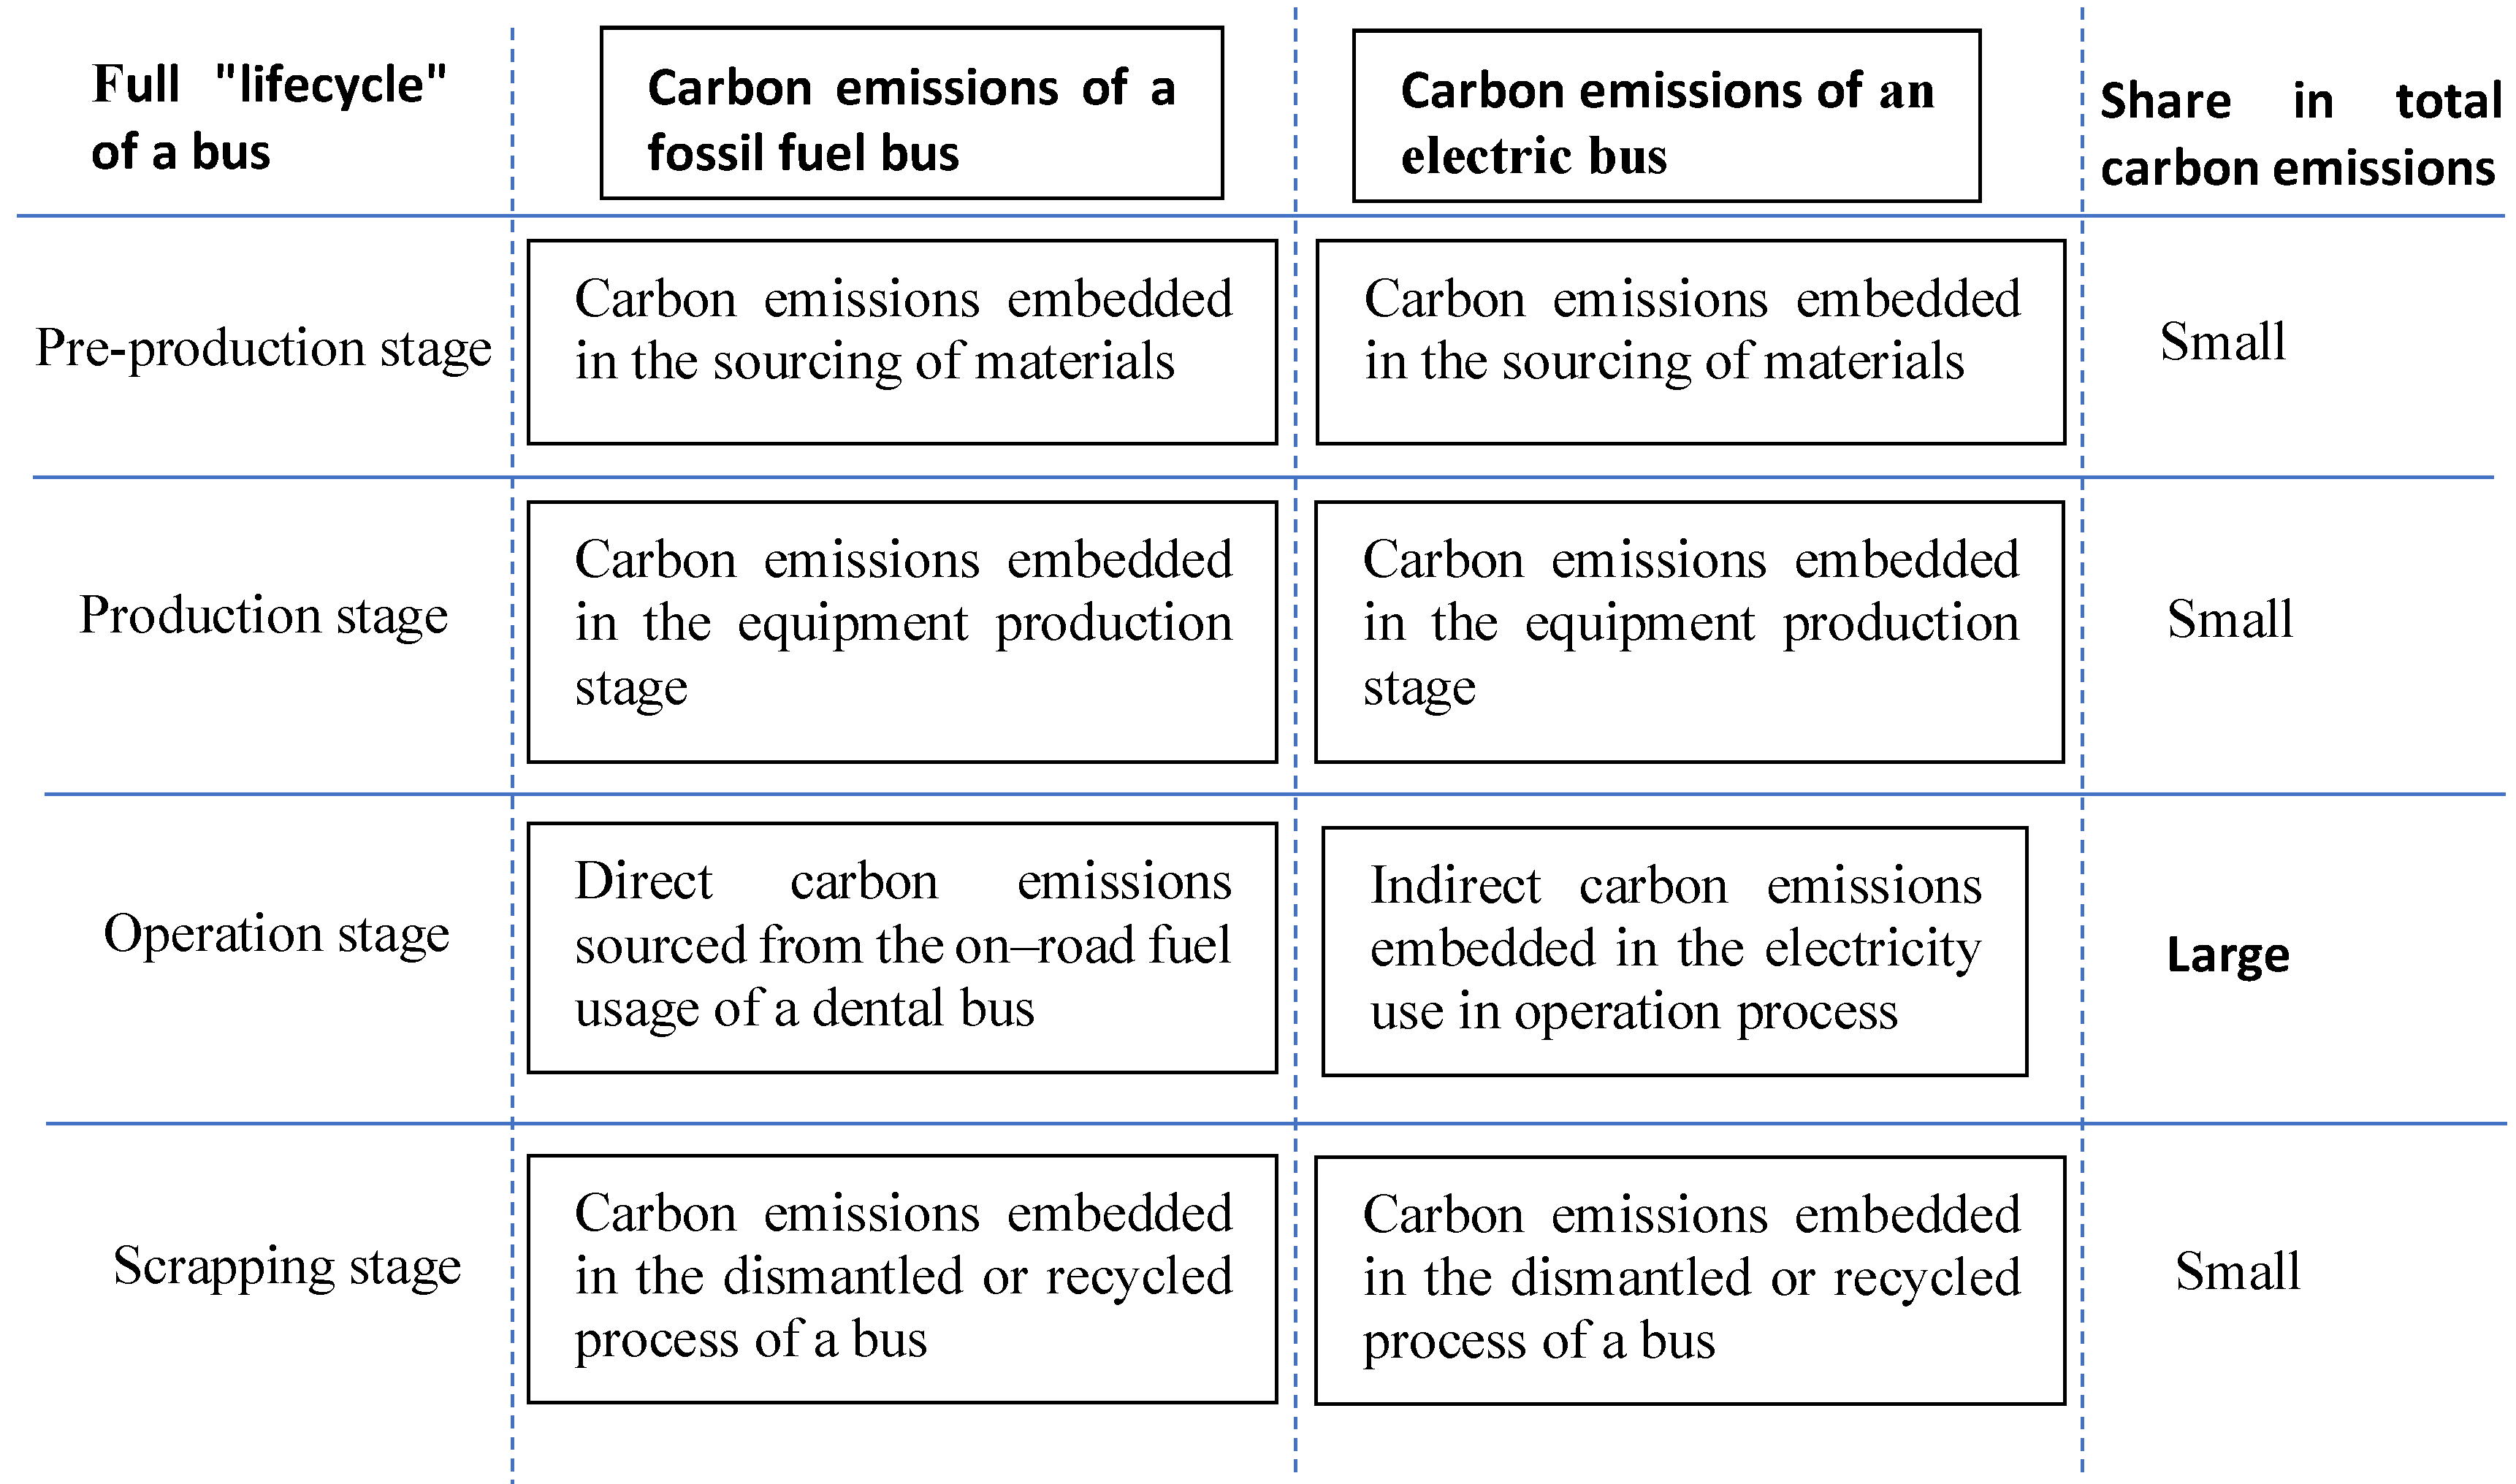
6]. As a result, when evaluating the emission reduction effect and the corresponding economic value of bus electrification, i.e., the process for BEBs to replace FFBs, a lifecycle carbon footprint insight is needed. The components and features of the lifecycle carbon emissions of a fossil fuel or electric bus are shown in Figure 1. As some studies cover the life cycle of the vehicle equipment and the well-to-wheel stage when comparing electrically chargeable buses with those driven by fossil fuels [7,8,9,10], a growing number of bus studies focus on the carbon emissions of different fuel types, including both fossil fuels and the production of electricity for charging, by assessing the energy carrier life cycle from well-to-wheel [3,11,12,13,14,15,16,17,18,19]. The reason is that emissions related to fuel consumption of the bus account for the largest share of life cycle emissions [19,20,21]. Accordingly, this paper also mainly focuses on the lifecycle carbon emissions associated with public bus operation.
In the operational lifecycle carbon footprint insight, this paper studies the economic value of the carbon emission reduction of bus electrification, as Xu et al. (2019) [22] have evaluated the carbon asset of bus electrification with addressing the direct carbon emissions. When only concerning direct carbon emissions, the value of the carbon emission reduction of bus electrification will be positive and there is a carbon asset. Carbon asset was proposed to evaluate the environmental advantage of green or low-carbon technic, economic or social activity in carbon emission reductions in an economic view [23,24]. As the concept of carbon asset is used to evaluate the carbon reduction of green or low-carbon activity, authors propose the concept of carbon debt to reflect a technic, economic or social activity which has a higher level of carbon emissions. When considering both the direct carbon emissions emitted by FFBs and the embedded carbon emissions of BEBs, the value of the carbon emission reduction of bus electrification may change to be negative and there may be a carbon debt.
The concept of carbon value is further proposed to unify the concept of carbon asset or carbon debt, which is used to evaluate the economic value of the carbon emission change in the transition from FFBs to BEBs in different situations. When applying the concept of carbon asset to analyse the value of the carbon reduction in the transition from FFBs to BEBs, Xu et al. (2019) [22] have assumed that BEBs are zero-emission entities as an electric bus emits little gaseous pollutants during transit according to Bakker and Konings (2018) [25] and other scholars. Both the direct carbon emissions from FFBs and the indirect carbon emissions from BEBs are concerned in this paper when analysing the carbon value of bus electrification from the operational lifecycle perspective. There is a carbon asset for bus electrification if BEBs have a lower carbon emission level than FFBs; otherwise, there will be a carbon debt.
As this study concerns the operational lifecycle carbon emissions, including of both the direct carbon emissions and the indirect ones, it proposes the operational lifecycle carbon value of bus electrification (OLCVBE) to evaluate the economic value of the carbon emission reduction of bus electrification, i.e., the value of the carbon emission reduction of BEBs to replace FFBs. The carbon asset of bus electrification corresponding to direct carbon emissions is mainly dependent on the carbon emissions emit by FFBs and its economic value [22]. As a comparison, OLCVBE will further be determined by the indirect carbon emissions embedded in the travel process of BEBs. With the example of bus electrification in Macau, this study refers to the theory, evaluation method, feathers and significance of OLCVBE.
This paper discusses whether there is a carbon asset or carbon debt, as OLCVBE may be positive or negative, and further analyses its internal determinants. Based on the evaluation of the annual OLCVBE, this study also builds models to evaluate the service-life OLCVBE. The service-life OLCVBE is defined as the total value of OLCVBE in the whole service life for BEBs and FFBs, which include much more affecting factors, and also may be a carbon asset or carbon debt. Moreover, it further analyses how the internal affecting factors impact on both the annual OLCVBE and the service-life OLCVBE, and discusses the significance of OLCVBE in mitigation.
The rest of this paper is set as follows: Section 2 reviews the literature related to OLCVBE. Section 3 introduces the theory and methodology to evaluate OLCVBE from an annual view and a service-life view and derives the impacts of the influencing factors in theory. Section 4 introduces the data and variables used in the paper. Section 5 presents the empirical results with some analysis. Section 6 discusses the findings from the empirical results. Section 7 concludes and discusses the implications of the paper.

2. Literature Review

Although BEBs have been thought to be zero-emission buses, as they result in far less direct emissions than their diesel counterparts, many more scholars have begun to evaluate the carbon emission level of BEBs in a life cycle view and compare them with FFBs [6,25]. The representative studies on the lifecycle carbon emissions of bus electrification are shown in Table 1. On a lifecycle perspective, Sánchez et al. (2013) [8] have studied the impact of electricity mix on the energy consumption and greenhouse gas (GHG) emissions of electric, hybrid diesel-electric, fuel cell hybrid and diesel buses in Spain, and found that BEB has a big potential of improvement in GHG emission reduction. Zhou et al. (2016) [16] have studied the lifecycle CO2 emissions of the on-road diesel or electric buses in Macau, China and found that an electric bus cuts 20%–35% of CO2 emissions of a diesel bus. Lajunen and Lipman (2016) [17] have compared the lifecycle CO2 emissions of diesel, natural gas, hybrid electric, fuel cell hybrid and electric transit buses under the operating environment case scenarios of Finland and California (USA); they studied the carbon emissions induced by the primary energy sources and found that hybrid buses have moderately lower CO2 emissions during the service life than diesel buses, whereas fully-electric buses have reduced CO2 emissions, by up to 75%. Dreier et al. (2018) [26] have estimated the well-to-wheel fossil energy use and GHG emissions for conventional, hybrid-electric and plug-in hybrid-electric city buses in the bus rapid transit system in Curitiba, Brazil, and found that the hybrid bus and the plug-in hybrid bus emit 30% and 72% less well-to-wheel GHG compared to a conventional bus, and that advanced powertrains and large passenger capacity utilisation can promote sustainability in the bus system. Lee et al. (2019) [27] have studied the lifecycle environmental performance of fuel cell electric school or transit buses in the United States of America and found that the well-to-wheel air emissions will reduce for hydrogen fuel cell electric buses achieving fuel economy targets, in comparison with diesel buses. Different to these literatures proving the advantage of BEBs in carbon emission reduction, some other scholars have different findings.
Some other scholars, also in a lifecycle carbon footprint view, have compared the carbon emission level of BEBs and that of FFBs in different places, but adversely found a limit in carbon emission reduction for BEBs in comparison with FFBs. Song et al. (2018) [21] have performed a streamlined life cycle assessment to evaluate the GHG emissions of public buses in Macau, China, and found that electric public buses, compared with traditional diesel public buses, hardly reduce GHG emissions when considering the charging loss and electricity distribution loss. Dong et al. (2018) [28] have employed a streamlined life cycle assessment method to quantify the carbon emissions and corresponding carbon intensity reduction potentials of urban public transport system, including bus and subway in Shenzhen, China and found that carbon mitigation of Shenzhen’s ‘green’ transport mode has low effectiveness. Using a life cycle perspective and various implementation scenarios, Xylia et al. (2019) [19] have analysed the potential impact of electrification for the decarbonization of public bus transport in Stockholm; they found that bus electrification could be beneficial for the reduction of local pollutants in Stockholm’s inner city, but it does not necessarily lead to a reduction of the total emissions and that the fuel choices significantly influence the environmental impact of the city’s bus network. Nordelöf et al. (2019) [18] have studied the life cycle carbon emission level of city buses, which is found to be dependent on the degree of electrification, electricity supply mix and choice of diesel or hydrogenated vegetable oil for average operation in Sweden, the European Union and the United States of America. Harris et al. (2020) [29] have estimated the GHG emissions of buses with different technologies in the UK and revealed the decreasing potential to reduce GHG emissions from BEBs. Other determinants of the carbon emission difference between BEBs and FFBs have been discussed by many more scholars [30,31,32,33,34,35]. The different viewpoints on the carbon emission reduction of the bus electrification transition from FFBs to BEBs will induce quite different results for evaluating its economic value.
The economic analysis on bus electrification has also been noticed by scholars. Many scholars (e.g., [36,37,38,39,40,41,42]) have studied the costs or benefits of bus electrification for BEBs to replace FFBs. Moreover, some other scholars (e.g., [17,25,29,43,44,45]) have evaluated both the economic characteristics of bus electrification and the corresponding emission reduction, to analyse the advantages of BEBs or FFBs in different countries. To discuss the relation between the cost of bus electrification and the corresponding emission reduction in a unified system, Xu et al. (2019) [22] have applied the carbon asset theory developed by Han et al. (2015) [23] and Xu et al. (2018) [24], to evaluate the economic value of carbon emission reduction of bus electrification on the perspective of direct carbon emissions. As the life cycle or well-to-wheel carbon emissions have been recognized by more and more scholars, this paper further evaluates the economic value of carbon emission reduction of bus electrification on a life cycle perspective, which will extend the knowledge on economic and environmental effects of bus electrification, as well as the application of carbon asset theory.

3. Theory and Methodology

3.1. Evaluation of the Annual OLCVBE

According to Xu et al. (2019) [22], as well as Xu et al. (2018) [24] and Han et al. (2015) [23], the annual OLCVBE, determined by the embedded carbon emissions of electric power used by BEBs, the carbon emissions of FFBs and carbon price, can be calculated according to:
V t = ( C F t C E t ) P t
where V t is the annual OLCVBE in year t (unit: Yuan), C F t is the annual carbon emission level of a FFB (unit: kg CO2eq), C E t is the annual embedded carbon emission level of a BEB (unit: kg CO2eq), and P t is carbon price (unit: Yuan/kg CO2eq). As it is not hard to get the carbon price in a public carbon exchange market, the next question is about how to calculate the annual carbon emissions of a BEB or FFB.
According to Xu et al. (2019) [22], the annual carbon emissions of a FFB, determined by the annual driving distance of the FFB and the distance-specific fossil fuel consumption of the FFB and the carbon emission coefficient of fossil fuel, can be calculated by:
C F t = F U C P F L t
where C F t is the annual carbon emission level of a FFB in year t (unit: kg CO2eq), L t is the annual driving distance of the FFB (unit: km), C P F is the distance-specific fossil fuel consumption of the FFB (unit: kg/km), and F U is the carbon emission coefficient of fossil fuel (unit: kg CO2eq/kg). Similarly, the annual embedded carbon emission level of a BEB is determined by the annual driving distance of the BEB, the distance-specific electric consumption of the BEB and the embedded carbon emission coefficient of electric power. Accordingly, the annual embedded carbon emissions of a BEB can be calculated by:
C E t = E U C P E L t
where C E t is the annual embedded carbon emission level of a BEB in year t (unit: kg CO2eq), L t is the annual driving distance of the BEB (unit: km), C P E is the distance-specific electric power consumption of the BEB (unit: kWh/km), and E U is the embedded carbon emission coefficient of electric power (unit: kg CO2eq/kWh).
According to Formula (1)–(3), the annual OLCVBE can be calculated as follows:
V t = ( F U C P F L t E U C P E L t ) P t
i.e.,
V t = ( F U C P F E U C P E ) L t P t
where F U C P F , in fact, is the distance-specific carbon emission level of a FFB and E U C P E is the distance-specific embedded carbon emission level of a BEB. Formula (5) suggests that the annual OLCVBE is determined by the annual driving distance of a bus, carbon price and the relative carbon emission reduction for the BEB compared with the FFB, which is further determined by the distance-specific fossil fuel consumption of the FFB, the distance-specific electric power consumption of the BEB, the carbon emission coefficient of fossil fuel and the embedded carbon emission coefficient of electric power.

3.2. Evaluation of the Service-Life OLCVBE

As BEBs and FFBs may have different usage termination, it is relatively complex to calculate the service-life OLCVBE. To simplify the analysis, we first assume a BEB and a FFB have the same termination and we will further discuss how the service-life OLCVBE is affected by the termination if it is different for a FFB and a BEB in Section 5.3 of this paper. With the assumption that a BEB and FFB have the same termination and that there is a constant discounted rate for bus companies, the service-life OLCVBE, according to Formula (5), can be calculated as follows:
V = t = 0 T ( F U C P F E U C P E ) L t P t ( 1 + r ) t
In Formula (6), V is the service-life OLCVBE (unit: Yuan), F U is the carbon emission coefficient of fossil fuel, C P F is the distance-specific fossil fuel consumption of the FFB (unit: kg/km), E U is the embedded carbon emission coefficient of electric power (unit: kg CO2eq/kWh), C P E is the distance-specific electric power consumption of the BEB (unit: kWh/km), L t is the annual driving distance of a bus, P t is carbon price (unit: Yuan/kg CO2eq), and r is the discounted rate of carbon value (unit: none), which is the rate for converting the future income into the present value. Formula (6) suggests how the variables determine the service-life OLCVBE.
We further assume carbon price is constant for all bus companies and the annual driving distance is also constant for both FFBs and BEBs in their whole service life, i.e.,
L t = L
P t = P
Then, Formula (6) can be written as
V = t = 0 T ( F U C P F E U C P E ) L P ( 1 + r ) t
In Formula (7), V is the service-life OLCVBE (unit: Yuan), F U is the carbon emission coefficient of fossil fuel, C P F is the distance-specific fossil fuel consumption of the FFB (unit: kg/km), E U is the embedded carbon emission coefficient of electric power (unit: kg CO2eq/kWh), C P E is the distance-specific electric power consumption of a BEB (unit: kWh/km), T is the termination of a bus (unit: year), L is the annual driving distance of a bus (unit: km), P is carbon price (unit: Yuan/kg CO2eq), and r is the discounted rate of carbon value (unit: none). Formula (7), compared with Formula (6), suggests how the variables determine the service-life OLCVBE in an easier way.

3.3. Effects of the Determinants on OLCVBE

After obtaining the determinants for the annual and service-life OLCVBE, it is interesting to analyse which determinants have larger effects. To analyse the impacts of the determinants, we first take the derivatives of V t with respect to P t , L t , E U and C P E , respectively, according to Formula (5), i.e.,
d V t d P t = ( F U C P F E U C P E ) L t
d V t d L t = ( F U C P F E U C P E ) P t
d V t d E U = C P E L t P t
d V t d C P E = E U L t P t
and then, take the derivatives of V with respect to P , L , E U and C P E , respectively, according to Formula (7), i.e.,
d V d P = ( F U C P F E U C P E ) L t = 0 T ( 1 + r ) t
d V d L = ( F U C P F E U C P E ) P t = 0 T ( 1 + r ) t
d V d E U = C P E L P t = 0 T ( 1 + r ) t
d V d C P E = E U L P t = 0 T ( 1 + r ) t
Equations (8)–(15) can be used to analyse the distinct impacts of the annual driving distance of either a BEB or a FFB ( L t or L , respectively; unit: km), carbon price ( P t or P , respectively; unit: Yuan/kg CO2eq), the embedded carbon emission coefficient of electric power ( E U ; unit: kg CO2eq/kWh) and the distance-specific electric consumption of the BEB ( C P E ; unit: kWh/km) on the annual or service-life OLCVBE.

4. Data and Variables

This section describes the data and variables for calculating the annual and service-life OLCVBE in Macau. According to Formula (5), the determinants of the annual OLCVBE include the annual driving distance of a bus, the distance-specific carbon emission level of an FFB, the distance-specific embedded carbon emission level of a BEB, and carbon price. According to Formulas (6) and (7), the service-life OLCVBE in Macau is further determined by the discounted rate of carbon value for bus companies and the termination of the fossil fuel-powered or battery electric buses as well.

4.1. Distance-Specific Carbon Emissions of FFBs

The distance-specific carbon emission level of an FFB, according to Formula (2), is equal to the distance-specific fossil fuel consumption of the FFB, multiplied by the carbon emission coefficient of fossil fuel. Because the passenger capacity of a heavy-duty bus is more related to a BEB produced in recent years, we chose the the heavy-duty buses to represent the FFBs. Song et al. (2018) [21] have estimated the distance-specific carbon emission level of the heavy-duty buses in Macau, the basic information of which is showed in Table 2. According to Song et al. (2018) [21], the actual carbon emission level for the tested heavy-duty buses has the value of 1115.20 ± 91.56 g/km, which is used as the distance-specific carbon emission level of a FFB.

4.2. Distance-Specific Embedded Carbon Emissions of BEBs

The distance-specific embedded carbon emission level of a BEB, according to Formula (3), is equal to the distance-specific electric power consumption of the BEB multiplied by the embedded carbon emission level of electric power. According to Song et al. (2018) [21], the electricity consumption, as well as the basic information of the two electricity buses operated in Macau, is gained as it shows in Table 3. We use these two electricity buses to represent the BEBs operated in Macau and discuss their OLCVBE when replacing the FFBs. The embedded carbon emission coefficients of electric power in Macau, according to Song et al. (2018) [21], are shown in Table 4, which suggests that the electric power sourced from different kinds of electric power plants has quite different embedded carbon emission coefficients. As the embedded carbon emission coefficients of electric power are distinct for different sources, the annual or service-life OLCVBE will be different.

4.3. Price of Carbon

As there is still no carbon exchange market in Macau, we use the carbon price in Guangdong, which is near Macau, to reflect the carbon price in Macau. The statistics that characterise the carbon price in Guangdong are based on the price data sourced from the Guangzhou Carbon Emission Exchange. The price of the carbon emissions in Guangdong has fluctuated as shown in Figure 2, and has an average price of 24.75 Yuan, a minimum value of 8.1 Yuan, a maximum value of 77 Yuan, and a standard deviation of 17.31 Yuan, according to the transactions from December 19, 2013, the initial trading day to May 31, 2019. It uses these data to represent the price of OLCVBE in Macau.

4.4. Other Variables

The average annual driving distance of a public bus is 57,962 km according to the statistical data [21], which is used to represent the annual driving distance of a bus in Macau. The yield rate of a 5-year treasury bond was approximately 4.75% in China in February, 2019, and this value is used to represent the discount rate of the carbon value in this paper (i.e., r ). The service life of a public bus is usually eight years, which is used as the termination time of buses in this paper.

5. Empirical Results and Analysis

5.1. Annual OLCVBE in Macau

The annual and service-life OLCVBE is determined by the annual driving distance of the battery electric or fossil fuel-powered bus, the relative carbon emission reduction for the BEB to replace the FFB, and carbon price. The relative carbon emission reduction for a BEB to replace a FFB is determined by the distance-specific fossil fuel consumption of the FFB, the carbon emission coefficient of fossil fuel, the distance-specific electric power consumption of the BEB, the embedded carbon emission coefficient of electric power. We first substitute the variables from Section 4 into Formula (5) and estimate the annual OLCVBE in Macau; the results are shown in Table 5. Table 5 shows that it is still uncertain about whether there is a carbon asset or a carbon debt for bus electrification in an operational lifecycle carbon footprint view and the annual OLCVBE will fluctuate, along with the changes of electric power sources or electricity consumption levels of BEBs.
The annual OLCVBE, which may be an asset or a debt, will fluctuate along with the changes of electric power sources. Table 5 shows that there is generally an operational lifecycle carbon asset of bus electrification for E2, while there is mainly an operational lifecycle carbon debt of bus electrification for E1 in our case study in Macau. With an average electricity consumption level, the annual OLCVBE for E1 will change obviously for different electric power sources. There is an operational lifecycle carbon debt of bus electrification for E1 if the electric source has an average carbon emission level of Macau. Moreover, there will be an operational lifecycle carbon asset of bus electrification for E1 if the electric power is sourced by natural gas or solar energy, while there will be an operational lifecycle carbon debt of bus electrification for E1 when the electric is sourced by the local power plants in Macau, heavy oil or China’s Southern Power Grid. With an average electricity consumption level, there is an operational lifecycle carbon asset of bus electrification for E2, though its value fluctuates for different sources. The annual OLCVBE for E2 is 95.25, 233.83, 194.24, 768.35, 55.66 and 1421.65 Yuan when the electric sources are the local power plants in Macau, heavy oil, natural gas, China’s Southern Power Grid or solar energy. Accordingly, when the electric source is natural gas or solar energy, there is an operational lifecycle carbon asset of bus electrification for both E1 and E2. When the electric is sourced by the local power plants in Macau, heavy oil or China’s Southern Power Grid, there will be an operational lifecycle carbon asset of bus electrification for E2, but a carbon debt for E1.
The annual OLCVBE will also fluctuate with the change of electricity consumption level of the BEB. Table 5 shows that the annual OLCVBE for E1 or E2 will change if the electricity consumption level of BEBs fluctuates. If the electric source has an average carbon emission level of Macau, there is a carbon asset for E2 with the minimum electricity consumption level of BEBs, while there is a carbon debt with the maximum electricity consumption level of BEBs. There is always a carbon debt for E1, no matter when the electricity consumption level of BEBs gets a minimum or maximum value, if the electric source has an average carbon emission level of Macau. These results suggest that the annual OLCVBE in Macau will obviously fluctuate when the electricity consumption levels of BEBs change.
The annual OLCVBE will further fluctuate when the distance-specific carbon emission level of FFBs changes, as is shown in Table 6. For E2 with the average embedded carbon emission coefficient of electric sources, there is a carbon asset whenever the distance-specific carbon emission level of FFBs gets the mean value, the value of mean plus standard deviation or the value of mean minus standard deviation. For E1 with the average embedded carbon emission coefficient of electric sources, there is always a carbon debt whenever the distance-specific carbon emission level of FFBs gets the mean value, the value of mean plus standard deviation or the value of mean minus standard deviation. For the BEBs with other electric power sources, the annual OLCVBE in Macau will also fluctuate a lot when the distance-specific carbon emission level of FFBs gets different values.

5.2. Service-Life OLCVBE in Macau

To estimate the service-life OLCVBE in Macau, we substitute the variables from Section 4 into Formula (7) and the results are shown in Table 7. The service-life OLCVBE in Macau will fluctuate with the changes of the carbon emission level of FFBs, the average electric consumption or the average embedded carbon emission coefficient of electric sources, as shown in Table 7. Table 7 suggests that the service-life OLCVBE for E2 is 651.54 Yuan, with the average carbon emission level of FFBs, the average electric consumption and the average embedded carbon emission coefficient of electric sources. If the electric sources change, the service-life OLCVBE for E2 with the average carbon emission level of FFBs and the average electric consumption will vary from 380.72 to 9724.08 Yuan. With the minimum electric consumption, the service-life OLCVBE for E2 will change from 1528.77 to 9856.54 Yuan, when the electric sources change. With the maximum electric consumption, the service-life OLCVBE for E2 will change from −767.33 to 9591.61 Yuan when the electric sources change. The service-life OLCVBE will also fluctuate when the carbon emission level of FFBs, the electric consumption or the electric sources change, as shown in Table 7.

5.3. Impacts of the Determinants on the OLCVBE in Macau

This section analyses the impacts of the determinants on the OLCVBE in Macau. According to Formulas (8)–(11), we analyse how the changes in the annual driving distance of a bus ( L t ), carbon price ( P t ), the distance-specific electric power consumption of the BEB ( C P E ) and the embedded carbon emission coefficient of electric power ( E U ) affect the annual OLCVBE in Macau; the results are shown in Table 8.
Table 8 shows that the derivative of the annual OLCVBE, with respect to carbon price, is −12.90 for E1 and 3.85 for E2, which means that when carbon price rises by 1 Yuan, the annual operational lifecycle carbon debt of bus electrification for E1 will rise 12.90 Yuan, while the annual OLCVBE for E2 will rise 3.85 Yuan. This suggests that carbon price has positive impacts on OLCVBE. Carbon price, which fluctuates violently, as shown in Figure 2, will act on OLCVBE obviously. The derivative of the annual OLCVBE with respect to the annual driving distance of a bus is −5.51 for E1 and 1.64 for E2, which means that when the annual driving distance of a bus rises by 100 km, the annual operational lifecycle carbon debt of bus electrification for E1 will rise by 0.55 Yuan, while the annual OLCVBE for E2 will rise by 0.16 Yuan. This suggests that the annual driving distance of a bus also has positive impacts on OLCVBE, but it has relative less impact on OLCVBE compared with carbon price. The derivative of the annual OLCVBE of bus electrification with respect to the electric consumption is −10.90 for both E1 and E2, which means that when the electric consumption rises 1 kWh per 100 km, the annual OLCVBE of bus electrification for E1 and E2 will reduce by 10.90 Yuan. This suggests that the annual driving distance of a bus has relatively less impact on the annual OLCVBE. The derivative of the annual OLCVBE with respect to the embedded carbon emission coefficient of electric power is −2524.82 for E1 and −1979.69 for E2, which means that when the embedded carbon emission coefficient of electric power decreases by 0.01 kg CO2eq/kWh, the annual OLCVBE will rise by 25.25 Yuan for E1 and 19.80 Yuan for E2. Initially, for each type of electricity production method, when technology or other factors induce the embedded carbon emission coefficient of electric changes, OLCVBE will change correspondingly. This suggests that the embedded carbon emission coefficient of electric power has a relatively big impact on the annual OLCVBE.
By substituting the variables illustrated in Section 4 into Formulas (12)–(15), we obtain the results for the impacts of the annual driving distance of a bus ( L t ), carbon price ( P t ), the distance-specific electric power consumption of the BEB ( C P E ) and the embedded carbon emission coefficient of electric power ( E U ) on the service-life OLCVBE in Macau; the results are shown in Table 9. Table 9 shows the derivative of the service-life OLCVBE with respect to carbon price, the annual driving distance of a bus, the electric power consumption and the embedded carbon emission coefficient of electric power. It was found that these factors have distinct impacts on the service-life OLCVBE, in a similar way to that on the annual OLCVBE.

6. Discussion

6.1. Determinants of OLCVBE

Section 5 in this paper suggests that the embedded carbon emission coefficient of electric power has the biggest impact on OLCVBE, then carbon price and the electric consumption of the BEB have the second or third biggest impacts on OLCVBE, and the annual driving distance of a bus has relatively less impact on OLCVBE. The termination of a bus and the discounted rate of carbon value also have impacts on the service-life OLCVBE. If using the elasticity coefficient but not the derivative to analyse the extent of the determinants’ impacts on the annual and service-life OLCVBE, the result is similar. As a result, more attention should be given to the embedded carbon emission coefficient of electric power, the electric consumption of BEBs and carbon price, when caring about OLCVBE.

6.2. Impact of the Carbon Emission Levels of Electric Power Plants on OLCVBE

As the embedded carbon emission coefficient of electric power has the biggest impact on the annual or service-life OLCVBE, reducing it to improving OLCVBE is a key problem. This refers to the mitigation of power plants. As environmental problems, especially air pollution, have attracted more and more attention in recent years, traditional power plants face emission reduction pressure and renewable power plants are emerging. Moreover, the government gradually puts out policies to limit the development of traditional power plants and promote the development of renewable power plants. As the emission level of power plants is continually declining in most places of the world, OLCVBE will increase much more. Along with the decline of the carbon emission coefficient of electric power, the reduction of the electric consumption for BEBs and the rise of carbon price will also increase OLCVBE.

6.3. Impact of Bus Termination on OLCVBE

As an FFB generally has been used for some time when it is replaced by a BEB but the mandatory retirement periods of all buses are usually formulated as the same, BEBs and FFBs may have different usage terminations, which make it more complex to calculate the service-life OLCVBE. Assuming that a BEB has a T 1 termination and a FFB has a T 2 termination and there is a r discounted rate, the service-life OLCVBE should be more exactly calculated as follows:
V = t = 0 T 1 F U C P F L P ( 1 + r ) t t = 0 T 2 E U C P E L P ( 1 + r ) t
In this formula, V is the service-life OLCVBE (unit: Yuan), F U is the carbon emission coefficient of fossil fuel (unit: kg CO2eq/kg), C P F is the distance-specific fossil fuel consumption of the FFB(unit: kg/km), E U is the embedded carbon emission coefficient of electric power (unit: kg CO2eq/kWh),   C P E is the distance-specific electric power consumption of the BEB (unit: kWh/km),   L is the annual distance a bus drives (unit: km), P is carbon price (unit: Yuan/kg CO2eq), T 1 is the termination of the FFB (unit: year), T 2 is the termination of the BEB (unit: year), and r is the discounted rate of carbon value (unit: none). Formula (16) suggests that the service-life OLCVBE will be affected by the discrepant terminations of battery electric or fossil fuel-powered buses. With different vehicle discarding or replacement policies, FFBs and BEBs will have different terminations, which will impact on the service-life of OLCVBE.

6.4. Significance of OLCVBE

The methodology of OLCVBE evaluation provides an economic valuation method for the carbon reduction of bus electrification, which will offer a reference and foundation for determining the subsidy from government or provide a carbon asset or a carbon debt for BEBs. This will speed up bus companies’ efforts on bus electrification. As OLCVBE is determined by the embedded carbon emission coefficient of electric power, the electric consumption, carbon price and other factors, the changes of these factors will make OLCVBE fluctuate. The decline of the embedded carbon emission coefficient of electric power, the reduction of the electric consumption, and the rise of carbon price or policies directing these targets, will increase OLCVBE and make bus companies devote more efforts to bus electrification. As a result, the energy-saving and emission-reducing behaviour of companies and the related policies of the government will have better mitigation effects if OLCVBE is introduced.

7. Conclusions and Policy Implications

This paper focuses on the economic value of the carbon emission reduction in bus electrification in an operational lifecycle carbon footprint insight. Furthermore, it details how the influencing factors, especially the electric consumption level and the carbon emission coefficient of the electric sources, impact on this asset or debt. The conclusions are as follows:
First, it is more persuasive to calculate and analyse the carbon asset or carbon debt of bus electrification in an operational lifecycle view. Our study suggests that it will obtain more fruitful conclusions to consider the carbon emissions embedded in the production process of electric power, when analysing the environmental and economic advantages of battery electric buses (BEBs) to replace fossil fuel-powered buses (FFBs). When only considering the direct carbon emissions, there is a carbon asset for bus electrification. However, when considering both the direct and indirect carbon emissions, whether there is a carbon asset or a carbon debt, i.e. and whether the operational lifecycle carbon value of bus electrification (OLCVBE) is positive or negative, further discussions under different conditions are still required. It is also more persuasive to suggest how the carbon asset or carbon debt of bus electrification is determined when considering the embedded carbon emissions in the production process of electric power. Second, the annual OLCVBE is dependent on the annual driving distance of a bus, carbon price and the distance-specific carbon emission coefficient of the FFB, and it is also dependent on the electric consumption level of BEBs and the embedded carbon emission coefficient of the electric sources. The service-life OLCVBE is further dependent on the discounted rate of carbon value for bus companies and the terminations of the fossil fuel-powered or battery electric buses. Third, among the determinants of OLCVBE, the embedded carbon emission coefficient of the electric sources and the electric consumption level of BEBs as well as carbon price, but not the annual driving distance of a bus and the distance-specific carbon emission coefficient of FFBs, have much more impacts on OLCVBE.
By analysing the carbon asset or carbon debt of the transition from FFBs to BEBs on the perspective of an operational lifecycle carbon footprint, this paper introduces many more factors impacting on the carbon asset or carbon debt of bus electrification. This provides a much wider insight for understanding the environmental and economic value of the electrification of buses.
According to our analysis and conclusions, the following are implied in detail. First, a much wider insight is needed when analysing the environmental and economic effects of bus electrification. It should consider the embedded carbon emissions in the production process of electric power when calculating and analysing the carbon asset or carbon debt of bus electrification. Second, reducing the carbon emission coefficient of the electric sources or reducing the electric consumption level is also the way to increase the carbon asset of bus electrification or reduce the carbon debt of bus electrification, while another way is to improve the price of carbon emissions. Third, the advantages of BEBs are not only determined by their direct impacts on the environment, but also determined by the environmental impacts of the energy sources used by the buses. Thus, it should implement more comprehensive carbon reduction policies when considering the carbon reduction of BEBs to replace FFBs.

Author Contributions

Conceived, designed, and performed the experiments, analysed the data, wrote and revised the paper, X.X.; designed the research, supervised the whole process and revised the paper, L.H. All authors have read and approved the final manuscript.

Funding

The National Natural Science Foundation of China (71603174, 71673020, 71690244).

Acknowledgments

The authors are very grateful to have the paper manuscript reviewed by the journal editors and reviewers.

Conflicts of Interest

The authors declare no conflict of interest.

References

  1. He, X.; Zhang, S.; Ke, W.; Zheng, Y.; Wu, Y. Energy consumption and well-to-wheels air pollutant emissions of battery electric buses under complex operating conditions and implications on fleet electrification. J. Clean. Prod. 2018, 171, 714–722. [Google Scholar] [CrossRef]
  2. Zhang, S.; Wu, Y.; Liu, H.; Huang, R.; Hao, J. Real-world fuel consumption and CO2 emissions of urban public buses in Beijing. Appl. Energy 2014, 113, 1645–1655. [Google Scholar] [CrossRef]
  3. Ma, Y.; Ke, R.Y.; Han, R.; Tang, B. The analysis of the battery electric vehicle’s potentiality of environmental effect: A case study of Beijing from 2016 to 2020. J. Clean. Prod. 2017, 145, 395–406. [Google Scholar] [CrossRef]
  4. Wang, Z.; Chen, F.; Fujiyam, T. Carbon emission from urban passenger transportation in Beijing. Transp. Res. Part D Transp. Environ. 2015, 41, 217–227. [Google Scholar] [CrossRef]
  5. Marc, G.; Tobias, M.; Thomas, H. Estimation of the energy demand of electric buses based on real-world data for large-scale public transport networks. Appl. Energy 2018, 230, 344–356. [Google Scholar]
  6. Pagliaro, M.; Meneguzzo, F. Electric bus: A critical overview on the dawn of its widespread uptake. Adv. Sustain. Syst. 2019, 3, 1800151. [Google Scholar] [CrossRef]
  7. Cooney, G.; Hawkins, T.; Marriott, J. Life cycle assessment of diesel and electric public transportation buses. J. Ind. Ecol. 2013, 17, 689–698. [Google Scholar] [CrossRef] [Green Version]
  8. Sánchez, J.; Martínez, J.; Martín, J.; Holgado, M.; Morales, H. Impact of Spanish electricity mix, over the period 2008–2030, on the life cycle energy consumption and GHG emissions of electric, hybrid diesel-electric, fuel cell hybrid and diesel bus of the Madrid Transportation System. Energy Convers. Manag. 2013, 74, 332–343. [Google Scholar] [CrossRef]
  9. Ribau, J.; Silva, C.; Sousa, J. Efficiency, cost and life cycle CO2 optimization of fuel cell hybrid and plug-in hybrid urban buses. Appl. Energy 2014, 129, 320–335. [Google Scholar] [CrossRef]
  10. Harris, A.; Soban, D.; Smyth, B.; Best, R. Assessing life cycle impacts and the risk and uncertainty of alternative bus technologies. Renew. Sustain. Energy Rev. 2018, 97, 569–579. [Google Scholar] [CrossRef] [Green Version]
  11. Frey, H.; Rouphail, N.; Zhai, H.; Farias, T.; Gonçalves, G. Comparing real-world fuel consumption for diesel- and hydrogen-fueled transit buses and implication for emissions. Transp. Res. Part D Transp. Environ. 2007, 12, 281–291. [Google Scholar] [CrossRef]
  12. Ou, X.; Zhang, X.; Chang, S. Alternative fuel buses currently in use in China: Life-cycle fossil energy use, GHG emissions and policy recommendations. Energy Policy 2010, 38, 406–418. [Google Scholar] [CrossRef]
  13. Kliucininkas, L.; Matulevicius, J.; Martuzevicius, D. The life cycle assessment of alternative fuel chains for urban buses and trolley buses. J. Environ. Manag. 2012, 99, 98–103. [Google Scholar] [CrossRef] [PubMed]
  14. Xu, Y.; Gbologah, F.; Lee, D.; Liu, H.; Rodgers, M.; Guensler, R. Assessment of alternative fuel and powertrain transit bus options using real-world operations data: Life-cycle fuel and emissions modeling. Appl. Energy 2015, 154, 143–159. [Google Scholar] [CrossRef]
  15. Ercan, T.; Noori, M.; Zhao, Y.; Tatari, O. On the front lines of a sustainable transportation fleet: Applications of vehicle-to-grid technology for transit and school buses. Energies 2016, 9, 230. [Google Scholar] [CrossRef] [Green Version]
  16. Zhou, B.; Wu, Y.; Zhou, B.; Wang, R.; Hao, J. Real-world performance of battery electric buses and their life-cycle benefits with respect to energy consumption and carbon dioxide emissions. Energy 2016, 96, 603–613. [Google Scholar] [CrossRef]
  17. Lajunen, A.; Lipman, T. Lifecycle cost assessment and carbon dioxide emissions of diesel, natural gas, hybrid electric, fuel cell hybrid and electric transit buses. Energy 2016, 106, 329–342. [Google Scholar] [CrossRef]
  18. Nordelöf, A.; Romare, M.; Tivander, J. Life cycle assessment of city buses powered by electricity, hydrogenated vegetable oil or diesel. Transp. Res. Part D Transp. Environ. 2019, 75, 211–222. [Google Scholar] [CrossRef]
  19. Xylia, M.; Leduc, S.; Laurent, A.; Patrizio, P.; Silveira, S. Impact of bus electrification on carbon emissions: The case of Stockholm. J. Clean. Prod. 2019, 209, 74–87. [Google Scholar] [CrossRef] [Green Version]
  20. Chan, S.; Miranda-Moreno, L.; Alam, A.; Hatzopoulou, M. Assessing the impact of bus technology on greenhouse gas emissions along a major corridor: A lifecycle analysis. Transp. Res. Part D Transp. Environ. 2013, 20, 7–11. [Google Scholar] [CrossRef]
  21. Song, Q.; Wang, Z.; Wu, Y.; Li, J.; Yuan, W. Could urban electric public bus really reduce the GHG emissions: A case study in Macau? J. Clean. Prod. 2018, 172, 2133–2142. [Google Scholar] [CrossRef]
  22. Xu, X.; Lv, X.; Han, L. Carbon asset of electrification: Valuing the transition from fossil fuel-powered buses to battery electric buses in Beijing. Sustainability 2019, 11, 2749. [Google Scholar] [CrossRef] [Green Version]
  23. Han, L.; Liu, Y.; Lin, Q.; Huang, G. Valuing carbon assets for high-tech with application to the wind energy industry. Energy Policy 2015, 87, 347–358. [Google Scholar] [CrossRef]
  24. Xu, X.; Guan, C.; Jin, J. Valuing the carbon assets of distributed photovoltaic generation in China. Energy Policy 2018, 121, 374–382. [Google Scholar] [CrossRef]
  25. Bakker, S.; Konings, R. The transition to zero-emission buses in public transport—The need for institutional innovation. Transp. Res. Part D Transp. Environ. 2018, 64, 204–215. [Google Scholar] [CrossRef]
  26. Dreier, D.; Silveira, S.; Khatiwada, D.; Fonseca, K.; Schepanski, R. Well-to-Wheel analysis of fossil energy use and greenhouse gas emissions for conventional, hybrid-electric and plug-in hybrid-electric city buses in the BRT system in Curitiba, Brazil. Transp. Res. Part D Transp. Environ. 2018, 58, 122–138. [Google Scholar] [CrossRef]
  27. Lee, D.; Elgowainy, A.; Vijayagopal, R. Well-to-wheel environmental implications of fuel economy targets for hydrogen fuel cell electric buses in the United States. Energy Policy 2019, 128, 565–583. [Google Scholar] [CrossRef]
  28. Dong, D.; Duan, H.; Mao, R.; Song, Q.; Zuo, J.; Zhu, J.; Wang, G.; Hu, M.; Dong, B.; Liu, G. Towards a low carbon transition of urban public transport in megacities: A case study of Shenzhen, China. Resour. Conserv. Recycl. 2018, 134, 149–155. [Google Scholar] [CrossRef]
  29. Harris, A.; Soban, D.; Smyth, B.; Best, R. A probabilistic fleet analysis for energy consumption, life cycle cost and greenhouse gas emissions modelling of bus technologies. Appl. Energy 2020, 261, 114422. [Google Scholar] [CrossRef]
  30. Wang, C.; Ye, Z.; Yu, Y.; Gong, W. Estimation of bus emission models for different fuel types of buses under real conditions. Sci. Total Environ. 2018, 640–641, 965–972. [Google Scholar] [CrossRef]
  31. Wei, R.; Liu, X.; Ou, Y.; Fayyaz, K. Optimising the spatio-temporal deployment of battery electric bus system. J. Transp. Geogr. 2018, 68, 160–168. [Google Scholar] [CrossRef]
  32. Xylia, M.; Silveira, S. The role of charging technologies in upscaling the use of electric buses in public transport: Experiences from demonstration projects. Transp. Res. Part A Policy Pract. 2018, 118, 399–415. [Google Scholar] [CrossRef]
  33. Rupp, M.; Handschuh, N.; Rieke, C.; Kuperjans, I. Contribution of country-specific electricity mix and charging time to environmental impact of battery electric vehicles: A case study of electric buses in Germany. Appl. Energy 2019, 237, 618–634. [Google Scholar] [CrossRef]
  34. Vepsäläinen, J.; Otto, K.; Lajunen, A.; Tammi, K. Computationally efficient model for energy demand prediction of electric city bus in varying operating conditions. Energy 2019, 169, 433–443. [Google Scholar] [CrossRef]
  35. Ye, L.; Liang, C.; Liu, Y.; Li, D.; Liu, Z. Performance analysis and test of a novel eddy-current braking & heating system for electric bus. Energy Convers. Manag. 2019, 183, 440–449. [Google Scholar]
  36. Miles, J.; Potter, S. Developing a viable electric bus service: The Milton Keynes demonstration project. Res. Transp. Econ. 2014, 48, 357–363. [Google Scholar] [CrossRef]
  37. Lajunen, A. Lifecycle costs and charging requirements of electric buses with different charging methods. J. Clean. Prod. 2018, 172, 56–67. [Google Scholar] [CrossRef]
  38. Teoh, L.; Khoo, H.; YokeGoh, S.; Chong, L. Scenario-based electric bus operation: A case study of Putrajaya, Malaysia. Int. J. Transp. Sci. Technol. 2018, 7, 10–25. [Google Scholar] [CrossRef]
  39. Rogge, M.; Evelien, H.; Larsen, A.; Sauer, D. Electric bus fleet size and mix problem with optimization of charging infrastructure. Appl. Energy 2018, 211, 282–295. [Google Scholar] [CrossRef] [Green Version]
  40. Coleman, D.; Kopp, M.; Wagner, T.; Scheppat, B. The value chain of green hydrogen for fuel cell buses—A case study for the Rhine-Main area in Germany. Int. J. Hydrog. Energy 2020, 814, 5122–5133. [Google Scholar] [CrossRef]
  41. Li, W.; Jia, Z.; Zhang, H. The impact of electric vehicles and CCS in the context of emission trading scheme in China: A CGE-based analysis. Energy 2016, 119, 800–816. [Google Scholar] [CrossRef]
  42. Li, X.; Castellanos, S.; Maassen, A. Emerging trends and innovations for electric bus adoption—A comparative case study of contracting and financing of 22 cities in the Americas, Asia-Pacific, and Europe. Res. Transp. Econ. 2018, 69, 470–481. [Google Scholar] [CrossRef]
  43. Islam, A.; Lownes, N. When to go electric? A parallel bus fleet replacement study. Transp. Res. Part D Transp. Environ. 2019, 72, 299–311. [Google Scholar] [CrossRef]
  44. Mahmoud, M.; Garnett, R.; Ferguson, M.; Kanaroglou, P. Electric buses: A review of alternative powertrains. Renew. Sustain. Energy Rev. 2016, 62, 673–684. [Google Scholar] [CrossRef]
  45. Stempien, J.; Chan, S. Comparative study of fuel cell, battery and hybrid buses for renewable energy constrained areas. J. Power Sour. 2017, 34, 347–355. [Google Scholar] [CrossRef]
Figure 1. Components and features of the lifecycle carbon emissions of a fossil fuel or electric bus.
Sustainability 12 03784 g001
Figure 2. The price of carbon emissions enacted in Guangdong (December 19, 2013–May 31, 2019; unit: Yuan/ton).
Sustainability 12 03784 g002
Table 1. Representative studies on the lifecycle carbon emissions of bus electrification.
Authors (Year)ObjectiveScenariosBus TypeLocationConclusion
Sánchez et al. (2013) [8]energy consumption and greenhouse gas (GHG) emissions operating phase (Well-to-Wheel, WTW)electric, hybrid diesel-electric, fuel cell hybrid and diesel busesSpainBus electrification has a big potential for improvement in GHG emission reduction.
Zhou et al. (2016) [16]lifecycle CO2 emissions on-road environmentthe on-road diesel or electric busesMacau, ChinaAn electric bus cuts 20%–35% of CO2 emissions of a diesel bus.
Lajunen and Lipman (2016) [17]lifecycle CO2 emissions induced by the primary energy sourcesoperating environmentdiesel, natural gas, hybrid electric, fuel cell hybrid and electric transit busesFinland and California (USA)Hybrid buses have moderately lower CO2 emissions than diesel buses during their service life, whereas fully electric buses have reduced CO2 emissions by up to 75%.
Dreier et al. (2018) [26]Well-to-Wheel fossil energy use and GHG emissions operation phase (Tank-to-Wheel, TTW)conventional, hybrid-electric and plug-in hybrid-electric city busesCuritiba, Brazil The hybrid bus and the plug-in hybrid bus emit 30% and 72% less Well-to-Wheel GHG compared to a conventional bus and advanced powertrains.
Song et al. (2018) [21]streamlined lifecycle GHG emissionsoperation stageelectric public buses and traditional diesel public busesMacau, ChinaElectric public buses, compared with traditional diesel public buses, hardly reduce GHG emissions when considering the charging loss and electricity distribution loss.
Dong et al. (2018) [28]streamlined lifecycle carbon emissions and corresponding carbon intensity reduction potentialsoperation stageurban public transport system including bus and subwayShenzhen, ChinaCarbon mitigation of Shenzhen’s ‘green’ transport mode has low effectiveness.
Lee et al. (2019) [27] lifecycle air emissionsWell-to-wheel environmentfuel cell electric school or transit busesUSAThe Well-to-Wheel air emissions will decrease for hydrogen fuel cell electric buses, in comparison with diesel buses.
Xylia et al. (2019) [19]Carbon emissions of the fuels and of the batteriesstage with energy consumption a partially electrified bus networkStockholmBus electrification will reduce local pollutants, but its total environmental impact is determined by the fuel choices.
Nordelöf et al. (2019) [18]life cycle carbon emission level From material production to End-of-Lifecity busesSweden, the European Union and USAThe life cycle carbon emission level of city buses is dependent on the degree of electrification, electricity supply mix and choice of diesel or hydrogenated vegetable oil.
Harris et al. (2020) [29]life cycle GHG emissionsbus fleet operationbuses with different technologiesUKThere is decreased potential for battery-electric buses to reduce GHG emissions.
Table 2. Basic information of the heavy-duty buses in the example.
Vehicle No.TypeTime of ManufactureOdometer (km)Gross Vehicle Weight (kg)Engine Displacement (L)Passenger Capacity
Heavy-duty BusesD9KING LONG KLQ6101G A/T2006–12–26190,88015,0005.975
D10KING LONG KLQ6101G A/T2006–12–26198,55015,0005.975
D11KING LONG KLQ6101GE3 A/T2008–8–26123,88815,0006.775
D12KING LONG2008–9–5109,11615,0006.775
D13KING LONG KLQ6930GE3 A/T2009–9–972,78814,0006.775
Table 3. Basic information and electricity consumption of the battery electric buses (BEBs) in the example.
Vehicle NumberElectricity BusLength (m)Gross Vehicle Weight (kg)Battery Capacity (kwh)Battery Weight (kg)Electricity Consumption (kWh/100 km)
MeanMin.Max.
E1Ankai HFF6128G03 EV1218,000320 Ah/538 V/170 kWh1800176159192
E2BYD K9D1218,000600 Ah/540 V/324 kWh3654138123153
Table 4. Embedded carbon emission coefficients of electric power from different electricity mixes (kg CO2eq/kWh).
Electricity MixAverageMacau Power PlantsHeavy OilNatural GasChina’s Southern Power GridSolar Energy
Emission factor0.760.690.710.420.780.09
Note: Macau power plants are the local power plants in Macau. Average means the average value of embedded carbon emissions of the electricity used in Macau. The results are referred to Song et al. (2018) [21].
Table 5. The annual OLCVBE with the changes of electric power sources or electricity consumption levels of BEBs in Macau (Yuan/Year).
BusElectric SourceMeanMin.Max.
E1average−319.05 −133.70 −493.49
Macau power plants−142.31 25.97 −300.68
heavy oil−192.80 −19.65 −355.77
natural gas539.39 641.82 442.99
China’s Southern Power Grid−369.54 −179.32 −548.58
solar energy1372.59 1394.54 1351.93
E2average95.25 258.79 −68.29
Macau power plants233.83 382.31 85.36
heavy oil194.24 347.02 41.46
natural gas768.35 858.73 677.97
China’s Southern Power Grid55.66 223.50 −112.18
solar energy1421.65 1441.02 1402.28
Note: The results are calculated according to Formula (5), when the carbon price gets its average value, i.e., P t = 24.75 Yuan, the distance-specific carbon emission level of fuel-powered buses (FFBs) gets its average value, the electric power consumptionn levels of the BEBs get the values with fluctuations, as shown in Table 3, and the embedded carbon emission coefficients of the electricity with different sources obtain values as shown in Table 4.
Table 6. The annual OLCVBE with the change of the distance-specific carbon emission level of FFBs in Macau (Yuan/Year).
BusElectric SourceMeanMean + sd.Mean − sd.
E1average−319.05 −227.77 −410.89
Macau power plants−142.31 −50.75 −233.87
heavy oil−192.80 −101.24 −284.36
natural gas539.39 630.95 447.83
China’s Southern Power Grid−369.54 −277.98 −461.10
solar energy1372.59 1464.15 1281.03
E2average95.25 186.81 3.69
Macau power plants233.83 325.39 142.27
heavy oil194.24 285.80 102.68
natural gas768.35 859.91 676.79
China’s Southern Power Grid55.66 147.22 −35.90
solar energy1421.65 1513.21 1330.09
Note: The results are calculated according to Formula (5) when the carbon price gets its average value, i.e., P t = 24.75   Yuan , the electric power consumption levels of the BEBs get the values with fluctuations as shown in Table 3; the embedded carbon emission coefficients of the electricity with different sources get different values, as shown in Table 4, and the distance-specific carbon emission level of FFBs get the mean value and the values of mean, plus or minus standard deviation.
Table 7. The service-life OLCVBE in Macau (Yuan).
BusElectric sourceMeanMin.Max.mean + sd.Mean − sd.
E1average−2182.27 −914.51 −3375.46 −1556.00 −2808.55
Macau power plants−973.39 177.60 −2056.68 −347.12 −1599.66
heavy oil−1318.78 −134.43 −2433.47 −692.51 −1945.06
natural gas3689.46 4390.06 3030.07 4315.73 3063.19
China’s Southern Power Grid−2527.67 −1226.55 −3752.26 −1901.40 −3153.94
solar energy9388.49 9538.62 9247.19 10014.76 8762.22
E2average651.54 1770.15 −467.07 1277.81 25.27
Macau power plants1599.42 2615.00 583.84 2225.69 973.15
heavy oil1328.60 2373.62 283.58 1954.87 702.33
natural gas5255.51 5873.69 4637.33 5881.78 4629.24
China’s Southern Power Grid380.72 1528.77 −767.33 1006.99 −245.55
solar energy9724.08 9856.54 9591.61 10350.35 9097.81
Note: The unit for the variables in this table is Yuan per year, and the results in the five columns are all calculated according to Formula (7). The results in the first column are gathered when the electric power consumption levels of the BEBs get the values with fluctuations, as Table 3 shows, and the other variables achieve their average values. The results in the second column are gathered when the distance-specific electric power consumption level of BEBs achieve their minimum values. The results in the third column are gathered when the distance-specific electric power consumption level of BEBs achieve their maximum values. The results in the fourth column are gathered when the distance-specific carbon emission level of FFBs gets the value of mean plus standard deviation. The results in the fifth column are gathered according to when the distance-specific carbon emission level of FFBs gets the values of mean minus standard deviation.
Table 8. Impacts of the determinants on the annual OLCVBE in Macau.
Type of BusElectricity Mix TypeDerivative of Annual OLCVBE with Respect to Carbon PriceDerivative of Annual OLCVBE with Respect to the Annual Driving Distance of a BusDerivative of Annual OLCVBE Respect to the Electric Consumption LevelDerivative of Annual OLCVBE with Respect to the Embedded Carbon Emission Coefficient of Electric Power
E1average−12.90−0.551−10.90 −2524.82
Macau power plants−5.75−0.246−9.90 −2524.82
heavy oil−7.79−0.333−10.19 −2524.82
natural gas21.790.9306−6.03 −2524.82
China’s Southern Power Grid−14.932−0.638−11.19 −2524.82
solar energy55.462.3681−1.29 −2524.82
E2average3.850.1643−10.90 −1979.69
Macau power plants9.450.4034−9.90 −1979.69
heavy oil7.850.3351−10.19 −1979.69
natural gas31.041.3256−6.03 −1979.69
China’s Southern Power Grid2.250.096−11.19 −1979.69
solar energy57.442.4527−1.29 −1979.69
Note: By substituting the variables from Section 4 into Formula (8), the results in the first column are achieved. Similarly, by substituting the variables from Section 4 into Formula (9), Formula (10) and Formula (11), the results in the second, third or fourth columns are achieved. The unit of the annual driving distance of a bus is 100 km. The unit of the electric consumption level is kWh/100 km. The unit of the embedded carbon emission coefficient of electric power is kg CO2eq/kWh.
Table 9. Impacts of the determinants on the service-life OLCVBE in Macau.
Type of BusElectricity Mix TypeDerivative of Annual OLCVBE with Respect to Carbon PriceDerivative of Annual OLCVBE with Respect to the Annual Driving Distance of a BusDerivative of Annual OLCVBE with Respect to the Electric Consumption LevelDerivative of Annual OLCVBE with Respect to the Embedded Carbon Emission Coefficient of Electric Power
E1average−88.2520138−3.768−74.57 −17,269.80
Macau power plants−39.3288399−1.679−67.71 −17,269.80
heavy oil−53.2842348−2.275−69.67 −17,269.80
natural gas149.06899016.3653−41.21 −17,269.80
China’s Southern Power Grid−102.128117−4.361−76.54 −17,269.80
solar energy379.333004516.1977−8.83 −17,269.80
E2average26.324949311.1241−74.57 −13,541.09
Macau power plants64.622993042.7594−67.71 −13,541.09
heavy oil53.680694832.2922−69.67 −13,541.09
natural gas212.34401889.0672−41.21 −13,541.09
China’s Southern Power Grid15.38265110.6568−76.54 −13,541.09
solar energy392.891939316.7766−8.83 −13,541.09
Note: By substituting the variables from Section 4 into Formula (12), the results in the first column are achieved. Similarly, by substituting the variables from Section 4 into Formula (13), Formula (14) and Formula (15), the results in the second, third or fourth columns are achieved. The unit of the annual driving distance of a bus is 100 km. The unit of the electric consumption level is kWh/100 km. The unit of the embedded carbon emission coefficient of electric power is kg CO2eq/kWh.

