Sustainability Assessment of a Single-Use Plastics Ban


Abstract
1. Introduction
2. Materials and Methods
2.1. Goal and Scope Definition
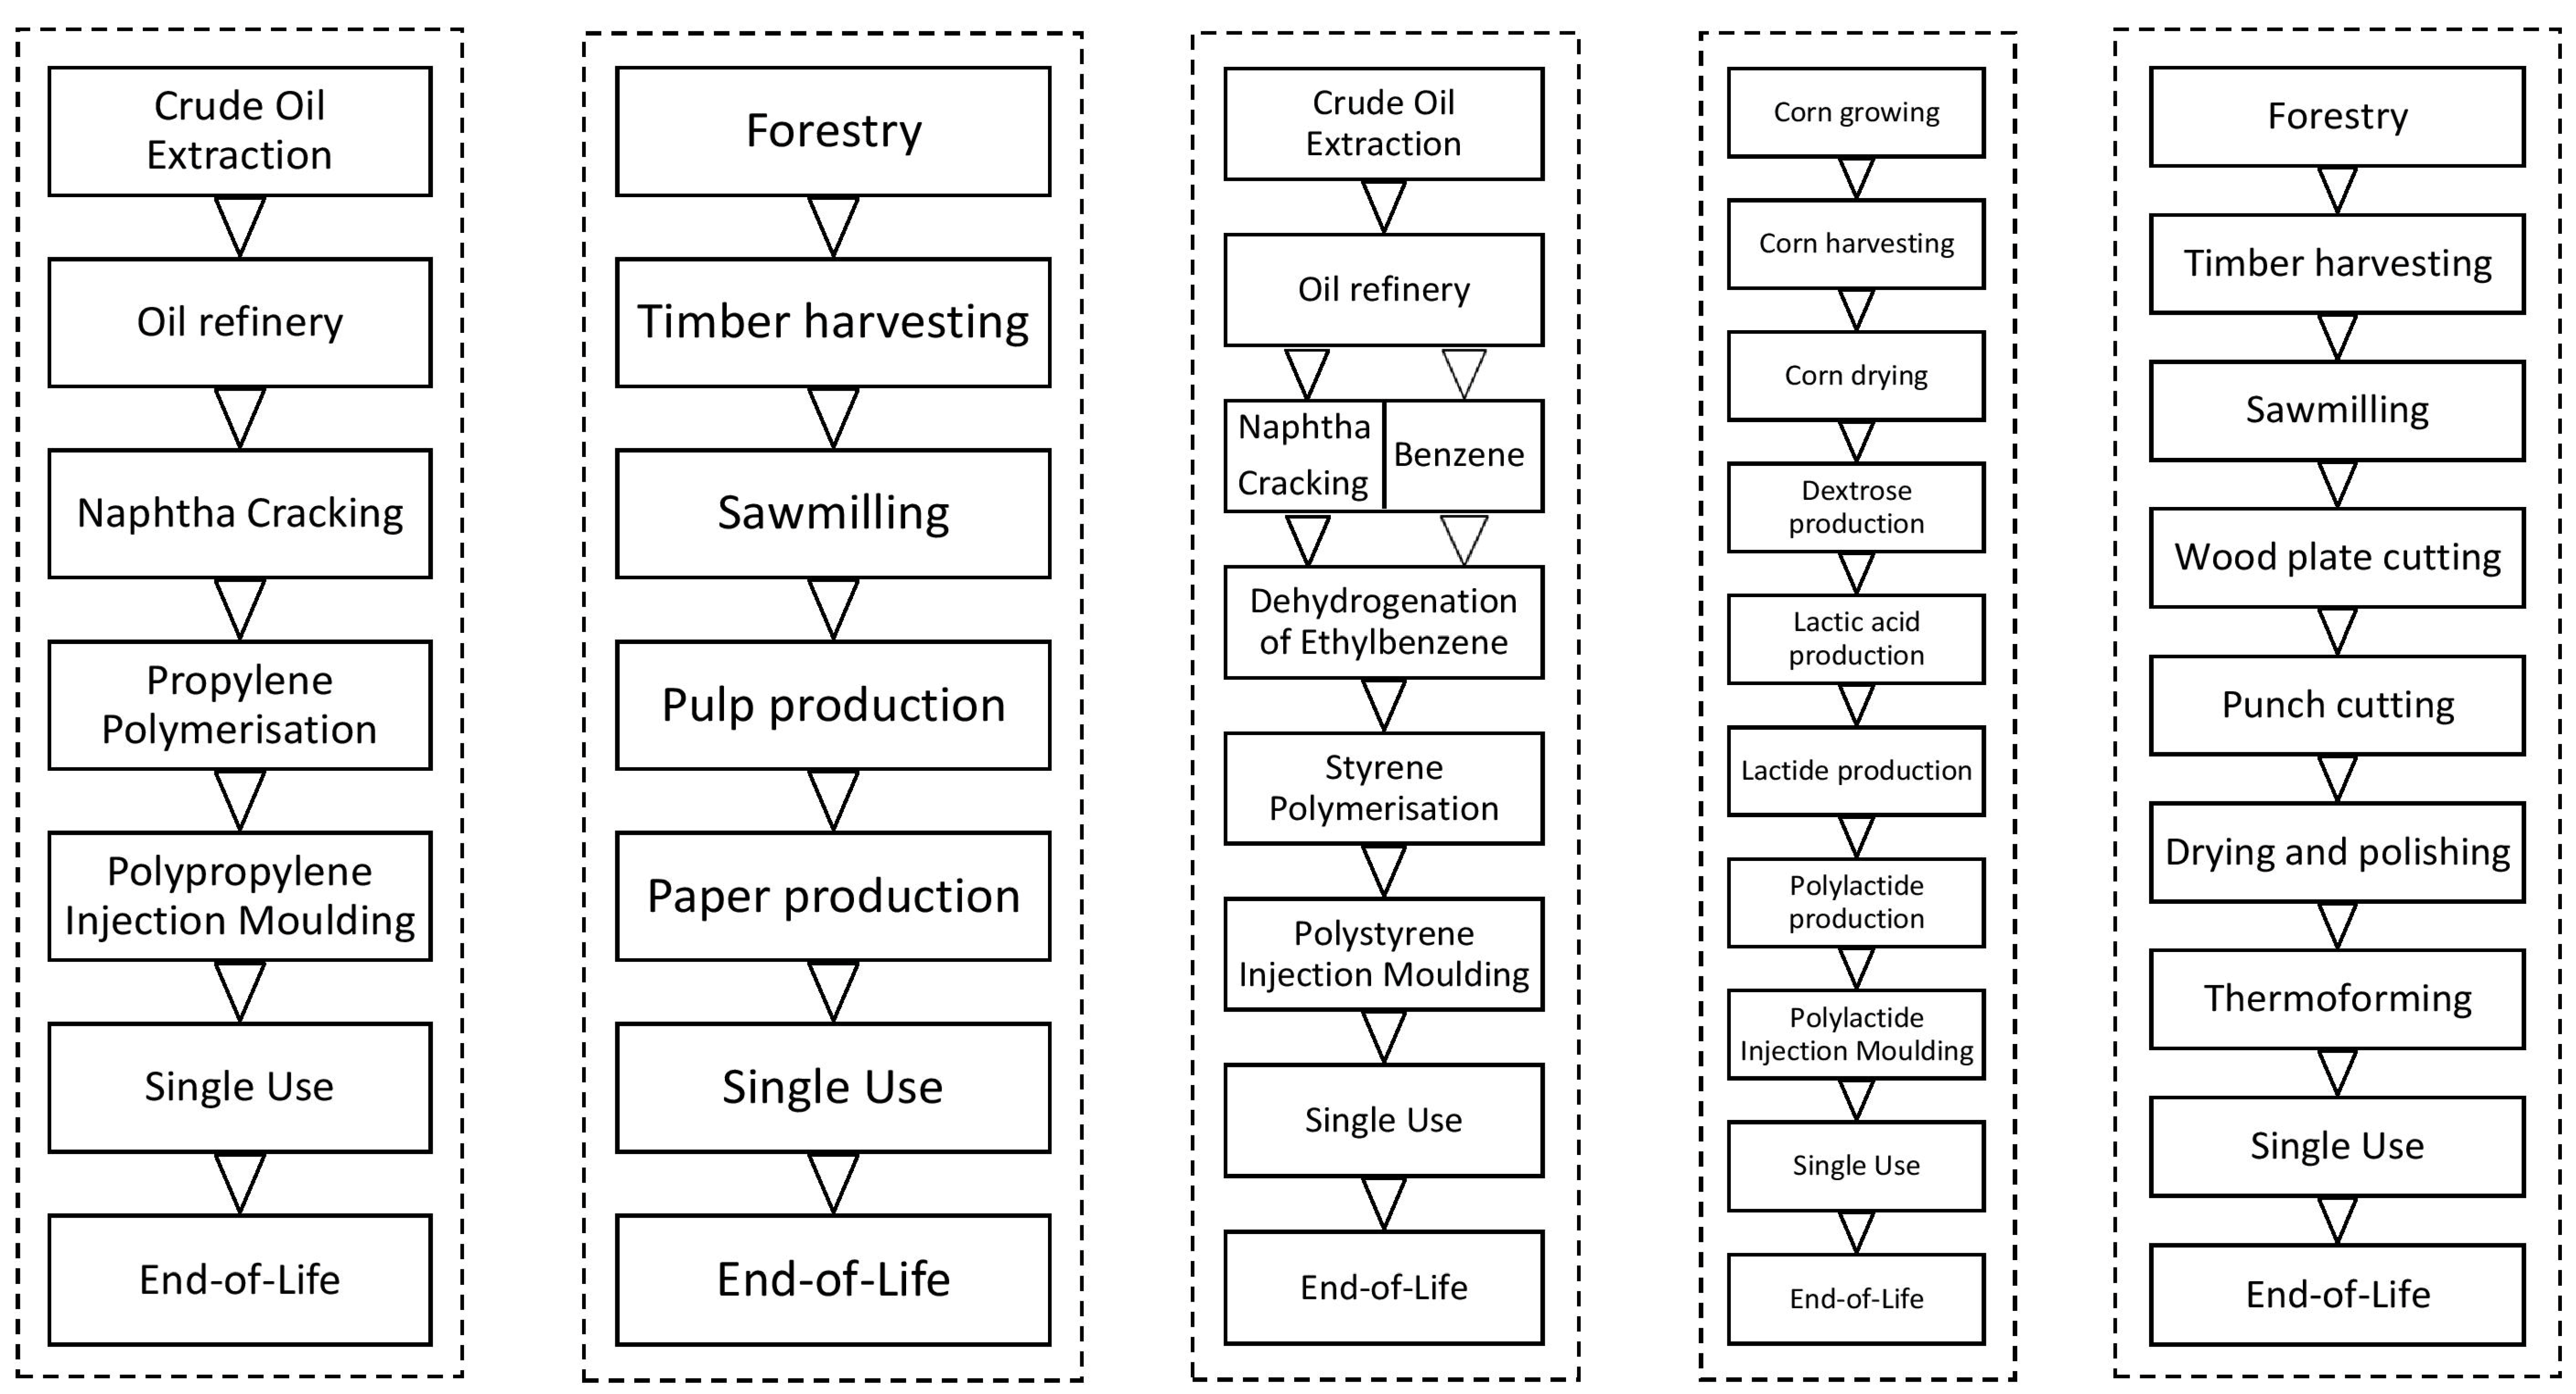
2.1.1. Product Systems and Their Functions
2.1.2. System Boundaries and Allocation
2.1.3. Impact Categories, Category Indicator Results and Methodology of Impact Assessment
2.1.4. Data and Assumptions
2.2. Inventory Analysis
2.3. Impact Assessment
2.4. Sensitivity Analysis 1
2.5. Assessment of the Single-Use Plastics Ban
2.6. Sensitivity Analysis 2
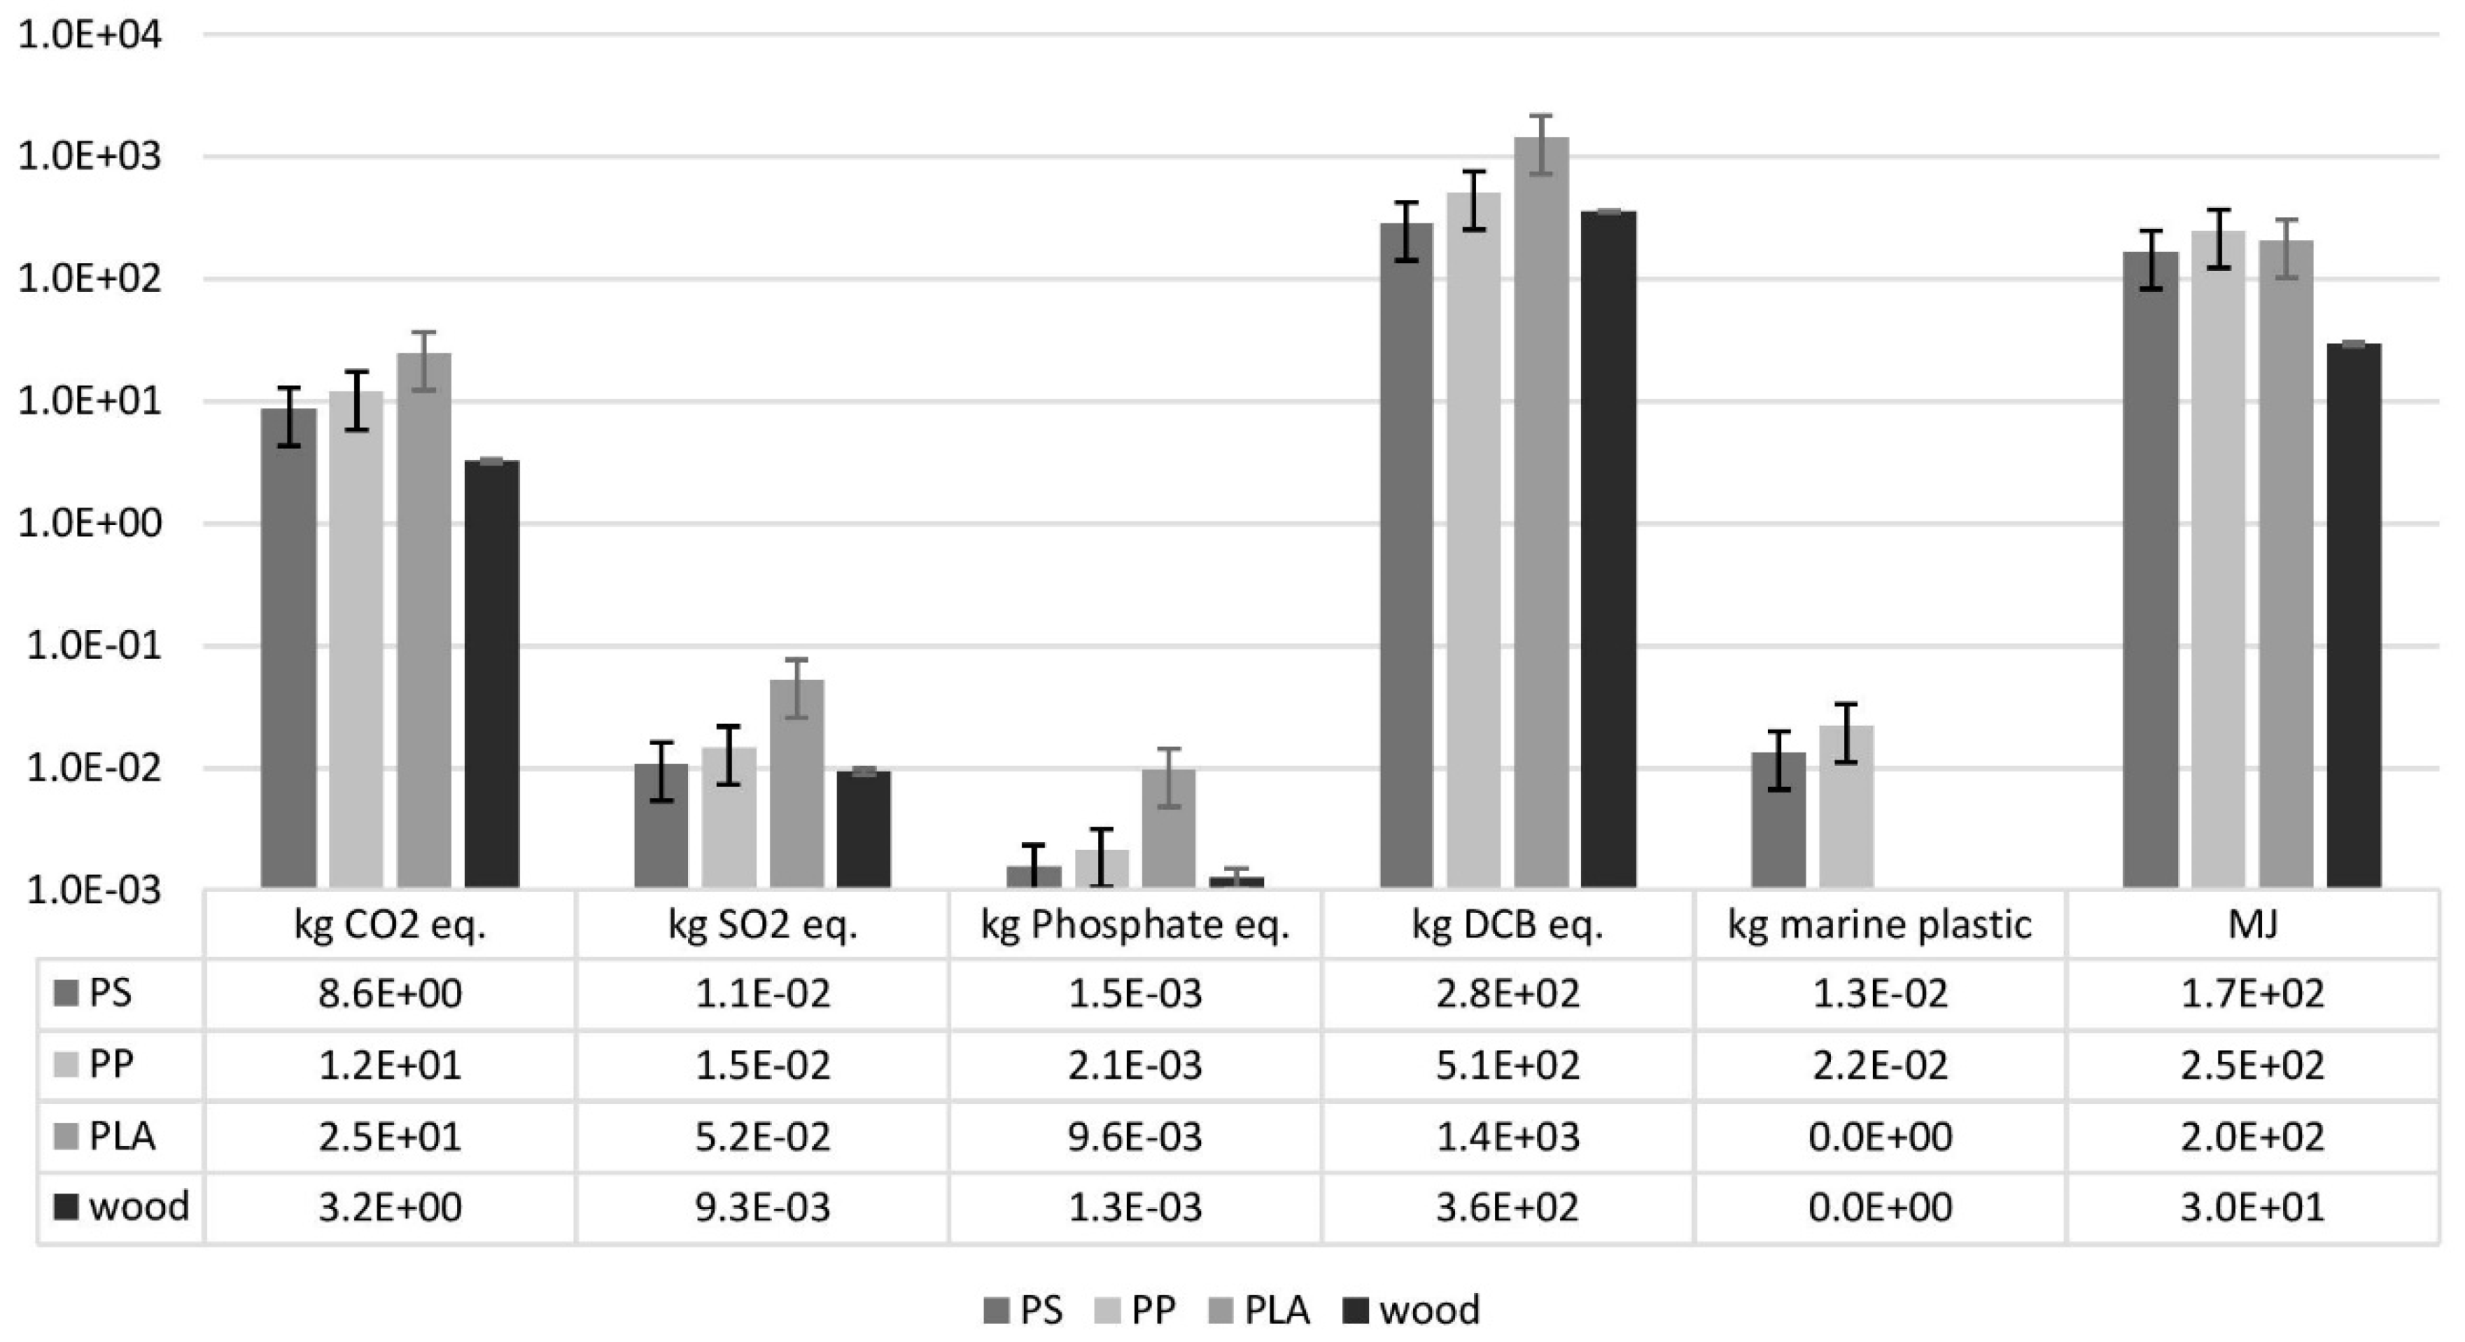
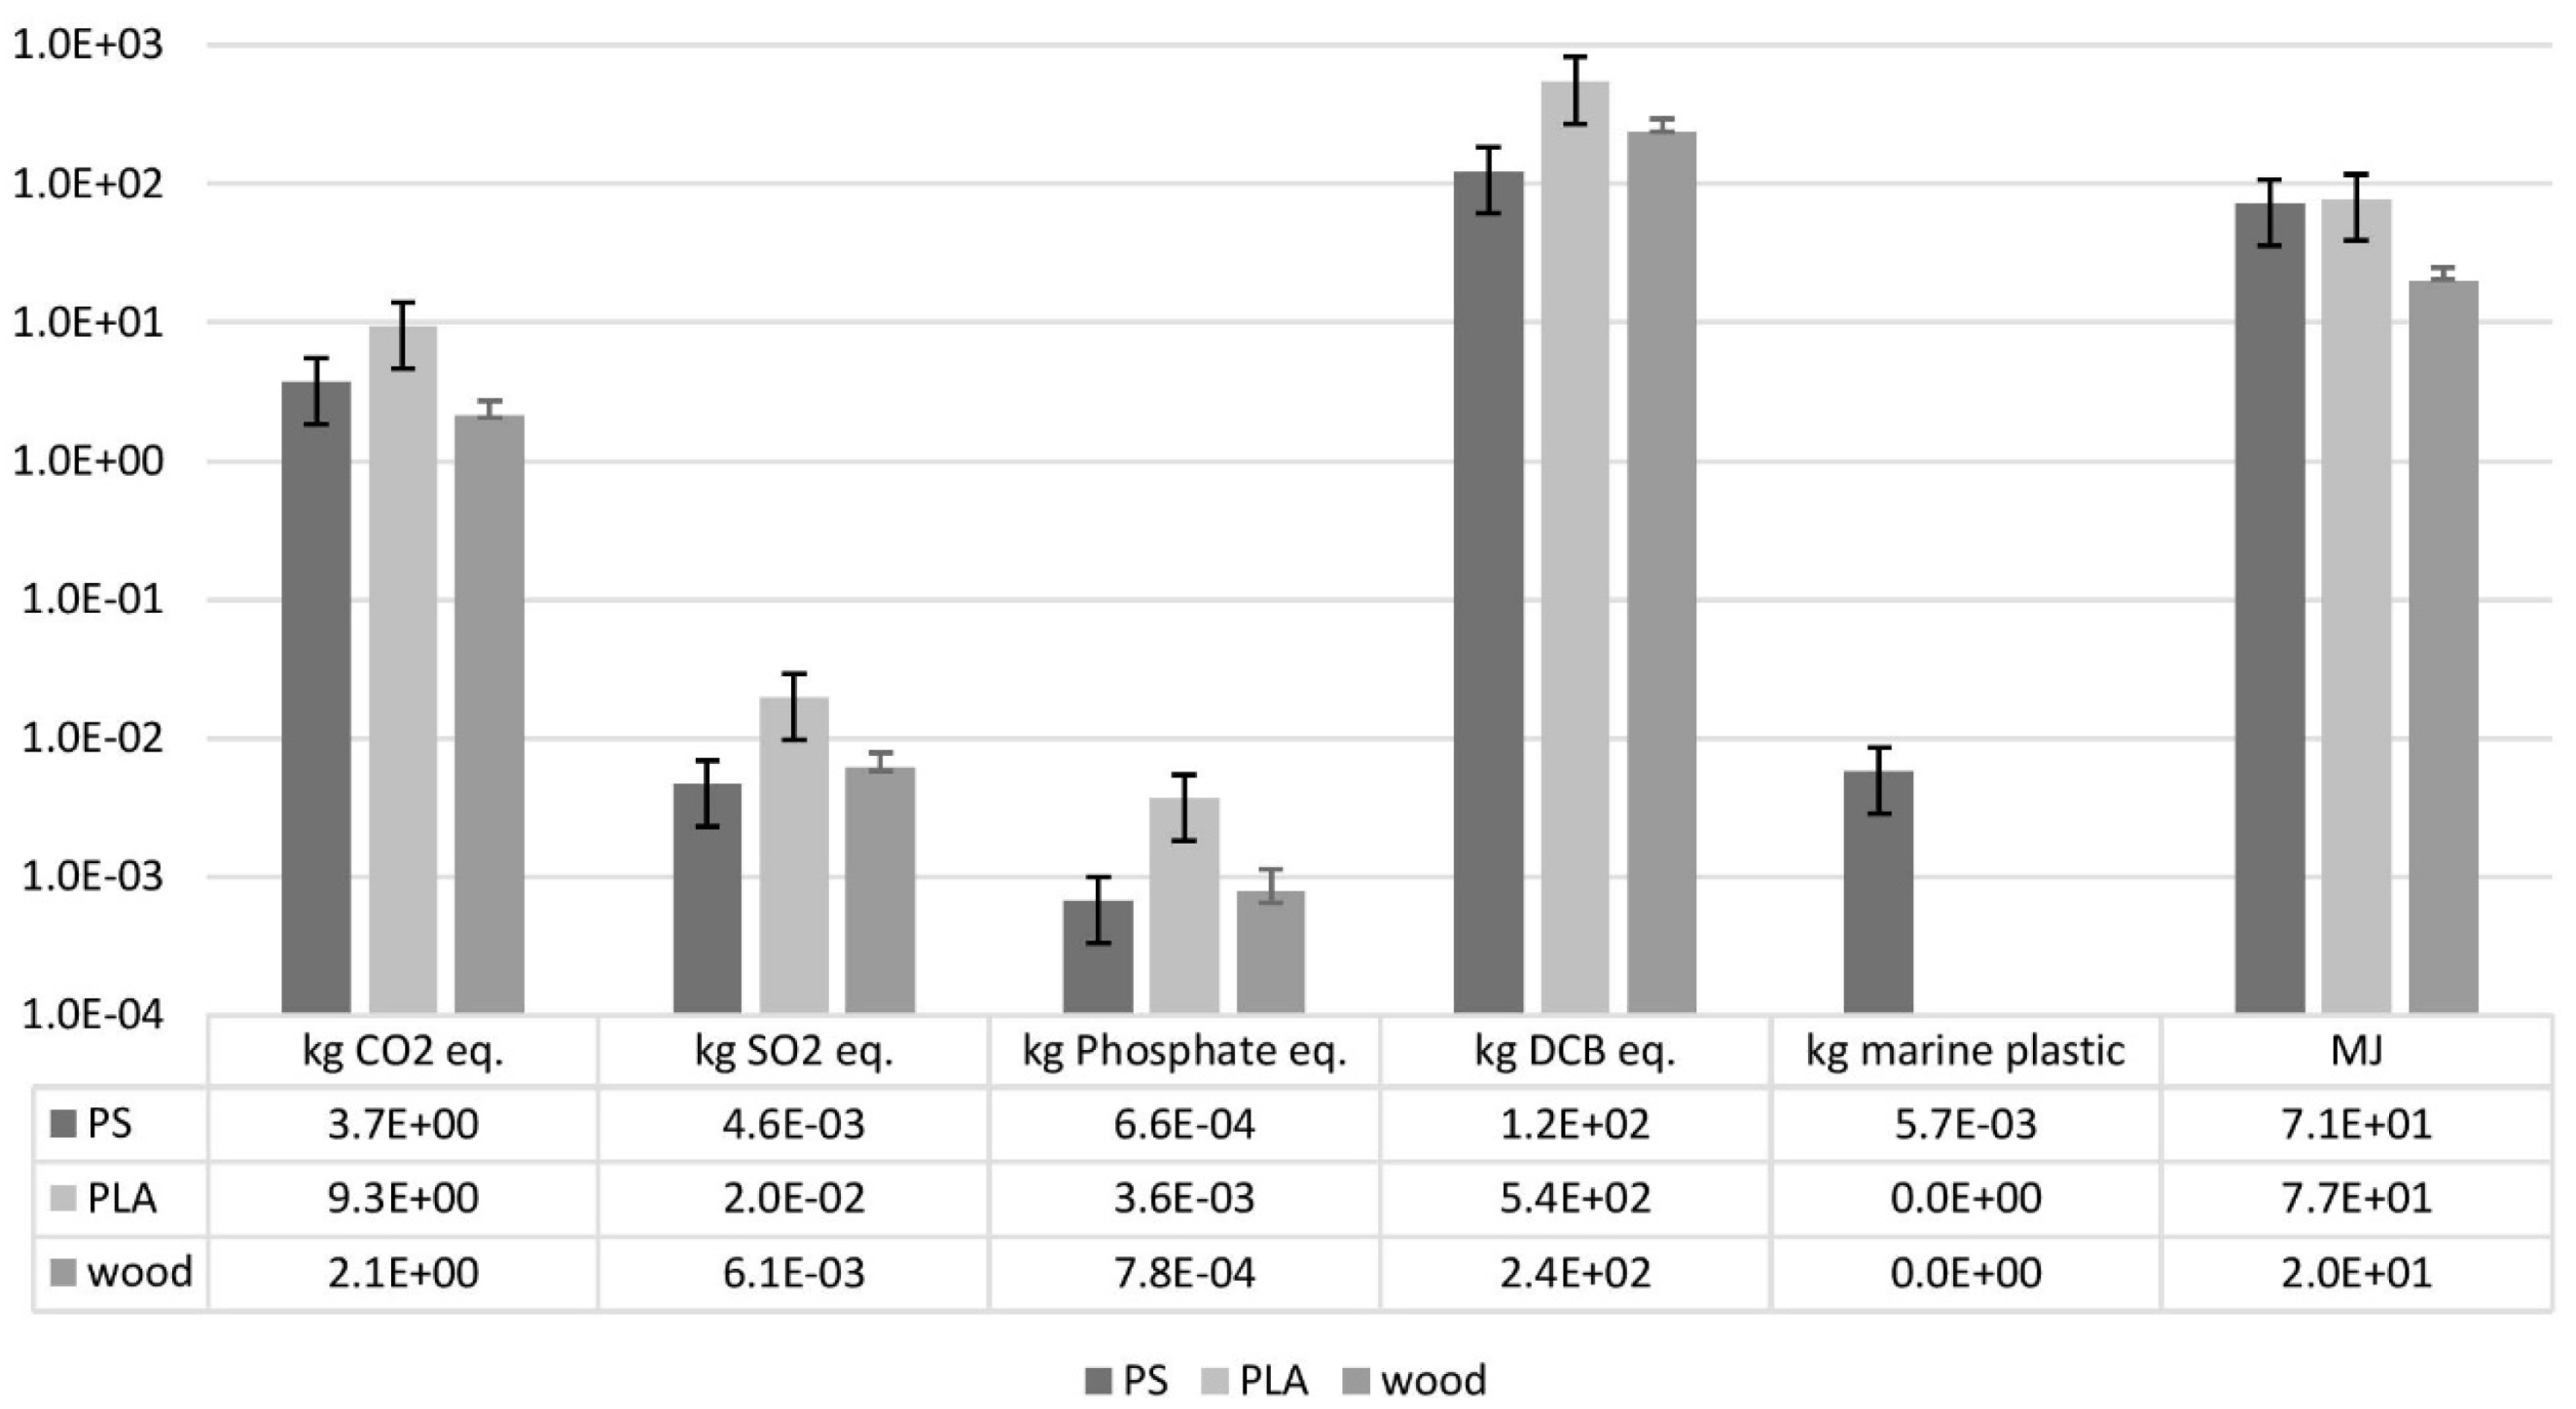
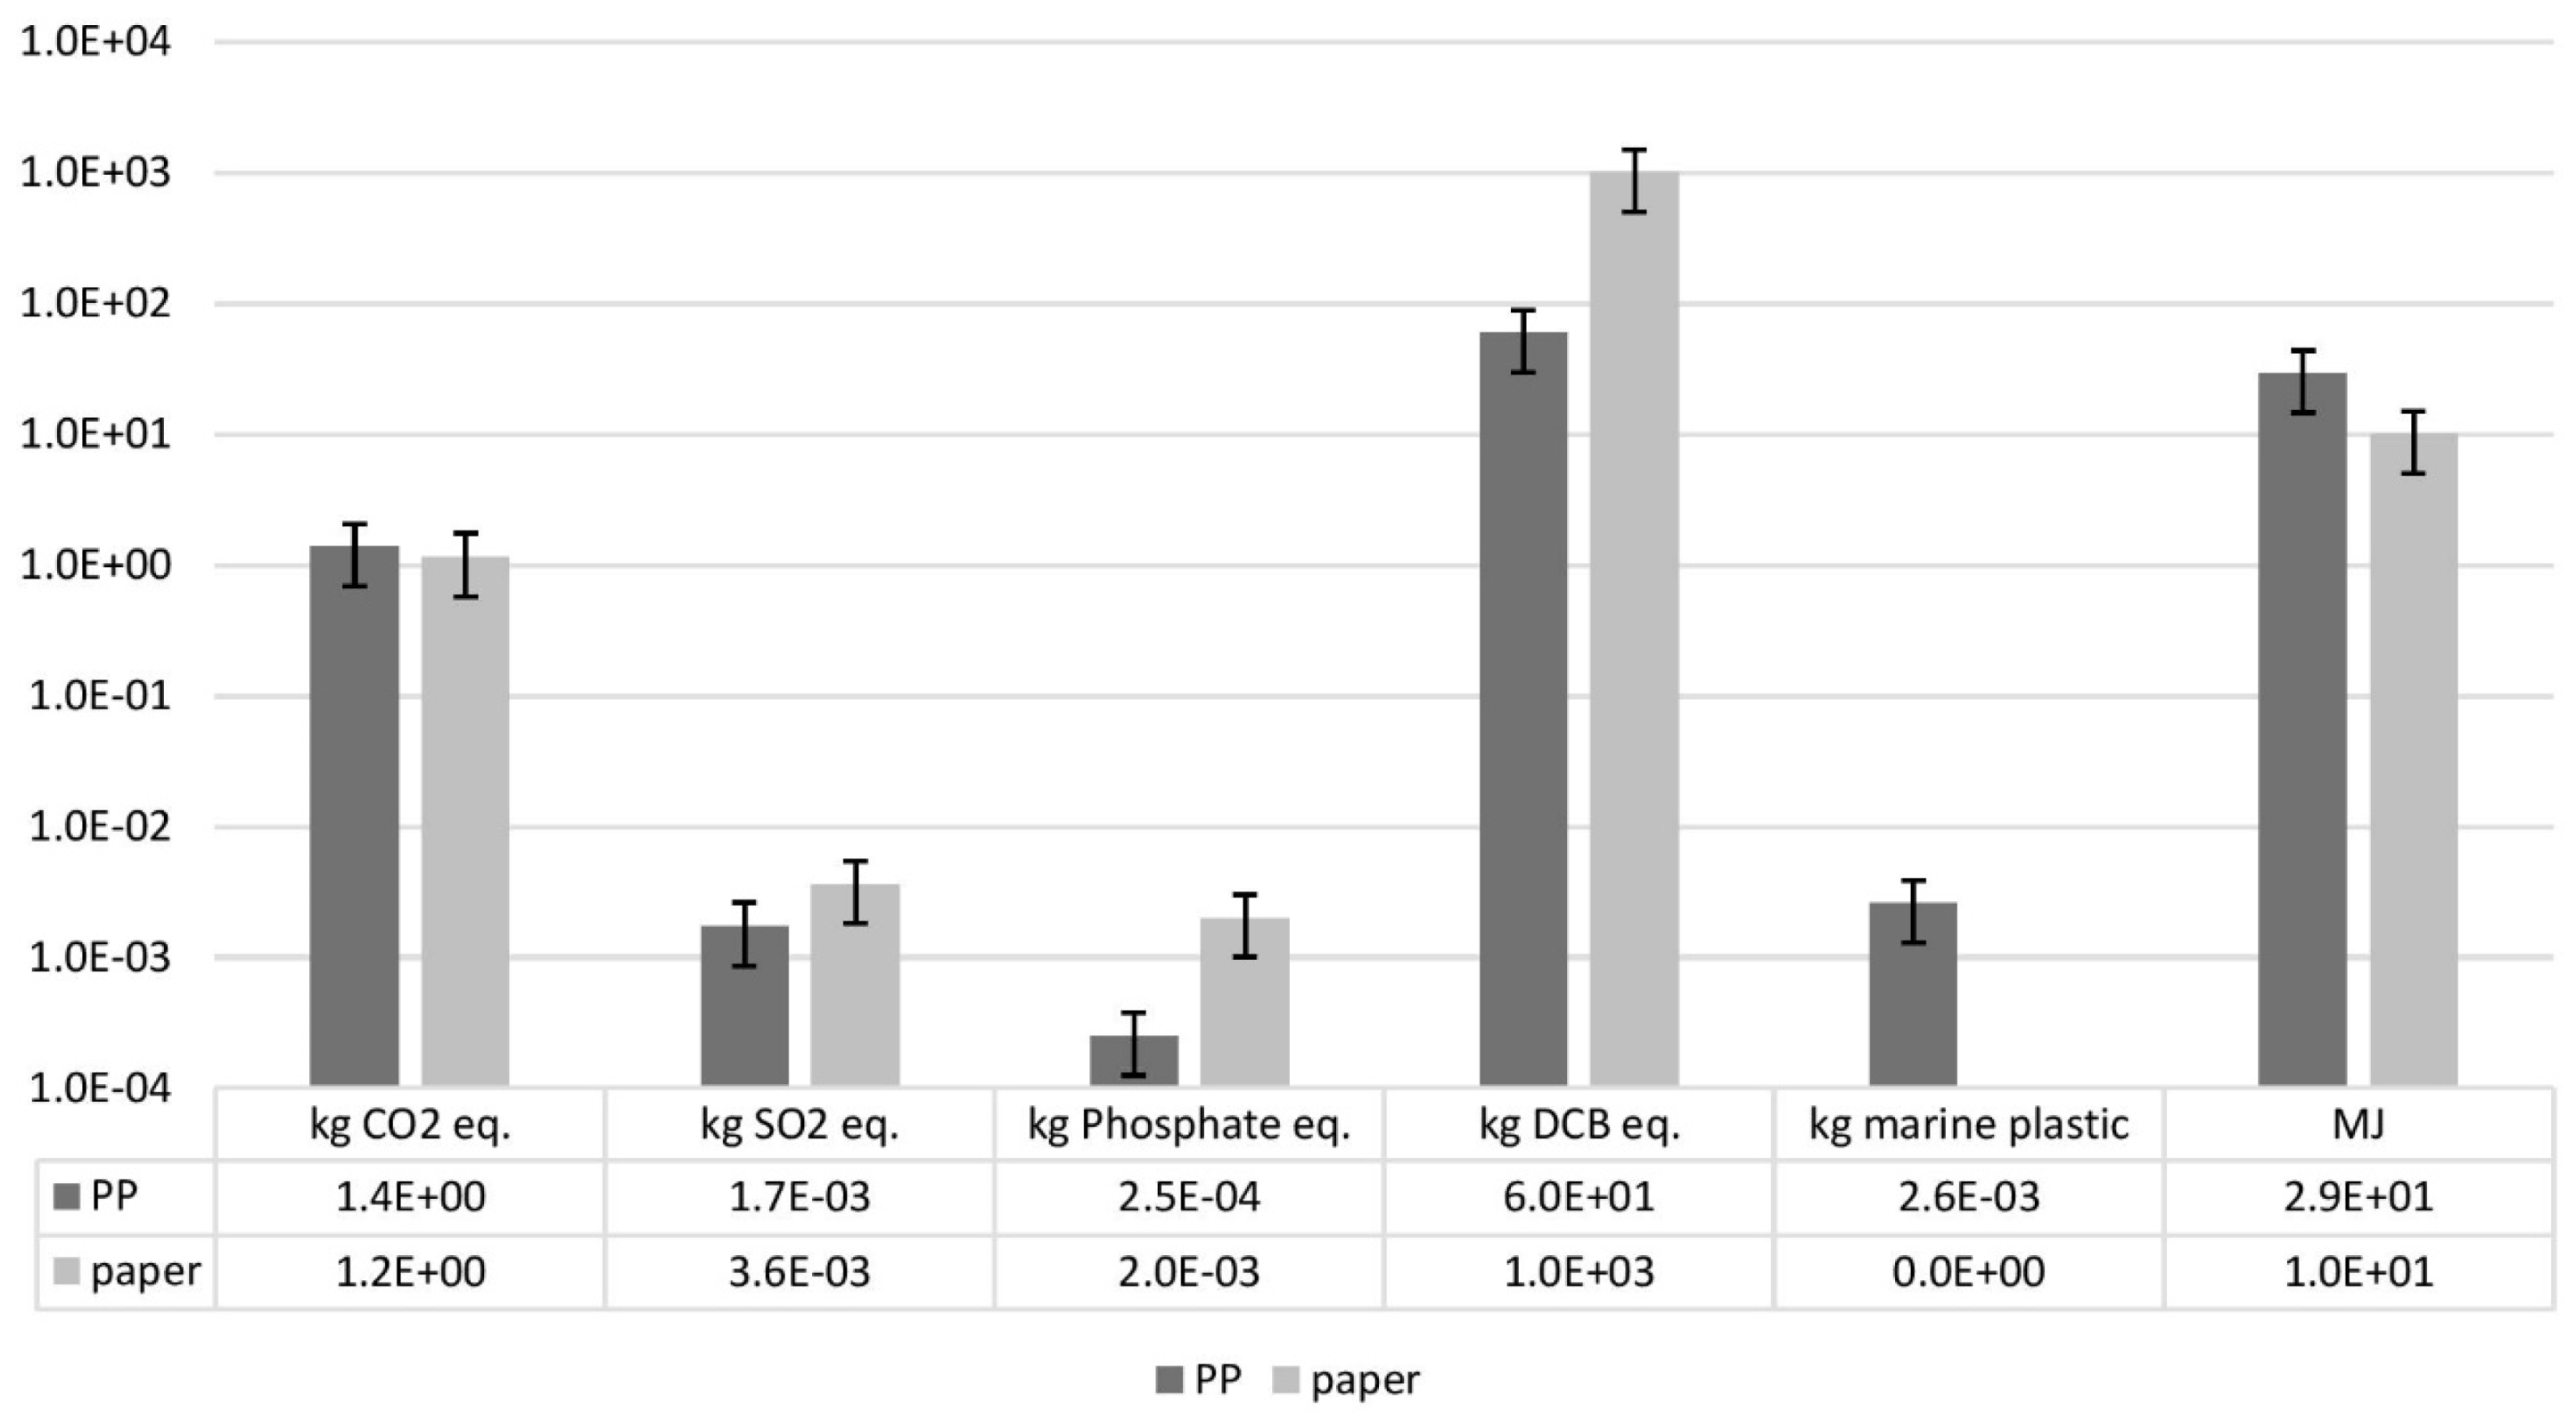
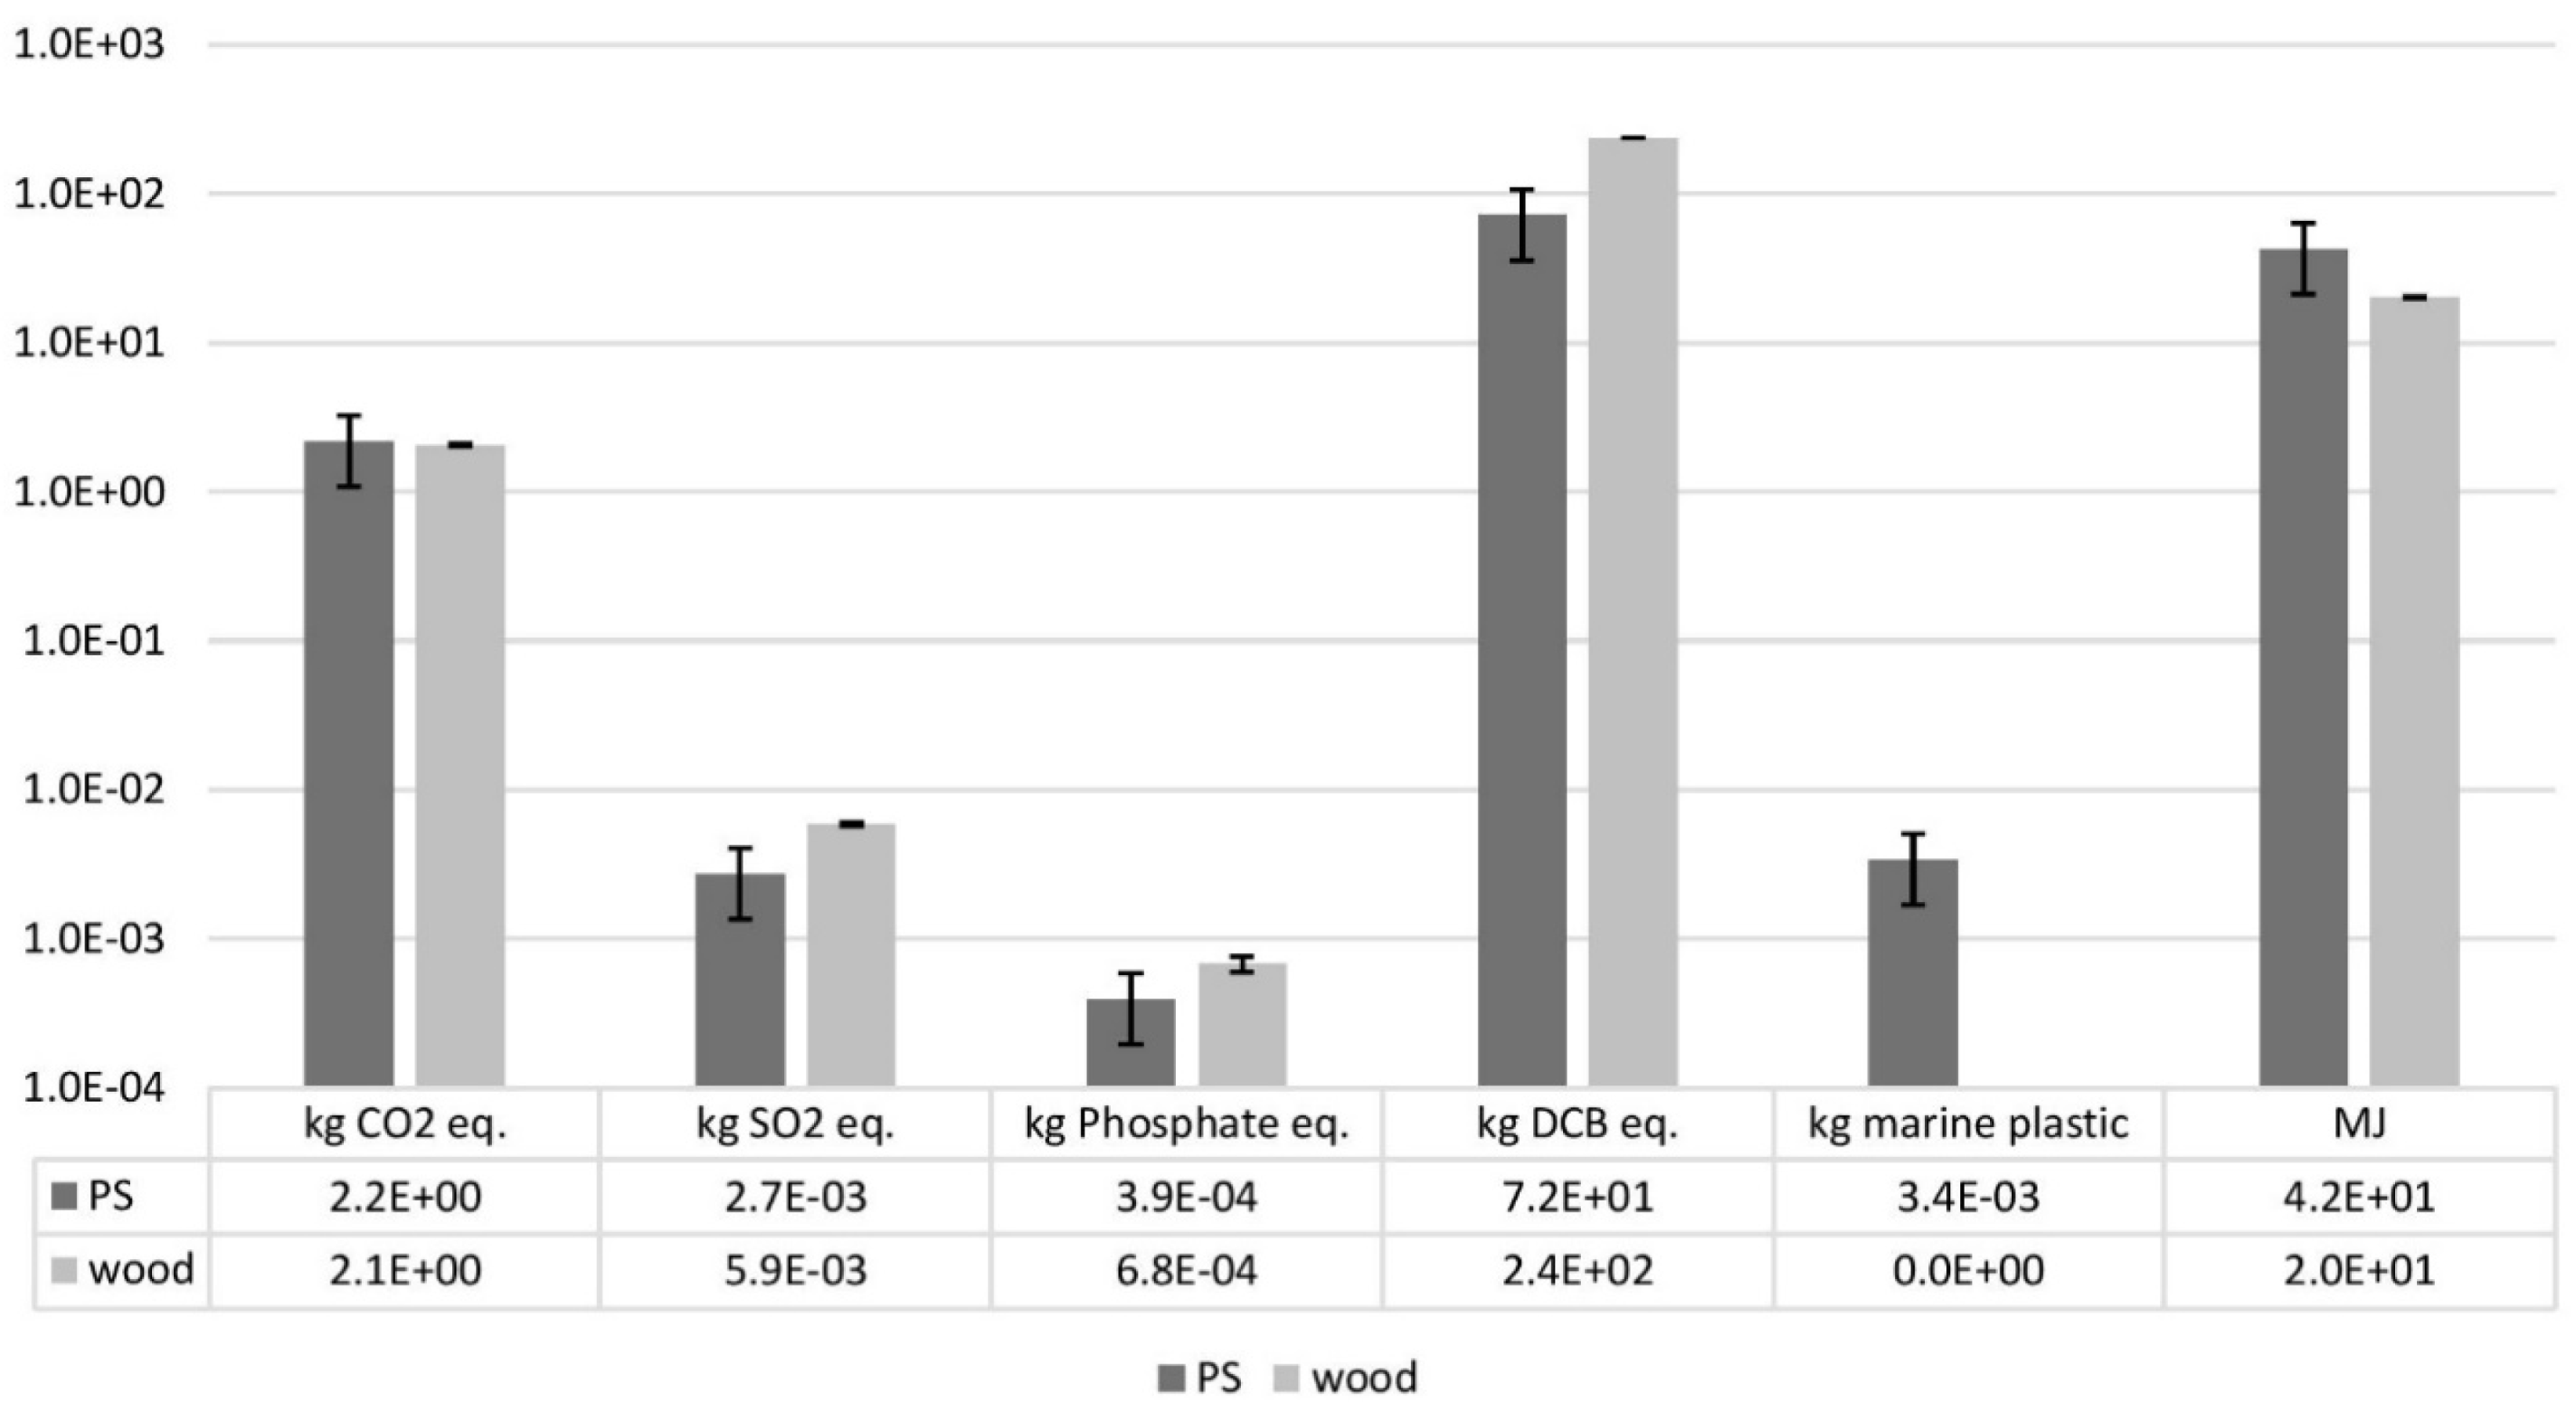
3. Results
3.1. Sensitivity Analysis 1: Transportation
3.2. Sensitivity Analysis 1: End-Of-Life
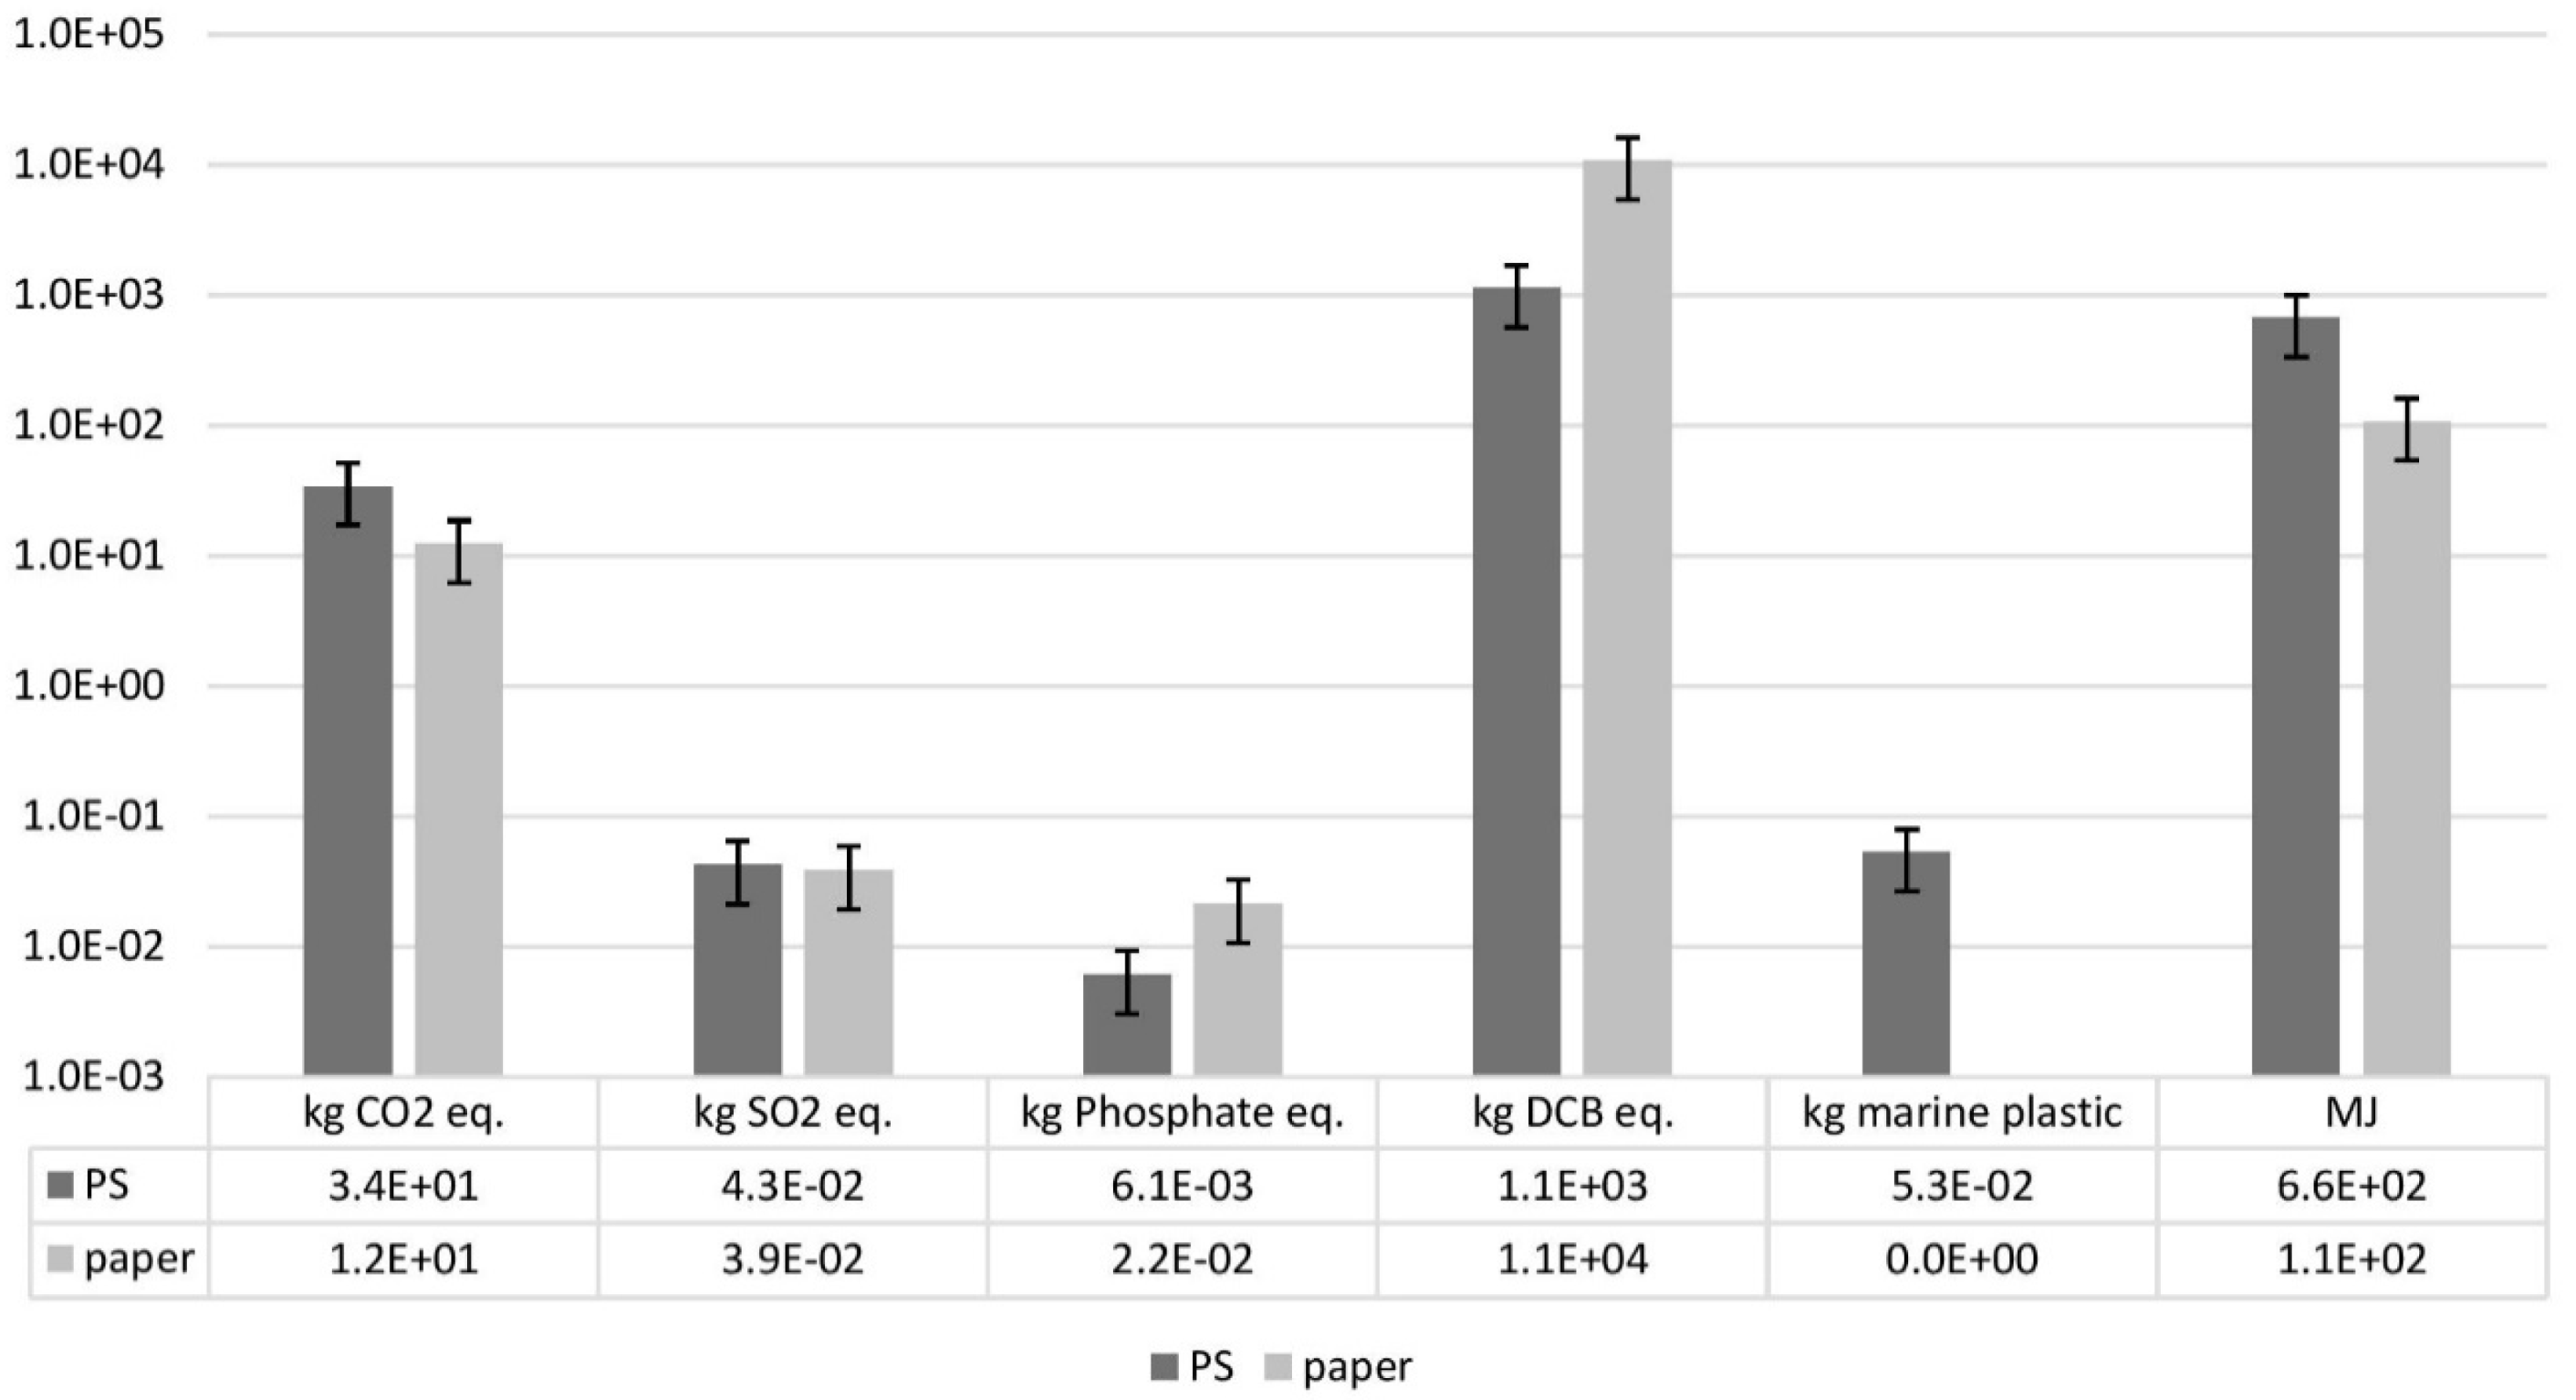
3.3. Results of the Single-Use Plastics Ban Assessment
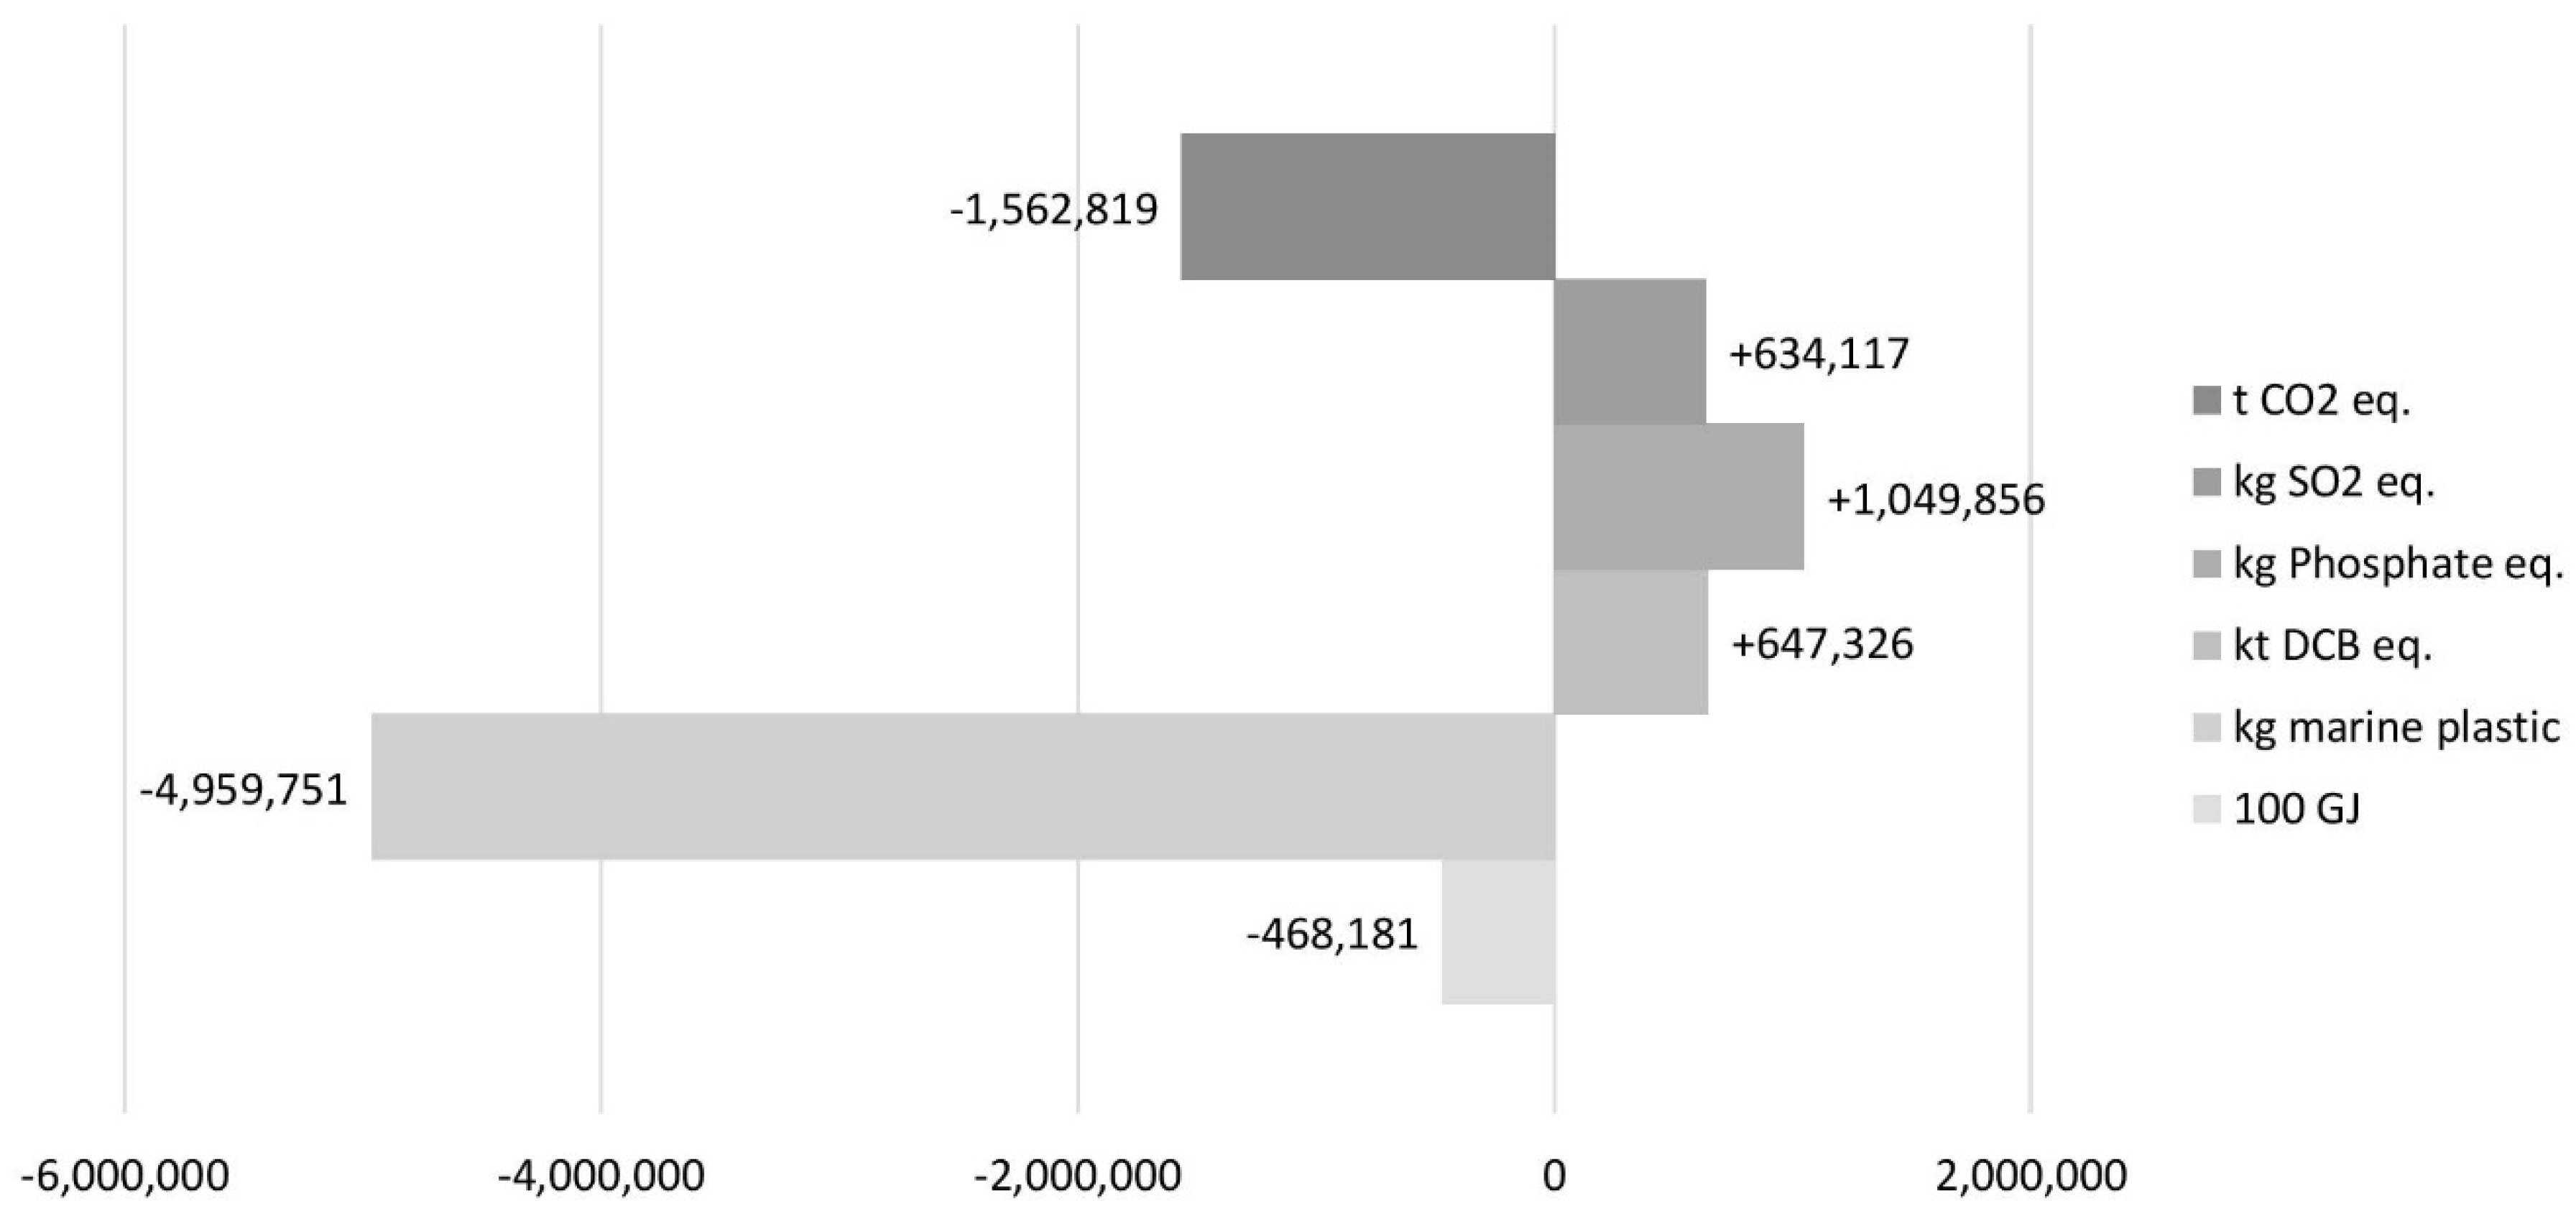
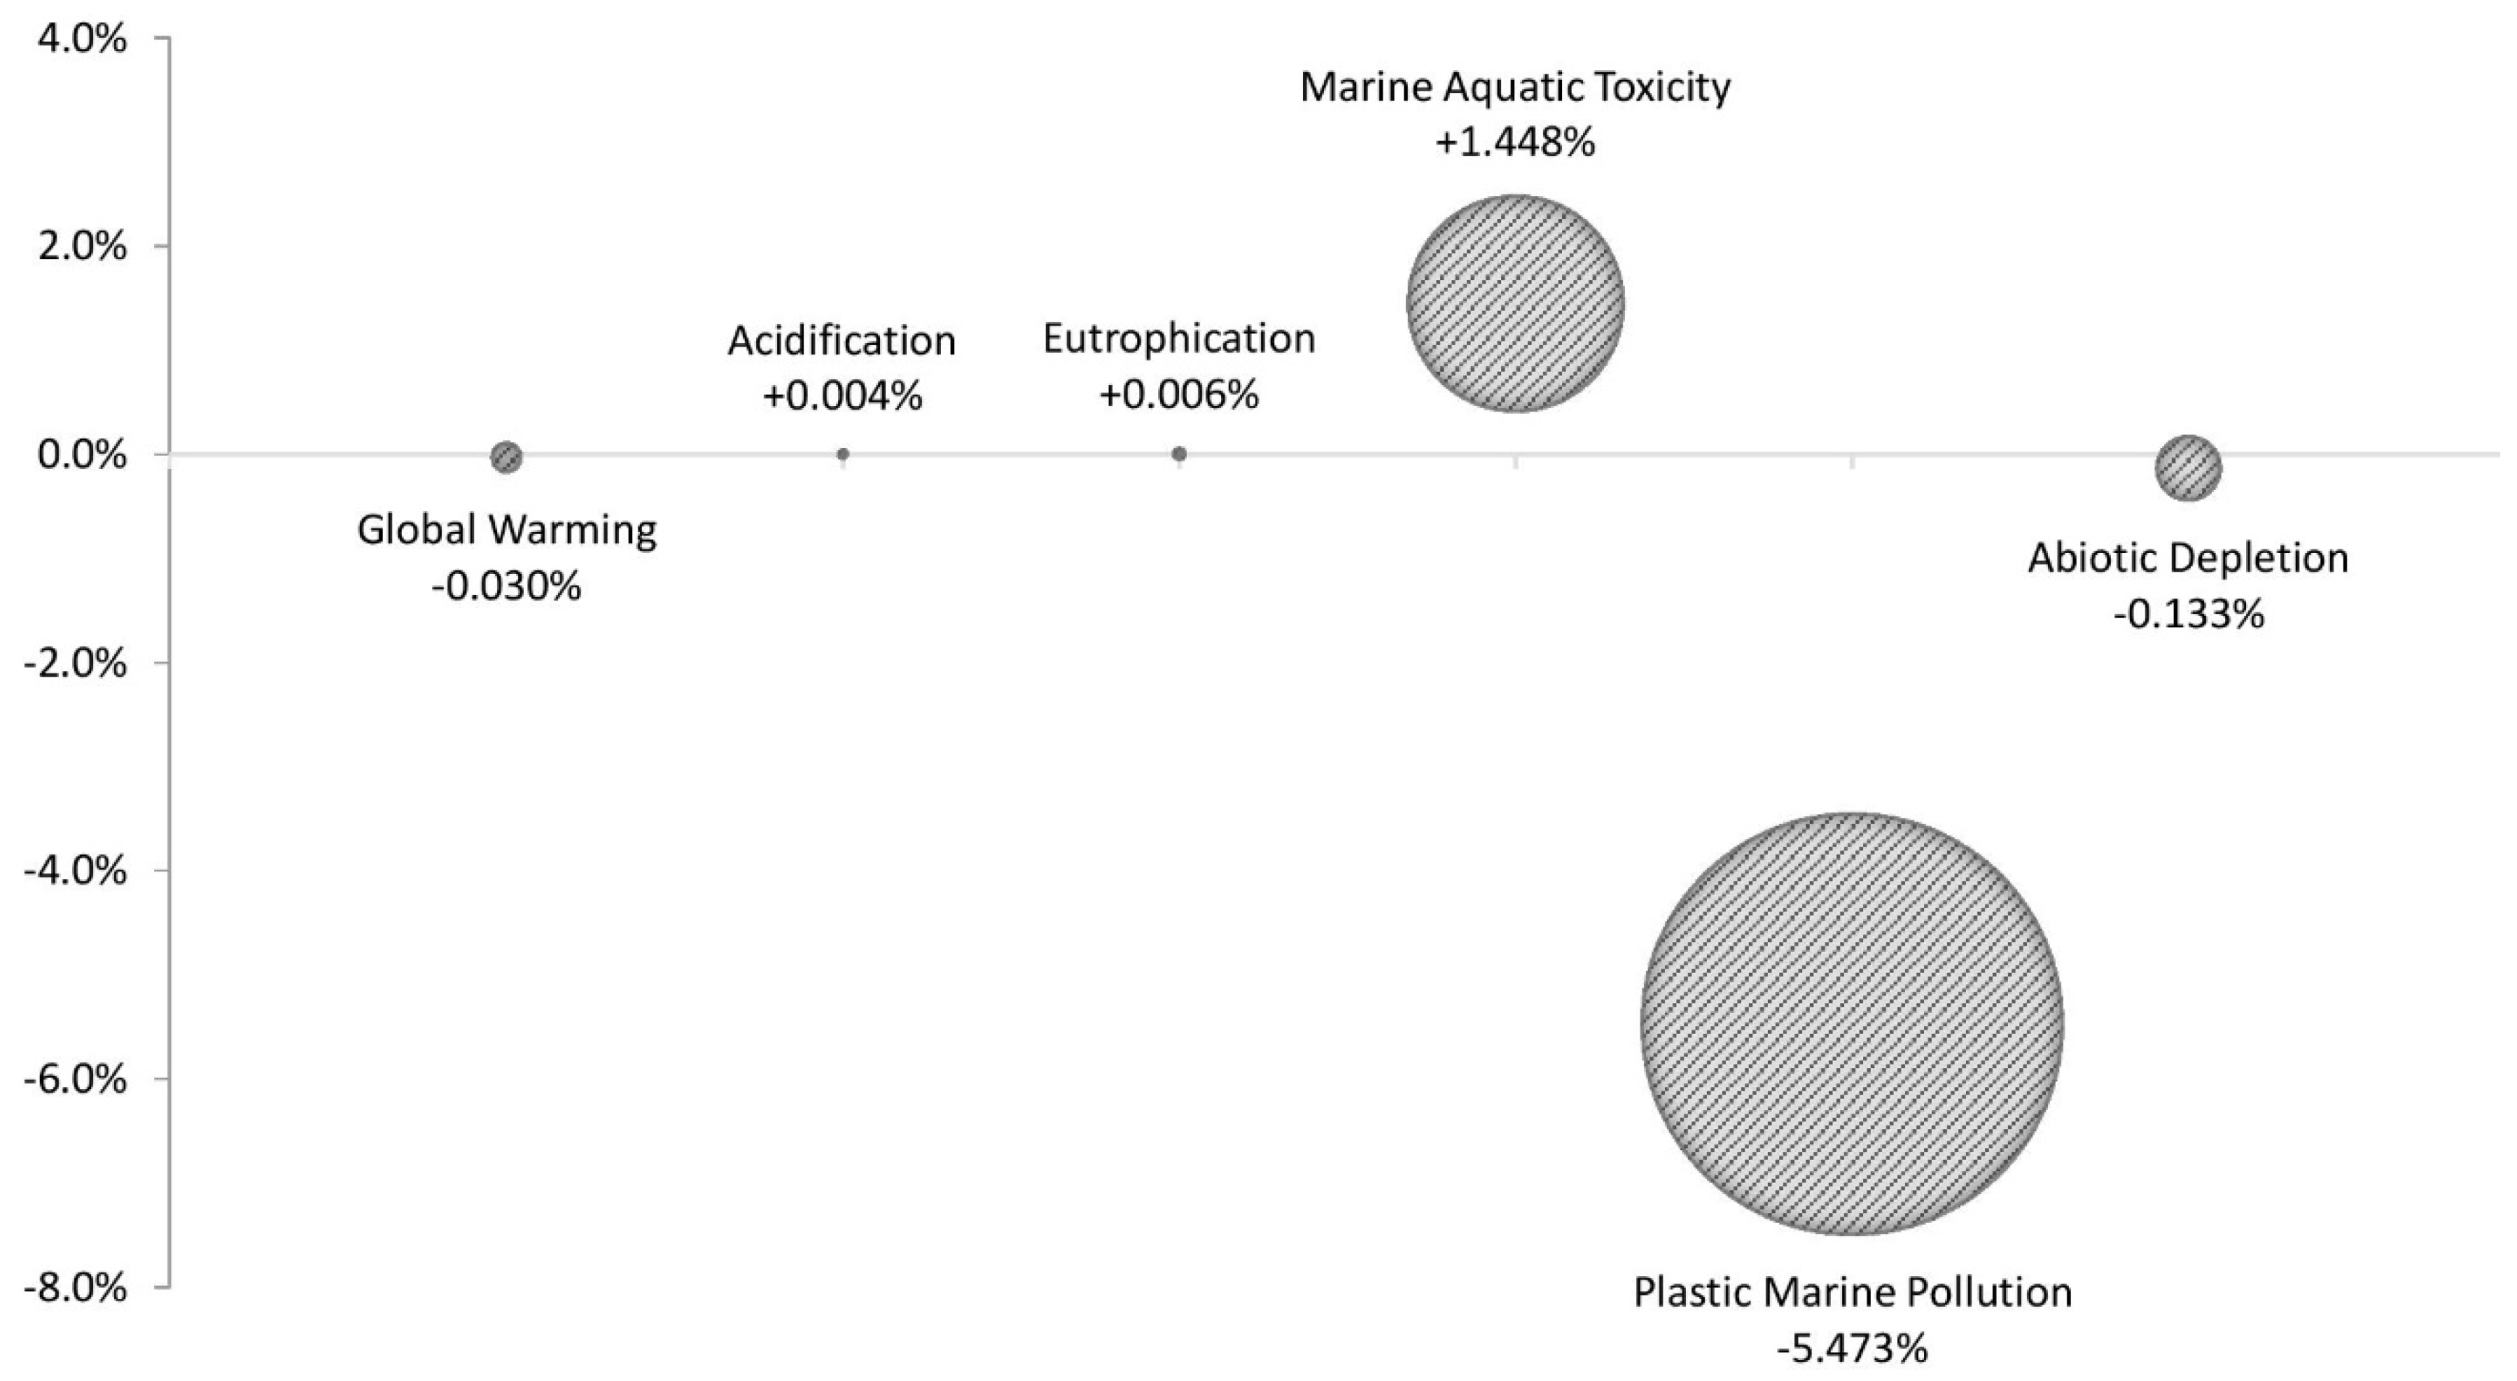
3.4. Sensitivity Analysis 2: A Reduction of Consumption
4. Discussion
4.1. Life Cycle Interpretation
4.1.1. Product Life Cycle Assessments
4.1.2. Sensitivity Analysis 1
4.1.3. The Single-Use Plastics Ban
4.1.4. Sensitvity Analysis 2
4.2. Discussion of Alternative Strategies to Tackle Plastic Marine Pollution
4.3. Discussion of the Sustainability of the Single-Use Plastics Ban
5. Conclusions
5.1. Implications
5.2. Recommendations
- The EU should stop exporting plastic waste (short-term).
- The EC should follow international standards such as ISO when performing assessments such as LCA (short-term).
- The EU should respect the waste hierarchy and increase its efforts to prevent waste. For that purpose, the EU should encourage its citizens to use fewer single-use items (e.g., by imposing a premium price on all single-use items) (long-term).
- The EU should focus on the mismanagement of waste and littering instead of banning certain plastic products. Banning is not promising as it would be difficult to ban all plastics (long-term).
- The EU should only import certified paper and wood products if it intends to rely more strongly on the so-called bioeconomy (long-term).
- Wood and paper item retailers (e.g., vegwareTM) should reveal the LCI data of their products in the same way as NatureWorksTM has done (short-term).
5.3. Limitations and Areas of Future Research
Supplementary Materials
Author Contributions
Funding
Conflicts of Interest
Appendix A. Life Cycle Impact Assessment Results


References
- PlasticsEurope. Plastics—The Facts 2018: An Analysis of European Plastics Production, Demand and Waste Data; PlasticsEurope: Brussels, Belgium, 2018. [Google Scholar]
- Jambeck, J.R.; Geyer, R.; Wilcox, C.; Siegler, T.R.; Perryman, M.; Andrady, A.; Narayan, R.; Law, K.L. Plastic waste inputs from land into the ocean. Science 2015, 347, 768–771. [Google Scholar] [CrossRef] [PubMed]
- Geyer, R.; Jambeck, J.R.; Law, K.L. Production, use, and fate of all plastics ever made. Sci. Adv. 2017, 3, e1700782. [Google Scholar] [CrossRef] [PubMed]
- Barnes, D.K.A.; Galgani, F.; Thompson, R.C.; Barlaz, M. Accumulation and fragmentation of plastic debris in global environments. Philos. Trans. R. Soc. B Biol. Sci. 2009, 364, 1985–1998. [Google Scholar] [CrossRef] [PubMed]
- Thompson, R.C.; Moore, C.J.; vom Saal, F.S.; Swan, S.H. Plastics, the environment and human health: Current consensus and future trends. Philos. Trans. R. Soc. B Biol. Sci. 2009, 364, 2153–2166. [Google Scholar] [CrossRef]
- Xanthos, D.; Walker, T.R. International policies to reduce plastic marine pollution from single-use plastics (plastic bags and microbeads): A review. Mar. Pollut. Bull. 2017, 17–26. [Google Scholar] [CrossRef]
- Gall, S.C.; Thompson, R.C. The impact of debris on marine life. Mar. Pollut. Bull. 2015, 92, 170–179. [Google Scholar] [CrossRef]
- Seltenrich, N. New Link in the Food Chain? Marine Plastic Pollution and Seafood Safety. Environ. Health Perspect. 2015, 123, A34–A41. [Google Scholar] [CrossRef]
- UNEP. Legal Limits on Single-Use Plastics and Microplastics: A Global Review of National Laws and Regulations; UNEP: Nairobi, Kenya, 2018. [Google Scholar]
- Rochman, C.M.; Browne, M.A.; Halpern, B.S.; Hentschel, B.T.; Hoh, E.; Karapanagioti, H.K.; Rios-Mendoza, L.M.; Takada, H.; Teh, S.; Thompson, R.C. Classify plastic waste as hazardous. Nature 2013, 494, 169–171. [Google Scholar] [CrossRef]
- Wagner, T.P. Reducing single-use plastic shopping bags in the USA. Waste Manag. 2017, 70, 3–12. [Google Scholar] [CrossRef]
- Secretariat of the Convention on Biological Diversity and the Scientific and Technical Advisory Panel—Global Environment Facility. Impacts of Marine Debris on Biodiversity: Current Status and Potential Solutions; CBD Technical Series; Secretariat of the Convention on Biological Diversity: Montreal, QC, Canada, 2012; Volume 67, pp. 11–26. [Google Scholar]
- European Commission, Directorate-General for Environment. Proposal for a Directive of the European Parliament and of the Council on the Reduction of the Impact of Certain Plastic Products on the Environment; DG ENV: Brussels, Belgium, 2018. [Google Scholar]
- European Commission, Directorate-General for Environment. Impact Assessment—Reducing Marine Litter: Action on Single Use Plastics and Fishing Gear; DG ENV: Brussels, Belgium, 2018. [Google Scholar]
- European Commission, Directorate-General for Environment. Life Cycle Inventories of Single Use Plastic Products and their Alternatives; DG ENV: Brussels, Belgium, 2018. [Google Scholar]
- European Parliamentary Research Service. Towards a Circular Economy—Waste Management in the EU; Scientific Foresight Unit: Brussels, Belgium, 2017; ISBN 978-92-846-1548-3. [Google Scholar]
- EC. Assessment of Measures to Reduce Marine Litter from Single Use Plastics; Publications Office of the European Union: Luxembourg, 2018; ISBN 978-92-79-92898-7. [Google Scholar]
- Petersen, A.K.; Solberg, B. Environmental and economic impacts of substitution between wood products and alternative materials: A review of micro-level analyses from Norway and Sweden. For. Policy Econ. 2005, 7, 249–259. [Google Scholar] [CrossRef]
- Petersen, A.K.; Solberg, B. Greenhouse Gas Emissions and Costs over the Life Cycle of Wood and Alternative Flooring Materials. Clim. Chang. 2004, 64, 143–167. [Google Scholar] [CrossRef]
- Werner, F.; Richter, K. Wooden building products in comparative LCA: A literature review. Int. J. Life Cycle Assess. 2007, 12, 470–479. [Google Scholar] [CrossRef]
- Lewis, H.; Verghese, K.; Fitzpatrick, L. Evaluating the sustainability impacts of packaging: The plastic carry bag dilemma. Packag. Technol. Sci. 2010, 23, 145–160. [Google Scholar] [CrossRef]
- Mattila, T.; Kujanpää, M.; Dahlbo, H.; Soukka, R.; Myllymaa, T. Uncertainty and Sensitivity in the Carbon Footprint of Shopping Bags. J. Ind. Ecol. 2011, 15, 217–227. [Google Scholar] [CrossRef]
- Edwards, C.; Fry, J.M. Life Cycle Assessment of Supermarket Carrier Bags: A Review of the Bags Available in 2006; Environment Agency: Bristol, UK, 2011. [Google Scholar]
- Boucher, J.; Billard, G. The challenges of measuring plastic pollution. Field Actions Sci. Rep. 2019, 19, 68–75. [Google Scholar]
- Schweitzer, J.-P.; Petsinaris, F.; Gionfra, C. A study by Zero Waste Europe and Friends of the Earth Europe for the Rethink Plastic Alliance. Justifying Plastic Pollution: How Life Cycle Assessments are Misused in Food Packaging Policy; Institute for European Environmental Policy (IEEP): Brussels, Belgium, 2018. [Google Scholar]
- Woods, J.S.; Veltman, K.; Huijbregts, M.A.J.; Verones, F.; Hertwich, E.G. Towards a meaningful assessment of marine ecological impacts in life cycle assessment (LCA). Environ. Int. 2016, 89, 48–61. [Google Scholar] [CrossRef]
- Woods, J.S.; Rødder, G.; Verones, F. An effect factor approach for quantifying the entanglement impact on marine species of macroplastic debris within life cycle impact assessment. Ecol. Indic. 2019, 99, 61–66. [Google Scholar] [CrossRef]
- Civancik-Uslu, D.; Puig, R.; Hauschild, M.; Fullana-i-Palmer, P. Life cycle assessment of carrier bags and development of a littering indicator. Sci. Total Environ. 2019, 685, 621–630. [Google Scholar] [CrossRef]
- ISO. ISO 14040: Environmental Management—Life Cycle Assessment—Principles and Framework; International Organization for Standardization: Genève, Switzerland, 2006; ISBN 978-0-580-48992-1. [Google Scholar]
- ISO. ISO 14044: Environmental Management—Life Cycle Assessment—Requirements and Guidelines; International Organization for Standardization: Genève, Switzerland, 2006; ISBN 978-0-580-48992-1. [Google Scholar]
- CML. CML-IA—CML Characterization Factors Version 3.4; Centrum voor Milieuwetenschappen Leiden (Institute of Environmental Science): Leiden, The Netherlands, 2008. [Google Scholar]
- Guinée, J.; Gorrée, M.; Heijungs, R.; Huppes, G.; Kleijn, R.; de Koning, A.; van Oers, L.; Wegener Sleeswijk, A.; Suh, S.; Udo de Haes, H.; et al. LCA—An Operational Guide to the ISO-Standards—Part 2a; Leiden University: Leiden, The Netherlands, 2001. [Google Scholar]
- Abdel-Rahman, M.A.; Tashiro, Y.; Sonomoto, K. Recent advances in lactic acid production by microbial fermentation processes. Biotechnol. Adv. 2013, 31, 877–902. [Google Scholar] [CrossRef]
- Okeaya International Co., Ltd. Wooden Fork Machine, Wooden Spoon Machine, Wooden Knife Machine—Okeaya International Co., Ltd. Available online: http://www.okeaya.com/product-cat-14.html (accessed on 15 May 2019).
- Shenyang Romiter Machinery Co. Ltd. Wood Cutlery Production Line. Available online: https://www.woodstickmachine.com/products/disposable-wood-cutlery-making-machine/ (accessed on 15 May 2019).
- Pöyry Forest Industry Consulting Ltd.; Oxford Economics Ltd. Wood Waste Market in the UK; WRAP: Banbury, UK, 2009. [Google Scholar]
- Papong, S.; Malakul, P.; Trungkavashirakun, R.; Wenunun, P.; Chom-in, T.; Nithitanakul, M.; Sarobol, E. Comparative assessment of the environmental profile of PLA and PET drinking water bottles from a life cycle perspective. J. Clean. Prod. 2014, 65, 539–550. [Google Scholar] [CrossRef]
- van der Harst, E.; Potting, J.; Kroeze, C. Comparison of different methods to include recycling in LCAs of aluminium cans and disposable polystyrene cups. Waste Manag. 2016, 48, 565–583. [Google Scholar] [CrossRef] [PubMed]
- European Paper Recycling Council (EPRC). Monitoring Report 2017 European Declaration on Paper Recycling 2016–2020; European Paper Recycling Council: Brussels, Belgium, 2017. [Google Scholar]
- European Compost Network Bio-Waste in Europe. Available online: https://www.compostnetwork.info/policy/biowaste-in-europe/ (accessed on 11 June 2019).
- Arena, U.; Mastellone, M.L.; Perugini, F.; Clift, R. Environmental Assessment of Paper Waste Management Options by Means of LCA Methodology. Ind. Eng. Chem. Res. 2004, 43, 5702–5714. [Google Scholar] [CrossRef]
- Transparency Market Research. Food Service Packaging Market: Global Industry Analysis and Forecast 2017–2020. Available online: https://www.transparencymarketresearch.com/food-service-packaging-market.html (accessed on 17 August 2017).
- Global Data Cotton Buds Market: Growth, Opportunities, Share and Competitive Analysis, 2018–2026; 2018. Available online: https://www.prnewswire.com/news-releases/cotton-buds-world-industry-report-2018-2026-analysis-by-material-application-and-geography-300675866.html (accessed on 3 July 2018).
- Yates, M.R.; Barlow, C.Y. Life cycle assessments of biodegradable, commercial biopolymers—A critical review. Resour. Conserv. Recycl. 2013, 78, 54–66. [Google Scholar] [CrossRef]
- Cederstrand, P.; Riise, E.; Uihlein, A. Evaluation of recycling and allocation methods for paper. Swed. Life Cycle Cent. Rapp. 2014, 1, 36. [Google Scholar]
- Myhre, G.; Shindell, D.; Bréon, F.-M.; Collins, W.; Fuglestvedt, J.; Huang, J.; Koch, D.; Lamarque, J.-F.; Lee, D.; Mendoza, B.; et al. Anthropogenic and Natural Radiative Forcing. In Climate Change 2013: The Physical Science Basis. Contribution of Working Group I to the Fifth Assessment Report of the Intergovernmental Panel on Climate Change; Cambridge University Press: Cambridge, UK; New York, NY, USA, 2013; p. 82. [Google Scholar]
- Schneiderman, D.K.; Hillmyer, M.A. 50th Anniversary Perspective: There Is a Great Future in Sustainable Polymers. Macromolecules 2017, 50, 3733–3749. [Google Scholar] [CrossRef]
- Hottle, T.A.; Bilec, M.M.; Landis, A.E. Biopolymer production and end of life comparisons using life cycle assessment. Resour. Conserv. Recycl. 2017, 122, 295–306. [Google Scholar] [CrossRef]
- European Parliament. Directive 2008/104/EC of the European Parliament and of the Council of 19 November 2008 on Waste and Repealing Certain Directives; European Parliament: Brussels, Belgium, 2008; pp. 426–429. Available online: https://eur-lex.europa.eu/legal-content/EN/TXT/?qid=1588400368488&uri=CELEX:32008L0104 (accessed on 19 November 2008).
- Kershaw, P.; Katsuhiko, S.; Lee, S.; Samseth, J.; Woodring, D. Plastic debris in the ocean. In UNEP Year Book; United Nations Environment Programme: Nairobi, Kenya, 2011; pp. 20–33. [Google Scholar]
- Torgler, B.; Frey, B.S.; Wilson, C. Environmental and Pro-Social Norms: Evidence on Littering. BE J. Econ. Anal. Policy 2009, 9. [Google Scholar] [CrossRef]
- Reduction of the Impact of Certain Plastic Products on the Environment ***I. European Parliament Legislative Resolution of 27 March 2019 on the Proposal for a Directive of the European Parliament and of the Council on the Reduction of the Impact of Certain Plastic Products on the Environment (COM(2018)0340–C8-0218/2018–2018/0172(COD)). Available online: https://www.europarl.europa.eu/doceo/document/TA-8-2019-0305_EN.html (accessed on 27 March 2019).
- François, G.; Georg, H.; Stefanie, W.; de, L.; Piha, H.; Valeria, A.; Alcaro, L.; Constança, B.; Brooks, C.; Brooks, C.; et al. Marine Strategy Framework Directive—Good Environmental Status—Technical Subgroup on Marine Litter Marine Litter Technical Recommendations for the Implementation of MSFD Requirements. ICES J. Mar. Sci. 2013, 7, 1055–1064. [Google Scholar]
- New South Wales and Environment Protection Authority. Environment Protection. Authority Plastic Shopping Bags Options Paper: Practical Actions for Plastic Shopping Bags; Environment Protection Authority: Sydney, Australia, 2016; ISBN 978-1-76039-299-4. [Google Scholar]


| Product system | Specification | Function | Functional unit |
|---|---|---|---|
| Single-use cotton bud stick | Exclusion of cotton | Attachment for cotton buds | Provision of 1000 cotton bud sticks (without cotton) |
| Single-use cutlery (knife) | Length: 16.5–18 cm | Provision of a knife for use | Provision of 1000 knives for use |
| Single-use cutlery (fork) | Length: 14–18 cm | Provision of a fork for use | Provision of 1000 forks for use |
| Single-use cutlery (spoon) | Length: 14.5–16.5 cm | Provision of a spoon for use | Provision of 1000 spoons for use |
| Single-use cutlery (teaspoon) | Length: 11–12.5 cm | Provision of a teaspoon for use | Provision of 1000 teaspoons for use |
| Single-use straw | Length: 19–21 cm | Provision of a straw for use | Provision of 1000 straws for use |
| Single-use stirrer | Length: 11–19 cm | Provision of a stirrer for use | Provision of 1000 stirrers for use |
| Single-use plate | Diameter: 22–24 cm | Provision of a plate for use | Provision of 1000 plates for use |
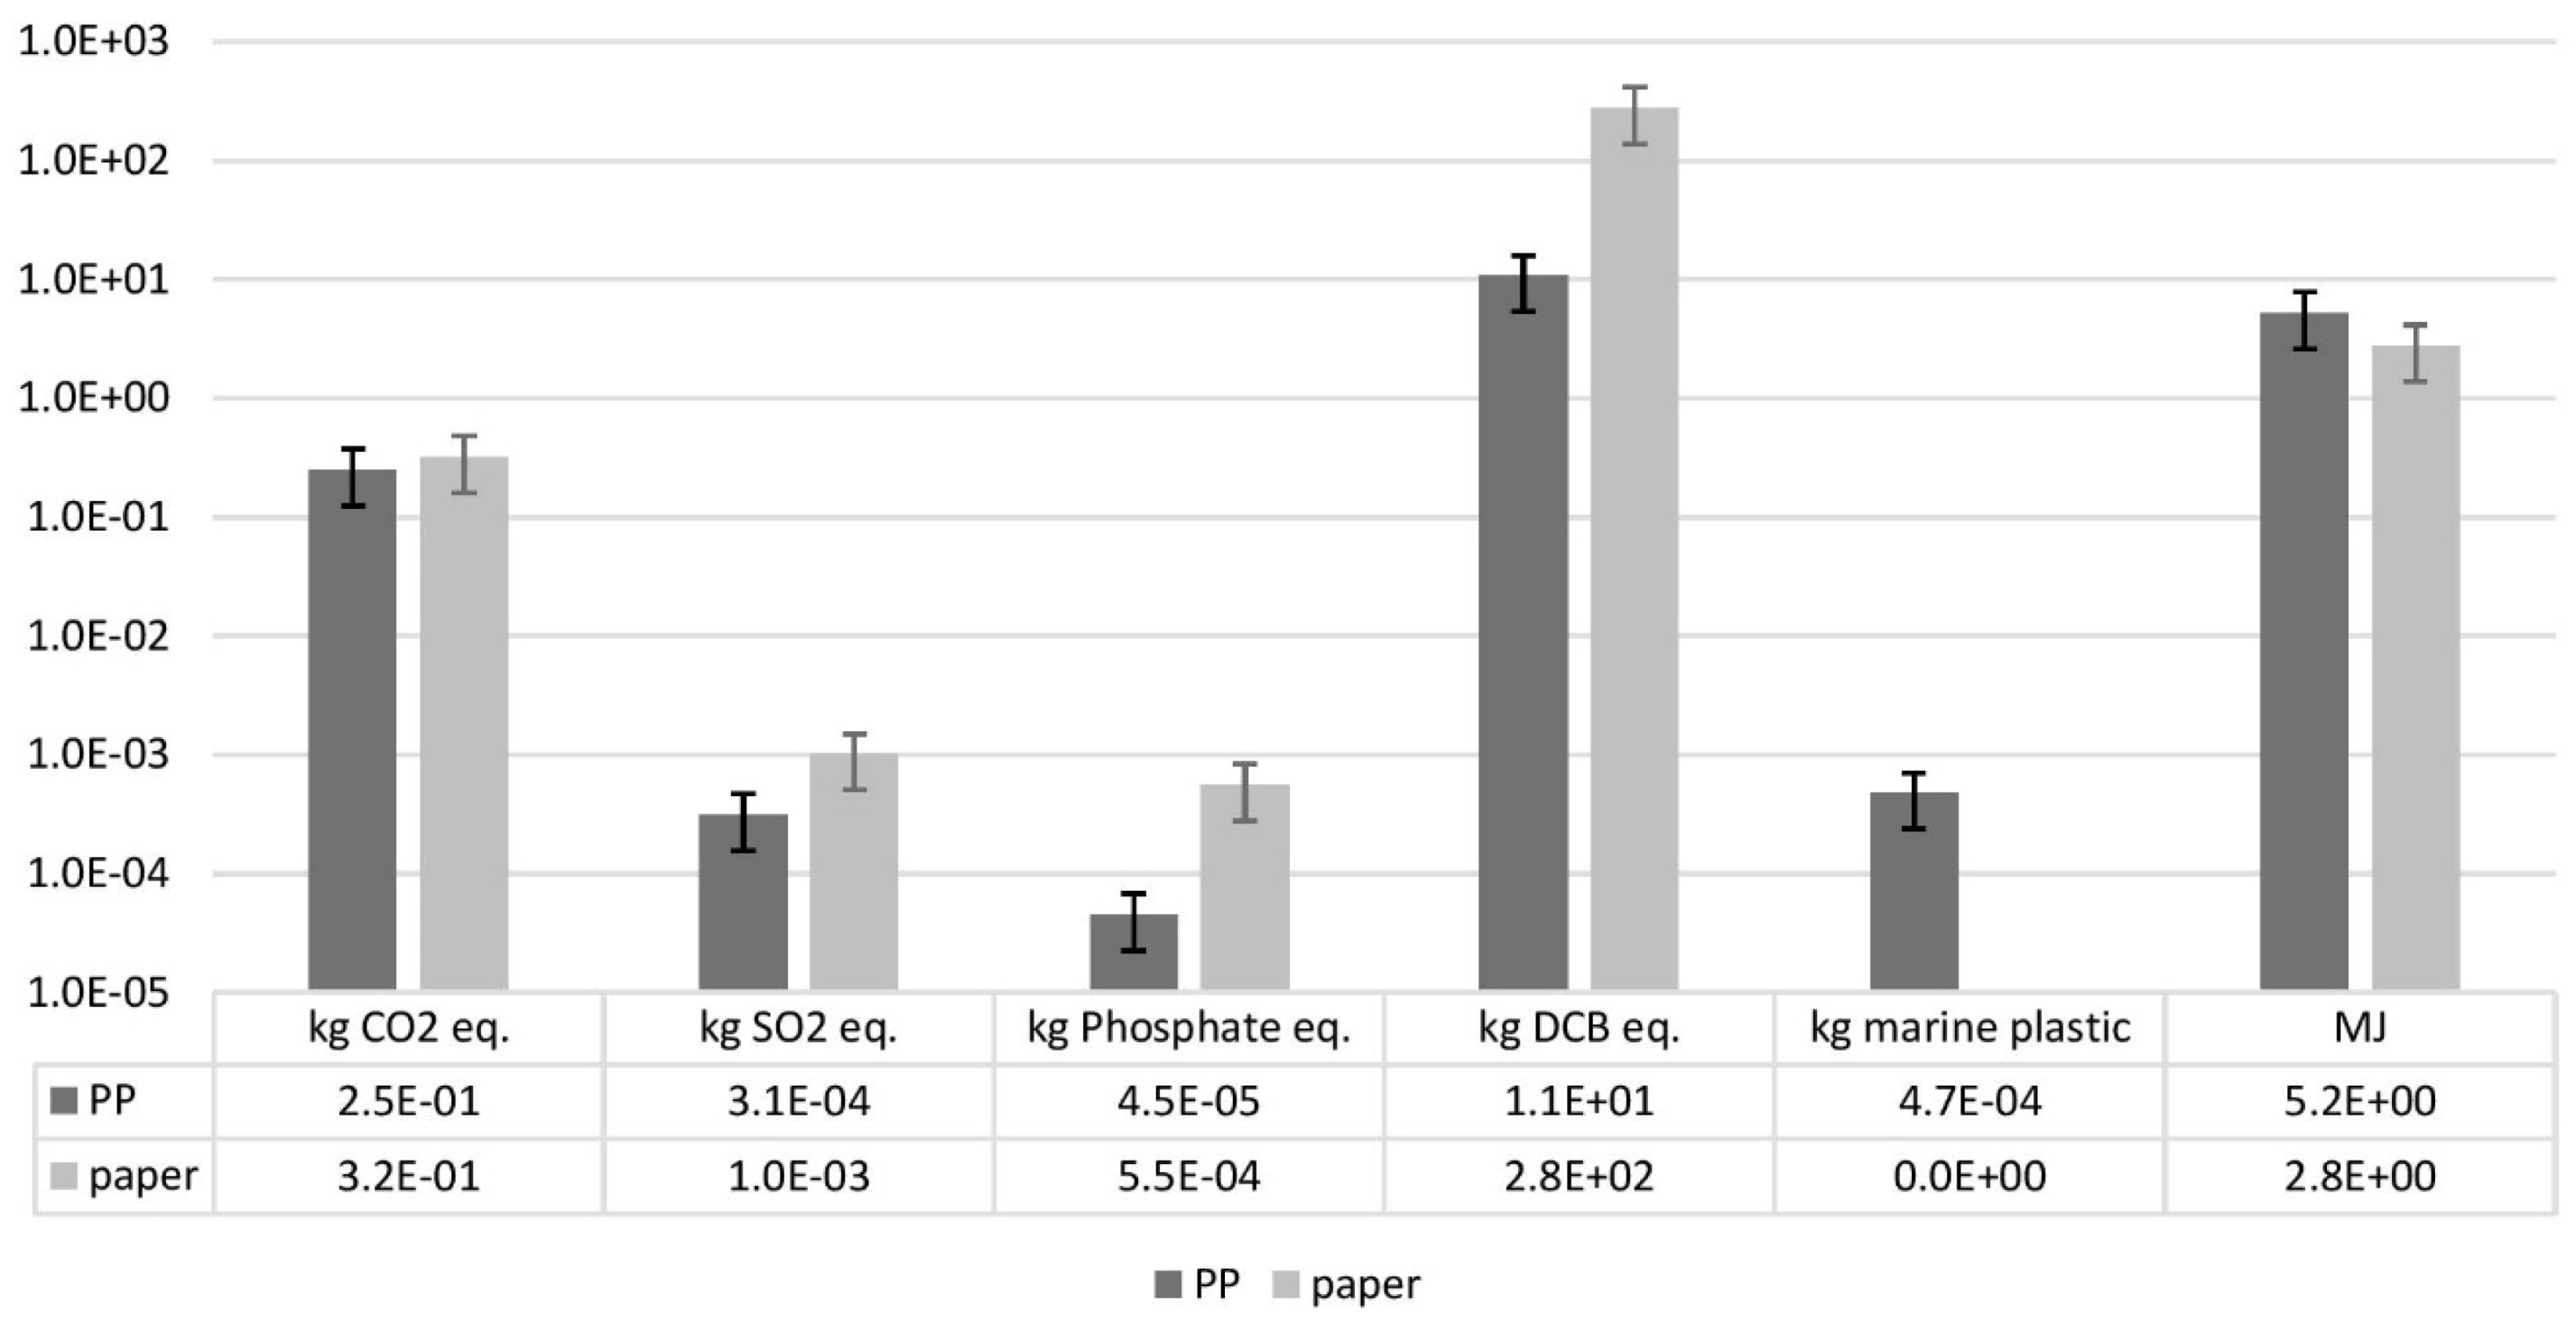
| kg CO2 eq. | kg SO2 eq. | kg Phosphate eq. | kg DCB eq. | kg Marine Plastic | MJ | |
|---|---|---|---|---|---|---|
| Cotton bud sticks | ||||||
| PP | ±0.3% | ±0.4% | ±0.8% | ±0.1% | ±0.0% | ±0.2% |
| Paper | ±0.9% | ±0.5% | ±0.2% | ±0.0% | ±0.0% | ±1.5% |
| Cutlery knives | ||||||
| PS | ±0.3% | ±0.4% | ±0.6% | ±0.1% | ±0.0% | ±0.2% |
| PP | ±0.3% | ±0.4% | ±0.8% | ±0.1% | ±0.0% | ±0.2% |
| PLA | ±0.2% | ±0.2% | ±0.3% | ±0.1% | ±0.0% | ±0.4% |
| Wood | ±0.8% | ±0.5% | ±0.9% | ±0.1% | ±0.0% | ±1.2% |
| Cutlery forks | ||||||
| PP | ±0.3% | ±0.4% | ±0.8% | ±0.1% | ±0.0% | ±0.2% |
| PS | ±0.3% | ±0.4% | ±0.6% | ±0.1% | ±0.0% | ±0.2% |
| PLA | ±0.2% | ±0.2% | ±0.3% | ±0.1% | ±0.0% | ±0.4% |
| Wood | ±0.8% | ±0.5% | ±0.9% | ±0.1% | ±0.0% | ±1.2% |
| Cutlery spoons | ||||||
| PS | ±0.3% | ±0.4% | ±0.6% | ±0.1% | ±0.0% | ±0.2% |
| PP | ±0.3% | ±0.4% | ±0.8% | ±0.1% | ±0.0% | ±0.2% |
| PLA | ±0.2% | ±0.2% | ±0.3% | ±0.1% | ±0.0% | ±0.4% |
| Wood | ±0.8% | ±0.5% | ±0.9% | ±0.1% | ±0.0% | ±1.1% |
| Cutlery teaspoons | ||||||
| PS | ±0.3% | ±0.4% | ±0.6% | ±0.1% | ±0.0% | ±0.2% |
| PLA | ±0.2% | ±0.2% | ±0.3% | ±0.1% | ±0.0% | ±0.4% |
| Wood | ±0.6% | ±0.4% | ±0.8% | ±0.1% | ±0.0% | ±0.9% |
| Straws | ||||||
| PP | ±0.3% | ±0.4% | ±0.8% | ±0.1% | ±0.0% | ±0.2% |
| Paper | ±0.9% | ±0.5% | ±0.2% | ±0.0% | ±0.0% | ±1.5% |
| Stirrers | ||||||
| PS | ±0.3% | ±0.4% | ±0.6% | ±0.1% | ±0.0% | ±0.2% |
| Wood | ±0.4% | ±0.3% | ±0.5% | ±0.1% | ±0.0% | ±0.6% |
| Plates | ||||||
| PS | ±0.3% | ±0.4% | ±0.6% | ±0.1% | ±0.0% | ±0.2% |
| Paper | ±0.9% | ±0.5% | ±0.2% | ±0.0% | ±0.0% | ±1.5% |
| kg CO2 eq. | kg SO2 eq. | kg Phosphate eq. | kg DCB eq. | kg Marine Plastic | MJ | |
|---|---|---|---|---|---|---|
| Cotton bud sticks | ||||||
| PP | −8.9% | 0.9% | -5.2% | 2.8% | 0.0% | −9.9% |
| Paper | −35.2% | −22.7% | −37.1% | −35.5% | 0.0% | 9.9% |
| Cutlery knives | ||||||
| PS | −10.7% | −2.1% | −7.1% | 3.9% | 0.0% | −10.7% |
| PP | −9.0% | 1.0% | −5.1% | 2.8% | 0.0% | −9.9% |
| PLA | −12.7% | 2.7% | 1.2% | 4.2% | 0.0% | 2.8% |
| Wood | −15.7% | 3.3% | 2.5% | 4.6% | 0.0% | 5.6% |
| Cutlery forks | ||||||
| PP | −9.0% | 1.0% | −5.1% | 2.8% | 0.0% | −9.9% |
| PS | −10.7% | −2.1% | −7.1% | 3.9% | 0.0% | −10.7% |
| PLA | −12.7% | 2.7% | 1.2% | 4.2% | 0.0% | 2.8% |
| Wood | −15.5% | 3.3% | 2.4% | 4.5% | 0.0% | 5.6% |
| Cutlery spoons | ||||||
| PS | −10.7% | −2.1% | −7.1% | 3.9% | 0.0% | −10.7% |
| PP | −9.0% | 1.0% | −5.1% | 2.8% | 0.0% | −9.9% |
| PLA | −12.7% | 2.7% | 1.2% | 4.2% | 0.0% | 2.8% |
| Wood | −14.6% | 3.1% | 2.3% | 4.3% | 0.0% | 5.2% |
| Cutlery teaspoons | ||||||
| PS | −10.7% | −2.1% | −7.1% | 3.9% | 0.0% | −10.7% |
| PLA | −12.7% | 2.7% | 1.2% | 4.2% | 0.0% | 2.8% |
| Wood | −11.9% | 2.5% | 2.0% | 3.4% | 0.0% | 4.1% |
| Straws | ||||||
| PP | −9.0% | 1.0% | −5.1% | 2.8% | 0.0% | −9.9% |
| Paper | −35.1% | −22.7% | −37.1% | −35.4% | 0.0% | 9.9% |
| Stirrers | ||||||
| PS | −10.7% | −2.1% | −7.1% | 3.9% | 0.0% | −10.7% |
| Wood | −7.7% | 1.7% | 1.5% | 2.2% | 0.0% | 2.6% |
| Plates | ||||||
| PS | −10.7% | −2.1% | −7.1% | 3.9% | 0.0% | −10.7% |
| Paper | −35.1% | −22.7% | −37.1% | −35.4% | 0.0% | 9.9% |
| t CO2 eq. | kg SO2 eq. | kg Phosphate eq. | kt DCB eq. | kg Marine Plastic | 100 GJ | |
|---|---|---|---|---|---|---|
| Reduction of consumption by 10% | ||||||
| Absolute | −1,710,047 | 190,289 | 890,086 | 571,823 | −4,959,751 | −481,576 |
| Relative | −0.033% | 0.001% | 0.005% | 1.279% | −5.473% | −0.137% |
| Reduction of consumption by 20% | ||||||
| Absolute | −1,857,275 | −253,538 | 730,317 | 496,321 | −4,959,751 | −494,970 |
| Relative | −0.036% | −0.002% | 0.004% | 1.110% | −5.473% | −0.141% |
© 2020 by the authors. Licensee MDPI, Basel, Switzerland. This article is an open access article distributed under the terms and conditions of the Creative Commons Attribution (CC BY) license (http://creativecommons.org/licenses/by/4.0/).
Share and Cite
Herberz, T.; Barlow, C.Y.; Finkbeiner, M. Sustainability Assessment of a Single-Use Plastics Ban. Sustainability 2020, 12, 3746. https://doi.org/10.3390/su12093746
Herberz T, Barlow CY, Finkbeiner M. Sustainability Assessment of a Single-Use Plastics Ban. Sustainability. 2020; 12(9):3746. https://doi.org/10.3390/su12093746
Chicago/Turabian StyleHerberz, Timo, Claire Y. Barlow, and Matthias Finkbeiner. 2020. "Sustainability Assessment of a Single-Use Plastics Ban" Sustainability 12, no. 9: 3746. https://doi.org/10.3390/su12093746
APA StyleHerberz, T., Barlow, C. Y., & Finkbeiner, M. (2020). Sustainability Assessment of a Single-Use Plastics Ban. Sustainability, 12(9), 3746. https://doi.org/10.3390/su12093746