Article

Condition Monitoring of DC-Link Electrolytic Capacitors in PWM Power Converters Using OBL Method

by
Ahmed G. Abo-Khalil
1,2,*,
Abdel-Rahman Al-Qawasmi
1,*,
Ali M. Eltamaly
3,4,5 and
B. G. Yu
6
1
Department of Electrical Engineering, College of Engineering, Majmaah University, Almajmaah 11952, Saudi Arabia
2
Department of Electrical Engineering, College of Engineering, Assuit University, Assuit 71515, Egypt
3
Saudi Electricity Company Chair in Power System Reliability and Security, King Saud University, Riyadh 11421, Saudi Arabia
4
Sustainable Energy Technologies Center, King Saud University, Riyadh 11421, Saudi Arabia
5
Electrical Engineering Department, Mansoura University, Mansoura 35516, Egypt
6
Division of Electrical, Electronic and Control Engineering, Kongju National University, Chungcheongnam-do 31080, Korea
*
Authors to whom correspondence should be addressed.
Sustainability 2020, 12(9), 3719; https://doi.org/10.3390/su12093719
Submission received: 20 March 2020 / Revised: 24 April 2020 / Accepted: 26 April 2020 / Published: 4 May 2020
(This article belongs to the Section Sustainable Engineering and Science)

Abstract

:
Since the lifespan of an electrolytic capacitor is relatively short compared to other power semiconductor devices, the failure rate accounts for 60% and, thus, it is the most vulnerable component of the power conversion device. Therefore, the accurate measurement of the lifetime of an electrolytic capacitor is very important in ensuring the reliability of the entire system, including the capacitor. In this paper, an online failure detection method for a DC-link electrolytic capacitor in a back-to-back Pulse width Modulation (PWM) converter using the opposition-based learning particle swarm optimization-based Support Vector Regression (OPSO-SVR) technique is proposed. In this method, the capacitance and the DC-link capacitor power have been used in offline mode for SVR training and testing. During the offline mode, the SVR parameters have been optimized with the OPSO algorithm to use online to estimate the real value of the DC-link capacitor. The experimental results prove the superiority of the proposed technique over the SVR.

1. Introduction

Electrolytic capacitors are widely used in power conversion devices for the purpose of voltage smoothing due to their characteristics, but their lifespan is relatively short compared to other power semiconductor devices, which is a major factor in causing failure. The failure of the individual components will result in the failure of the power converter and the shutdown of the entire system in which it is incorporated, thus, requiring additional cost and time associated with the individual shutdown of the fault, as well as with the shutdown of the entire system. Therefore, it is indispensable to determine the lifetime of the part before the failure by continuously checking the state of components and to judge the life of the components before failure occurs. Among them, a failure diagnosis of the most frequently occurring electrolytic capacitors ensures the reliability of the whole system. The lifetime of an electrolytic capacitor can be predicted formally by the factors specified in the data sheet provided by the capacitor manufacturer, but the life expectancy of the electrolytic capacitor may vary due to factors such as the capacitor ripple current in the topology of use, and the change in ambient temperature. There is a limit to accuracy, therefore, in order to ensure the reliability of the capacitor to determine the deterioration state of the electrolytic capacitor in advance, and, a fault diagnosis for continuously observing the current capacitor state is essential [1,2]. Figure 1 shows the failure distribution of different components in a static converter [3]. It is obvious that the electrolytic capacitor is the weakest element in the converters.
The lifetime of electrolytic capacitors is typically 1000 to 10,000 h in the case of operating under high temperatures, which is not long enough for most applications
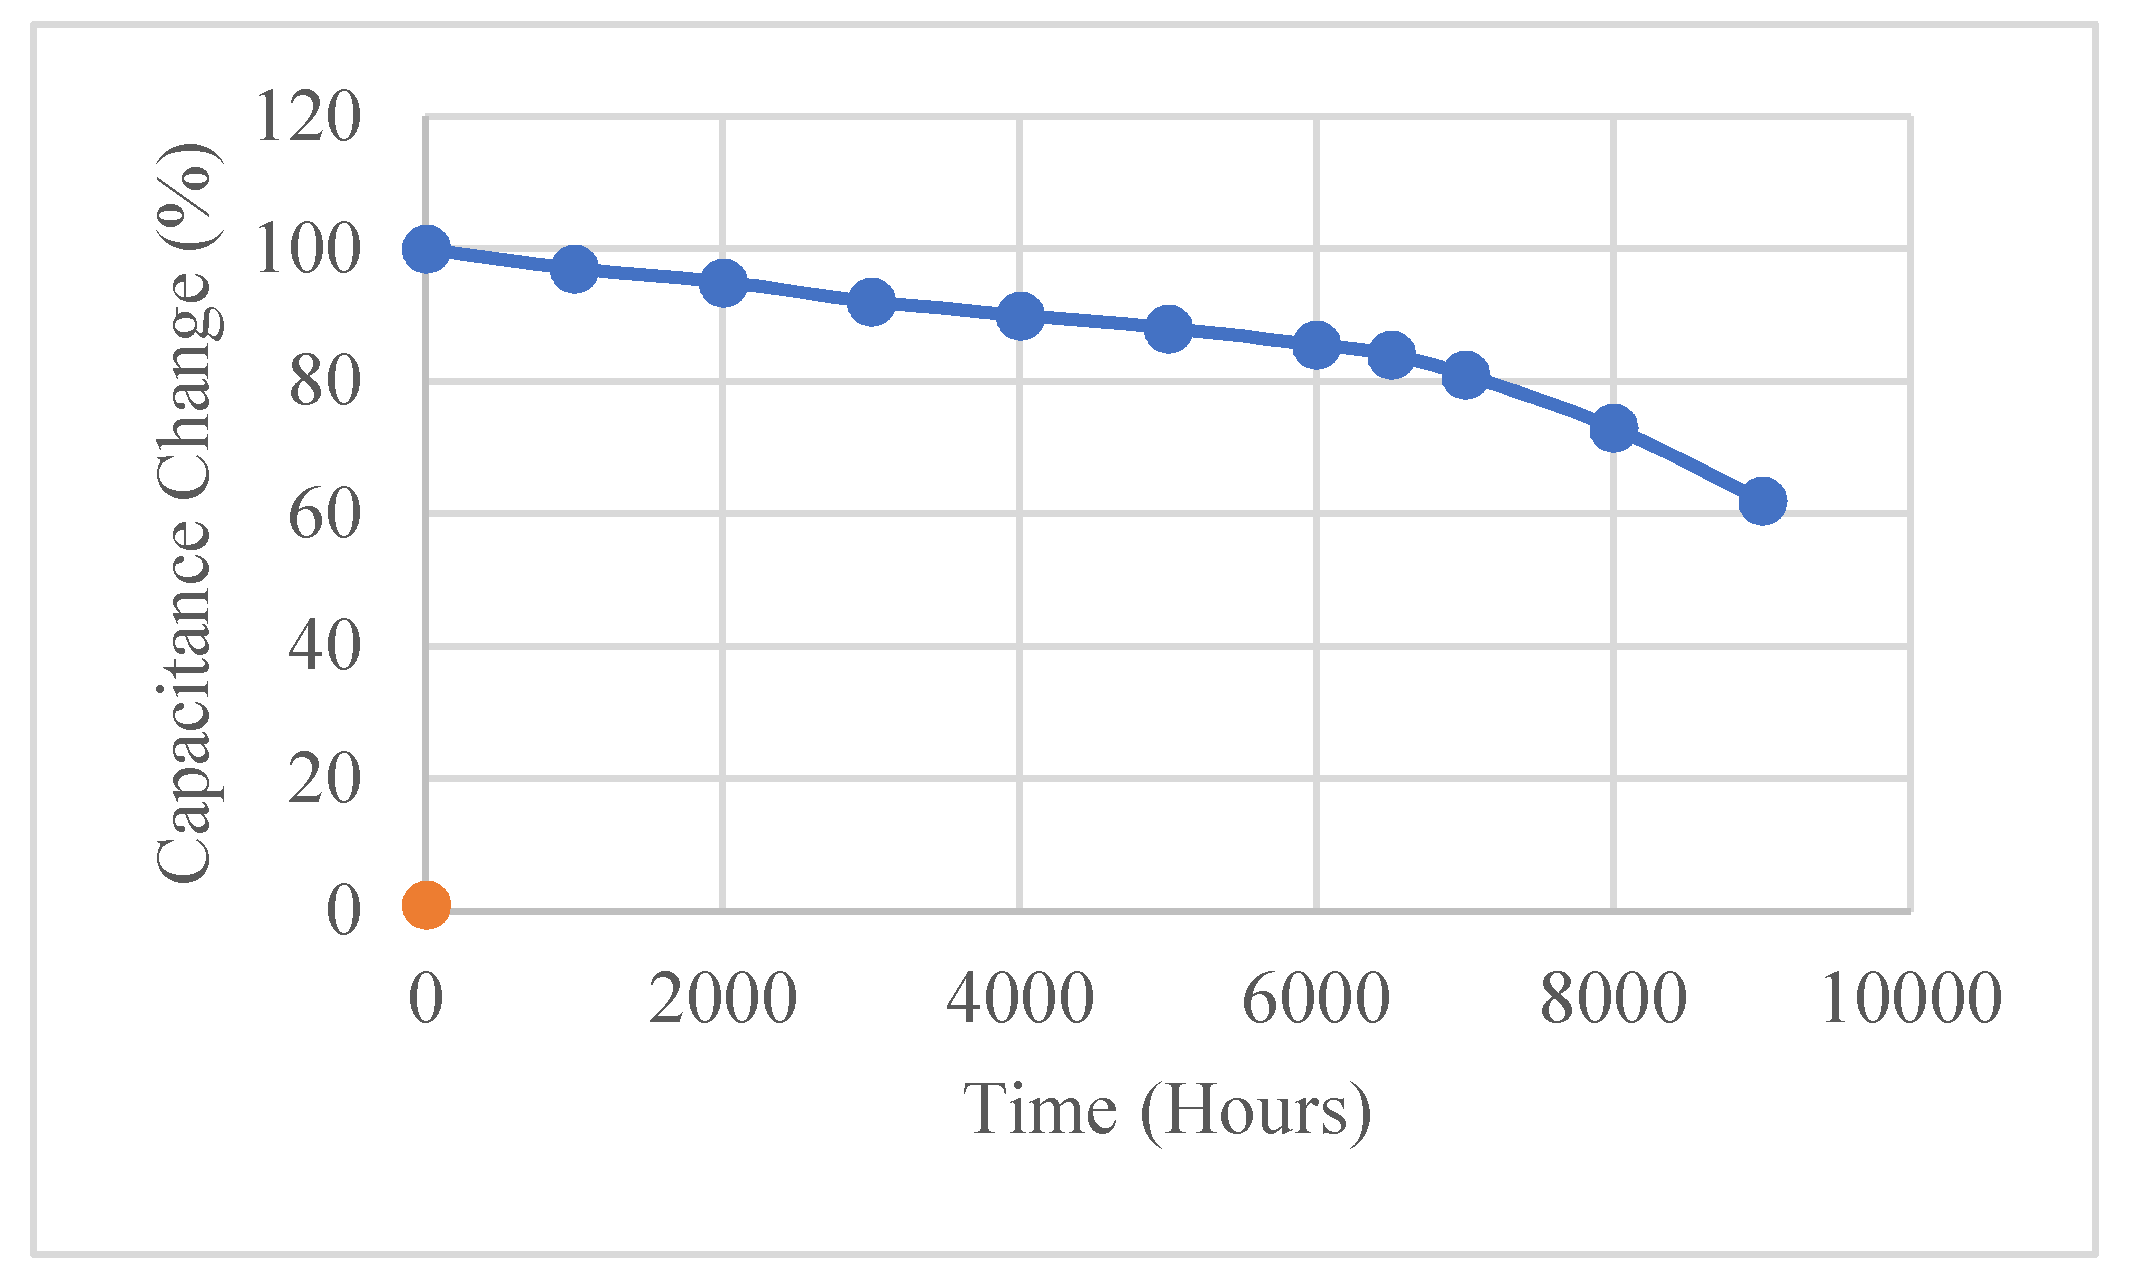
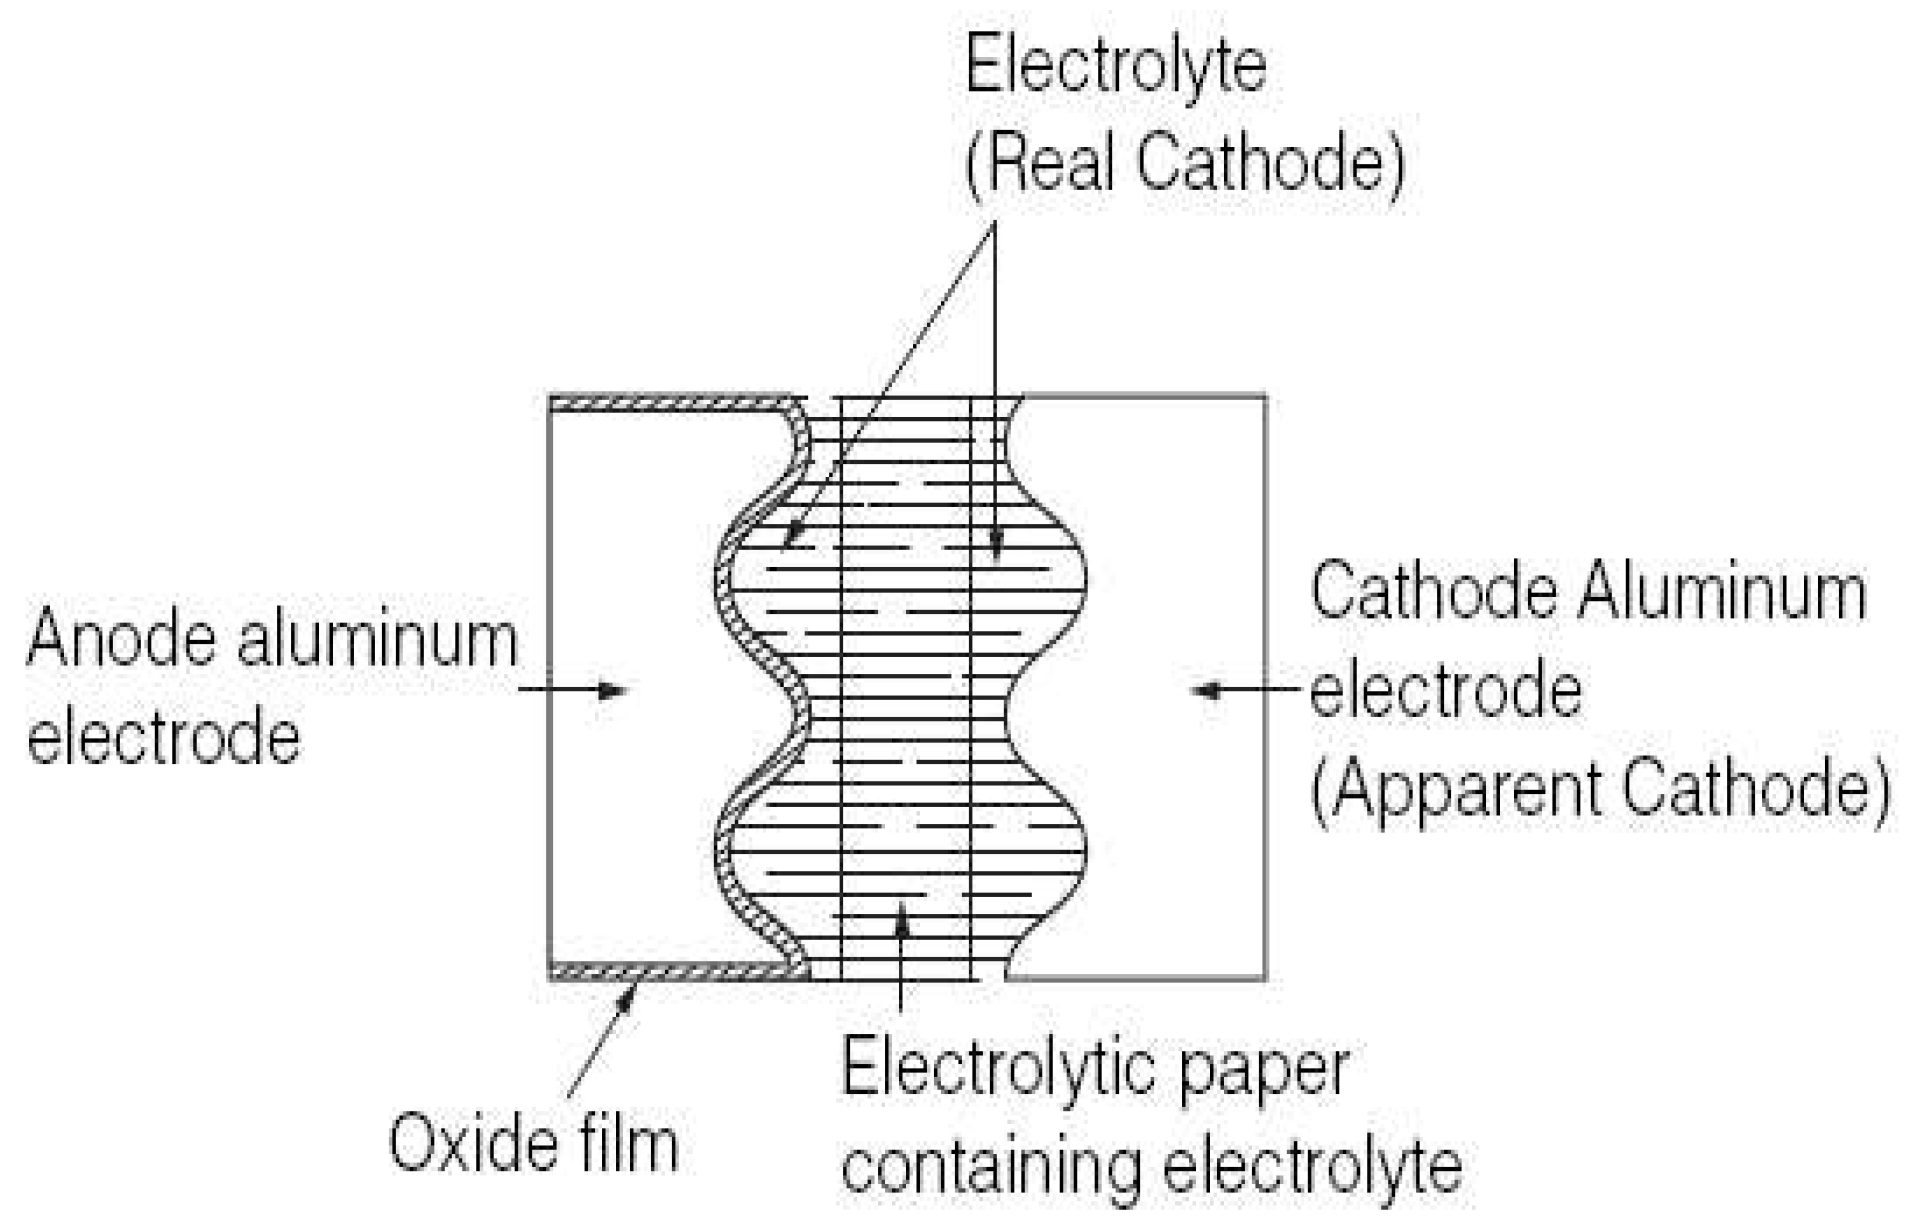
The maximum temperature ratings are typically between +85 °C and +105 °C [4]. Figure 2 shows a typical capacitor characteristic at 105 °C; the capacitor lifetime is about 8000 h. To diagnose the reasons of electrolytic capacitor failure, the configuration of the capacitor should be introduced, as shown in Figure 3. Any aluminum electrolytic capacitor has two aluminum sheets and an electrolytic solution [5]. The aluminum electrolytic capacitor can be electrically represented as a series connection of capacitor, resistor, and inductor, as shown in Figure 4 [6].
Here, the generation of capacitance C is generated at the anode and cathode, the internal resistance Rs is represented by the resistance of the electrolyte and the insulating paper, and another small resistance configured in parallel with C is due to the electrolyte leakage current. LS represents the equivalent series inductance.
The leak and deterioration of the electrolyte can be considered as the main eroding process in these capacitors by vapor diffusion through the seals. As a result of this deterioration, the capacitor’s internal ESR changes from the original value [7,8,9,10]. Until now, the failure signal diagnosis technique has been mostly fault-determined by determining the onset of abnormal signs when the ESR value of the electrolytic capacitor deteriorates more than twice as normal. In [11], a pulsating component voltage/current signal of a capacitor is modeled in a DC/DC converter by a bandpass filter (BPF) for a specific switching frequency range. References [12,13,14] proposed a method of estimating the capacitor ESR by recursive least squares (RLS) signal processing and Root-Mean-Square (RMS) operation after passing the pulsating voltage/current signal of the capacitor through the BPF, respectively. Beside this method, several algorithms, such as DFT (Discrete Fourier Transform) [15], Newton–Raphson [16], the least square method (LMS) [17], and the Laplace transform algorithm [18] were also proposed to calculate the capacitance or ESR to predict the capacitor lifetime by using the voltage/current injection method. As such, these methods are largely dependent on the signal processing of the BPF, which is cumbersome to know a specific switching frequency in advance for each PWM power converter, which must have a very large bandwidth. However, when the bandwidth of the filter is large, the size of the signal is reduced due to the influence of the capacitor′s impedance. Furthermore, as the higher order filter design is required, the filter coefficient and the hardware implementation are difficult.
Instead of injecting a voltage or current signal, it is possible to measure or calculate the capacitor ripple current based on the difference between the converter output current and inverter input current. The direct measuring of the capacitor current ripples is used in a few studies [19,20]. This method adds more hardware in the capacitor circuit, which adds complexity and cost. Moreover, using a toroidal core in measuring the capacitor ripple current adds extra parasitic inductance, which deteriorates the estimation of the capacitance.
To have more efficient lifetime estimation methods, several intelligent control approaches have been proposed in the signal injection techniques, such as Support Vector Regression [21,22], neural networks [23], and particle swarm optimization (PSO) [24]. To implement the neural network (ANN) method with accurate MPPT, the selection of neurons and layers should be large so that it takes more time in the training stage [25]. The Support Vector Machine (SVM) method has been proposed as a regression method to estimate the capacitance based on the sampling data of capacitance and the DC-link capacitor power. The SVM method is considered to have a significant advantage over ANN. SVM has a global and unique solution, while ANN can stick in multiple local minima. However, using fixed SVM parameters in a wide range and continuous variation of the capacitance results shows low estimation accuracy. Therefore, it is necessary to use an optimization algorithm to optimize the Support Vector Regression (SVR) parameters for the wide range capacitance.
To optimize the selection of these parameters, a genetic algorithm (GA) or PSO can be used. However, for the sake of simplicity, high-optimization performance, and fast convergence, PSO has significant merit over the other optimization techniques [26].
However, by using the Particle Swarm Optimization-Support Vector Regression (PSO-SVR) method, the population results have random manner due to the PSO-generated features. Therefore, it is not sufficient to use PSO alone to produce a precise result when it is used to tune the SVR parameters. The opposition-based learning (OBL) method can be used to accelerate the process of optimizing the SVR parameters in different conditions and obtain knowledge about the corresponding global optimum. The proposed opposition-based learning particle swarm optimization (OPSO) is used to tune the SVR parameters to improve the capacitance estimation capability by comparing the obtained parameters from the SVR training and the parameters that are obtained from SVR with the opposite parameters. If the SVR with opposite parameters is better, these parameters are then used in the next step until the estimation process is done [27].
In this paper, an AC voltage component that has a frequency of 30 Hz, which is lower than the line frequency, and an amplitude of 10 V is injected into the DC-link voltage reference, which causes the real DC-link voltage to oscillate with the same frequency. The effect of the injected AC component is negligible because the number of the cycles of the injected voltage is short. The resulting AC voltage ripple component is then extracted using a BPF to estimate the DC-link capacitance using the OPSO-SVR method with tunable parameters by using opposition-based learning (OBL). The kernel function in SVR is used to estimate the capacitance based on the sampling data and SVR parameters, which are obtained from the offline training process. The proposed algorithm is validated by the experimental results.

2. Capacitance Lifetime Monitoring

In the AC–DC–AC converter steady-state condition, the DC-link voltage stays constant except for switching frequency-related ripple components. To estimate the capacitor circuit parameters, the available information from the constant DC-voltage is not enough to use. Therefore, injecting a low frequency signal to the reference voltage is required to estimate the capacitance during the disturbance. The injected component into the constant DC-link voltage is as follows:
v d c , r i p p l e = V a c sin ω i n t
To guarantee an accurate capacitance estimation, the DC-link voltage with the injected AC voltage should be controlled precisely. Therefore, a feedforward component needs to be added to the conventional DC-link voltage controller. When the PWM converter loss is neglected, the input and output power of the DC-link can be expressed as:
C 2 d v d c 2 d t = p i n p o u t
Equation (2) is used to estimate the DC-link capacitance by calculating the two sides of the equation as follows:
p i n = 3 2 ( v d e i d e + v q e i q e )
p o u t = 3 2 ( v d s e i d s e + v q s e i q s e )
If i d e = i d e = 0 for the unity power factor control of the line side, then:
p i n = 3 2 E i q e
From (2) through (5), the feedforward component of the q-axis current reference is as follows:
i q e , f f = 2 3 E ( C 2 d v d c 2 d t + p o u t )
The total reference DC-link voltage is given as:
v d c = V d c 0 + v d c , r i p p l e = V d c 0 + V a c sin ω i n t
By substituting the DC-link Equation of (7) in (6), and assuming that V d c 0 > > V a c , then:
d v d c 2 d t = 2 ω i n V d c 0 V a c cos ω i n t
Thus, by substituting the square derivative of the DC-link voltage from (8) into (6), the feedforward component of the q-axis current reference is expressed as:
i q e , f f = 2 3 E ( ω i n C V d c 0 V a c cos ω i n t + p o u t )
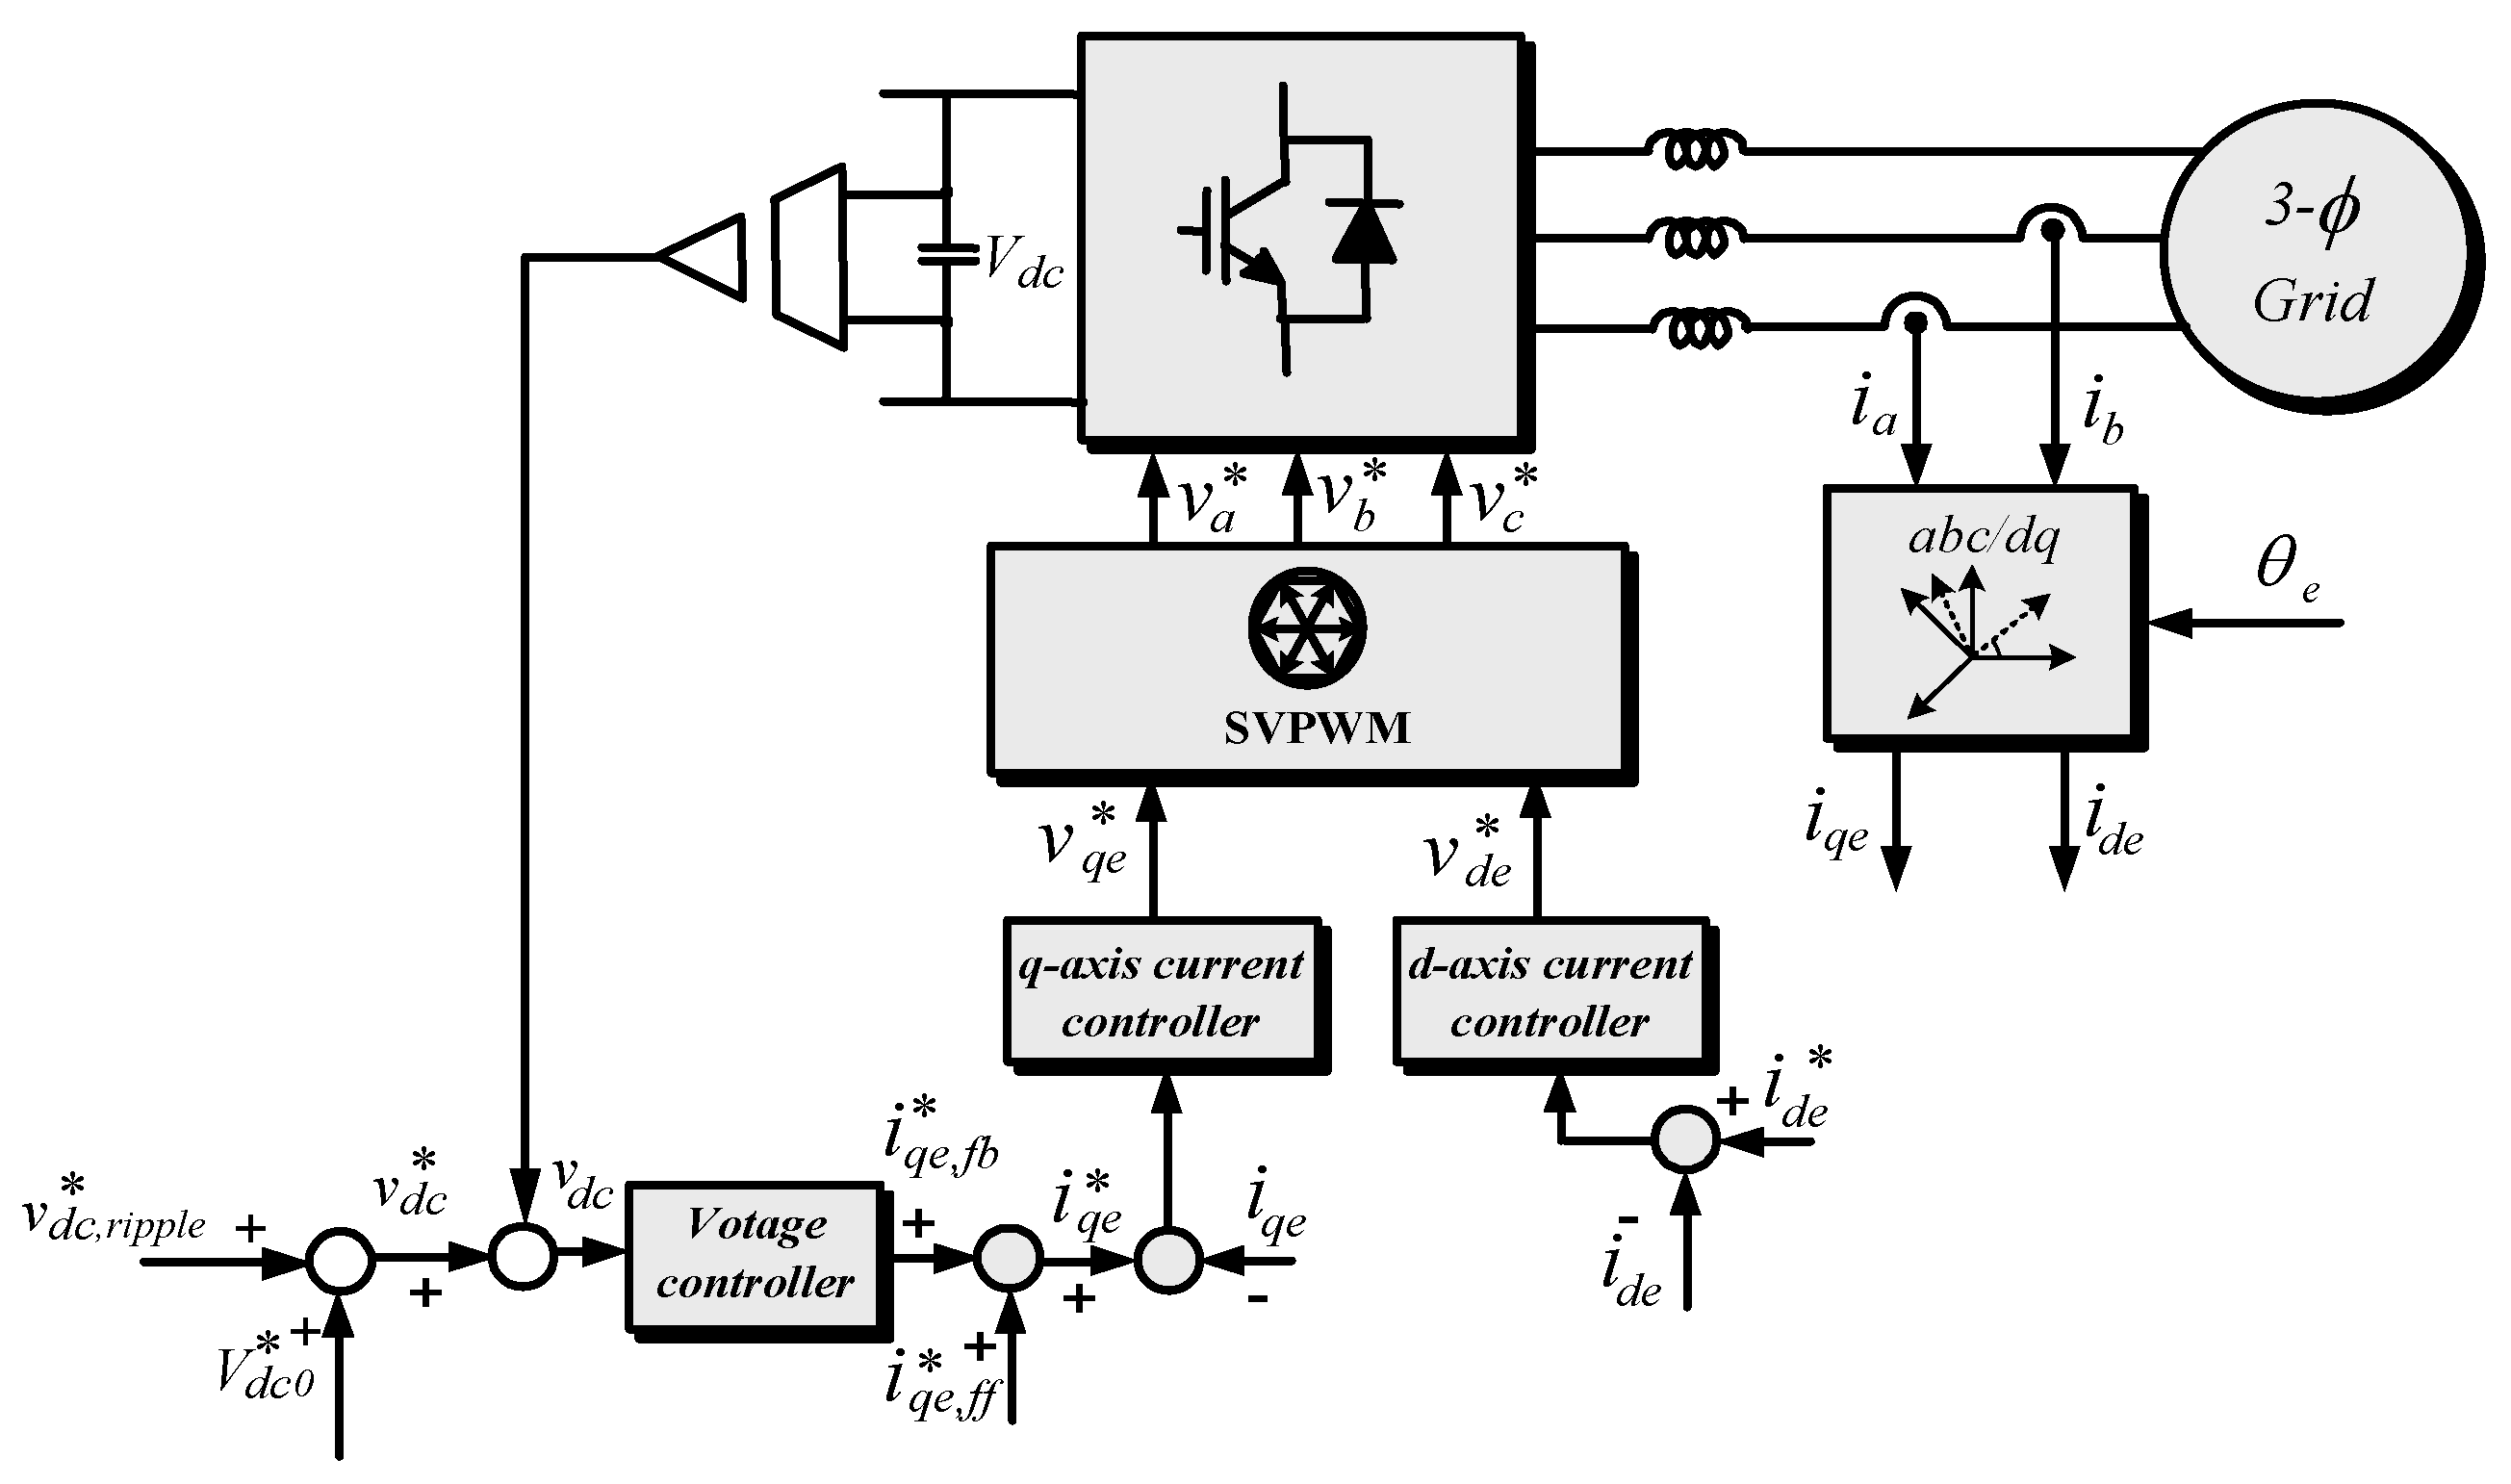
Figure 5 shows the control block diagram of the AC/DC/AC PWM converter. The controller consists of a DC-link voltage control loop and two current control loops. The q-axis current is determined by the DC-link voltage controller, while the d-axis current controller determines the output current power factor. The output current of the converter is controlled in phase with the mains voltage and can be controlled at almost unity power factor. The DC-link voltage is controlled by the current of the axis q corresponding to the active power, and the current of the axis d, corresponding to the reactive power, controls the power factor. Under load conditions, it is important to control the DC-link with a constant reference voltage while the current reference of the q axis changes, depending on the actual power component. By injecting the low frequency voltage component into the reference voltage of the DC-link, the q-axis reference of the converter and the actual current includes ripple components of the same frequency.

3. Capacitance Estimation Using OPSO-SVFR

The proposed capacitance estimation algorithm was applied in two steps: opposition particle swarm optimization (OPSO), and parameters selection for SVM (Support Vector Machine) with OPSO. These two steps were performed on the input data of capacitance and the DC-link capacitor power. The two phases are discussed in Section 3.1 and Section 3.2.

3.1. Support Vector Regression (SVR)

SVM is an alternative learning method for Multi-Layer Perceptron Classifiers that minimizes structural risks, maps patterns into higher-dimensional feature spaces, and provides optimal identification. SVM, using the statistical learning method, minimizes structural errors, unlike conventional classification techniques, such as principal component analysis (PCA) and neural networks [27,28,29,30]. For this reason, SVM has been successfully implemented in various fields, such as prediction, classification, and regression. Support Vector Regression (SVR) has been extended to regression problems by introducing an insensitive loss function to SVM regression models, while SVM has been applied to the prediction of classification problems [31]. The SVM provides an optimal separation plane (hyperplane) to solve the classification problem. The reasons why SVM attracts attention are as follows: firstly, it is easy to interpret the results because it is based on a clear rationale; secondly, it can achieve a higher level of accuracy than neural networks in practical applications, such as classification and regression.
The choice of a subset of functions is an important issue when creating a regression analysis system to construct a regression model based on SVM. It is important to minimize the number of input functions that produce optimum predictions and models with less computationally intensive calculations. The use of a subset of small and appropriate characteristics can facilitate the implementation of regression decisions. The appropriate adjustment for the SVR parameters can improve the regression accuracy. Selecting the kernel function, kernel parameters, and the penalty factors are very important factors in the SVR design. Therefore, the proper selection of the subsets of functions and the parameter settings of the model have a significant impact on the regression accuracy. The selection of the characteristic subsets affects the appropriate parameters of the kernel, so it is best to obtain the subset of features and the SVR parameters at the same time.
As mentioned earlier, SVR is a regression method for predicting an unknown function between the inputs and outputs by using the training data. When the system input/output relationship is obtained in the offline process, a prediction of the output value based on the obtained relation can be obtained in the online process. The input and output data for offline training are given as (x1, y1), (x2, y2), ….. (xn, yn), where xi and yi are input and output vectors, and n is the number of training data. The general function of SVR is as follows [32]:
f ( x ) = ( w . Φ ( x ) ) + b
where ( . ) is the vector dot product. The slack variables ( ξ and ξ ), which minimize the empirical risk, are expressed as [24]:
R r e g ( f ) = 1 2 w 2 + C i = 1 n Γ ( f ( x i ) y i )
where Γ ( ) is the cost function, and C is the penalty factor that controls how much variation is allowed for the training data and the complexity term of the model ( w 2 ). The lack variable is introduced so that the estimation problem can be determined even if training data exists.
The optimization solution is expressed by subject to 0 α i C ,   0 α i C
f ( x ) = ( i = 1 n ( α i α i ) . ( φ ( x i ) . φ ( x ) ) + b
Through the introduction of the kernel function, the regression function of Equation (12) is represented by Equation (13)
f ( x ) = i = 1 n ( α i α i ) . K ( x i , x ) + b
where K ( x i , x j ) = Φ ( x i ) T Φ ( x j ) is the kernel function. The bias term b can be calculated as follows:
b   =   m e a n ( i = 1 n y i ( α i α i ) . K ( x i , x ) )
The radial base function (RBF) is selected to solve the problem as follows:
K ( x i , x ) = exp { | x i x | 2 σ 2 }

3.2. The O-Particle Swarm Optimization

The particle swarm optimization (PSO) algorithm is one of the optimization techniques that was inspired by the social behavior of animals, and was proposed in 1995 by J. Kennedy and R. Eberhart [33]. Just as bio populations, such as ants and bees, share information about each individual′s experience to find food and travel to the optimal location, the PSO algorithm makes it possible to find the optimal solution by balancing each other′s variables. The PSO algorithm has the disadvantage of being prone to the local minimum, but unlike other search algorithms, it can use global optimization for large and complex functions, such as evolutionary operations, and perform better than evolutionary operations. Due to its high speed, it has recently attracted much attention and has been applied to various fields that are difficult to solve with existing algorithms [34,35].
The PSO algorithm represents individual potential solutions as particles, and the number is initially determined by the dimension setting. The initialization and updates of PSO are randomly done in each calculation step using the standard PSO. An improvement for the random behavior of the standard PSO is obtained by initializing the swarm based on the opposite numbers. A comparison between the position and velocity components using the standard PSO and the opposition PSO is then done to select the optimum position and velocity.
The ith d-dimensional particle is characterized by its location vector P i t = P i 1 t , P i 2 t , , P i d t and its speed vector v i t = v i 1 t , v i 2 t , , v i d t . Each particle knows its best personal location P i , B e s t t and the entire population′s best global solution G B e s t t . The position of the population at iteration t is P t = P 1 t , P 2 t , , P N t , where N is the population size. Each particle updates its location according to Equations (16) and (17):
v i t + 1 = w t v i t + c 1 r 1 ( p i , B e s t t p i t ) + c 2 r 2 ( p G , B e s t t p i t )
where r 1 and r 2 are random functions in the range of [0, 1], c 1 and c 2 are personal and social learning factors, and w is the inertia weight.
p i t + 1   = p i t + v i t + 1 ,   i   =   1 , 2 , 3 , , N
The constriction coefficients introduced in [34] are used to set c 1 and c 2 :
x   =   2 φ 1 + φ 2 4 φ
c 1 =   x φ 1   ,   c 2 =   x φ 2
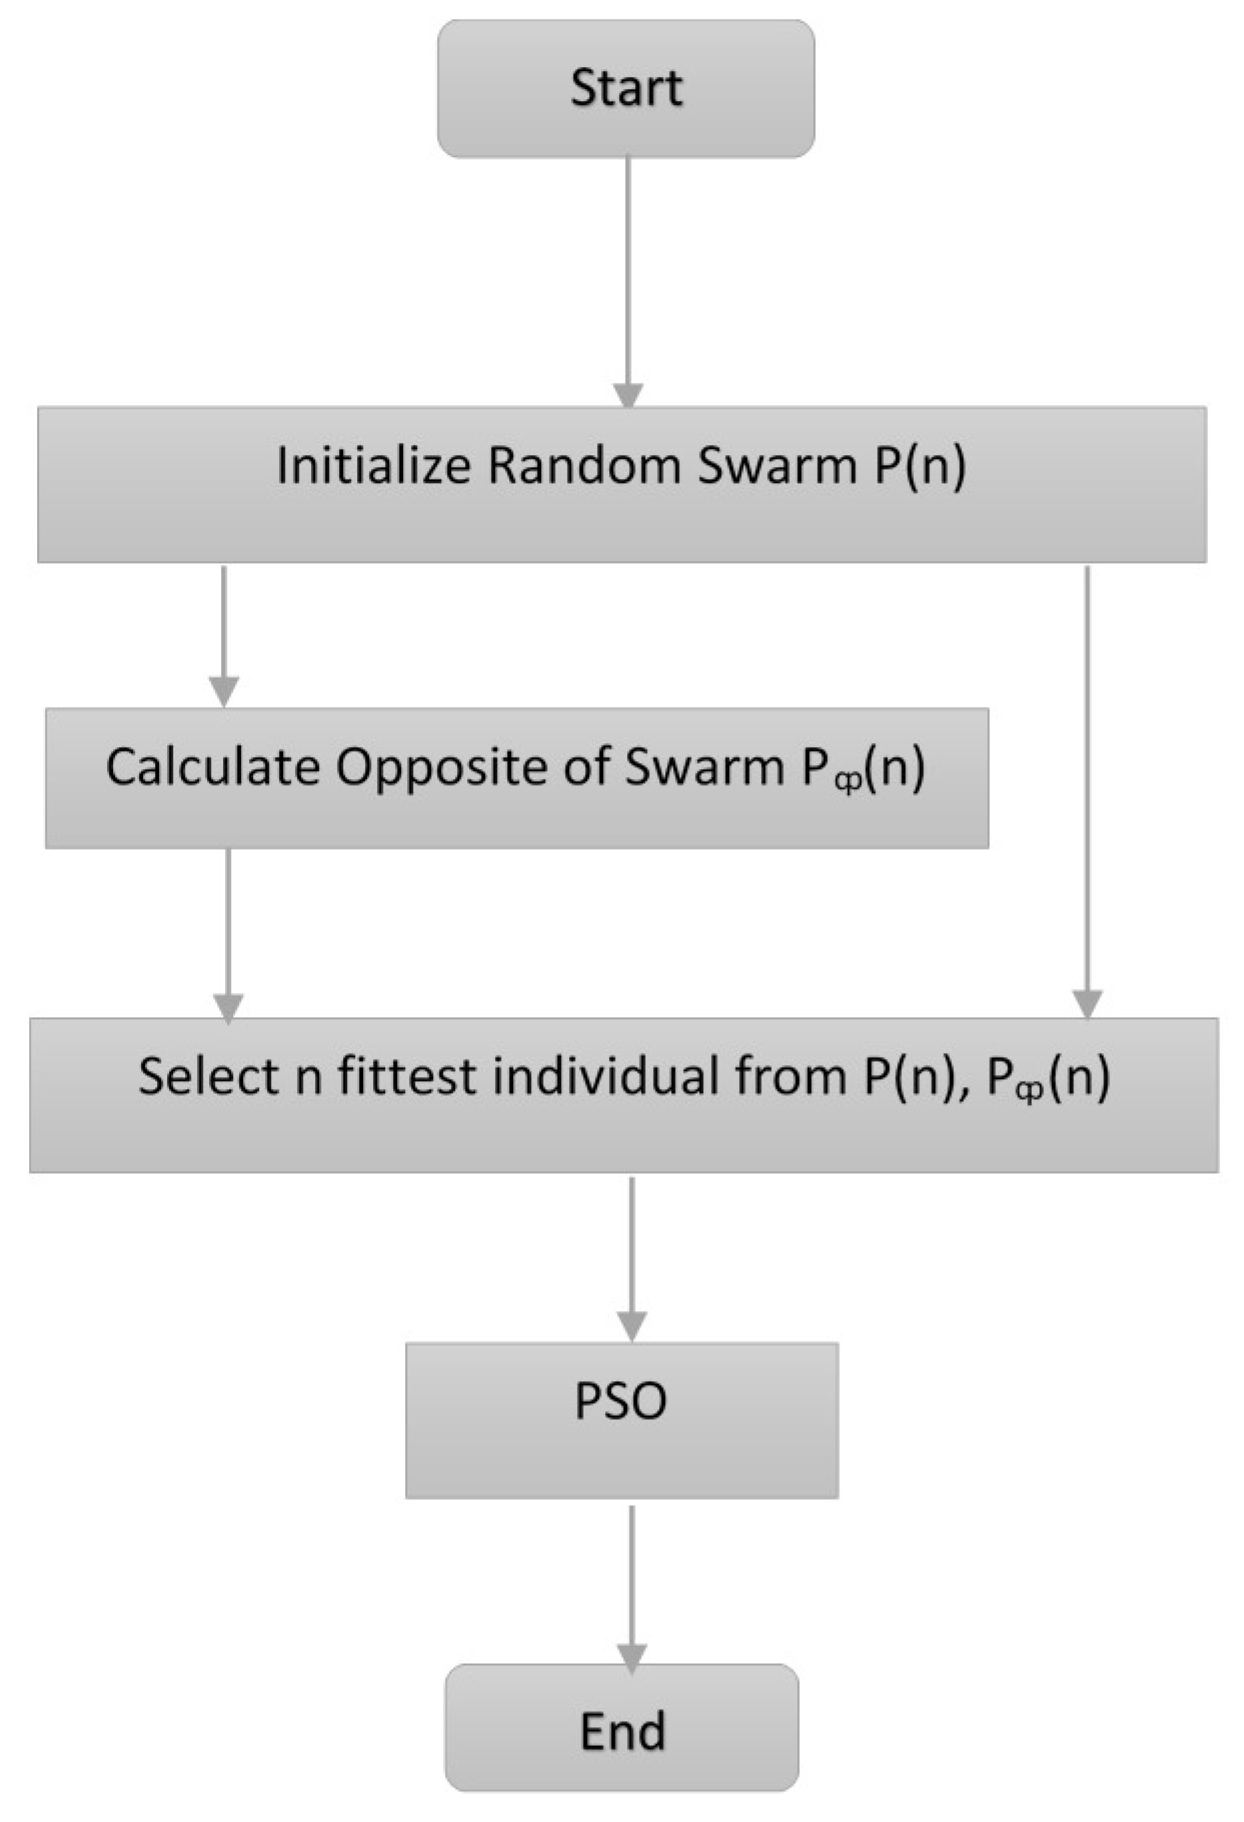
where φ = φ 1 + φ 2 > 4 . The optimization process is terminated when the best global solution results in a permissible fitness using the opposite PSO. The opposition-based population initialization technique is shown in the flowchart in Figure 6, which is used in initializing and updating the position and velocity components instead of random initialization.
The optimum voltage estimation using the OPSO-SVR method can be described in steps as follows:
  • Enter the original data for estimation, known as the data preparation step.
  • Initialize and update the particles using standard PSO and then repeat the same step using the opposite numbers.
  • Update the position and velocity components by using standard and opposition PSO formulas to get the accurate SVR parameters.
  • Perform an offline training process for SVR with training samples assessing each particle fitness value of the OPSO for the SVR.
  • Update each particle velocity and position until the termination condition is satisfied.
  • Construct and retrain the SVR estimation model based on the optimal parameters.
For each sample, BPF [ | P in P out | ] is the input of the SVR estimator, which is calculated from the source currents, voltages, and the DC-link voltage, while the estimated capacitance C ^ C ^ is the output, as shown in Figure 7.

3.3. Capacitance Estimation Using OPSO-SVR

In this paper, it was assumed that the initial nominal value of the capacitor was 3950 μF. This capacitor lifetime is ended when its value deteriorates to 1950 μF. In order to use OPSO-SVR to check the capacitance value during the system operation, it was necessary to collect a number of training data between the initial and final values.
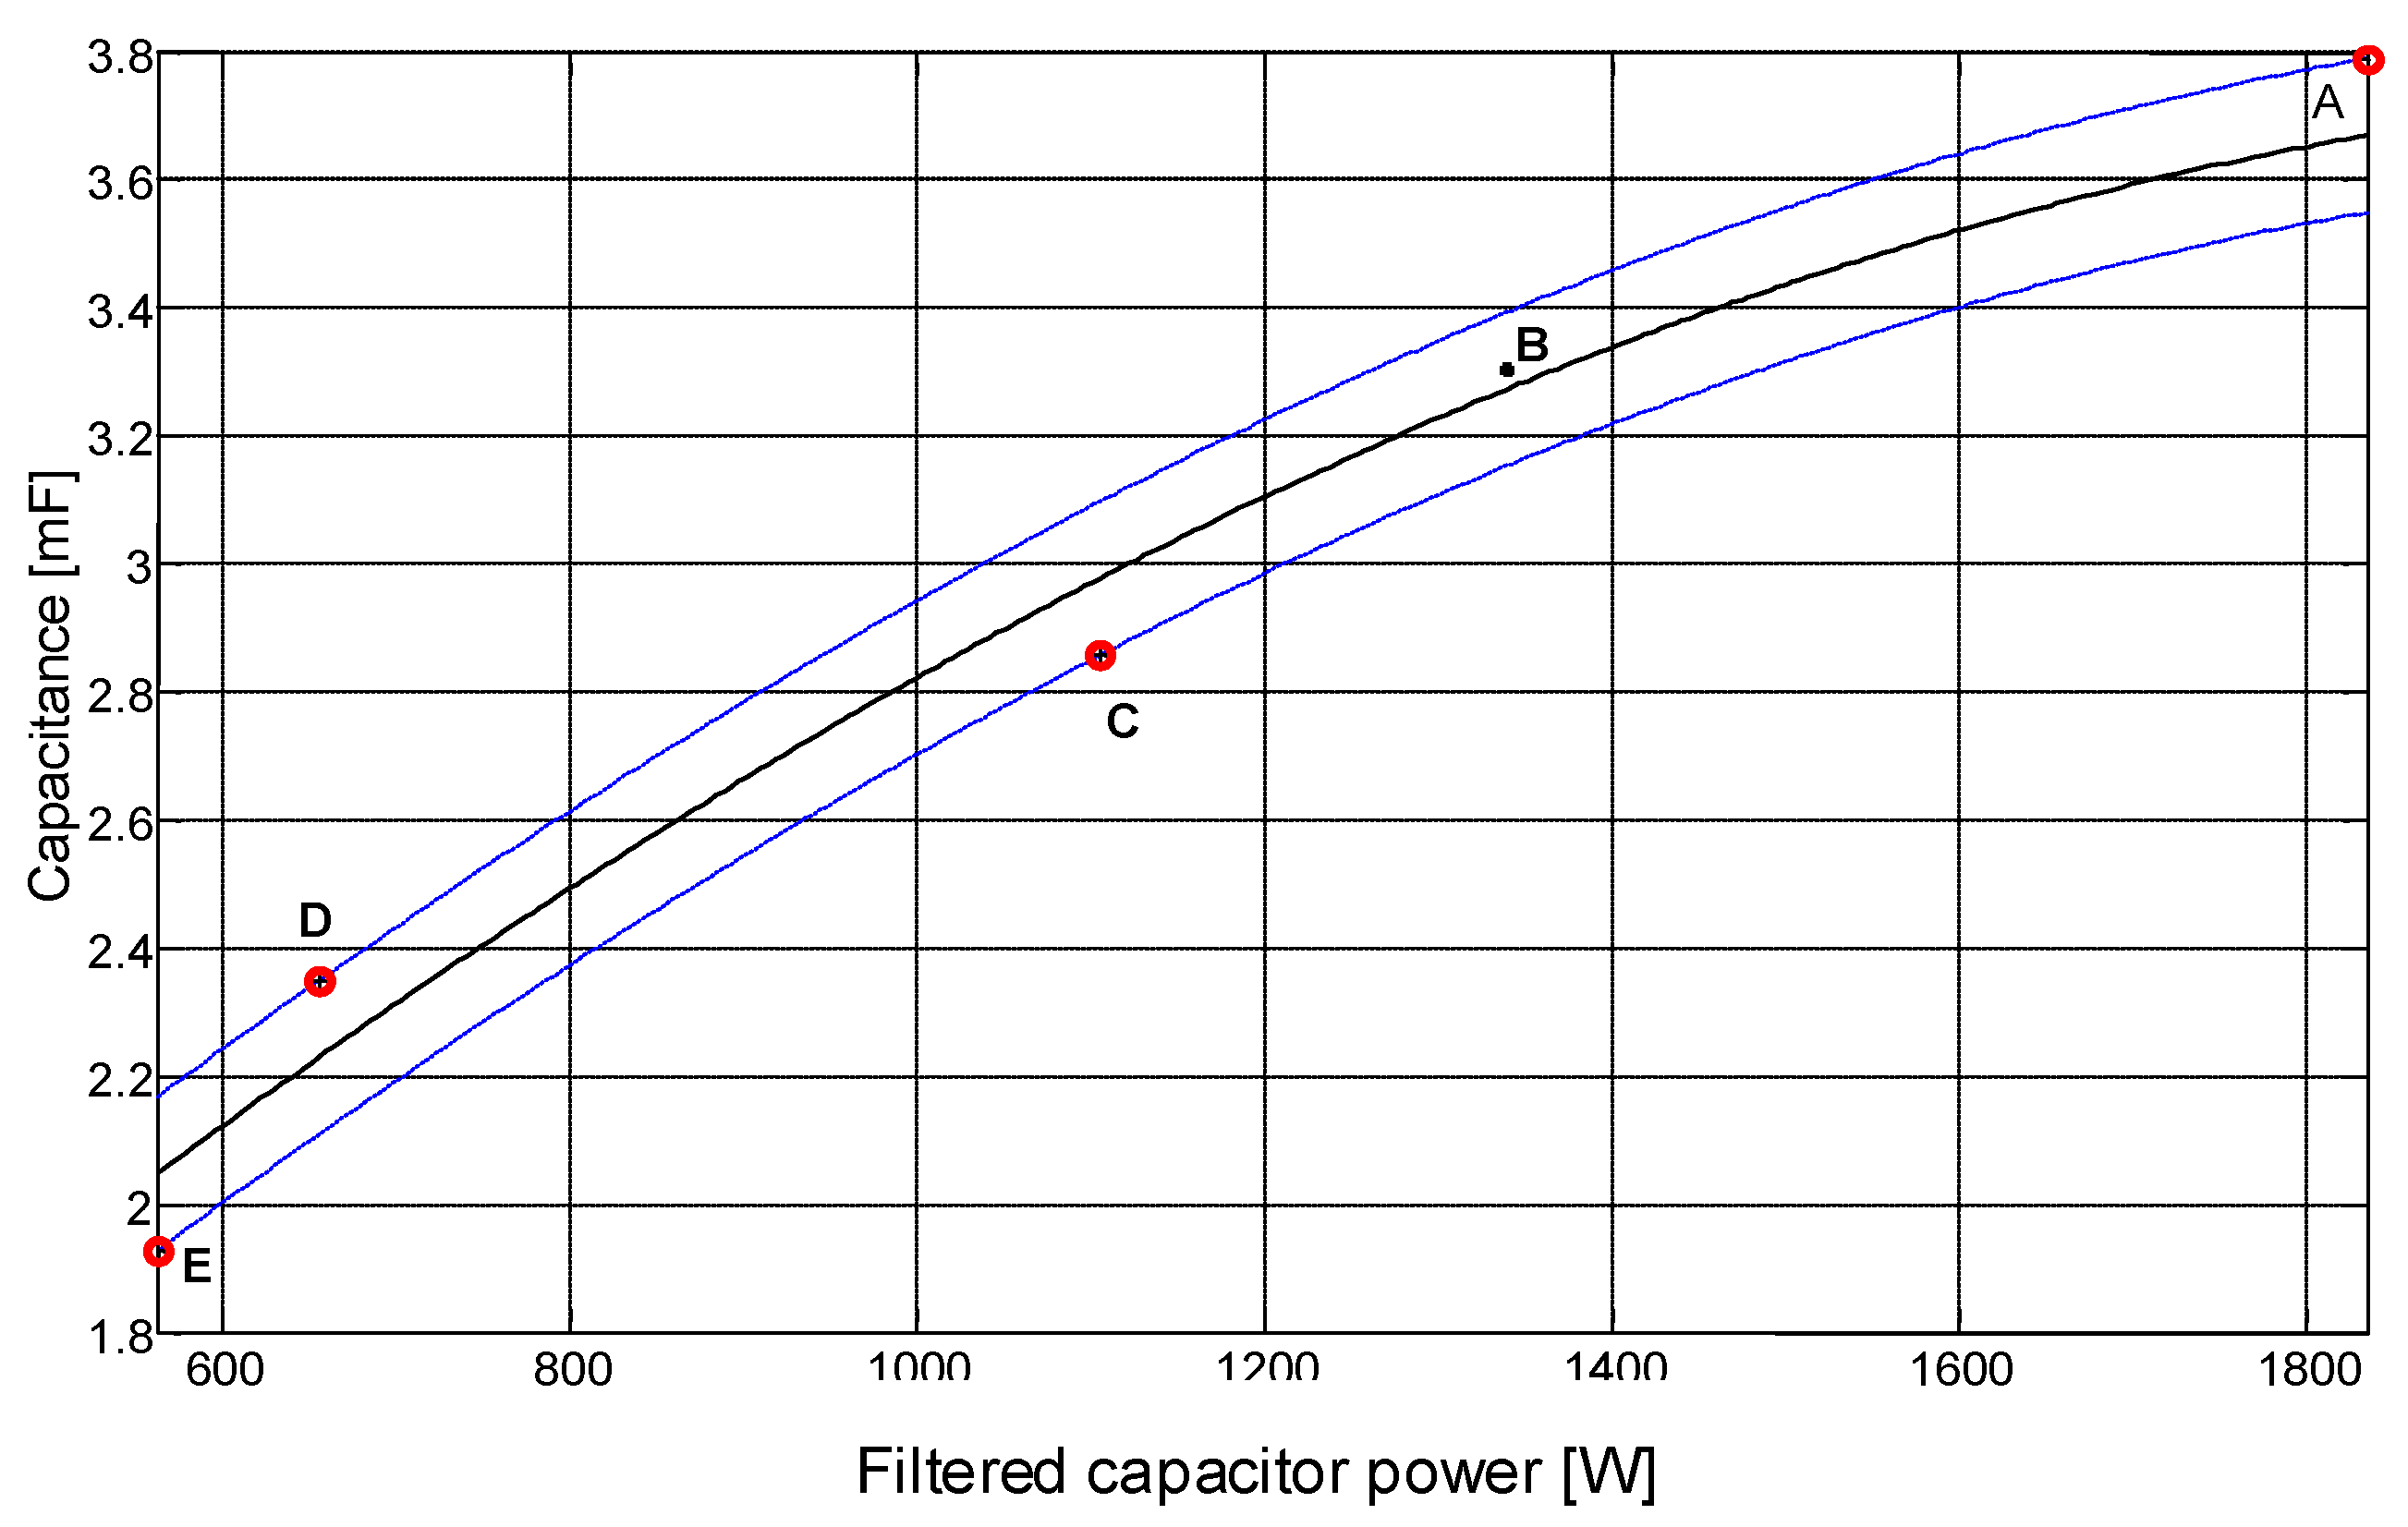
A combination between 1950 μF and 500 μF was used to obtain the required training data between 3950 and 1950 μF and its corresponding capacitor power, as shown in Table 1. Figure 8 shows the regression response of the trained data.
Figure 9 shows the flowchart of the proposed method. First, a suitable set of sampling data ( x j , y j ) were specified. The SVR parameters were computed through the offline process. Then, the optimized parameters were used online for any DC-link capacitor power x to estimate the unknown capacitance value.

4. Experimental Results

For validating the performance of the proposed OPSO-SVR algorithm, an experimental setup was implemented on a reduced scale in a laboratory, of which, the configuration is shown in Figure 10.
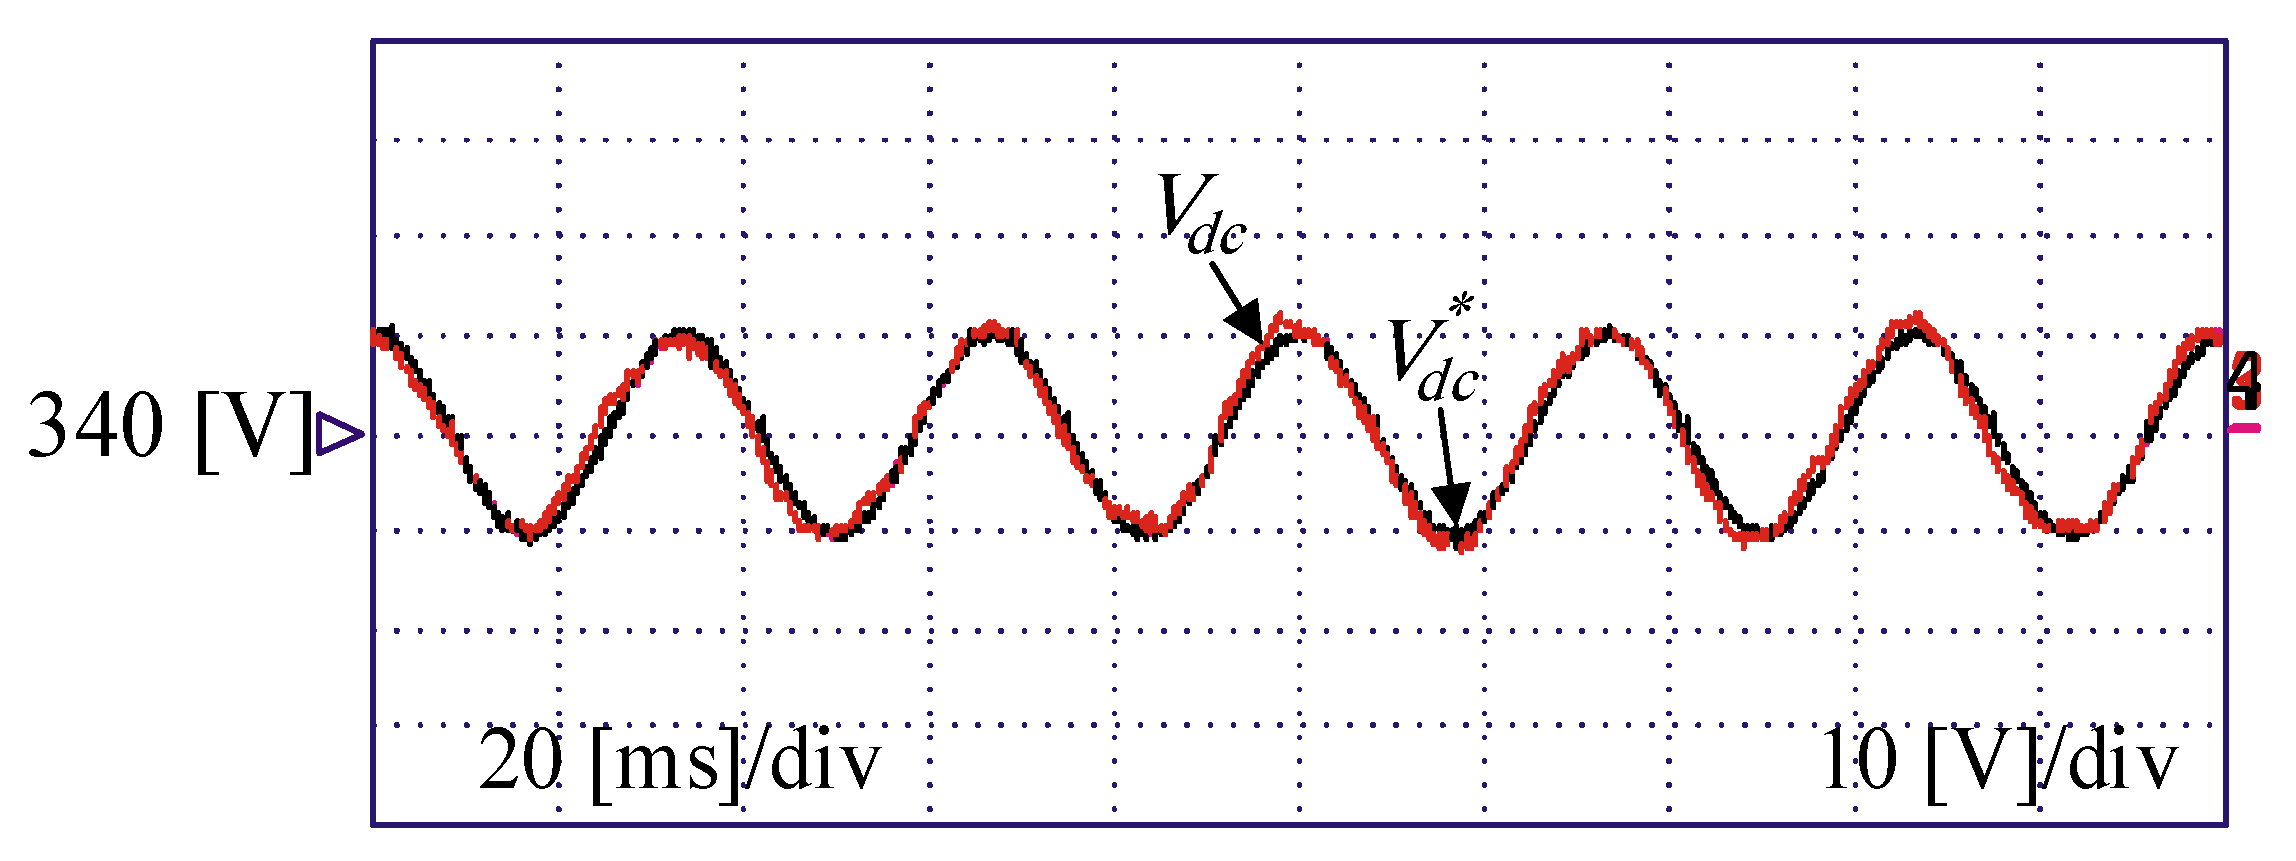
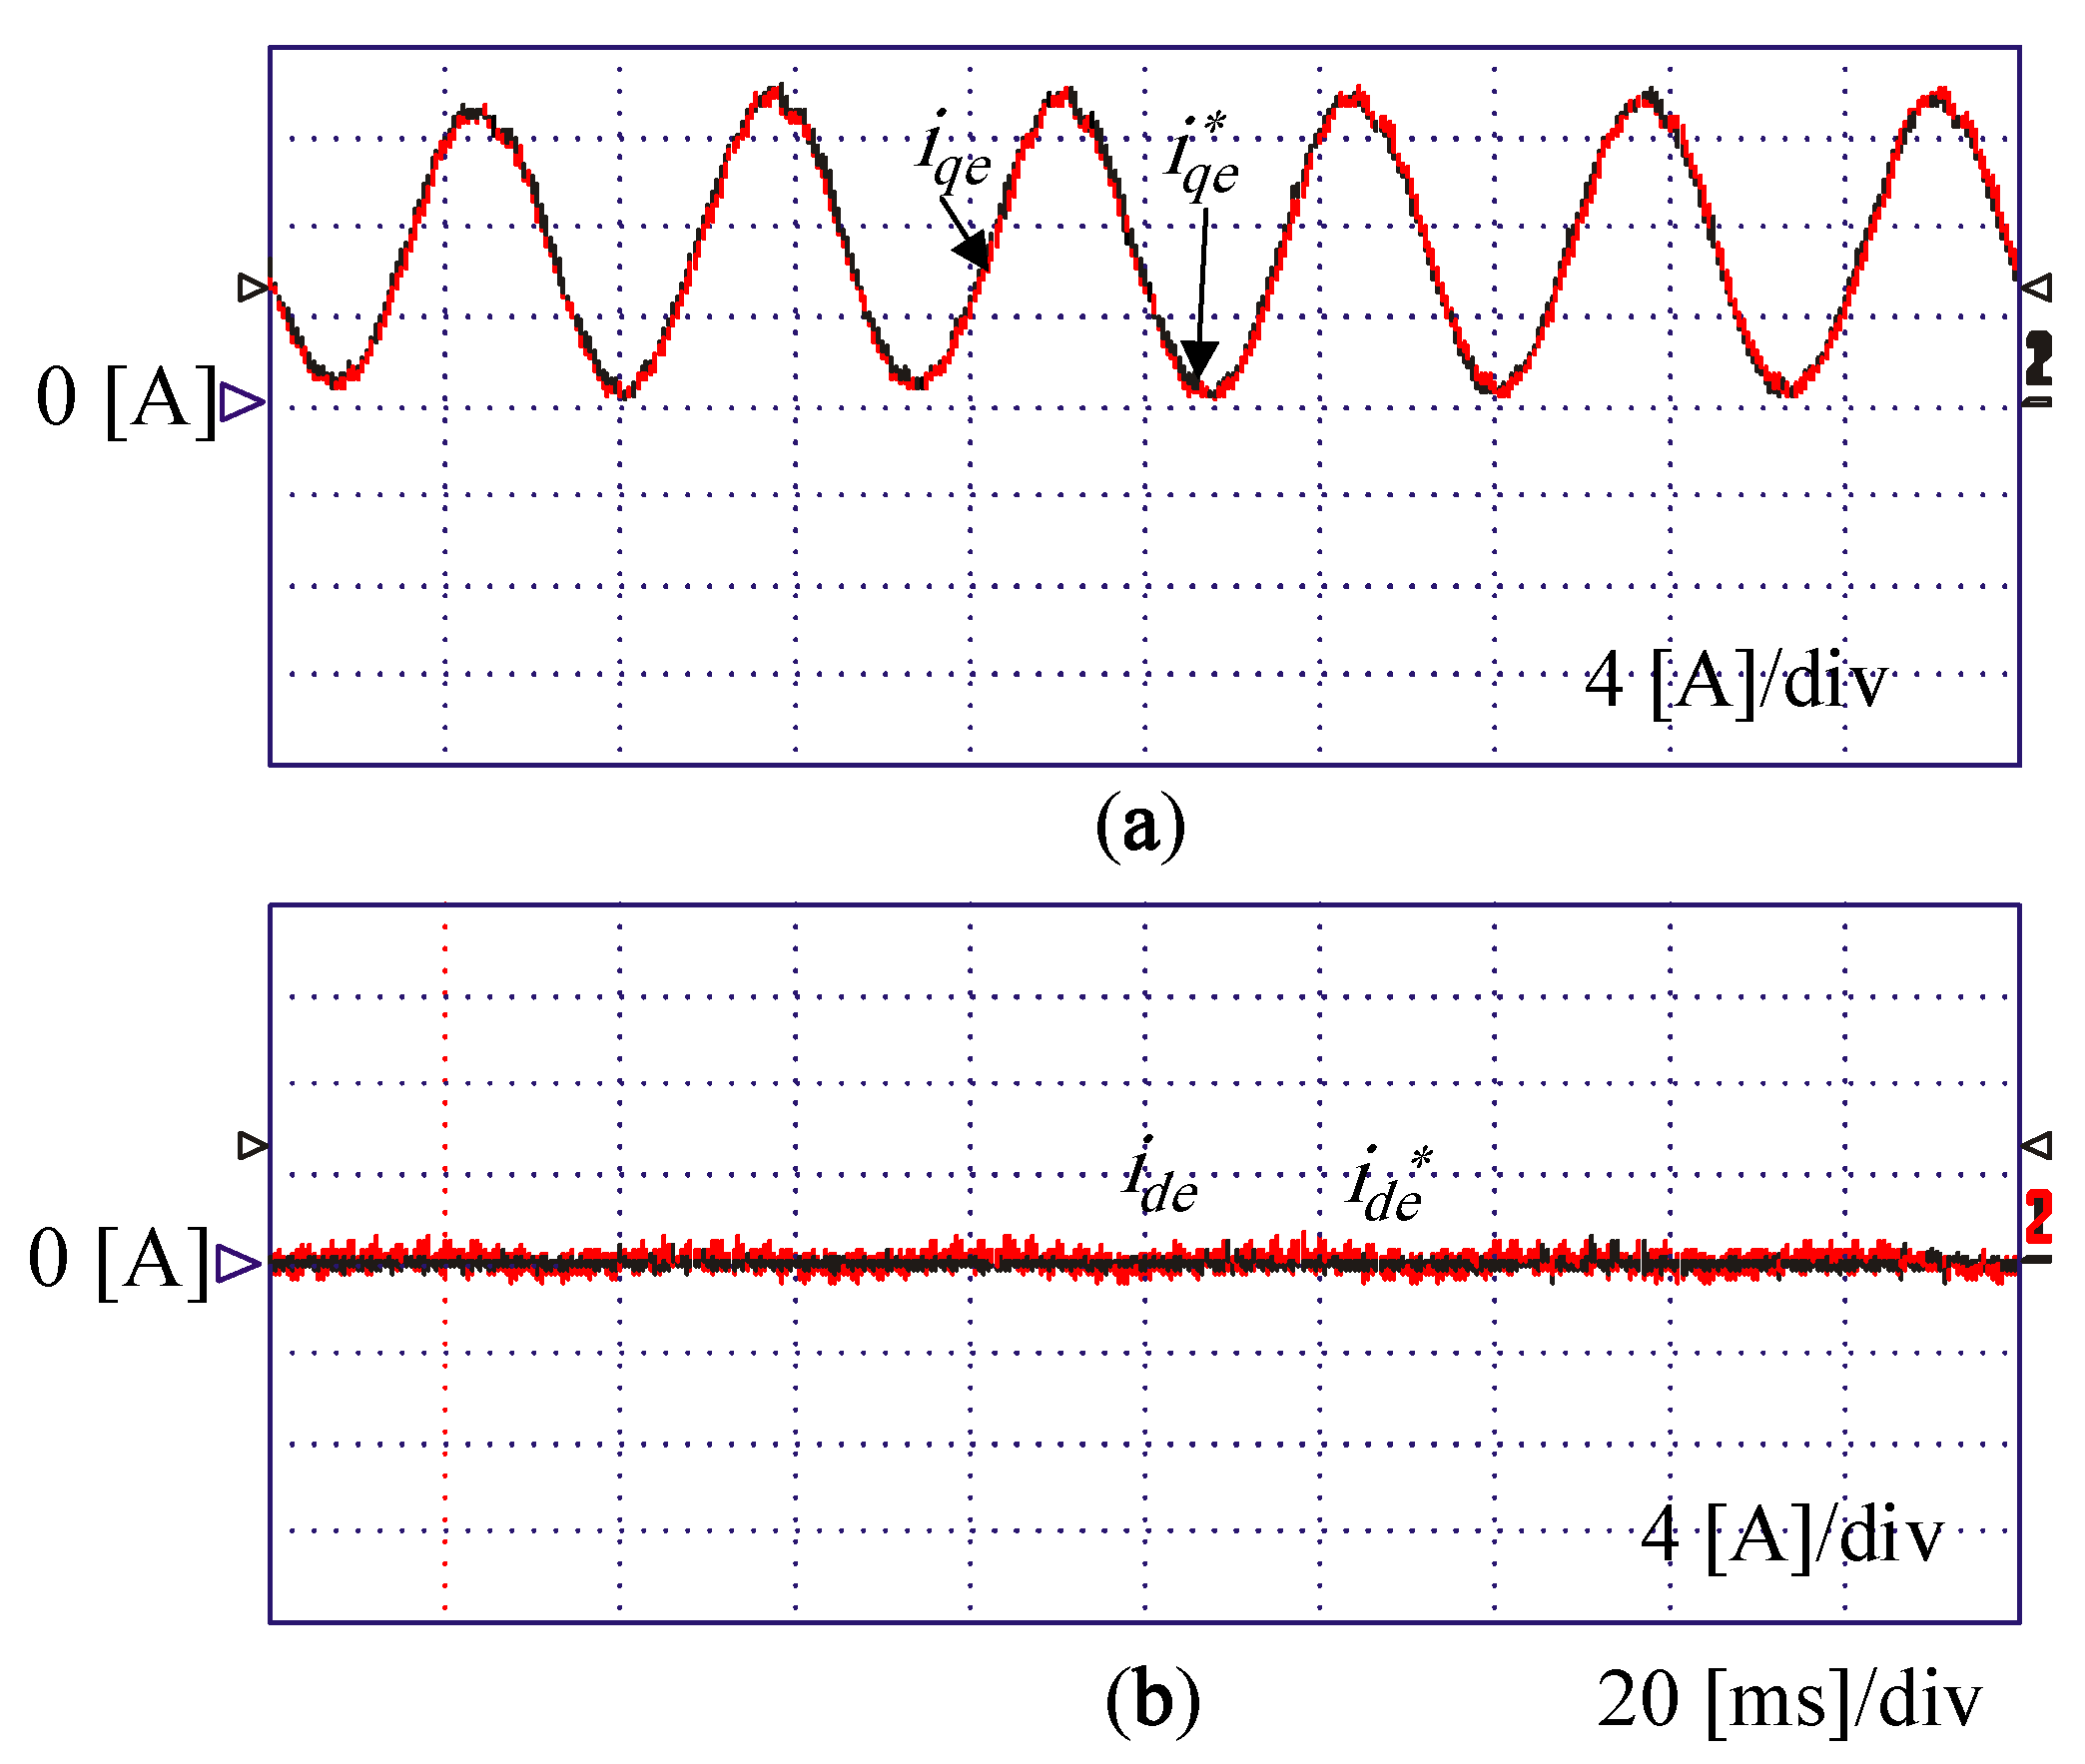
The reference DC-link voltage with the AC-injected component is shown in Figure 11. The amplitude of the injected component was 10 V and the frequency was 30 Hz. Figure 12a,b shows the control performance of the converter d- and q-axis currents, which can be considered satisfactory.
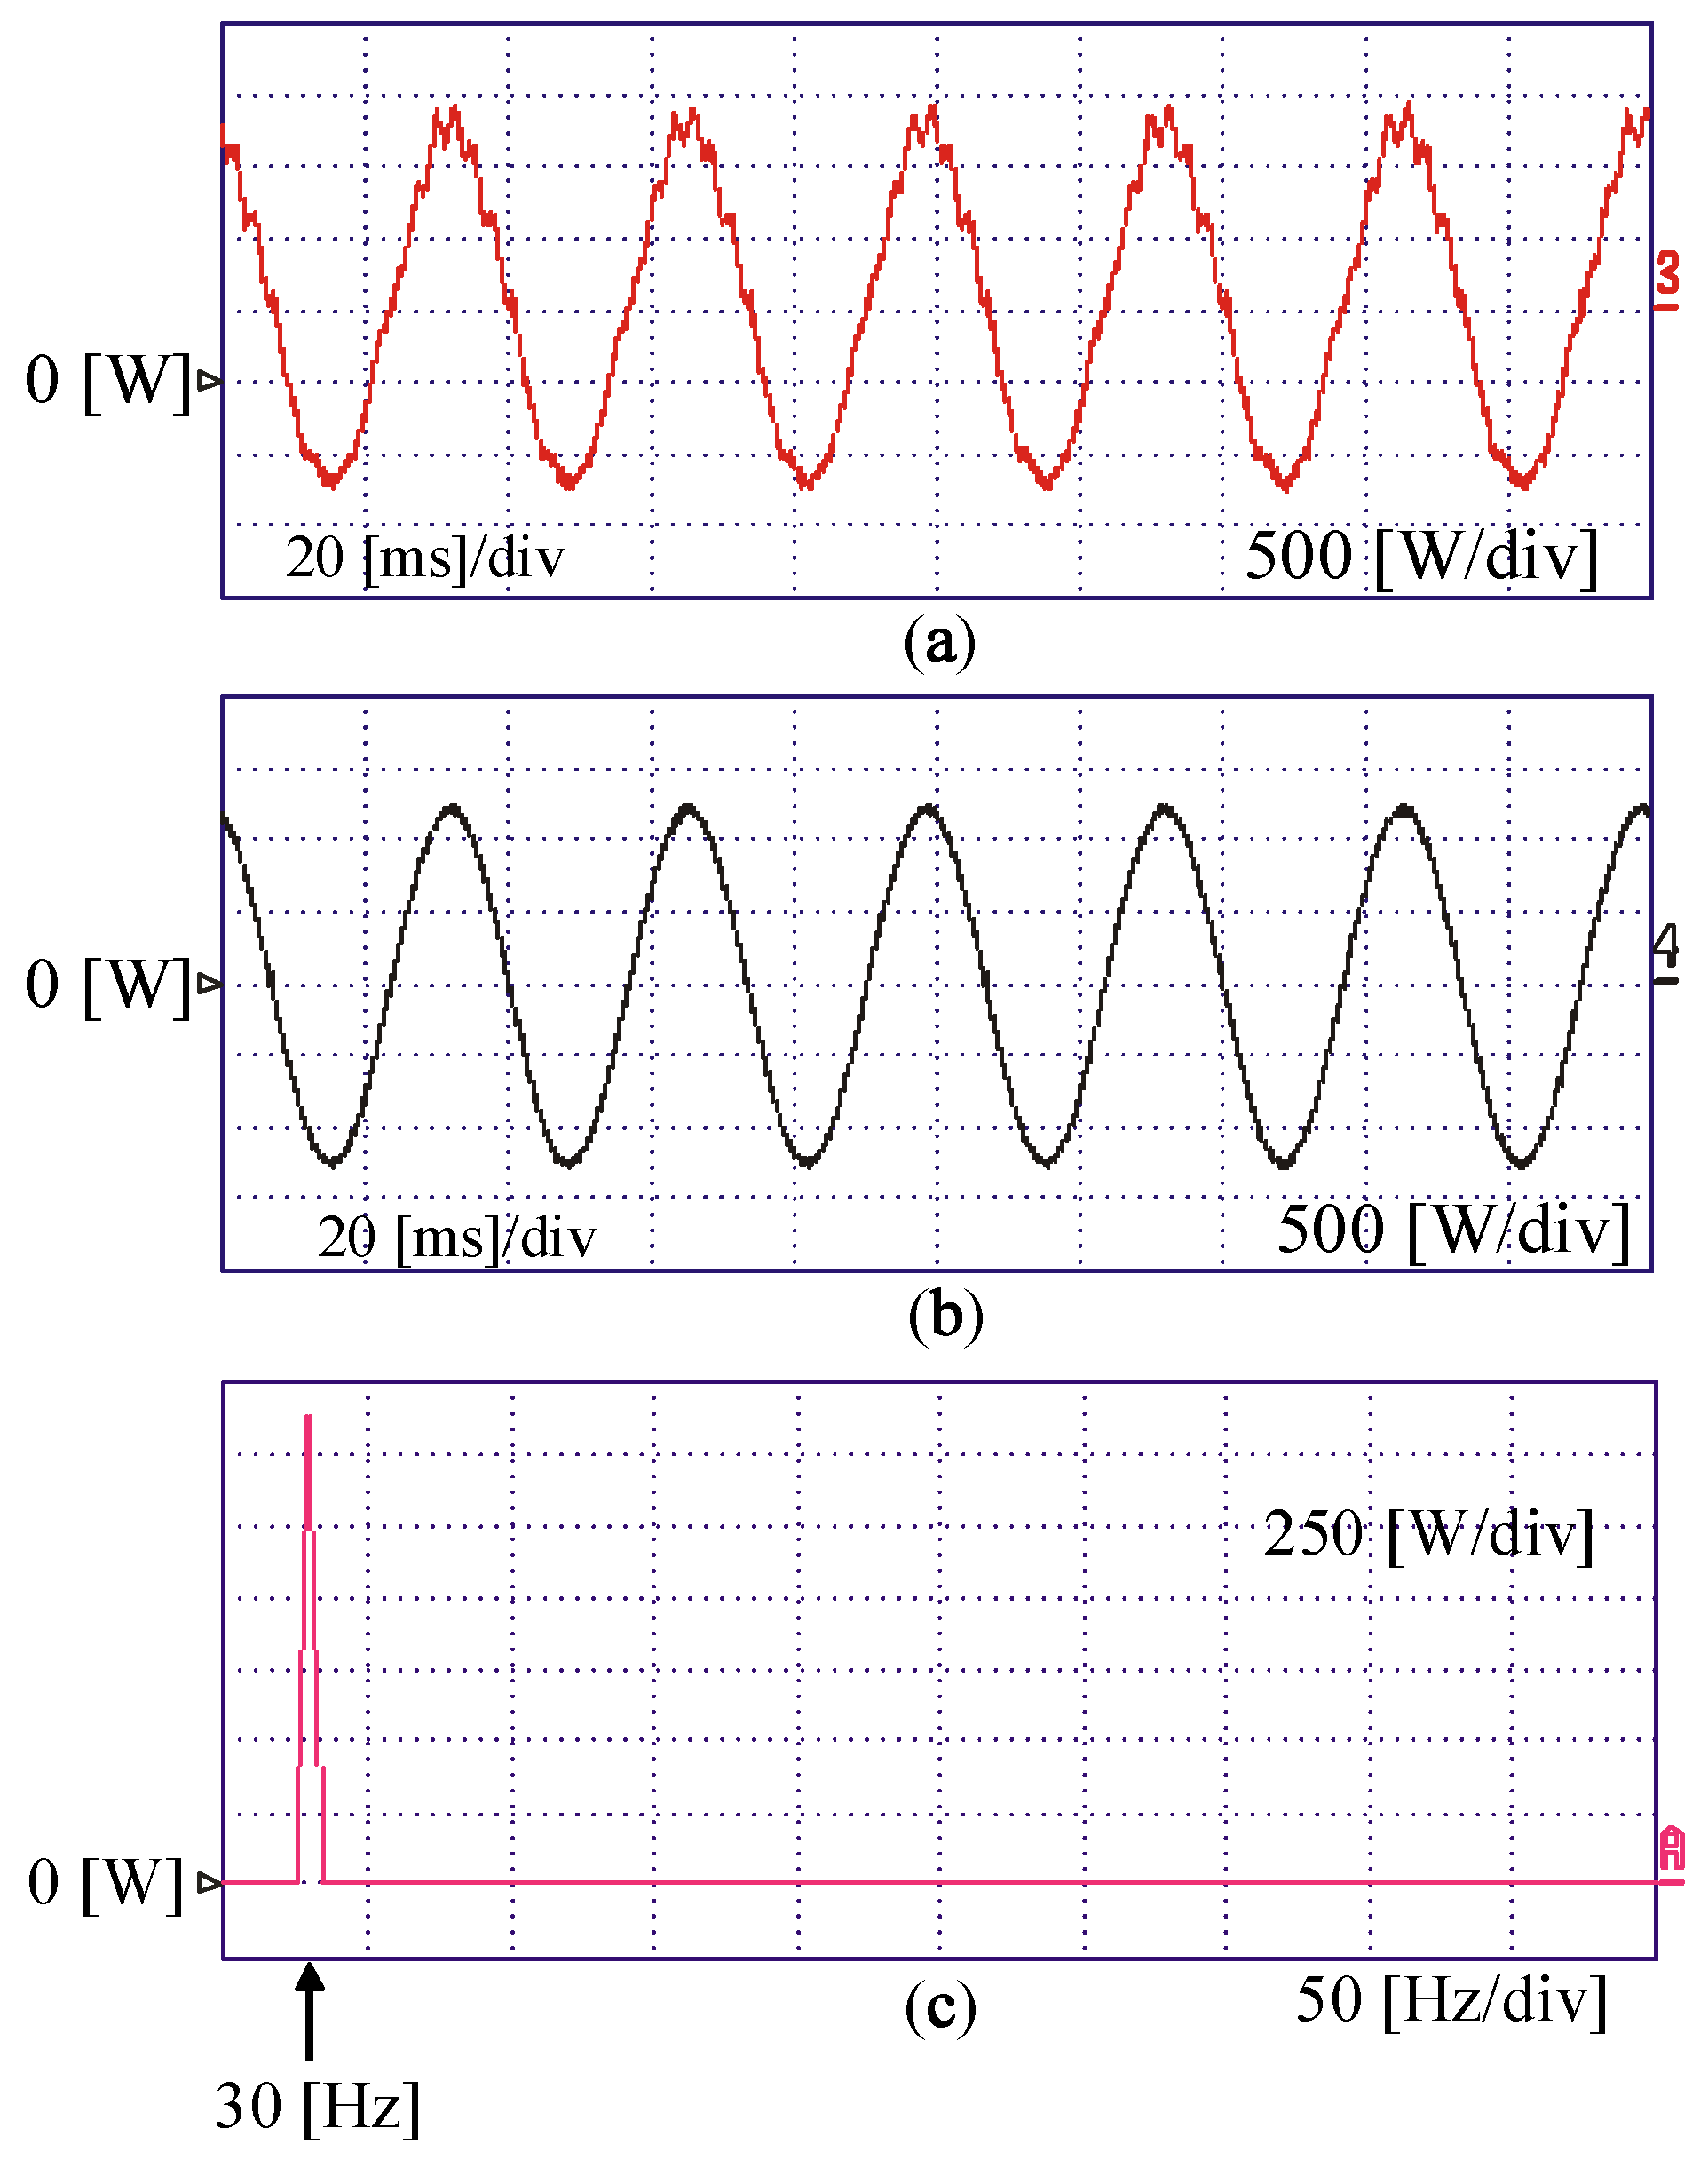
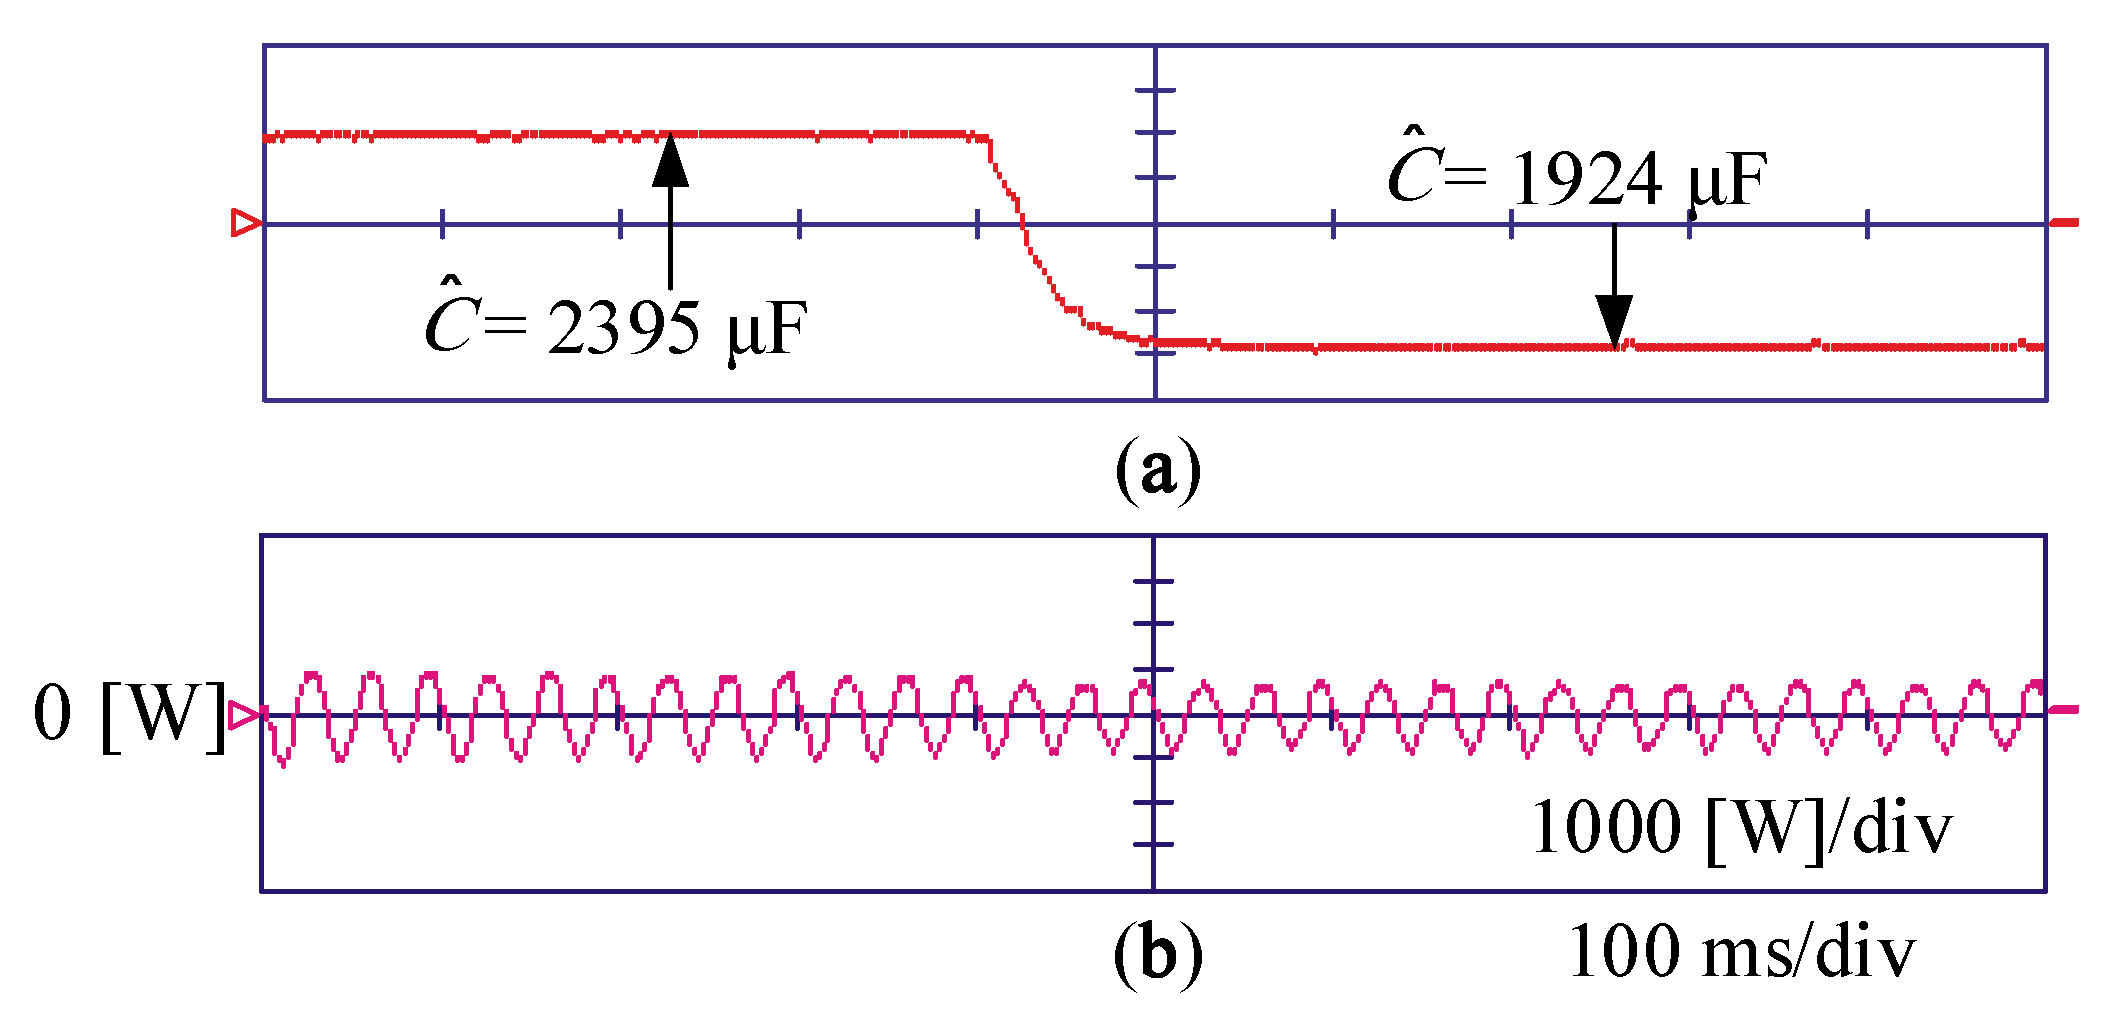
The measured AC power component of the DC-link capacitor and its filtered waveform are shown in Figure 13a,b. The bandpass filter with a cut-off frequency of 30 Hz was used to pass the 30 Hz power component, as shown in Figure 13b. The estimation process in two different capacitances was performed and shown in Figure 14a. For case D, for example, the expected capacitance was 2.395 μF, which had only an error of + 0.042 [%] in comparison and can also be compared with the measured value in Table 1.
This also shows that the expected rate of rapid change in capacity was fast. For further investigation of OPSO-SVR accuracy, a set of random values of capacitance estimation were implemented under five different power levels; Table 2 shows the calculation of the mean, maximum, minimum, and standard deviation. To confirm the superiority of OPSO-SVR over the SVR method, Figure 15 shows that the proposed method was faster than SVR, which made it better for online capacitance estimation.
In addition, it was noticeable that the speed and the accuracy of the SVR algorithm was less than OPSO-SVR, as the latter method tuned the SVR parameters in every step to achieve the correct value faster.
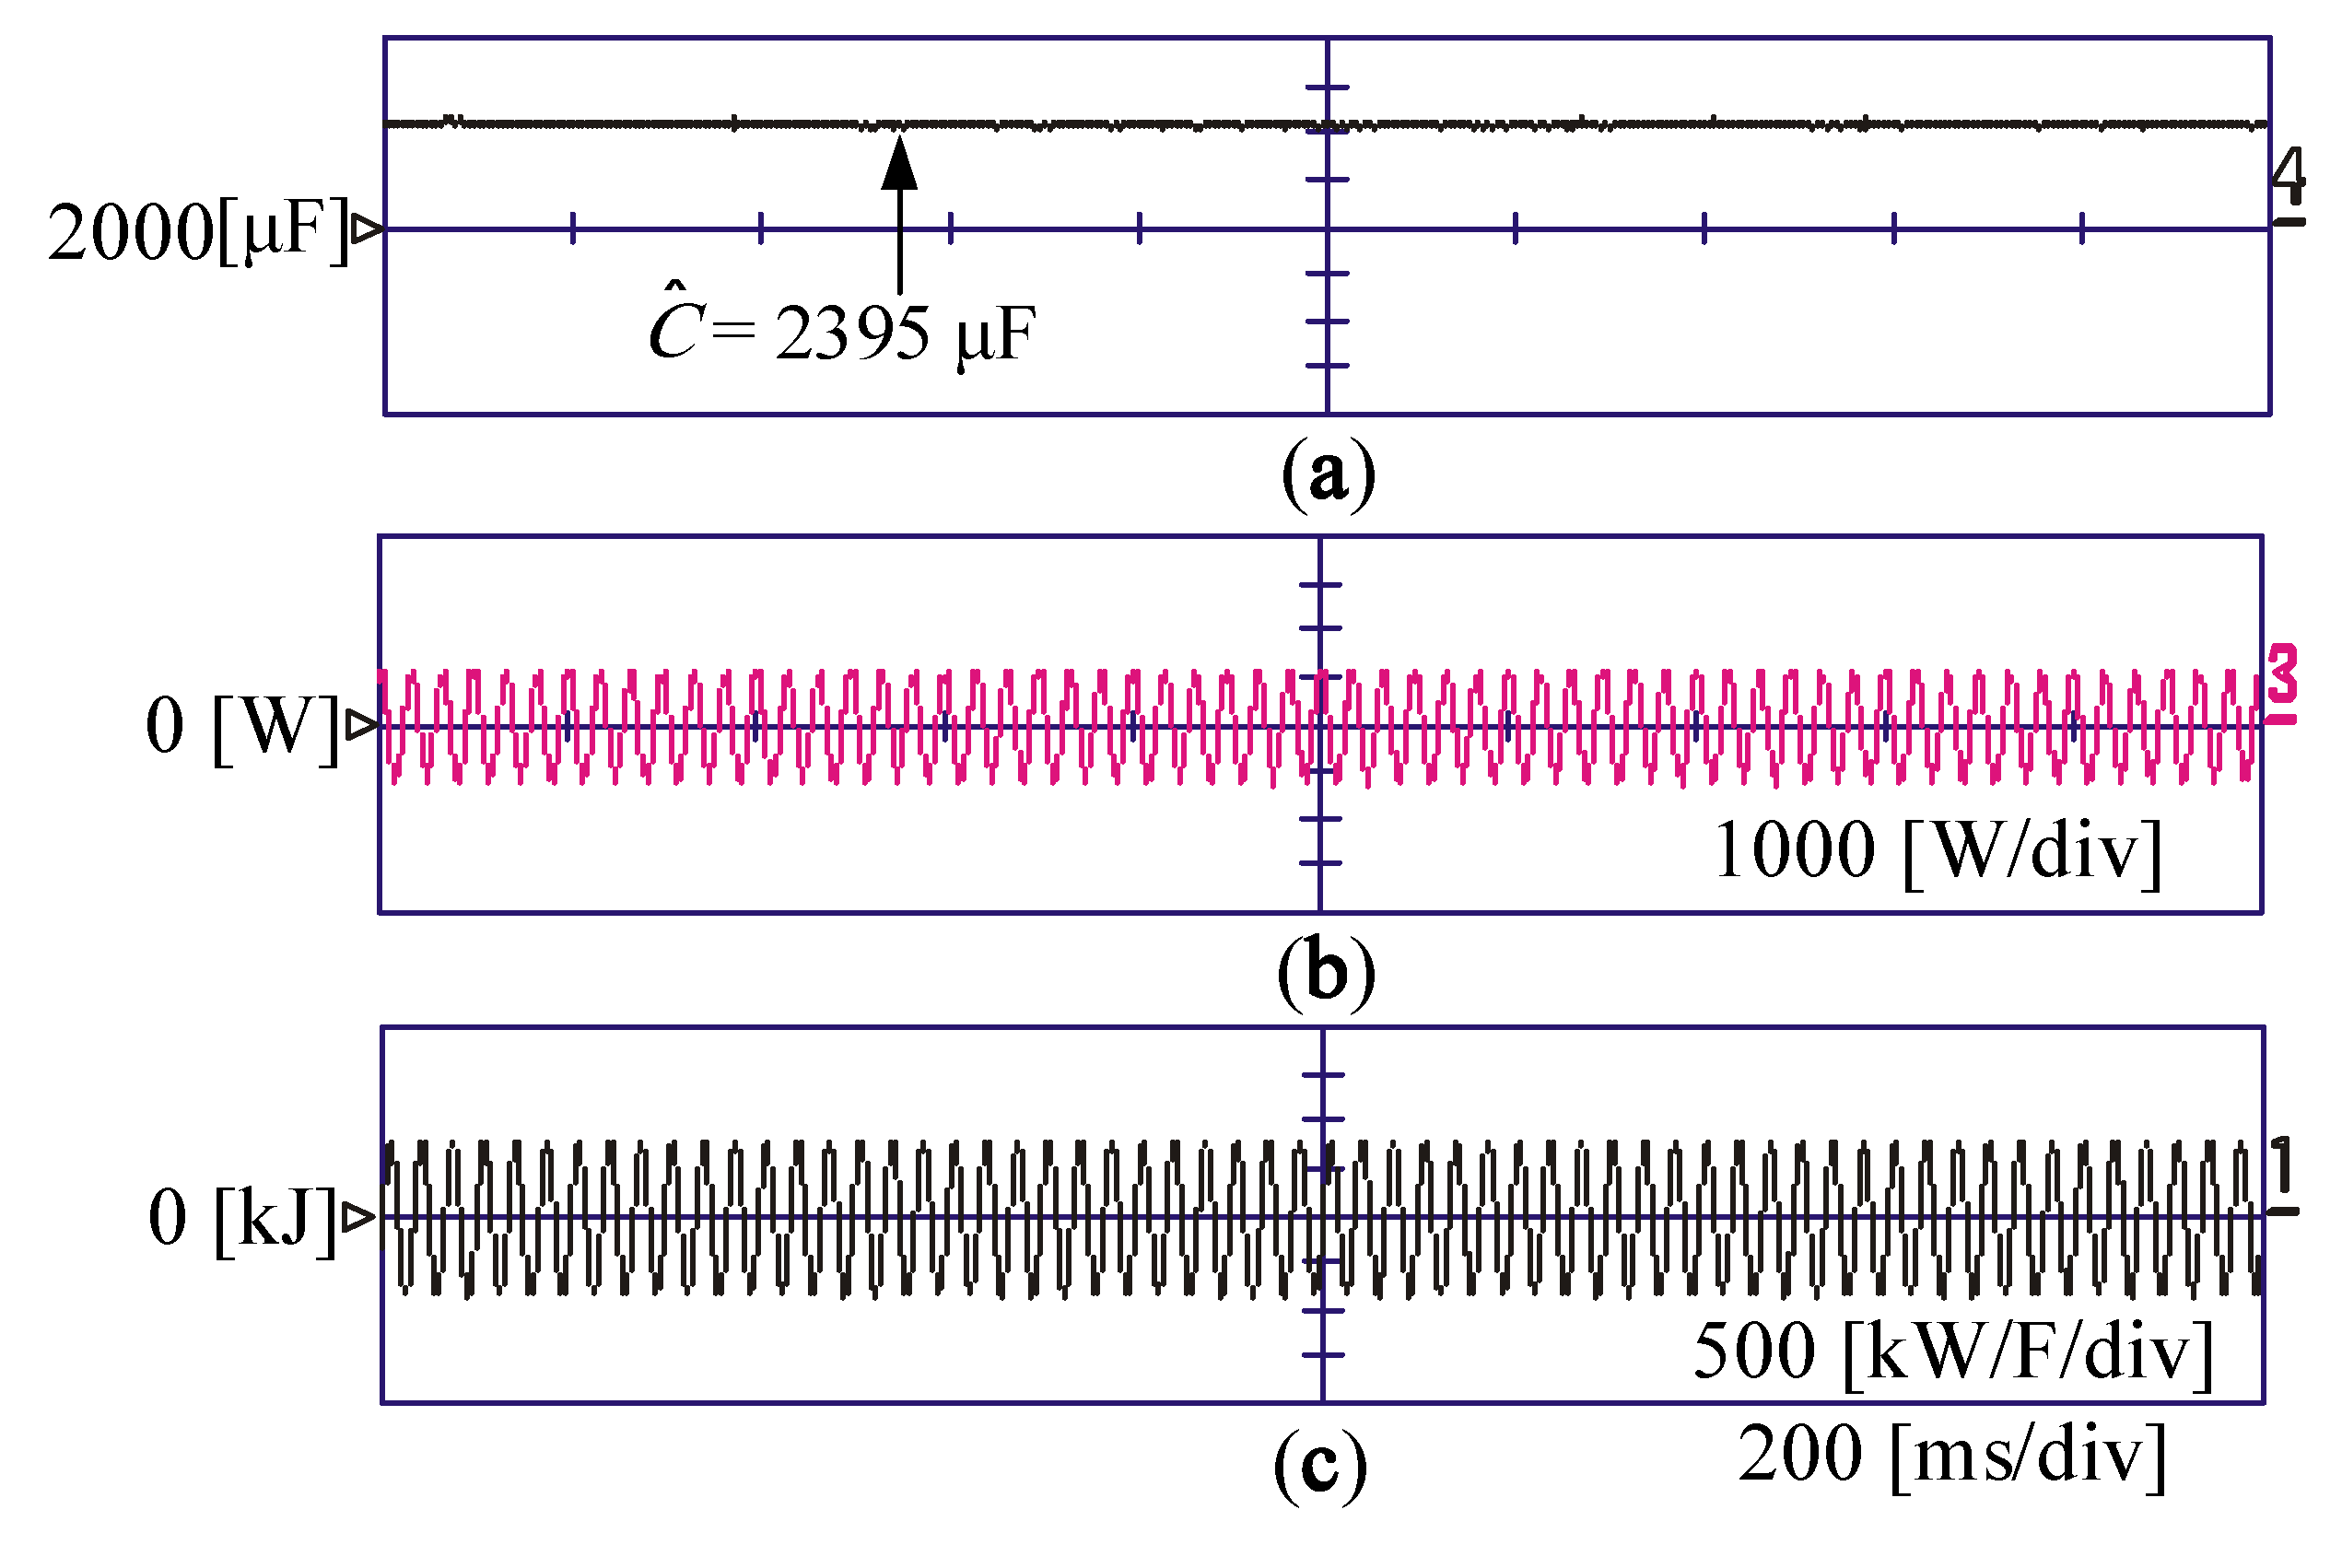
The estimated capacitance, the capacitance power variation, and the derivative of the DC-link voltage in the steady state condition are shown in Figure 16a–c. The estimation error for the SVR algorithm was about 0.35%, while the estimation error was 0.28% in OPSO-SVR for the same conditions.
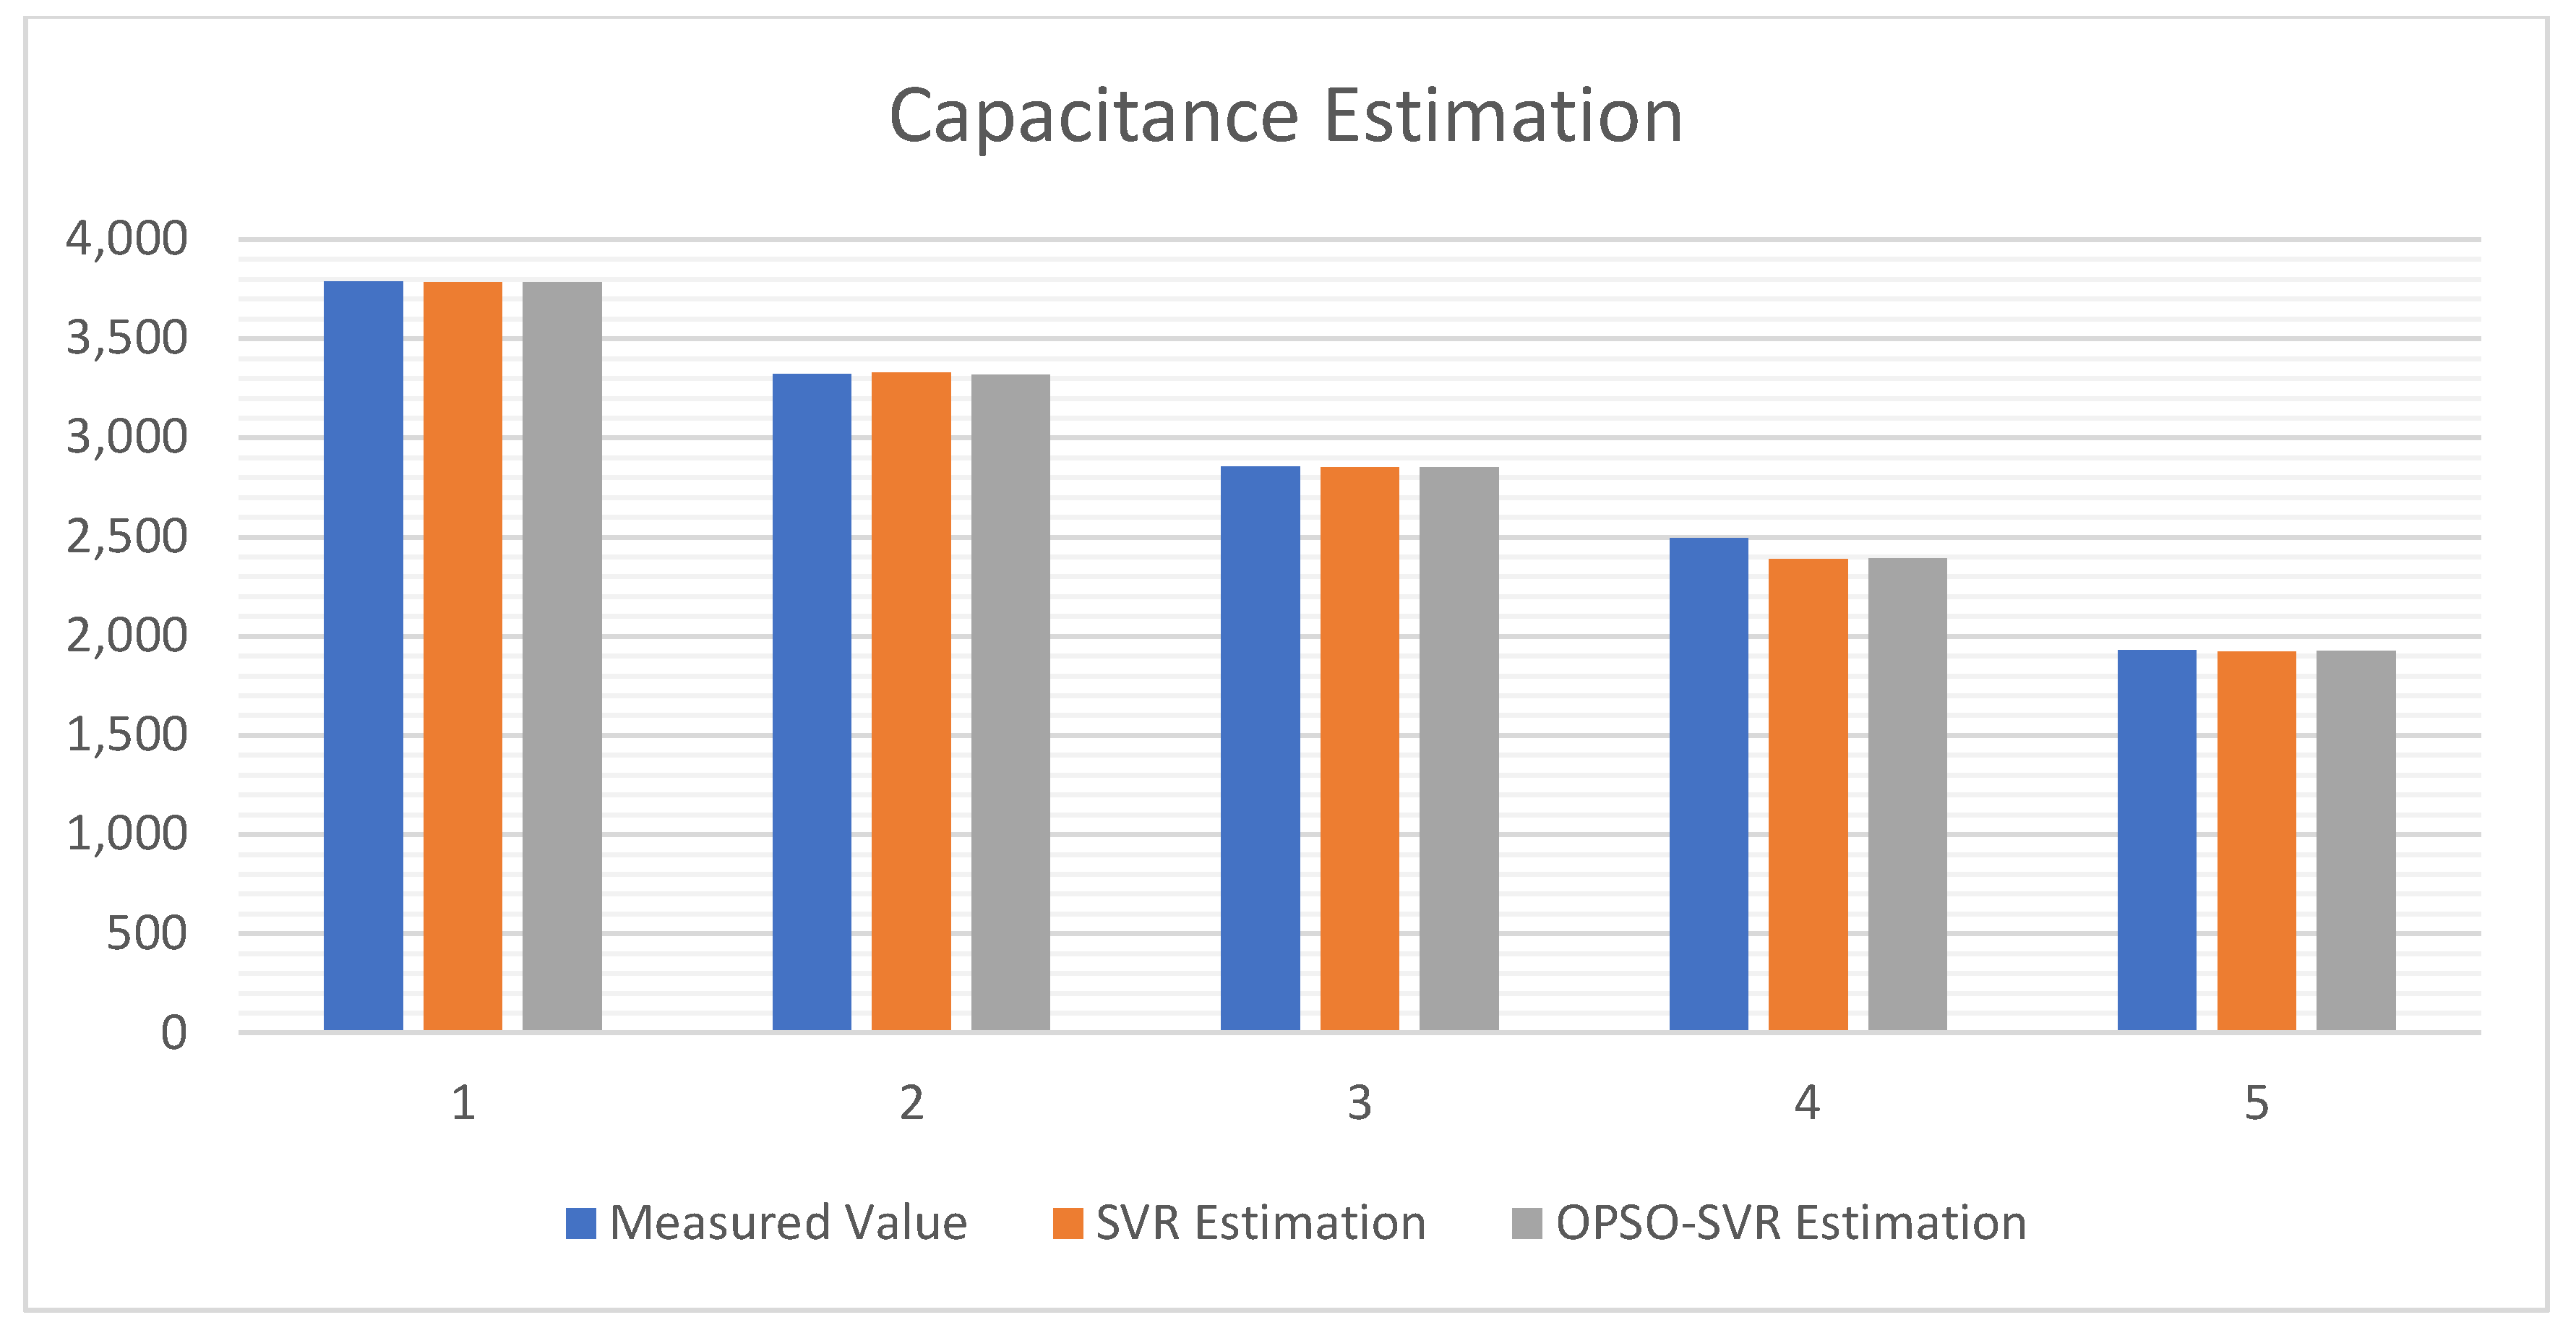
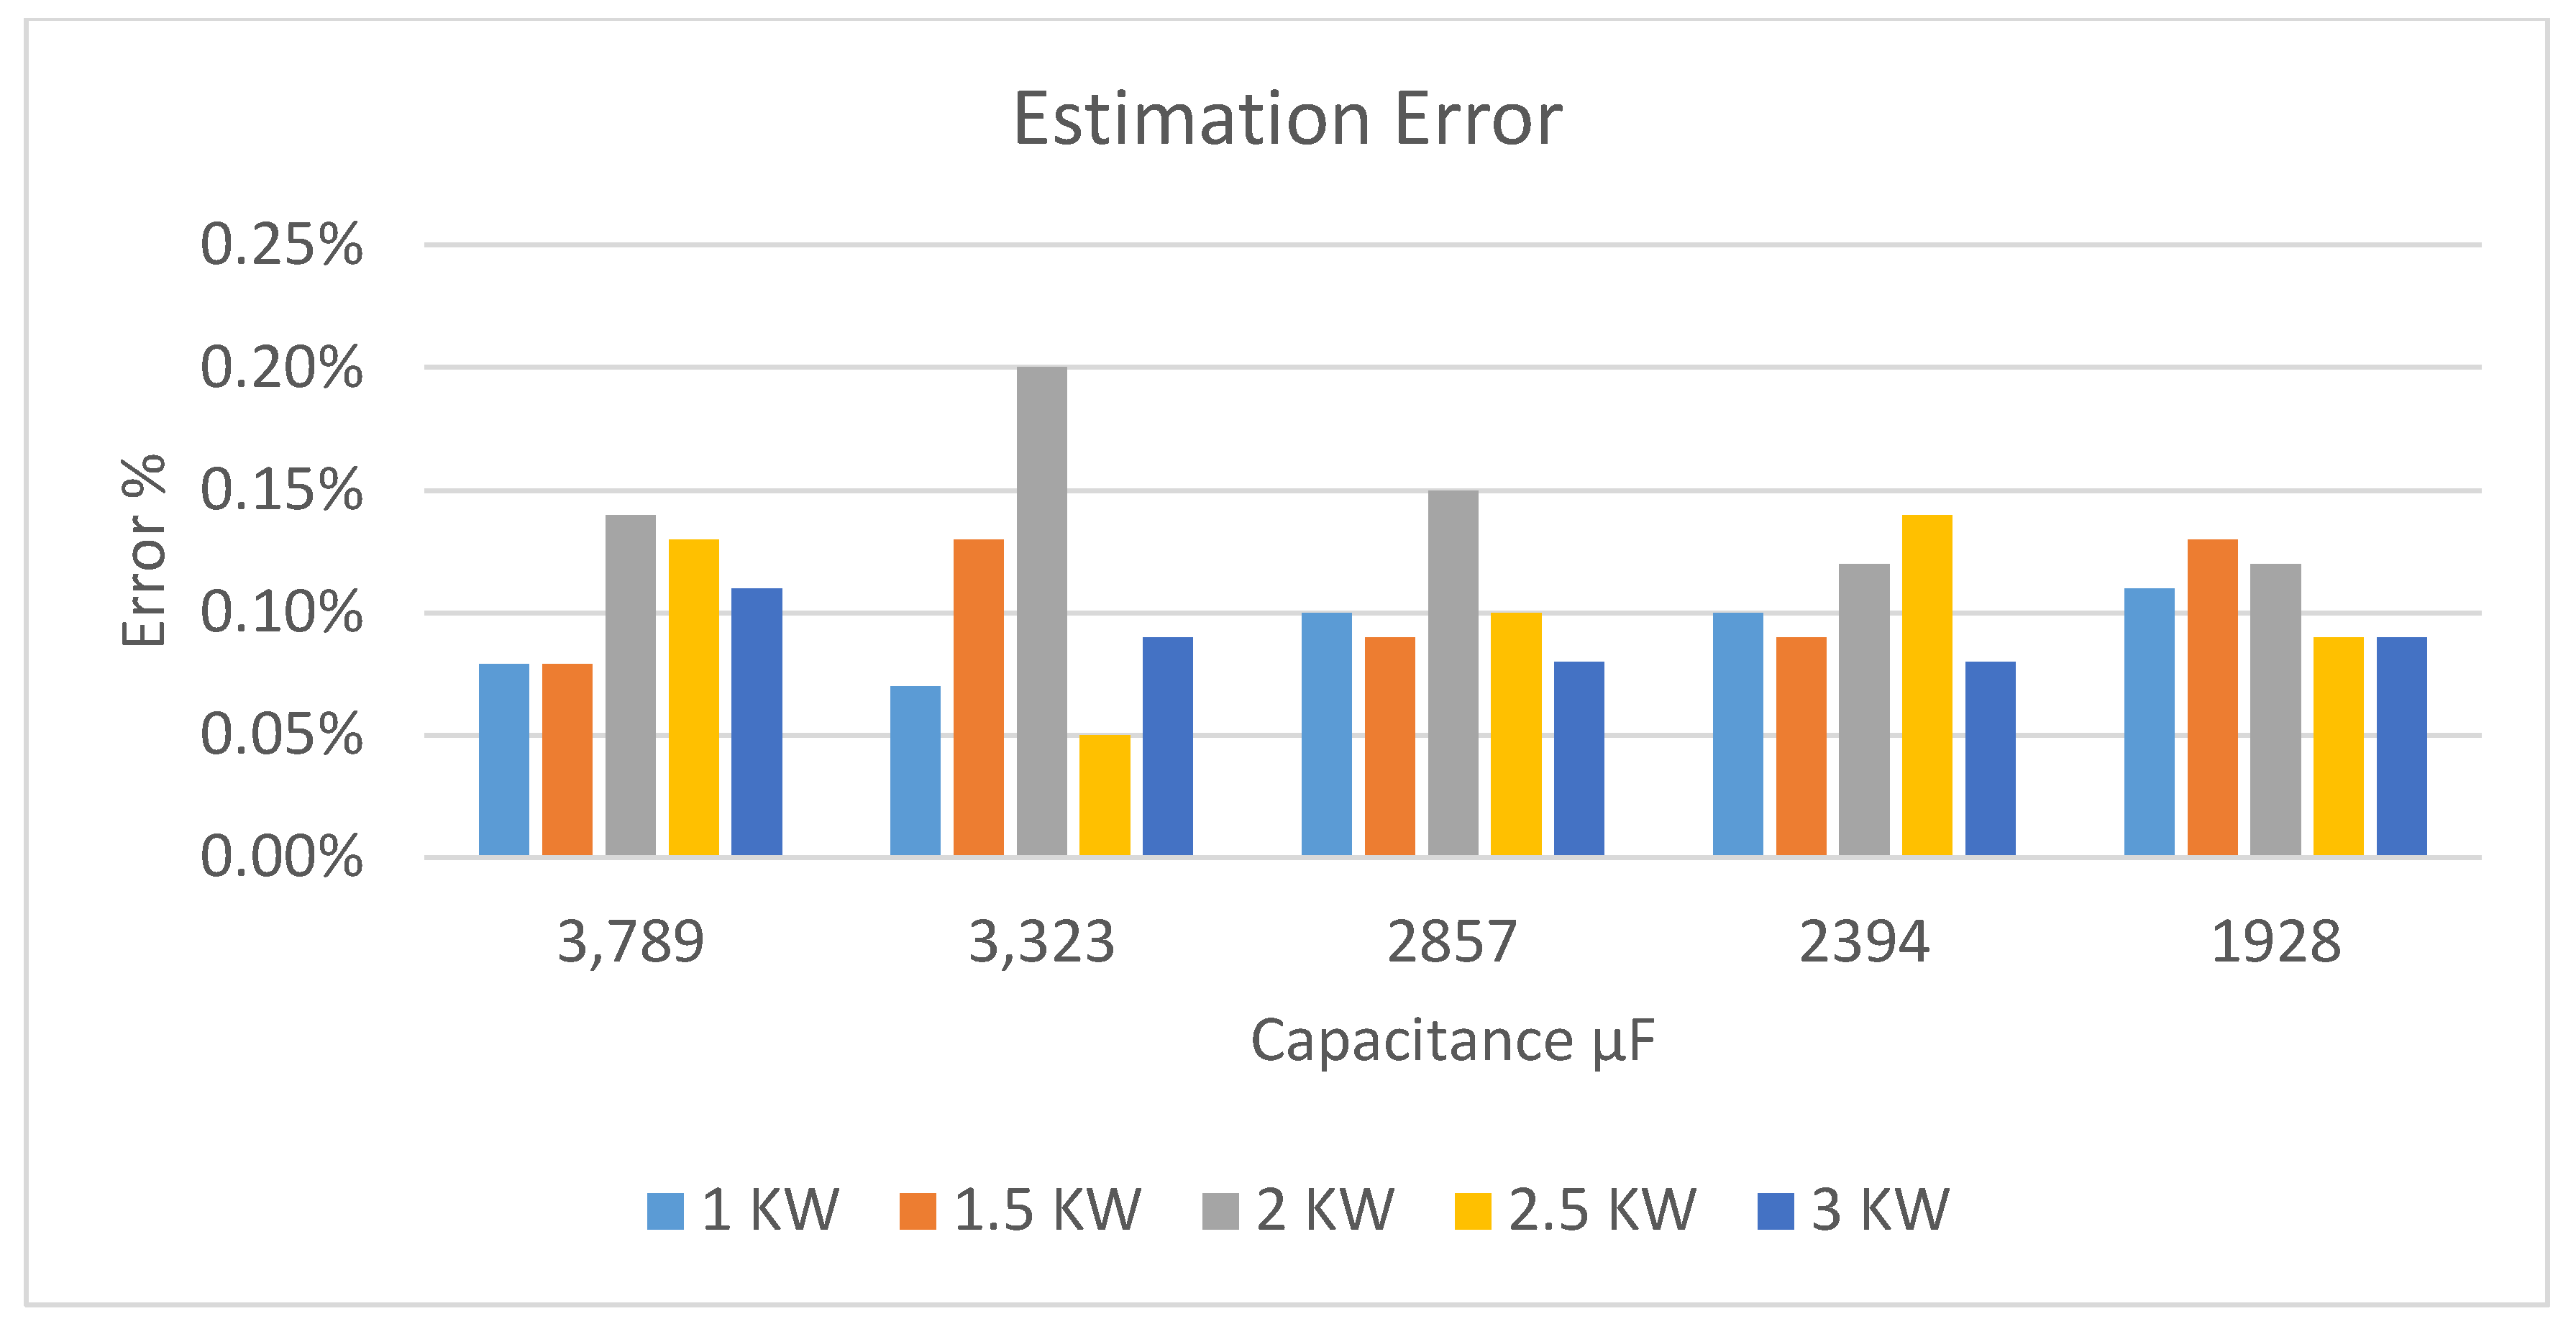
The SVR and OPSO-SVR estimation performance for different capacitance readings is concluded in Figure 17. In Figure 18, the estimation error of Table 2 is drawn to show the percentage error in different load powers. The estimation accuracy for both methods was acceptable and close to the real value.

5. Conclusions

This paper presented an online method to detect the deterioration condition and lifetime for electrolytic capacitors in AC–DC–AC converters. The main advantage of the proposed algorithm is the use of a digital controller to estimate the capacitor lifetime without any additional hardware or sensors, which adds no cost to the power and control circuits. The proposed algorithm is based on injecting a low-frequency voltage component to the DC-link reference voltage and then extracting the fluctuated capacitor power, which determines the deterioration state of the capacitor. This algorithm is based on the OPSO-SVR technique by determining a relationship between the capacitor value and its power. The validity of the algorithm was verified through experiments on various experimental conditions, and the variation of the estimation error was analyzed according to the capacitance measurement environment. The experimental results confirmed that the capacitance estimation was a low estimation error, which was well below 0.2%, making this method effective for detecting the state of an electrolytic capacitor in the PWM converter system. The proposed algorithm can be implemented by software without adding or replacing hardware. Therefore, it can be considered as low cost, and it can be directly applied to commercially-produced converters and existing converters, which are versatile technologies. Moreover, this method has more advantages, as information about the DC-link ripple current is not necessary because it depends on the estimation of the capacitor power and the change in the DC-link voltage.

Author Contributions

Conceptualization, A.G.A.-K. and B.G.Y.; methodology, A.-R.A.-Q.; software, A.G.A.-K.; validation, A.-R.A.-Q., A.M.E. and A.G.A.-K.; formal analysis, A.M.E; investigation, B.G.Y.; resources, A.M.E.; data curation, A.G.A.-K.; writing—original draft preparation, A.G.A.-K.; writing—review and editing, A.M.E.; visualization, A.-R.A.-Q.; supervision, A.G.A.-K.; project administration, A.M.E..; funding acquisition, A.M.E. All authors have read and agreed to the published version of the manuscript.

Funding

Deanship of Scientific Research, Majmaah University: No. R-1441-119.

Acknowledgments

The author would like to thank Deanship of Scientific Research at Majmaah University for supporting this work under Project Number No. R-1441-119.

Conflicts of Interest

The authors declare no conflict of interest.

Nomenclature

Vacthe peak voltage of the injected AC voltage
ωinthe angular frequency
Cthe DC-link capacitance
RleakCapacitor leakage resistance
vdcthe DC- link voltage
pinthe line side converter input power
poutthe load side converter output power
v d e , v q e the line side d-q axis voltages
i d e , i q e the line side d-q axis currents
v d s e , v q s e the load side d-q axis voltages
i d s e , i q s e the load side d-q axis currents
Ethe magnitude of the source voltage
Wthe weight vector
Bthe bias
Φ the nonlinear function
r 1 and r 2 random functions
ε the variance
c 1 and c 2 personal and social learning factors
w the inertia weight

References

  1. Shoyama, M.; Deriha, F.; Ninomiya, T. Steady-state characteristics of resonance switched capacitor converters. Trans. KIPE 2005, 5, 206–212. [Google Scholar]
  2. Nippon Chemicon Co. Judicious Use of Aluminum Electrolytic Capacitors. Available online: http://www.chemi-con.co.jp/e/catalog/pdf/al-e/al-sepa-e/001-guide/al-technote-e-120701.pdf (accessed on 1 January 2013).
  3. Kemet Electronics Co. Electrolytic Capacitors. Available online: http://www.kemet.com/kemet/web/homepage/kechome.nsf/weben/322E1646C60C72B285257713006ADB65/$file/F3304.pdf (accessed on 8 October 2016).
  4. Lee, K.; Kim, M.; Yoon, J.; Lee, S.B.; Yoo, J. Condition Monitoring of DC Link Electrolytic Capacitors in Adjustable Speed Drives. IEEE Trans. Ind. Appl. 2008, 44, 1606–1613. [Google Scholar]
  5. Harada, K.; Katuski, A.; Fujiw, M. Use of ESR for deterioration diagnosis of electrolytic capacitors. IEEE Trans. Power Electron. 1993, 8, 1199–1207. [Google Scholar] [CrossRef]
  6. Aeloiza, E.; Kim, J.H.; Enjeti, P.; Ruminot, P. A real time method to estimate electrolytic capacitor condition in PWM adjustable speed drives and uninterruptible power supplies. In Proceedings of the 2005 IEEE 36th Power Electronics Specialists Conference, Recife, Brazil, 16 June 2005; pp. 2867–2872. [Google Scholar]
  7. Abo-Khalil, A.G.; Lee, D.C. DC-Link Capacitacne Estimation using Support Vector Regression in AC/DC/AC PWM Converters. Korean Inst. Electr. Eng. J. 2007, 56, 81–87. [Google Scholar]
  8. Parler, S.G., Jr. Improved Spice models of aluminum electrolytic capacitors for inverter applications. IEEE Trans. Ind. Appl. 2003, 39, 929–935. [Google Scholar] [CrossRef]
  9. Gasperi, M.L. Life prediction modeling of bus capacitors in AC variable-frequency drives. IEEE Trans. Ind. Appl. 2005, 41, 1430–1435. [Google Scholar] [CrossRef]
  10. Abo-Khalil, A.G.; Lee, D.C. DC-Capacitance Estimation of DC-Link Capacitors using AC Voltage Injection in AC/DC/AC PWM Converters. In Proceedings of the Forty-First IAS Annual Meeting, Tampa, FL, USA, 8–12 October 2006; Volume 4, pp. 2095–2100. [Google Scholar]
  11. Lee, K.-W. Fault Diagnosis of a Electrolytic Capacitor for Inverter DC-Link Voltage Smoothing. Trans. Korean Inst. Power Electron. 2007, 12, 372–377. [Google Scholar]
  12. Ertl, H.; Wiesinger, T.; Kolar, J.W.; Zach, F.C. A simple active method to avoid the balancing losses of DC Link Capacitor. In Proceedings of the 24th International Conference on Power Electronics (PCIM), Nürnberg, Germany, 20–22 May 2003; pp. 459–464. [Google Scholar]
  13. Abo-Khalil, A.G.; Lee, D.C. DC-link capacitance estimation in AC/DC/AC PWM converters using voltage injection. IEEE Trans. Ind. Appl. 2008, 44, 1631–1637. [Google Scholar] [CrossRef]
  14. Abo-Khalil, A.G. Current Injection-Based DC-link Capacitacne Estimation Using Support Vector Regression. IET J. Power Electron. 2012, 5, 53–58. [Google Scholar] [CrossRef] [Green Version]
  15. Amaral, A.; Buatti, G.; Ribeiro, H.; Cardoso, A. Using DFT to obtain the equivalent circuit of aluminum electrolytic capacitors. In Proceeding of 2007 7th International Conference on Power Electronics and Drive Systems, Bangkok, Thailand, 27–30 November 2007; pp. 434–438. [Google Scholar]
  16. Amaral, A.; Cardoso, A. Using Newton-Raphson method to estimate the condition of aluminum electrolytic capacitors. In Proceeding of the 2007 IEEE International Symposium on Industrial Electronics, Vigo, Spain, 4–7 June 2007; pp. 827–832. [Google Scholar]
  17. Amaral, A.; Cardoso, A. Simple experimental techniques to characterize capacitors in a wide range of frequencies and temperatures. IEEE Trans. Instrum. Meas. 2010, 59, 1258–1267. [Google Scholar] [CrossRef]
  18. Amaral, A.; Cardoso, A. An experimental technique for estimating the ESR and reactance intrinsic values of aluminum electrolytic capacitors. In Proceedings of the 2006 IEEE Instrumentation and Measurement Technology Conference, Sorrento, Italy, 24–27 April 2006; pp. 1820–1825. [Google Scholar]
  19. Imam, A.; Divan, D.; Harley, R.; Habetler, T. Real-time condition monitoring of the electrolytic capacitors for power electronics applications. In Proceedings of the 22nd Annual IEEE Applied Power Electronics Conference and Exposition, Anaheim, CA, USA, 25 February–1 March 2007; pp. 1057–1061. [Google Scholar]
  20. Venet, P.; Perisse, F.; El-Husseini, M.; Rojat, G. Realization of a smart electrolytic capacitor circuit. IEEE Ind. Appl. Mag. 2002, 8, 16–20. [Google Scholar] [CrossRef]
  21. Soliman, H.; Wang, H.; Gadalla, B.; Blaabjerg, F. Condition monitoring for DC-link capacitors based on artificial neural network algorithm. In Proceedings of the IEEE 5th International Conference on Power Engineering, Energy and Electrical Drives (POWERENG), Riga, Latvia, 11–13 May 2015. [Google Scholar]
  22. Abo-Khalil, A.G.; Alyami, S.; Alhejji, A.; Awan, A.B. Real-Time Reliability Monitoring of DC-Link Capacitors in Back-to-Back Converters. Energies 2019, 12, 2396. [Google Scholar] [CrossRef] [Green Version]
  23. Park, J.; Sandberg, I.W. Universal approximation using radial basis-function networks. Neural Comput. 1991, 3, 246–257. [Google Scholar] [CrossRef] [PubMed]
  24. Qiao, W.; Harley, R.G. Optimization of radial basis function widths using particle swarm optimization. In Proceedings of the 2006 IEEE Swarm Intelligence Symposium, Indianapolis, Indiana, 12–14 May 2006; pp. 55–60. [Google Scholar]
  25. Bazzani, A.; Bevilacqua, A.; Bollini, D.; Brancaccio, R.; Campanini, R.; Lanconelli, N.; Riccardi, A.; Romani, D. An SVM classifier to separate false signals from icrocalcifications in digital mammograms. Phys. Med. Biol. 2001, 46, 1651–1663. [Google Scholar] [CrossRef] [PubMed] [Green Version]
  26. Nuller, K.R.; Smola, A.; Ratrch, G.; Scholkopf, B.; Kohlmargen, J.; Vapnik, V. Predicting time series with support vector machine. In Proceedings of the 1997 International Conference on Artificial Neural Networks, Lausanne, Switzerland, 8–10 October 1997; Springer: Berlin/Heidelberg, Germany, 1997; pp. 999–1004. [Google Scholar]
  27. Rastgoufard, S.; Charalampidis, D. Tuned support vector regression by modified particle swarm optimization for online power system static security evaluation. In Proceedings of the 2018 IEEE Texas Power and Energy Conference (TPEC), College Station, TX, USA, 8–9 February 2018; pp. 1–6. [Google Scholar]
  28. Schölkopf, B.; Burges, C.J.C.; Smola, A.J. Using support vector support machines for time series prediction. In Advances in Kernel Methods; MIT Press: Cambridge, MA, USA, 1999; pp. 242–253. [Google Scholar]
  29. Cherkassky, V.; Miller, F. Learning from Data Concepts, Theory and Methods; Wiley: New York, NY, USA, 1998. [Google Scholar]
  30. Yu, B.; Abo-Khalil, A.G.; So, J.; Yu, G. Support Vector Regression Based Maximum Power Point Tracking for PV Grid-Connected System. In Proceedings of the 2009 34th IEEE Photovoltaic Specialists Conference (PVSC), Philadelphia, PA, USA, 7–12 June 2009. [Google Scholar]
  31. Abo-Khalil, A.G.; Alyami, S.; Sayed, K.; Alhejji, A. Dynamic Modeling of Wind Turbines Based on Estimated Wind Speed under Turbulent Conditions. Energies 2019, 12, 1907. [Google Scholar] [CrossRef] [Green Version]
  32. Eltamaly, A.M.; Al-Saud, M.S.; Abokhalil, A.G.; Farh, H.M. Photovoltaic maximum power point tracking under dynamic partial shading changes by novel adaptive particle swarm optimization strategy. Trans. Inst. Meas. Control 2020, 42, 104–115. [Google Scholar] [CrossRef]
  33. Lee, K.; El-Sharkawi, M. Modern Heuristic Optimization Techniques; Wiley: Hoboken, NJ, USA, 2008. [Google Scholar]
  34. Rastgoufard, S.; Charalampidis, D. Parameter selection of multi-class SVM with evolutionary optimization methods for static security evaluation in power systems. In Proceedings of the 2016 IEEE Electrical Power and Energy Conference (EPEC), Ottawa, ON, Canada, 12–14 October 2016. [Google Scholar]
  35. Lin, S.W.; Ying, K.C.; Chen, S.C.; Lee, Z.J. Particle swarm optimization for parameter determination and feature selection of support vector machines. Expert Syst. Appl. 2008, 35, 817–1824. [Google Scholar] [CrossRef]
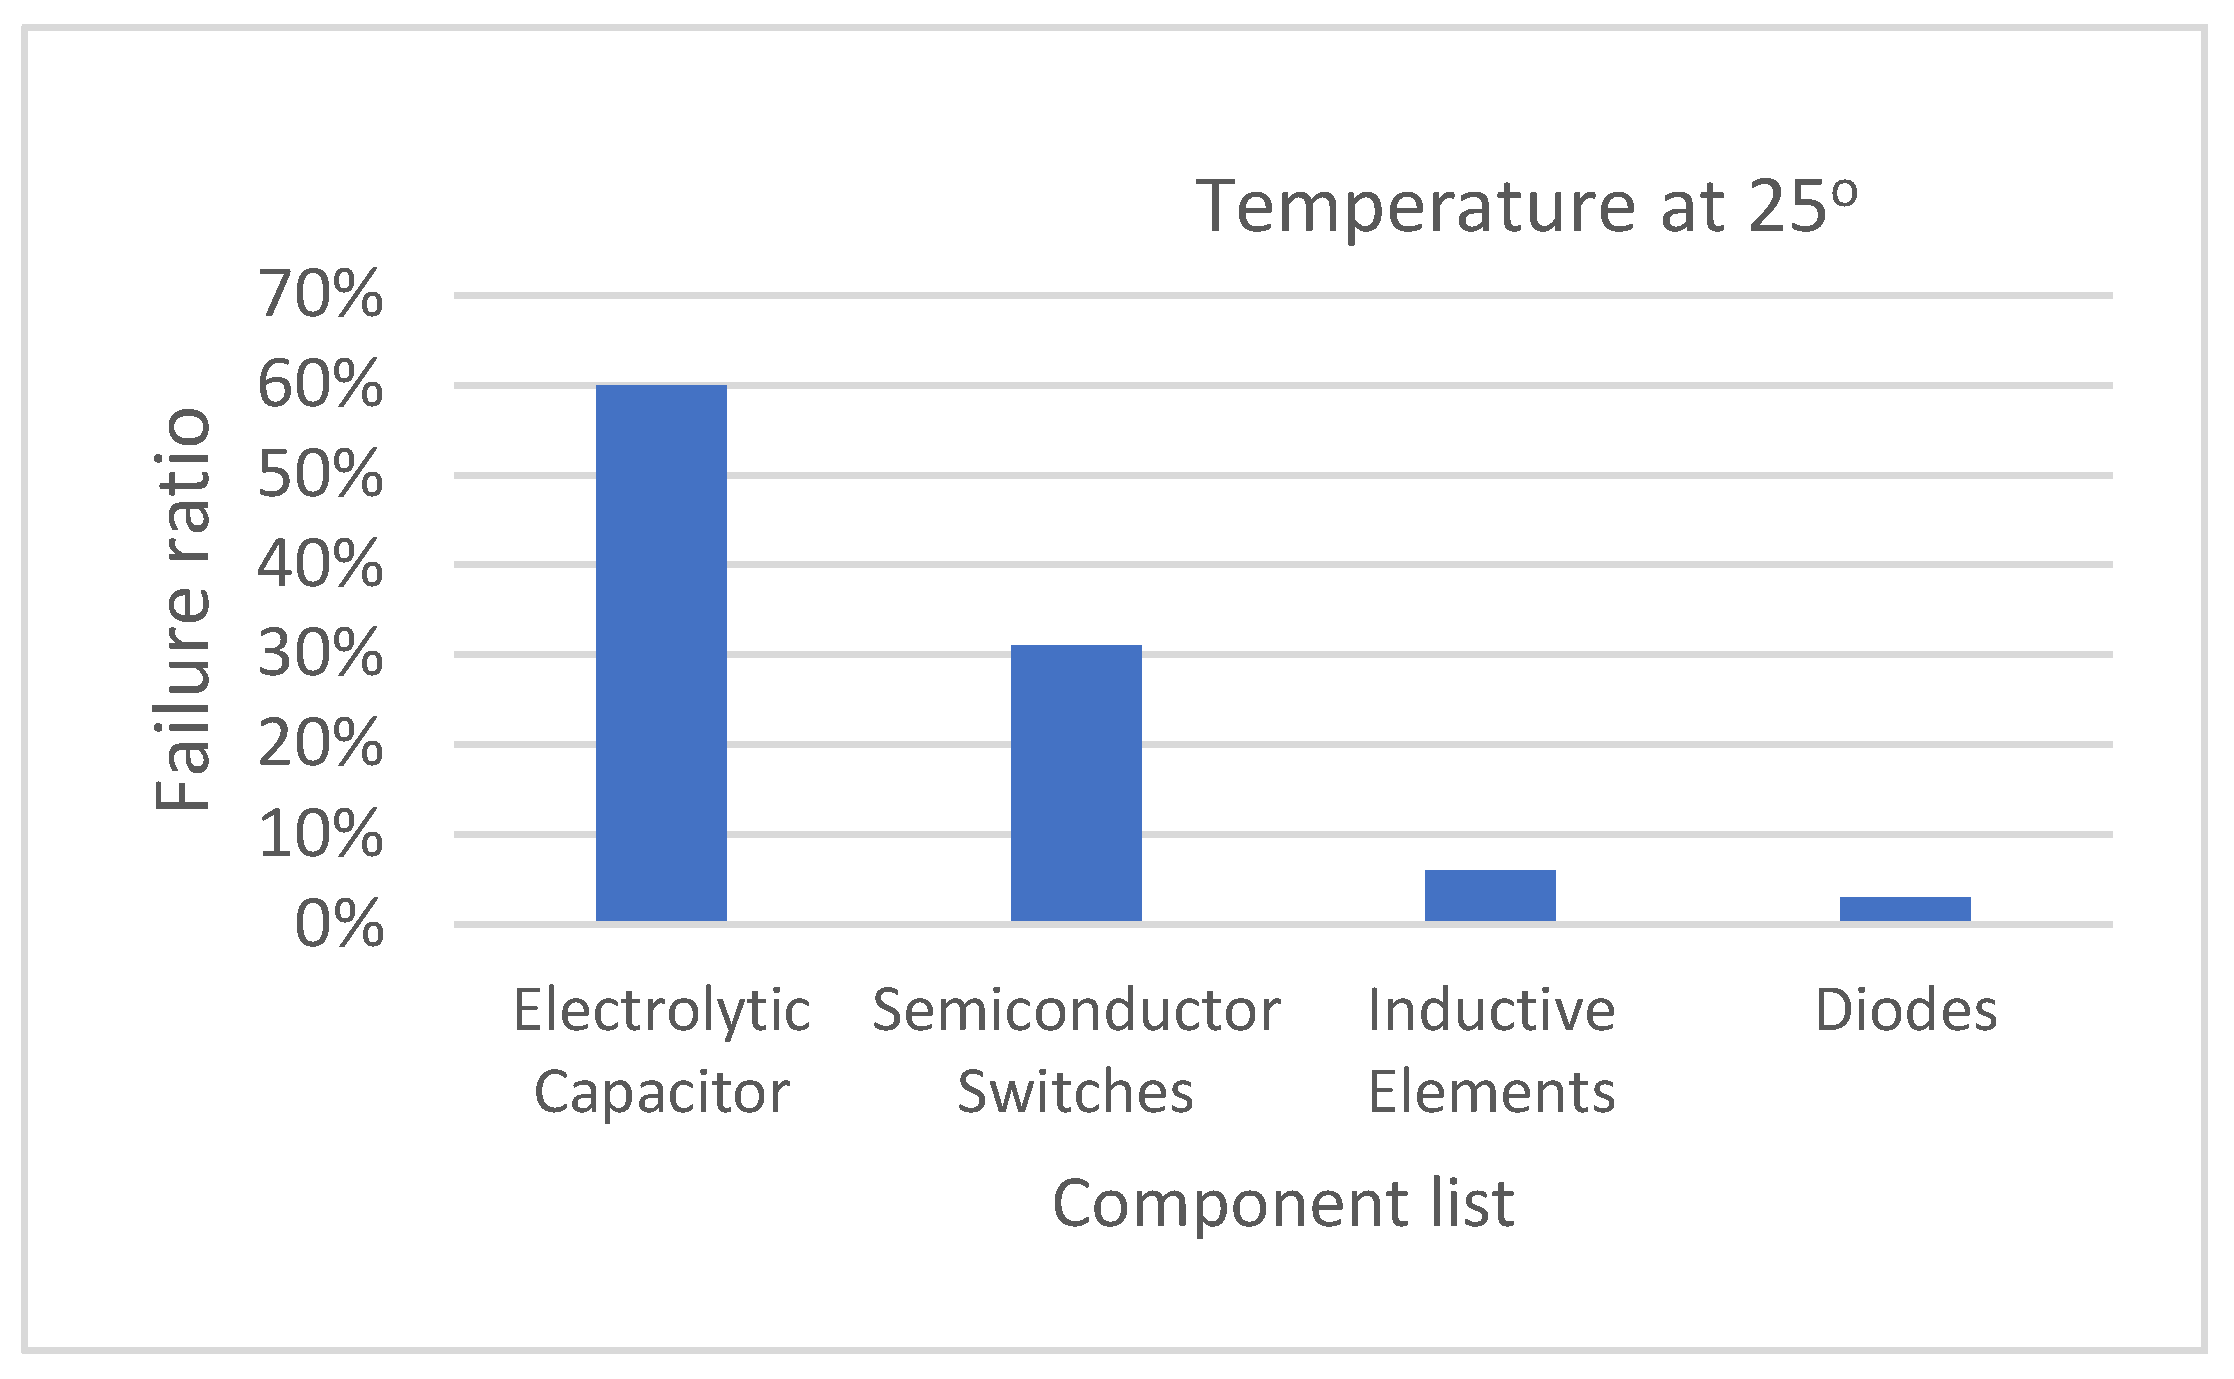
Figure 1. Distribution of failure of power components [1].
Sustainability 12 03719 g001
Figure 2. Capacitor characteristics under high temperature [4].
Sustainability 12 03719 g002
Figure 3. The configuration of aluminum electrolytic capacitor.
Sustainability 12 03719 g003
Figure 4. Electrolytic capacitor equivalent circuit.
Sustainability 12 03719 g004
Figure 5. Control block diagram of DC/AC PWM converter.
Sustainability 12 03719 g005
Figure 6. Opposition-based learning process (OPSO).
Sustainability 12 03719 g006
Figure 7. The structure of capacitance estimation process.
Sustainability 12 03719 g007
Figure 8. Regression model of the trained data.
Sustainability 12 03719 g008
Figure 9. Capacitance estimation process using opposition-based learning particle swarm optimization-based Support Vector Regression (OPSO-SVR).
Sustainability 12 03719 g009
Figure 10. System configuration.
Sustainability 12 03719 g010
Figure 11. Reference and real DC-link voltage with the 30 Hz component.
Sustainability 12 03719 g011
Figure 12. Real and reference currents (a) q-axis current control, (b) d-axis current control.
Sustainability 12 03719 g012
Figure 13. Measured DC-link power (a) unfiltered p i n p o u t ;(b) B P F [ P i n P o u t ] ; (c) harmonic spectrum of B P F [ P i n P o u t ] .
Sustainability 12 03719 g013
Figure 14. Estimation performance of the proposed method: (a) estimated capacitance, (b) B P F [    | P i n P o u t |   ] .
Sustainability 12 03719 g014
Figure 15. Capacitance estimation using SVR and OPSO-SVR.
Sustainability 12 03719 g015
Figure 16. Capacitance estimation in steady state: (a) estimated capacitance, (b) B P F [ | P i n P o u t | ] , (c) B P F [ 0.5 d v d c 2 / d t ] .
Sustainability 12 03719 g016
Figure 17. Measured and estimated capacitance using SVR and OPSO-SVR.
Sustainability 12 03719 g017
Figure 18. Estimation error of OPSO-SVR.
Sustainability 12 03719 g018
Table 1. Training Data.
Measured Value
[ μ F ]
SVR Estimated Value
[ μ F ]
OPSO-SVR Estimated Value
[ μ F ]
A378937863787
B332333203320
C285728552856
D239423932395
E192819221924
Table 2. Capacitance monitoring error.
Measured Capacitance
[ μ F ]
Power = 1 kWPower = 1.5 kWPower = 2 kWPower = 2.5 kWPower = 3 kWMeanMaxMinSTD
ErrorErrorErrorErrorError
37890.08%0.09%0.14%0.125%0.11%0.0009171860.14%0.09%0.00037
33230.07%0.13%0.2%0.05%0.09%0.0016094770.13%0.03%0.0045
28570.1%0.09%0.15%0.1%0.08%0.0009602280.15%0.08%0.0004
23940.1%0.085%0.115%0.14%0.075%0.0010538740.14%0.075%0.00023
19280.112%0.13%0.12%0.09%0.085%0.0027594590.13%0.085%0.0195