Case Report

Quantitative Determination of Some Parameters in the Tennant Method and Its Application to Sustainability: A Case Study of the Yarkand River, Xinjiang, China

1
State Key Laboratory of Desert and Oasis Ecology, Xinjiang Institute of Ecology and Geography, Chinese Academy of Sciences, Urumqi 830011, China
2
Geography Department, University of Chinese Academy of Sciences, Beijing 100049, China
*
Authors to whom correspondence should be addressed.
Sustainability 2020, 12(9), 3699; https://doi.org/10.3390/su12093699
Submission received: 27 February 2020 / Revised: 25 April 2020 / Accepted: 25 April 2020 / Published: 3 May 2020

Abstract

:
Analysis of basic eco-environmental water requirements (BEEWRs) along inland rivers characterized by extreme aridity can provide a theoretical basis for sustaining riverine ecosystems stressed by increasingly dry conditions and human activity. In the past, analyzing the ecological base flow as determined by the Tennant method was the predominant method used to calculate the BEEWR of a river. However, some parameter values within this method are determined subjectively, increasing uncertainty in the estimated values. In this paper, quantitative methods for these subjectively determined parameters are proposed and used to analyze the BEEWR of the Yarkand River, Xinjiang, China. The results demonstrate that: (1) the flood and non-flood seasons of a river can be delineated by analyzing the increase rate of monthly runoff as compared to the monthly runoff of the previous month; (2) the ecological base flow standard in the Tennant method can be more quantitatively determined by comparing the BEEWR for each ecological base flow standard to the annual average river loss, where the BEEWR must exceed the annual average river loss; and (3) BEEWRs of other up- and downstream river reaches can be obtained using the formula “BEEWR in the next downstream section equals the BEEWR in the last section minus the river loss between these two sections”.

1. Introduction

The UN sustainability goals [1] emphasize the need to ensure that all people have access to fresh water and that water needs to be obtained through better management of freshwater ecosystems. Improved sustainability, therefore, requires an assessment of the amount of water that can be used for industrial, agricultural, and domestic purposes while ensuring that enough water remains in the river to sustain riverine ecosystems.
Ecological and environmental water requirements (EEWRs) describe the flows necessary to ensure the basic functional health of ecosystems [2]. Specifically, the EEWR can be regarded as the total amount of water resources required to prevent deterioration of the ecological environment. This includes the amount of water needed for the protection and restoration of natural vegetation, the water needed to maintain the ecological integrity of downstream reaches of inland rivers, the water needed for the growth of forest grass vegetation beyond the scope of water conservation, the water needed for the maintenance of sediment transport along the river, and the water needed to maintain adequate groundwater recharge [3,4]. The concept of EEWR is suitable for system analyses of arid, semi-arid, and seasonally arid to semi-humid areas in which temporal variations between water supply and demand are prominent and the ecological environment is relatively fragile. This paper considers water required for riverine ecosystems (i.e., the eco-environment along a river). The water demand for the river course is divided into two kinds of EEWRs: basic and targeted. Basic EEWR (BEEWR) refers to the minimum amount of water that needs to be retained in the river to maintain the eco-environmental function of the river as a whole [5]. Targeted EEWR (TEEWR) refers to the amount of water that needs to be retained in the river to ensure the normal performance of eco-environmental functions that correspond to specific eco-environmental protection goals.
The BEEWR is essential to the integrity and biodiversity of riverine ecosystems [6,7]. However, dams, reservoirs, and water transfer projects constructed to meet ever-increasing domestic water requirements [5,8,9] have significantly impacted ecological base flows in rivers [10]. Conflicts between human water use and ecosystem function are inevitable and become more pronounced as riverine ecosystems are degraded [11,12]. Therefore, from a management perspective, it is important that a portion of the natural flow required to maintain the ecosystem (or BEEWR) is kept in the river.
The Tennant method has been used on a global basis by scholars to study environmental flows [13,14,15,16] and ecological base flows [17,18,19]. While methods using hydrological and hydraulic approaches [15,16] have been used to calculate eco-environmental flows, Karakoyun et al. [15] found that the “good classification” inherent in the Tennant method was better than the Tessman method in assessing environment flows. Similarly, Ksiązek et al. [16] found that hydraulic methods that consider aquatic organisms and watercourse type provide lower values of environmental flows than other hydrological methods.
Li and Kang [20] modified the Tennant method for practical use by applying it to the Hanjiang River, the Meijiang River, and the Panlong River. Their modifications included the following: (1) defining optimum and minimum environment flows and (2) readjusting the classification number from minimum to optimum using the concept of arithmetic progression. However, this improved Tennant method is only suitable to humid regions. Moreover, within this modified approach, wet, normal, and dry years are subjectively determined.
In this paper, the Tennant method was modified by determining the flood season, non-flood season, and base flow standard of a river using quantitative mathematical approaches. More specifically, the BEEWR was calculated for several reaches of the Yarkand River as a case study to determine the feasibility and effectiveness of these modifications. The hypothesis was that the accuracy of the calculated BEEWR would be enhanced, and the spatial applicability of the Tennant method would be broadened. It is important to recognize that while the study focuses on the Yarkand River, the resulting modifications to the Tennant method are applicable to the analysis of other inland rivers in arid environments.

2. Study Area and Methodology
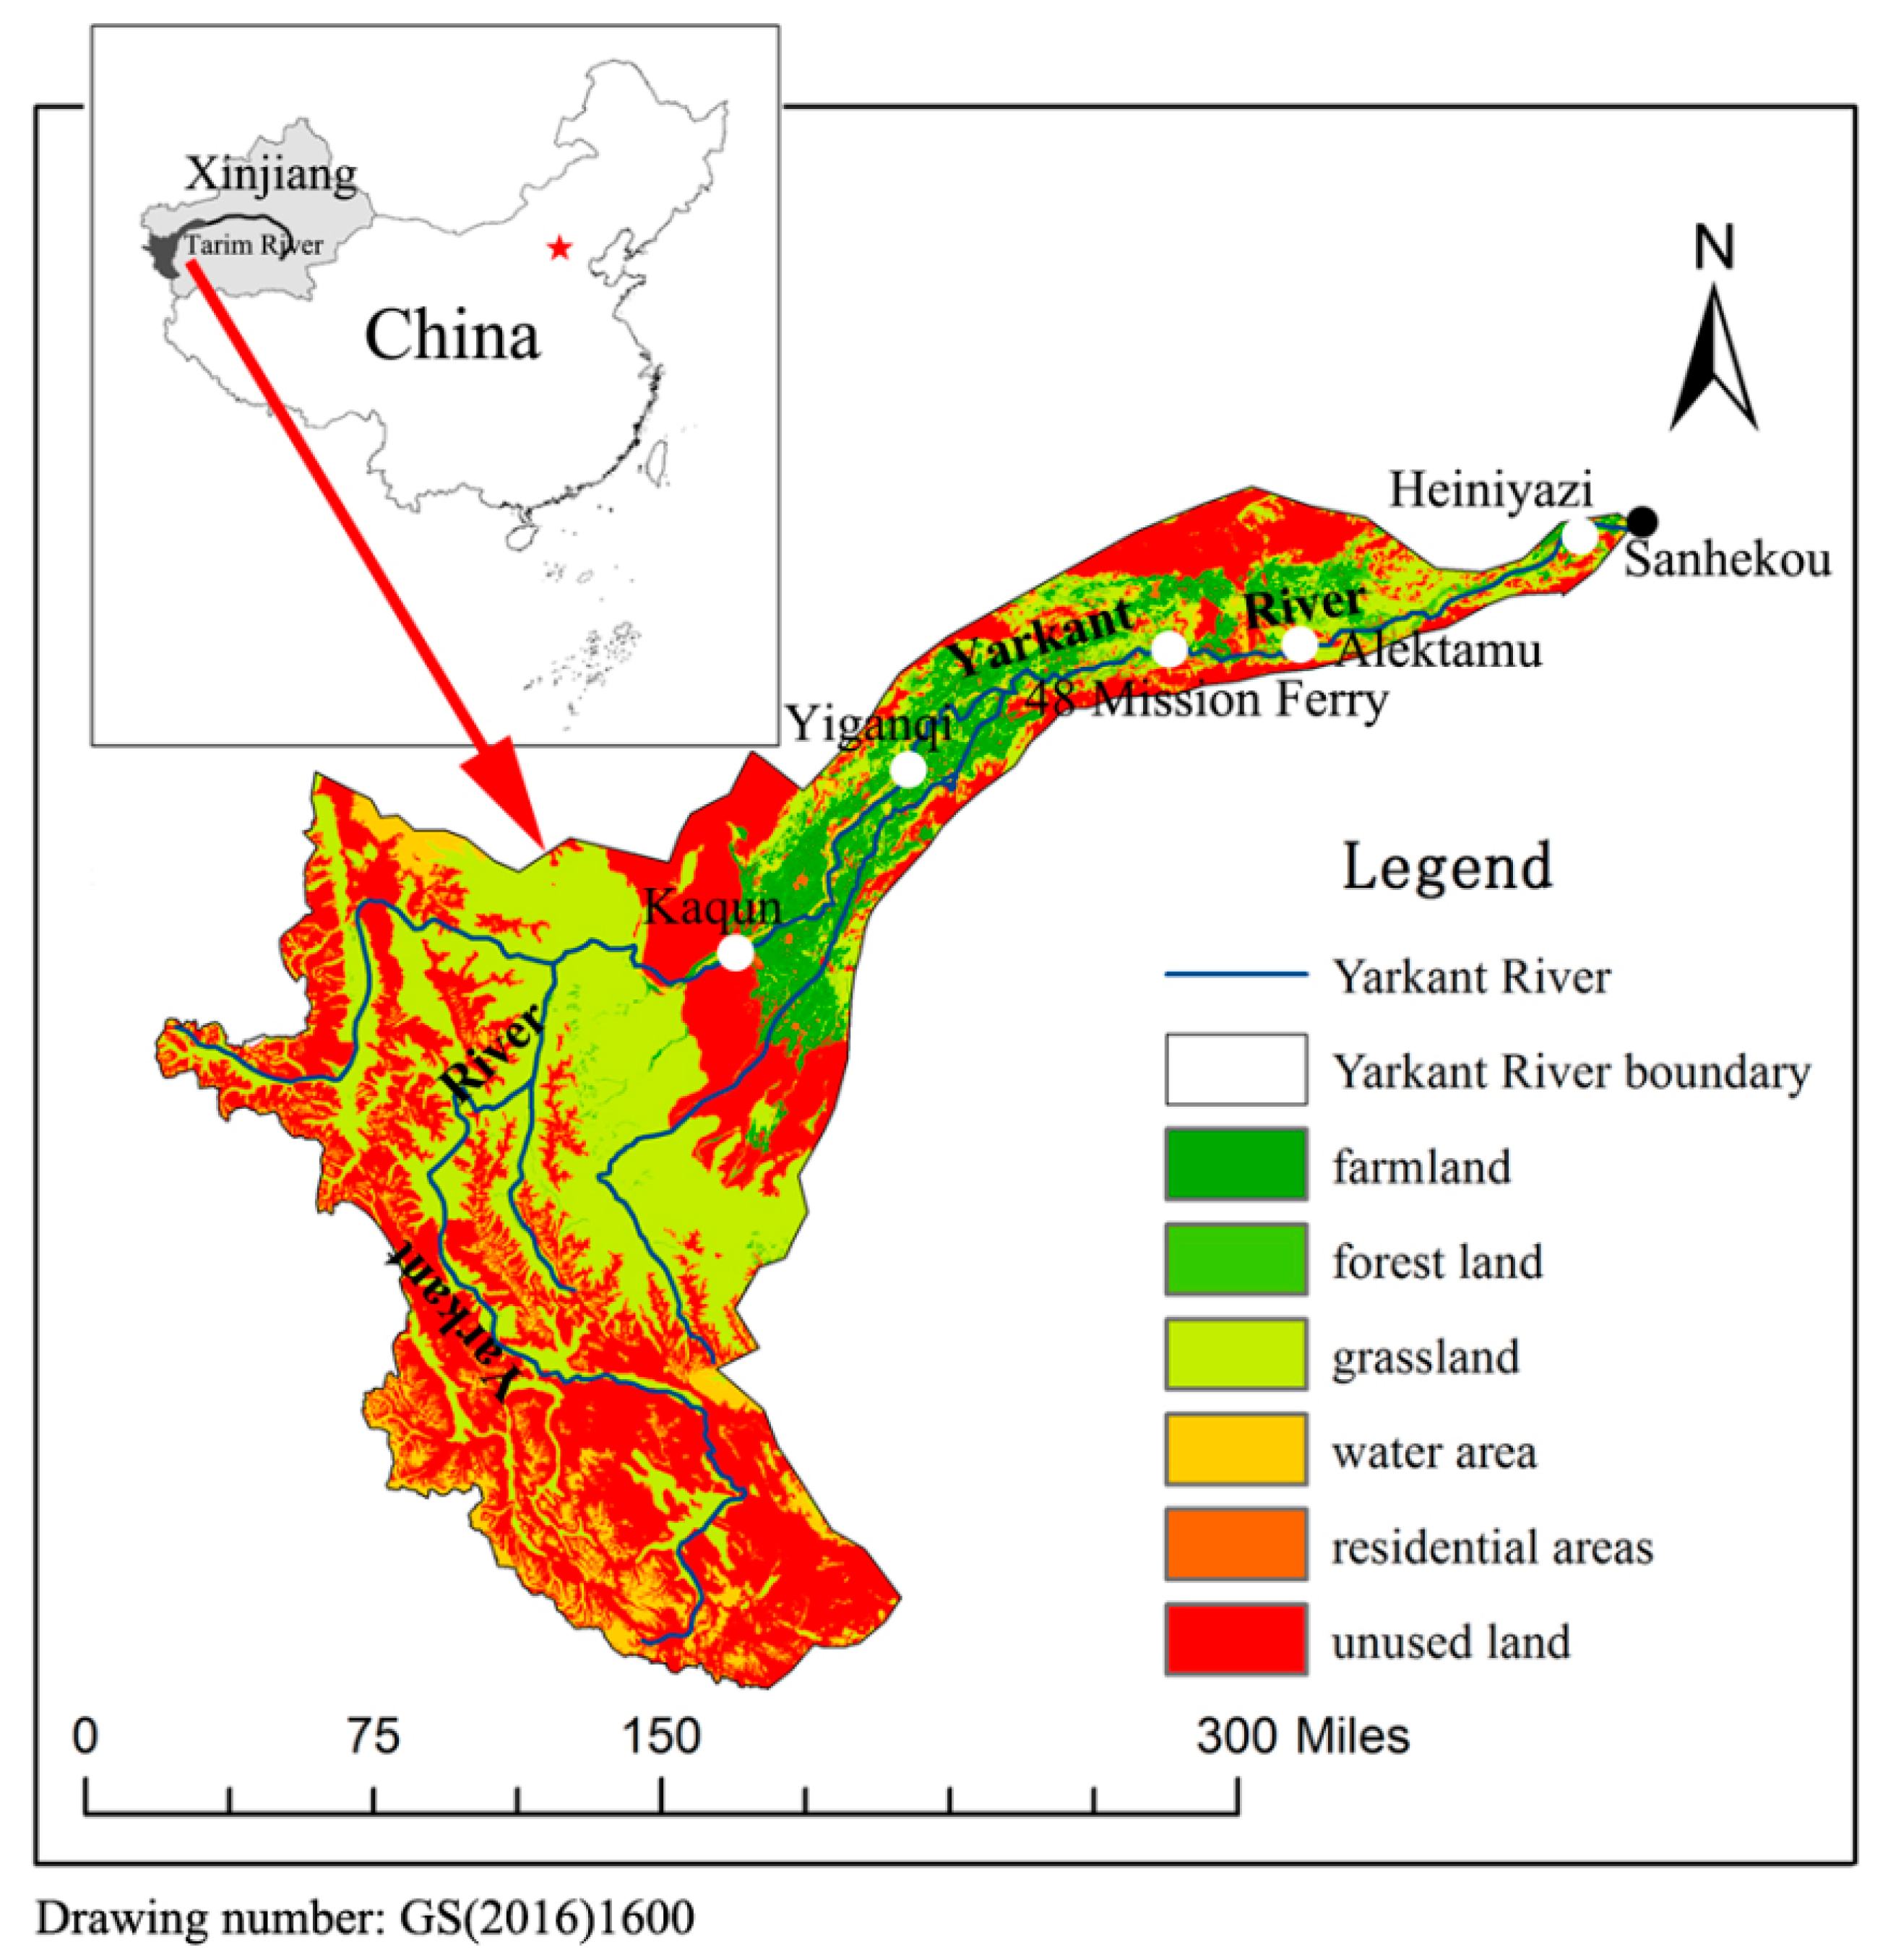
2.1. Study Area

The Yarkand River Basin (34°50’–40°31’ N, 74°28’–80°54’ E, Figure 1) is located in the southwestern part of the Xinjiang Uygur Autonomous Region, southwest of the Tarim Basin. The Yarkand Basin is bordered by the Taklamakan Desert to the east, the Tuogelake and the Gaya Deserts to the west, the Karakoram Mountains to the south, and the Tianshan Mountains to the north. The total area of the basin is 8.57 × 10⁴ km2 (excluding 8.44 × 10⁴ km2 located in Kashmir and Afghanistan). The mountainous area encompasses 5.84 ×10⁴ km2, accounting for 66.9% of the basin area; the plains cover an area of 2.73 × 10⁴ km2 and account for 33.1% of the basin. The Yarkand River Basin is characterized by an arid continental climate with limited precipitation, more evaporation than rainfall, dry air, long daily periods of sunshine, and large daily variations in temperature. The average annual temperature is 11.7 °C and annual rainfall is 61.5 mm. The plant community of the desert is riparian forest within the lower reaches of the Yarkand River basin and consists of trees, shrubs and herbaceous plants. The trees mainly consist of Populus euphratica and Populus pruinosa. Shrubs or semi-shrubs are mainly Tamarix chinensis, Lycium ruthernicum, and Alhagi Sparsifolia. Herbaceous plants are dominated by Phragmites australis, Apocynum venetum, and Glycyrrhiza uralensis.
The Yarkand River is one of the largest inland rivers in China and the main source of the Tarim River. It originates along the north side of the southern section of the Karakoram Mountains. Runoff mainly depends on ice and snow meltwater generated in the mountains. The Yarkand drainage network includes the main stem of the Yarkand River, the Tiznafu River, the Kekeyahe River, and the Uruk River. The Yarkand River has a total length of 1281 km, with an average annual runoff of 72.04 × 10⁸ m3 between 2000 and 2016. The Tiznafu River is a tributary to the Yarkand River with an average annual runoff of 8.30 × 10⁸ m3. The average annual runoff volume of the Kekeyahe and Uruk Rivers was 0.89 × 10⁸ m3 and 0.08 × 10⁸ m3, respectively, in 2016. The Yarkand River Basin can be subdivided into five hydrographic sections, including Kaqun, Yiganqi, the 48th Mission Ferry, Alektamu, and Heiniyazi. The Kaqun hydrographic monitoring station is located at the base of the mountains (Figure 1).
Recently, there has been increased tension concerning water use within the Yarkand River basin, and downstream water rights have been difficult to maintain and guarantee. These problems are related to the basin’s limited water resources combined with the extensive disordered clearing of land in the basin, the over-quoting of water use during planning, and the seizure of ecological water for domestic and agricultural purposes. Previous investigations have shown that little, if any water flowed from the Yarkand River into the Tarim River in 1986 [21]. In addition, during the allocation of water resources, upstream water needs are met before water is transported downstream. In years characterized by abundant water, the water is transferred downstream to meet the water demand for socioeconomic development in downstream regions. Only after the upstream water source area has met the basic water demand can the remaining water be transferred downstream. In general, the limited amount of water in the basin cannot meet the water demand in downstream areas.

2.2. Data Collection

Monthly runoff along the Kaqun reach located at the base of the mountains was monitored from 1970 to 2017 by the Kashi Authority of the Tarim River Basin, China (Figure 1). These data were combined with estimates of annual average river loss along the major river reaches defined by physiographic conditions along the river, including from Kaqun to Yiganqi, from Yiganqi to the 48th Mission Ferry, from the 48th Mission Ferry to Alektamu, and from Alektamu to Heiniyazi (Figure 1).
Annual average monthly runoff data for the Hetian River, the Aksu River, and the main stream of the Tarim River were derived from the Tarim River Basin Authority. The monthly and annual mean temperatures from 1951 to 2008 in southern Xinjiang were derived from [22].

2.3. Calculation of BEEWR

Numerous methods exist for the calculation of the BEEWR along rivers. These methods can be roughly divided into four types: (1) hydrographic methods; (2) hydraulics methods; (3) habitat simulation methods; and (4) comprehensive simulation methods. Among them, hydraulics methods, habitat simulation methods, and comprehensive simulation methods determine the ecological base flow of the river on the basis of hydraulic parameters (e.g., river width, river depth, flow rate, and wet cycle), water temperature, water quality, aquatic biological characteristics, and adaptability. The information required is extensive and not easily accessible. Hydrographic methods are widely utilized because the data (mostly runoff data) are more easily acquired. Hydrographic methods include the Tennant method [23], the annual division method [24], the multi-year mean method of averaging monthly flows [24], and the Qp method [25], among others. Since the calculation results of the Tennant method can be refined to a monthly ecological base flow, it is simple to apply to water resource allocation during the year and is widely used. Therefore, it was chosen here to determine the BEEWR for the Yarkand River.
The Tennant method, also known as the Montana method [23], is a standard setting method of off-site measurement type that was first proposed by Don Tennant in 1976. It uses observed data to establish relationships between habitat parameters, such as river width, average depth, and current velocity, and annual average flow. The results show that these parameters change more rapidly in the range of zero to 10% of the average annual natural flow than for any other flow range. Thus, 10% of the average annual natural flow is taken as the minimum instantaneous flow necessary to keep most aquatic organisms alive for a short time. The specific results of Tennant’s study are as follows: (1) when the flow is less than 10% of the annual average natural flow, the depth and velocity of the water drop significantly, one third of the riverbed is exposed, the vegetation disappears, small fish congregate in areas of deep water, and large fish cannot migrate and survive; (2) when the flow rate is 30% of the annual average natural flow rate, aquatic organisms exhibit very good growth as a result of suitable flow velocities, enhanced river width and water depth, limited vegetation on the river banks, and the ability for relatively large fish to migrate; (3) the best water flow conditions occur between 60% and 100% of the average annual natural flow. During these conditions, the width, depth, and velocity of the river provide a good environment for aquatic organisms to grow. Most rapids and shoals along the river will be submerged, and only a few pebbles and sand bars will be exposed above the water’s surface. Beaches/bars will be accessible to fish. There will also be plenty of water for plants, and species richness and abundance (numbers) of invertebrate organisms will be sufficient to meet the demands of fishing; (4) the maximum flow observed was 200% of the annual average natural flow. During these conditions, the current velocity may be too high for most aquatic organisms to acquire suitable living conditions, but it is beneficial for transferring sediment, including bed load, downstream and allows for boating in shallow water; and (5) for large rivers, 5–10% of the average annual river flow still possesses the width, depth, and flow velocity needed to meet the general requirements of fish migration, survival, tourism, and landscaping. In short, 5–10% of the river flow is the minimum instantaneous flow rate necessary to ensure the short-term survival of most aquatic organisms along large rivers.
The ecological base flow standard is a very important parameter calculated by the Tennant method. At present, there is no exact method for determining the ecological base flow standard. Rather, it is estimated using a subjective, non-quantitative approach [15,16,17,18,19,20]. The description of habitat quality used in the Tennant method is presented in Table 1.
Application of the Tennant method requires only historical flow data; no other on-site measurements are needed. As a result, it can be used in areas where ecological data are scarce. In rivers with hydrologic stations, the estimation of mean annual flow can be obtained from historical data, whereas along rivers without hydrologic stations, the needed flow data can be obtained through acceptable hydrologic modeling techniques. Based on permanent rivers in arid and semi-arid areas, the Tennant method sets the recommended base flow standard at 10–200% of the average annual flow without considering the change in river flows that may occur, such as changes that result from seasonal changes in climate. In practice, the approach should be improved so that it considers actual hydrologic conditions, including seasonal changes in flow conditions.
Rivers in arid areas are often characterized by seasonal conditions with large flows during a flood season and small flows during the non-flood or dry season. Therefore, the base flow standards should be defined for both the flood and non-flood seasons. Defining the flood and non-flood seasons of a river is another important process in the Tennant method and has historically been determined using a manual, non-quantitative approach.
Because of the large seasonal variations in river runoff that usually characterize arid areas, typical water years were used for analysis herein [25]. The selection of a typical year was based on the calculation of the modulus coefficient of annual runoff (where the modulus coefficient K = the runoff/a multi-year average runoff of a given period). The year for which the modulus coefficient was closest to 1.0 was selected as the typical year. In addition to the base flow standard recommended by the Tennant method, the ecological base flow standards and BEEWRs for different habitats during different months of a typical year for the river were obtained.

3. Analysis and Results

3.1. Delineation of Flood and Non-Flood Seasons

The rivers distributed in southern Xinjiang are all seasonal inland rivers. Zheng et al. [22] analyzed the change in monthly and annual mean temperature from 1951 to 2008 in southern Xinjiang (Table 2), calculated the increase in monthly temperature compared to the average temperature during the previous month, and found that the increase in temperature began to taper off in May. Chen et al. [21] found that runoff increased by 9.98% for every one degree increase in temperature within the inland river basins of Xinjiang, China. Based on these analyses, the monthly rate of increased runoff along with the increase of temperature was calculated (Table 2). The runoff increased by just over 50% in May compared with that in April and decreased by over 50% in September compared with that in August. Combined with the change in monthly temperatures, the month for which the increasing rate of runoff begins to exceed 50% was defined as the beginning of the flood season. During this month, runoff exceeds 50% of the previous month’s runoff, indicating that the runoff has increased significantly. The month at which the decreasing ratio begins to exceed 50% was taken as the start of the non-flood season and indicates that the monthly runoff is less than one-half of the previous month’s runoff. The following months will likely possess significantly reduced runoff. The flood season and non-flood season as defined by this method are determined according to the nature and flow status of the studied inland river
In extremely arid regions, river runoff is largely controlled by, and positively correlated to, temperature within the snowmelt driving basins [26]. In the Yarkand River, temperatures begin to rise rapidly from late April to early May, ice- and snowmelt intensifies, and runoff increases rapidly. For this study, three inland rivers in this extremely arid region, including the Hetian River, the Aksu River, and the main stream of the Tarim River were randomly selected to assess the validity of the proposed method for defining the flood and non-flood seasons. Previous studies found that flood and non-flood seasons in all three rivers extended from June to September and October to May of the next year, respectively [27,28]. These periods were based on subjective observations. These observations include that June is the beginning of the summer with increasing temperatures, and October is late autumn with a precipitous drop in temperature. These temperature patterns induce the amount of runoff to increase sharply in June and decrease sharply in October. The flood and non-flood seasons were also determined using annual average monthly runoff data and the methods proposed above for the three rivers (Table 3). The results showed that the flood and non-flood periods defined using the proposed quantitative methods were little different from those defined using the climatic and hydrologic data, suggesting that the method is reasonable and feasible.

3.2. Determination of the Ecological Base Flow Standard

The base flow standard as defined by the Tennant method is the minimum amount of water needed in the river to maintain the riverine ecosystem. It is represented in terms of a percentage of the annual average natural base flow. Previously, the ecological base flow standard was determined by subjective approaches that utilized seasonal characteristics of the river and human experience [15,16,17,18,19,20]. In this paper, a quantitative method of establishing an ecological base flow standard was analyzed.
When the river reaches BEEWR, BEEWR must not only be sufficient to maintain aquatic life, but a portion of BEEWR needs to exceed water losses in the channel. Therefore, BEEWR must be more than (or equal to) river loss. The base flow standard was defined herein as 10–200% of the average runoff. It was calculated as follows.
Initially, the river’s non-flood season base flow standard was set at 10% of the annual average monthly runoff, and the flood season base flow standard was set at 20% of the annual average monthly runoff. In this case, if the calculated annual BEEWR was greater than or equal to the multi-year average river loss, the base flow standard for the non-flood season of the river was set at 10% of the average monthly runoff over many years, and at 20% for the flood season.
However, if the calculated annual BEEWR was less than the multi-year average river loss, the basic flow standard of the river during the non-flood season was increased to 20% of the average monthly runoff over many years, and the base flow standard during the flood season remained at 20%. The annual BEEWR was re-calculated, and if the annual BEEWR exceeded the multi-year average river loss, the base flow standard for the non-flood season of the river was set at 20% of the average monthly runoff for many years, and at 20% for the flood season.
If, however, the calculated annual BEEWR was less than the multi-year average river loss, the basic flow standard of the river during the non-flood season was increased to 20% of the average monthly runoff over many years. During the flood season, the base flow standard was increased to 30%. After the annual BEEWR was calculated, if the annual BEEWR was greater than or equal to the multi-year average river loss, the base flow standard for the non-flood season of the river was set at 20% of the average monthly runoff over many years, and at 30% for the flood season. This process was repeated until a base flow standard for the rivers was obtained.

3.3. Calculation of BEEWR for Other River Reaches

Along most rivers, downstream river valleys and channels have been artificially modified. Oases are distributed on both sides of the river, and people rely mainly on rivers for industrial and domestic purposes. As a result, there are many complex water diversion structures on both sides of the river. Defining different sections along the river to analyze, and calculating BEEWRs for each section, can provide a scientific basis for effectively managing the health and stability of the riverine ecosystems as a whole, and for rationally determining the amount of water that can be diverted for irrigation.
An important question that arises is how to determine the BEEWR of each section. Typically, it is difficult to determine the natural runoff conditions of each section due to a lack of hydrologic monitoring stations. Therefore, it was not possible to use the Tennant method to determine BEEWRs of these other sections. Based on the BEEWR of the river flow recorded upstream as water moves out of the mountains, the BEEWR in the second section was calculated as the BEEWR of the river flowing out of the mountain pass minus the loss of river water from the channel between these two sections.

3.4. Case Study: Yarkand River Basin, Xinjiang, China

3.4.1. Determination of Flood and Non-Flood Seasons for the Yarkand River

By drawing annual average monthly runoff change graphs for the Kaqun section of the Yarkand River (Figure 2), it was found that monthly runoff increased from May, reached a peak in August, and significantly decreased in October. Using the increase ratio calculated using the method put forth above, the results showed that the increase rate exceeded 50% in May (when it was 64.29%); thus, May was the beginning of the flood season. The decrease rate for September began to exceed 50%. Therefore, September was the beginning of the non-flood season.

3.4.2. Determination of the Ecological Base Flow Standard and BEEWR in Kaqun Section

Data provided by the Kashi Authority of the Tarim River Basin showed that the annual average river loss between the Kaqun and Heiniyazi hydrological monitoring sites was 15.07 × 10⁸ m3. By calculating the modulus coefficient for the period of 1970–2017, it was found that the modulus coefficient in 1998 was closest to 1.0. Thus, the monthly runoff in 1998 was selected as the standard year. Based on the Tennant method and the approach proposed herein for the calculation of ecological base flow standards, the base flow standard for the non-flood season along the Yarkand River was set at 10% of the annual average monthly runoff. During the flood season, base flow standard was set at 20% of the annual average monthly runoff. In this case, the annual BEEWR was 12.30 × 10⁸ m3, which was less than the river loss (15.07 × 10⁸ m3). Therefore, the base flow standard of the river during the non-flood season was increased to 20% of the average monthly runoff, but the base flow standard during the flood season remained unchanged. In this case, the annual BEEWR was 13.71 × 10⁸ m3, which was less than the river loss (15.07 × 10⁸ m3); thus, the base flow standard of the river during the flood season was increased to 30% of the average monthly runoff. However, the base flow standard during the non-flood season remained at 20%. In this case, the annual BEEWR was 19.16 × 10⁸ m3, which was greater than the river loss (15.07 × 10⁸ m3). Thus, the final determination was that the base flow standard during the non-flood season was 20% of the average monthly runoff, whereas that of the flood season was 30%. The BEEWR was 19.16 × 10⁸ m3.

3.4.3. Determination of BEEWRs in Other Sections

Data from the Kashi Authority of the Tarim River Basin were used to determine the annual average river loss between Kaqun and Yiganqi, Yiganqi and the 48th Mission Ferry, the 48th Mission Ferry and Alektamu, and Alektamu and Heiniyazi. The calculated losses in the river channel in these sections were 2.78 × 10⁸, 5.94 × 10⁸, 2.32 × 10⁸, and 4.03 × 10⁸ m3, respectively. Using the methods put forth in Section 3.3, basic monthly, flood season, non-flood season, and whole year BEEWRs of the other sections were calculated (Table 4). Table 4 shows that (1) within the Yiganqi section, the BEEWRs for the non-flood season, the flood season, and the whole year were 5.21 × 10⁸, 11.18 × 10⁸, and 16.39 × 10⁸ m3, respectively; (2) in the 48th Mission Ferry to Yiganqi section, BEEWRs for the non-flood season, the flood season and the whole year were 1.94 × 10⁸, 6.50 × 10⁸, and 8.44 × 10⁸ m3, respectively; (3) in the Alektamu to 48th Mission Ferry section, BEEWRs for the non-flood season and flood season were 1.73 × 10⁸ and 4.10 × 10⁸, respectively; and (4) in the Heiniyazi to Alektamu section, BEEWR was 1.87 × 10⁸ m3 in flood season, and BEEWR for the remaining months was 0 × 108 m3. These data show that beginning at the 48th Mission Ferry site, the river can be allowed to disconnect seasonally, such as from October to March of the following year, and from October to May of the next year along the Alektamu and Heiniyazi sections. This follows because in summer, there is a high demand for runoff due to increased irrigation needs. As a result, little water is left along the river course.

4. Discussion

BEEWR represents the flow levels needed to maintain the ecological environmental functions required for specific ecological environmental protection goals in a river. The ecological base flow is the minimum base flow that is needed. Therefore, BEEWR can be obtained by calculating the ecological base flow. As mentioned above, there are many ways in which the ecological base flow of a river can be calculated. One of the simplest and most practical ways is using the Tennant method. However, in the past, when scholars used this method to calculate a river’s ecological base flow, the flood season, non-flood season, and ecological base flow standards were subjectively determined and there is currently no widely accepted calculation method [15,16,17,18,19,20,27]. In this paper, a new quantitative method was proposed to determine the flood season, non-flood season, and ecological base flow standards. This approach improves the accuracy of the Tennant method by quantitatively calculating the ecological base flow.
In China, inland river basins (34°18′–47°19′N, 73°35′–106°35′E) are located in the Hexi basin of the Gansu province, the Xinjiang province, and the Qinghai province. These basins cover an area of 2.29 million km2 [28]. They are surrounded by high mountains and contain inter-basin mountains, oases, and deserts [28]. Precipitation is limited at less than 200 mm per year [29]. Both ecological water use and water used for human activity mainly depend on snowmelt in the mountains [30]. The maximum runoff to inland rivers is at the base of the mountains. Farther downstream, inland rivers possess no significant tributaries to supply runoff. Thus, runoff decreases downstream as a result of numerous abstractions, including evaporation, artificial water diversions, and the flow of water into lakes or the subsurface (infiltration into the channel bed) [31]. Snowmelt water and runoff are mainly affected by air temperature and precipitation [32]. The volume of river water varies significantly between seasons, and the downstream river is periodically cut off from flows from the mountains because of the abovementioned abstractions. In areas where water resources are scarce and highly valuable and the aquatic ecosystem is relatively fragile, it is very important to determine the river’s ecological base flow [33]. The method proposed in this paper may be used to develop sustainable management programs for rivers characterized by seasonal climates and flood regimes.
With respect to the ecological base flow standard, Li and Kang [20] modified the Tennant method based on multilevel habitat conditions, which were ranked from poor to optimum based on the hierarchical idea of arithmetic progression. Their approach, however, is complicated. Huang et al. [18] solved the large spatiotemporal variability of the Tennant method using the annual average method, but this approach did not calculate the ecological base flow standard. The method of determining the ecological base flow standard proposed in this paper complements and improves the deficiencies of these previous approaches.
In order to effectively allocate water resources, the river was subdivided into distinct sections. Part of the river water along each section is allocated to local populations for production and domestic water supplies. Thus, it is difficult to directly measure the runoff within each section in its natural state, inhibiting the use of the Tennant method to calculate the BEEWR. In previous studies, no attempt was made to determine the minimum amount of water (BEEWR) that should be maintained along different sections of a river. In this paper, it was assumed that river flow at the downstream end of each section was not used to meet production and drinking water requirements along the reach. Thus, only natural river losses (infiltration, evaporation) need to be considered to calculate the BEEWR of the next downstream section when using the BEEWR at the upstream end of the reach as the starting flow level. The methods provided in this paper can be used in other arid inland rivers fed mainly by snowmelt water in mountainous areas.

5. Conclusions

In this paper, the Yarkand River, a typical inland river basin in China that is characterized by extreme aridity, was selected to study the BEEWR. The BEEWR for a river was calculated using a modified version of the Tennant method. Historically, several components of the approach were determined subjectively, which affected the accuracy of its calculations. Therefore, in this paper, quantitative methods were put forth and used to delineate the flood season, non-flood season, and ecological base flow standard used in the Tennant method. In addition, the BEEWRs for multiple river sections were determined using a novel approach. The following conclusions were drawn:
(1) The flood and non-flood seasons of the river were delineated by analyzing the increased (or decreased) rate of average monthly runoff versus the previous average monthly runoff. The month in which the increase rate began to exceed 50% was taken as the beginning of the flood season; the month in which the decrease rate began to exceed 50% was taken to be the beginning of the non-flood season.
(2) The ecological base flow standard in the Tennant method was obtained by comparing the BEEWR for each ecological base flow standard with the annual average river loss. In doing so, it was assumed that the BEEWR exceeded the annual average river loss. Specifically, the base flow standard was assumed to vary between 10% and 200% of the average runoff. Initially, during the river’s non-flood season, the base flow standard was set at 10% of the annual average monthly runoff and the flood season base flow standard was taken as 20% of the annual average monthly runoff. In this case, BEEWR was calculated and compared with the annual average river loss. If BEEWR was more than the annual average river loss, then the ecological base flow standard was assumed to have been determined at the base of the mountains. If BEEWR was less than the river loss, the river’s non-flood season base flow standard was increased to 20% and the flood season base flow standard remained unchanged. The BEEWR was then re-calculated and compared with the annual average river loss. This process was repeated until the BEEWR was more than the annual average river loss.
(3) Using the BEEWR of the river where it emerges from the mountains and the amount of water loss along a given river reach, BEEWRs of other downstream sections were obtained. Mathematically, the formula is that the BEEWR of a section equals the BEEWR determined at the downstream end of the adjacent upstream section, minus the river loss along that analyzed section (i.e., between the two monitoring stations bounding the sections).

Author Contributions

Writing—original draft, A.F.; Investigation, Y.W.; Supervision, Z.Y. All authors have read and agreed to the published version of the manuscript.

Funding

This work was supported by the Thousand Talent Program for Young Outstanding Scientists of China (grant number Y771071).

Acknowledgments

We thank the editors and anonymous reviewers for their comments and suggestions on the article.

Conflicts of Interest

The authors declare no conflict of interest. The sponsors had no role in the design, execution, interpretation, or writing of the study.

References

  1. Sun, Z.L.; Li, X.D. Evolution characteristics and development potential of grain production in Africa under the sustainable development goals of UN. J. China Agric. Univ. 2020, 25, 160–170. [Google Scholar]
  2. Yang, S.M.; Shao, D.G.; Shen, X.P. Quantitative approach for calculating ecological water requirement of seasonal water–deficient rivers. Shuili Xuebao 2015, 36, 1341–1346. [Google Scholar]
  3. Wang, R.H.; Song, Y.D.; Fan, Z.L.; Ma, Y.J. Estimation on ecological water demand amount in four sources and one main stream area of Tarim Basin. J. Soil Water Conserv. 2001, 15, 19–22. [Google Scholar]
  4. Ni, J.R.; Cuo, S.B.; Li, T.H.; Jin, L. Water demand for river ecological environment. Shuili Xuebao 2002, 14–19. [Google Scholar] [CrossRef]
  5. Ling, H.B.; Guo, B.; Xu, H.L.; Fu, J.Y. Configuration of water resources for a typical river basin in an arid region of China based on the ecological water requirements (EWRs) of desert riparian vegetation. Glob. Planet. Ch. 2014, 122, 292–304. [Google Scholar] [CrossRef]
  6. Lytle, D.A.; Poff, N.L. Adaptation to natural flow regimes. Trends Ecol. Evol. 2004, 19, 94–100. [Google Scholar] [CrossRef]
  7. Meijer, K.S.; Krogt, W.N.M.; Beek, E. A new approach to incorporating environmental flow requirements in water allocation modeling. Water Resour. Manag. 2012, 26, 1271–1286. [Google Scholar] [CrossRef]
  8. Gu, W.Q.; Shao, D.G.; Jiang, Y.F. Risk evaluation of water shortage in source area of middle route project for south-to north water transfer in China. Water Resour. Manag. 2012, 26, 3479–3493. [Google Scholar] [CrossRef]
  9. Dai, J.S. Evaluation of Eco-Environment and Socio-Economic Benefit on the Project of Comprehensive Reclamation in Tarim River Basin. Ph.D. Thesis, Xinjiang Agricultural University, Xinjiang, China, 2015. [Google Scholar]
  10. Nie, S.H. Method & effect of emergency water supply to the downstream of the Tarim River. South to North Water Transf. Water Sci. Technol. 2007, 5, 106–108. [Google Scholar]
  11. Weber, C.; Peter, A.; Zanini, F. Spatio-temporal analysis of fish and their habitat: A case study on a highly degraded Swiss river system prior to extensive rehabilitation. Aquat. Sci. 2007, 69, 162–172. [Google Scholar] [CrossRef] [Green Version]
  12. Zambrano, L.; Contreras, V.; Mazari-Hiriart, M.; Zarco-Arista, A.E. Spatial heterogeneity of water quality in a highly degraded tropical freshwater ecosystem. Environ. Manag. 2009, 43, 249–263. [Google Scholar] [CrossRef] [PubMed]
  13. Amrit, K.; Mishra, S.K.; Pandey, R.P. Coupling of Tennant concept with standardized precipitation index (SPI) for the prediction of environmental flow condition from rainfall in upper Narmada Basin. In Climate Change Impacts; Singth, V.P., Yadav, S., Yadava, R., Eds.; Water Science and Technology Library, Springer Nature Singapore Pte Ltd.: Singapore, 2018. [Google Scholar]
  14. Karakoyun, Y.; Yumurtaci, Z.; Donmez, A.H. Environmental flow assessment for energy generation sustainability employing different hydraulic evaluation methods: Cambasi hydropower plant case study in Turkey. Clean Technol. Environ. Policy 2016, 18, 583–591. [Google Scholar] [CrossRef]
  15. Karakoyun, Y.; Donmez, A.H.; Yumurtaci, Z. Comparison of environmental flow assessment methods with a case study on a runoff river-type hydropower plant using hydrological methods. Environ. Monit. Assess. 2018, 190, 722. [Google Scholar] [CrossRef] [PubMed]
  16. Ksiazek, L.; Wos, A.; Florek, J.; Wyrebek, M.; Mlynski, D.; Walega, A. Combined use of the hydraulic and hydrological methods to calculate the environmental flow: Wisloka River, Poland: Case study. Environ. Monit. Assess. 2019, 191, 254. [Google Scholar] [CrossRef] [PubMed] [Green Version]
  17. Xu, Z.X.; Li, P.; Hou, X.Y. Theoretical basis and estimation method for ecological base-flow. Yellow River 2019, 41, 119–127. [Google Scholar]
  18. Huang, K.; Li, H.E.; Cheng, B.; Tian, R.G. Application status and improvement ideas of river ecological base flow based on Tennant method. J. Water Resour. Water Eng. 2019, 30, 103–110. [Google Scholar]
  19. Wu, M.L. A review of calculation methods of ecological base flow. Water Conserv. Mong. 2019, 11, 52–53. [Google Scholar]
  20. Li, C.W.; Kang, L. A new modified Tennant method with spatial-temporal variability. Water Resour. Manag. 2014, 28, 4911–4926. [Google Scholar] [CrossRef]
  21. Chen, Y.N.; Chen, Z.S.; Li, B.F.; Li, Q.H. Response of runoff to climate change. In Water Resources Research in Northwest China; Springer: New York, NY, USA; London, UK, 2014; pp. 145–191. [Google Scholar]
  22. Zheng, H.L.; Yan, J.; Yuan, H.H. Analysis of temperature and precipitation of southern Xinjiang in last 58 years. J. Arid Land Resour Environ 2010, 24, 103–109. [Google Scholar]
  23. Tennant, D.L. Instream flow regimens for fish, wildlife, recreation and related environmental resources. In Instream Flow Needs; Orsborn, J.F., Allman, C.H., Eds.; American Fisheries Society: Bethesda, MD, USA, 1976; pp. 359–373. [Google Scholar]
  24. Wei, W.Y.; Liu, Z.H.; Feng, J.; Yang, J.M.; Wang, J.Z. A study of the estimation of the Hutubi River ecological base flow in the north slope of the Tianshan mountains. Water Conserv. Hydropower China 2017, 6, 92–96. [Google Scholar]
  25. Meng, H.Y. Calculation method of river ecological base flow and its applicability analysis. Basic Sci. 2013, 5, 135. [Google Scholar]
  26. Gao, Z.Y.; Feng, J.N.; Zhou, C.M.; Cui, J.G. Arid climate seasonal rivers deposition: A case of Lower Cretaceous in Kuche river outcrop. Acta Sedimentol. Sin. 2014, 32, 1060–1071. [Google Scholar]
  27. Yang, F.C.; Xia, Z.Q.; Yu, L.L.; Guo, L.D. Calculation and analysis of the instream ecological flow for the Irtysh River. Proced. Eng. 2012, 28, 438–441. [Google Scholar] [CrossRef] [Green Version]
  28. Hu, A.Y. Study on Hydro-Eco Characteristics and Rational Utilization of Water Resources in the Continental River of Arid Area. Doctoral Dissertation, Chang’an University, Xi’an, China, 2003. [Google Scholar]
  29. Kumar, P.; Liu, W.; Chu, X.; Zhang, Y.; Li, Z.H. Integrated water resources management for an inland river basin in China. Watershed Ecol. Environ. 2019, 1, 33–38. [Google Scholar] [CrossRef]
  30. Chen, Y.N.; Chen, Y.P.; Zhu, C.G.; Li, W.H. The concept and mode of ecosystem sustainable management in arid desert areas in northwest China. Acta Ecol. Sin. 2019, 39, 7410–7417. [Google Scholar]
  31. Long, A.H.; Wei, X.N.; Zhang, J.; Hai, Y.; Liu, J.; Wang, Y.Y.; Yu, J.W. Analysis of ecological water consumption and its variation in inland river regions in Xinjiang in recent 16 years. Water Conserv. Hydropower China 2019, 50, 170–177. [Google Scholar]
  32. Chen, H.J.; Yang, J.P.; Tan, C.P. Estimating runoff variation in the future in a typical inland river based on the probability distribution method. J. Glaciol. Geocryol. 2019, 41, 1–9. [Google Scholar]
  33. Yang, F.D.; Zhang, Y.S. Study on eco-environmental water demand of seasonal rivers in northwest China. Water Plan. Des. 2018, 8, 72–74. [Google Scholar]
Figure 1. Illustrative map of the Yarkand River Basin and main sections in Xinjing, China.
Sustainability 12 03699 g001
Figure 2. Annual average monthly runoff in Kaqun section of the Yarkant River.
Sustainability 12 03699 g002
Table 1. Ecological base flow standards recommended by the Tennant method.
Qualitative Description of HabitatBase Flow Standard (Average Annual Natural Flow Percentage)
Non-Flood Season Flood Season
Greatest200200
Best60–10060–100
Excellent4060
Very good3050
Good2040
Medium good1030
Poor1010
Extremely poor0–100–10
Table 2. The increase values in monthly temperatures and rates of increase in monthly runoff from 1951 to 2008 in southern Xinjiang, China.
Month123456789101112
Temperature (℃)−7.69−1.637.5815.6821.1925.3327.0425.582011.512.34−5.52
Value of increase in temperature (℃) 6.069.218.15.514.141.71−1.46−5.58−8.49−9.17−7.86
Rate of increase in runoffforevery one degree increase in temperature (%)9.98
Rate of increase in monthly runoff (%) 609180544117−14−55−84−91−78
Table 3. Annual average monthly runoffs of three rivers in extremely arid regions.
MonthHetian RiverAksu River Main Stream, Tarim River
January0.281.23.4
February0.261.553.25
March0.261.953.05
April0.241.951.1
May0.313.81.95
June1.658.652.06
July5.4124.59.9
August6.2617.216.34
September3.035.555.16
October0.593.752.06
November0.573.251.85
December0.311.054.1
Table 4. BEEWR (108 m3) in other sections of the Yarkand River. Section name is based on site of downstream hydrologic monitoring station.
MonthsYiganqi48th Mission FerryAlektamuHeiniyazi
10.23000
20.22000
30.22000
40.210.130 0
50.260.160 0
61.251.171.020.07
74.412.541.570.35
85.262.631.511.45
92.991.811.730
100.55000
110.54000
120.25000
Total16.398.445.83
Flood season11.18 6.50 4.101.87
Non-flood season5.21 1.94 1.730

