1. Introduction
After World War II, first the reconstruction and then the ensuing sociodemographic and economic development markedly affected the rural landscape of many European areas. Italy was no exception: old, hilly, secluded communities of the northern and central regions morphed into small urban downstream settlements; agriculture progressively gave way to manufacturing and business, often family-owned, benefitting from tourism and trade, coastal area urbanization grew disproportionately.
The resulting pattern is that of an urban sprawl [
1], with very mixed land use and depletion of historic centers. Needless to say, the above phenomena were supported by the increasing motorization rate and car-based lifestyles, generating more and more travel demand, tolerance of distance, air, and noise pollution, and land consumption. Supplying higher-capacity transit would have been a natural countermeasure to fight the massive use of passenger cars, but local railway lines were progressively dismantled and replaced by rubber-tired services, emulating the 1960s “Beeching cuts” policy [
2]. In the last decades this resulted in the closure of 1332 km of railway lines and 427 stations [
3], thus reducing the accessibility of many rural communities.
But depauperating inhabited areas of local rail supply contrasts with its acknowledged potential as positively impacting urban regeneration and development processes. The role of rail modes (both heavy and light-rail transit systems) is central in shaping general suburban areas and, more specifically, Transit Oriented Developments—TODs, increasing accessibility, and facilitating personal mobility [
4,
5,
6]. There are several cases of regeneration and recentralization of abandoned urban areas (often waterfronts and industrial sites) associated with new rail transit supplies [
7], resulting in increased land-use mix and vibrant city life. Transit facilities (stations, terminals, stops), are often quality design urban landmarks [
8,
9] and boost the placemaking process associated with the regeneration. Premium prices of properties reflect the attractiveness and value of these areas [
10], and healthier lifestyles are often connected to rehabilitated urban areas and their greener transit options [
11,
12,
13].
The environmental concern calls for a reverse trend towards more sustainable travel supply and the implementation of efficient solutions, based on providing disincentives to the use of private cars and incentives to attract passengers to transit [
4]. As to the latter, high quality service, mostly in terms of reliability and comfort, and clean technologies are the main drivers in many urban mobility agendas, and a plethora of successful examples of boosting new fleets with more local railways, trams, trolleybuses and environmentally-friendly buses to shift modal share towards less polluting modes can be found in literature [
14,
15,
16,
17,
18]. In this process, electrification seems to be one of the most promising options in metropolitan areas, especially in Europe [
19,
20,
21], but the approach is different, either when planning small-scale interventions, with few case studies in literature [
22,
23], or when visioning transit in non-central areas. Here, electric-powered modes are less favored by planners and policy makers: their higher capacity makes them appear unaffordable because of the local lower demand, their major capital and operational costs prohibitive if compared to diesel-fueled buses [
24]. This also explains why, once they are no longer operational, local railways are granted a “rebirth,” only when scenic as a heritage attraction, or if converted into greenways. In both cases, the majority of examples are far from creating business models as leisure amenities, although their potential in generating profit is stressed in literature [
25,
26], and even less from restoring regular passenger services.
From all of the above some contradictions arise. On the one hand, former rural or secluded communities have turned into scattered urbanized areas, more densely inhabited, calling for more sustainable and efficient high-capacity transit services to mitigate the negative consequences (pollution, congestion, land consumption) of car-based lifestyles. On the other hand, in the same areas, long-abandoned minor or feeder railway services have been either closed and “bustituted,” thus supplying communities under continuous expansion and development with diminished-capacity transit options, or being just underexploited for non-routine trips.
In this status quo, revamping abandoned railways seems to be both a sensible solution for some of the environmental problems mentioned above, and a valuable resource to provide expanding communities with higher-capacity transit options to meet the local increased travel demand. As a matter of fact, it is not in dispute that rehabilitating railways relies on
Cleaner technologies: as electrification enables less polluting performance not only for passenger cars but also for conventional bus fleets;
Community acceptance: as infrastructure and facilities are already part of the landscape and the communities they served, since they were built and operating prior to the mass car era;
Affordability: because infrastructure and passenger buildings are already in place, with possible capital expenditure reductions;
Land-friendliness: the availability of infrastructure also helps to mitigate land consumption (in Italy, since 2000 the abovementioned 1332-km reduction of the rail network has corresponded to an 11,154-km extension of the non-urban road network [
3]);
Flexibility: as the service can be planned and scheduled according to demand, thus avoiding poor occupancy problems.
Moving from such considerations, this paper describes the feasibility study to rehabilitate the Sangritana Railway in central Italy. Once a rural railway serving a secluded territory (further described in
Section 2), Sangritana was progressively replaced with bus services since the 1980s. However, the area’s continuous urbanization process (with increasing land-use variations and negative consequences in terms of pollution and congestion due to passenger cars as the dominant travel option) calls for a transit service that is more environmentally-conscious and consistent with the new travel demand. The feasibility study for the Sangritana Railway reopening can be a case in point on how to meet these requirements.
Thus, the paper outlines the main design features of operating a light-rail service starting from the local available infrastructure, with the underlying research highlighting the drivers and barriers, pros and cons associated with the reopening of operations. The goals are to provide scientific corroboration for prospective feasibility studies elsewhere, and to stress the relevance of rehabilitating railways in the urban regenerating process according to a vision called the Multiple Rs (described in
Section 4). To this end, along with the initial description of the status quo and the local constraints, the paper elaborates the methodology adopted for the feasibility study (
Section 2), its development and the main operational findings, with a focus on the potential environmental benefits achievable (
Section 3), and the implications according to the Multiple Rs approach (
Section 4) at the area level; concluding remarks (
Section 5) will summarize the rehabilitation process outcomes in order to evidence its relevance for other cases elsewhere.
2. The Process to Rehabilitate the Sangritana Railway: Analysis and Methodology
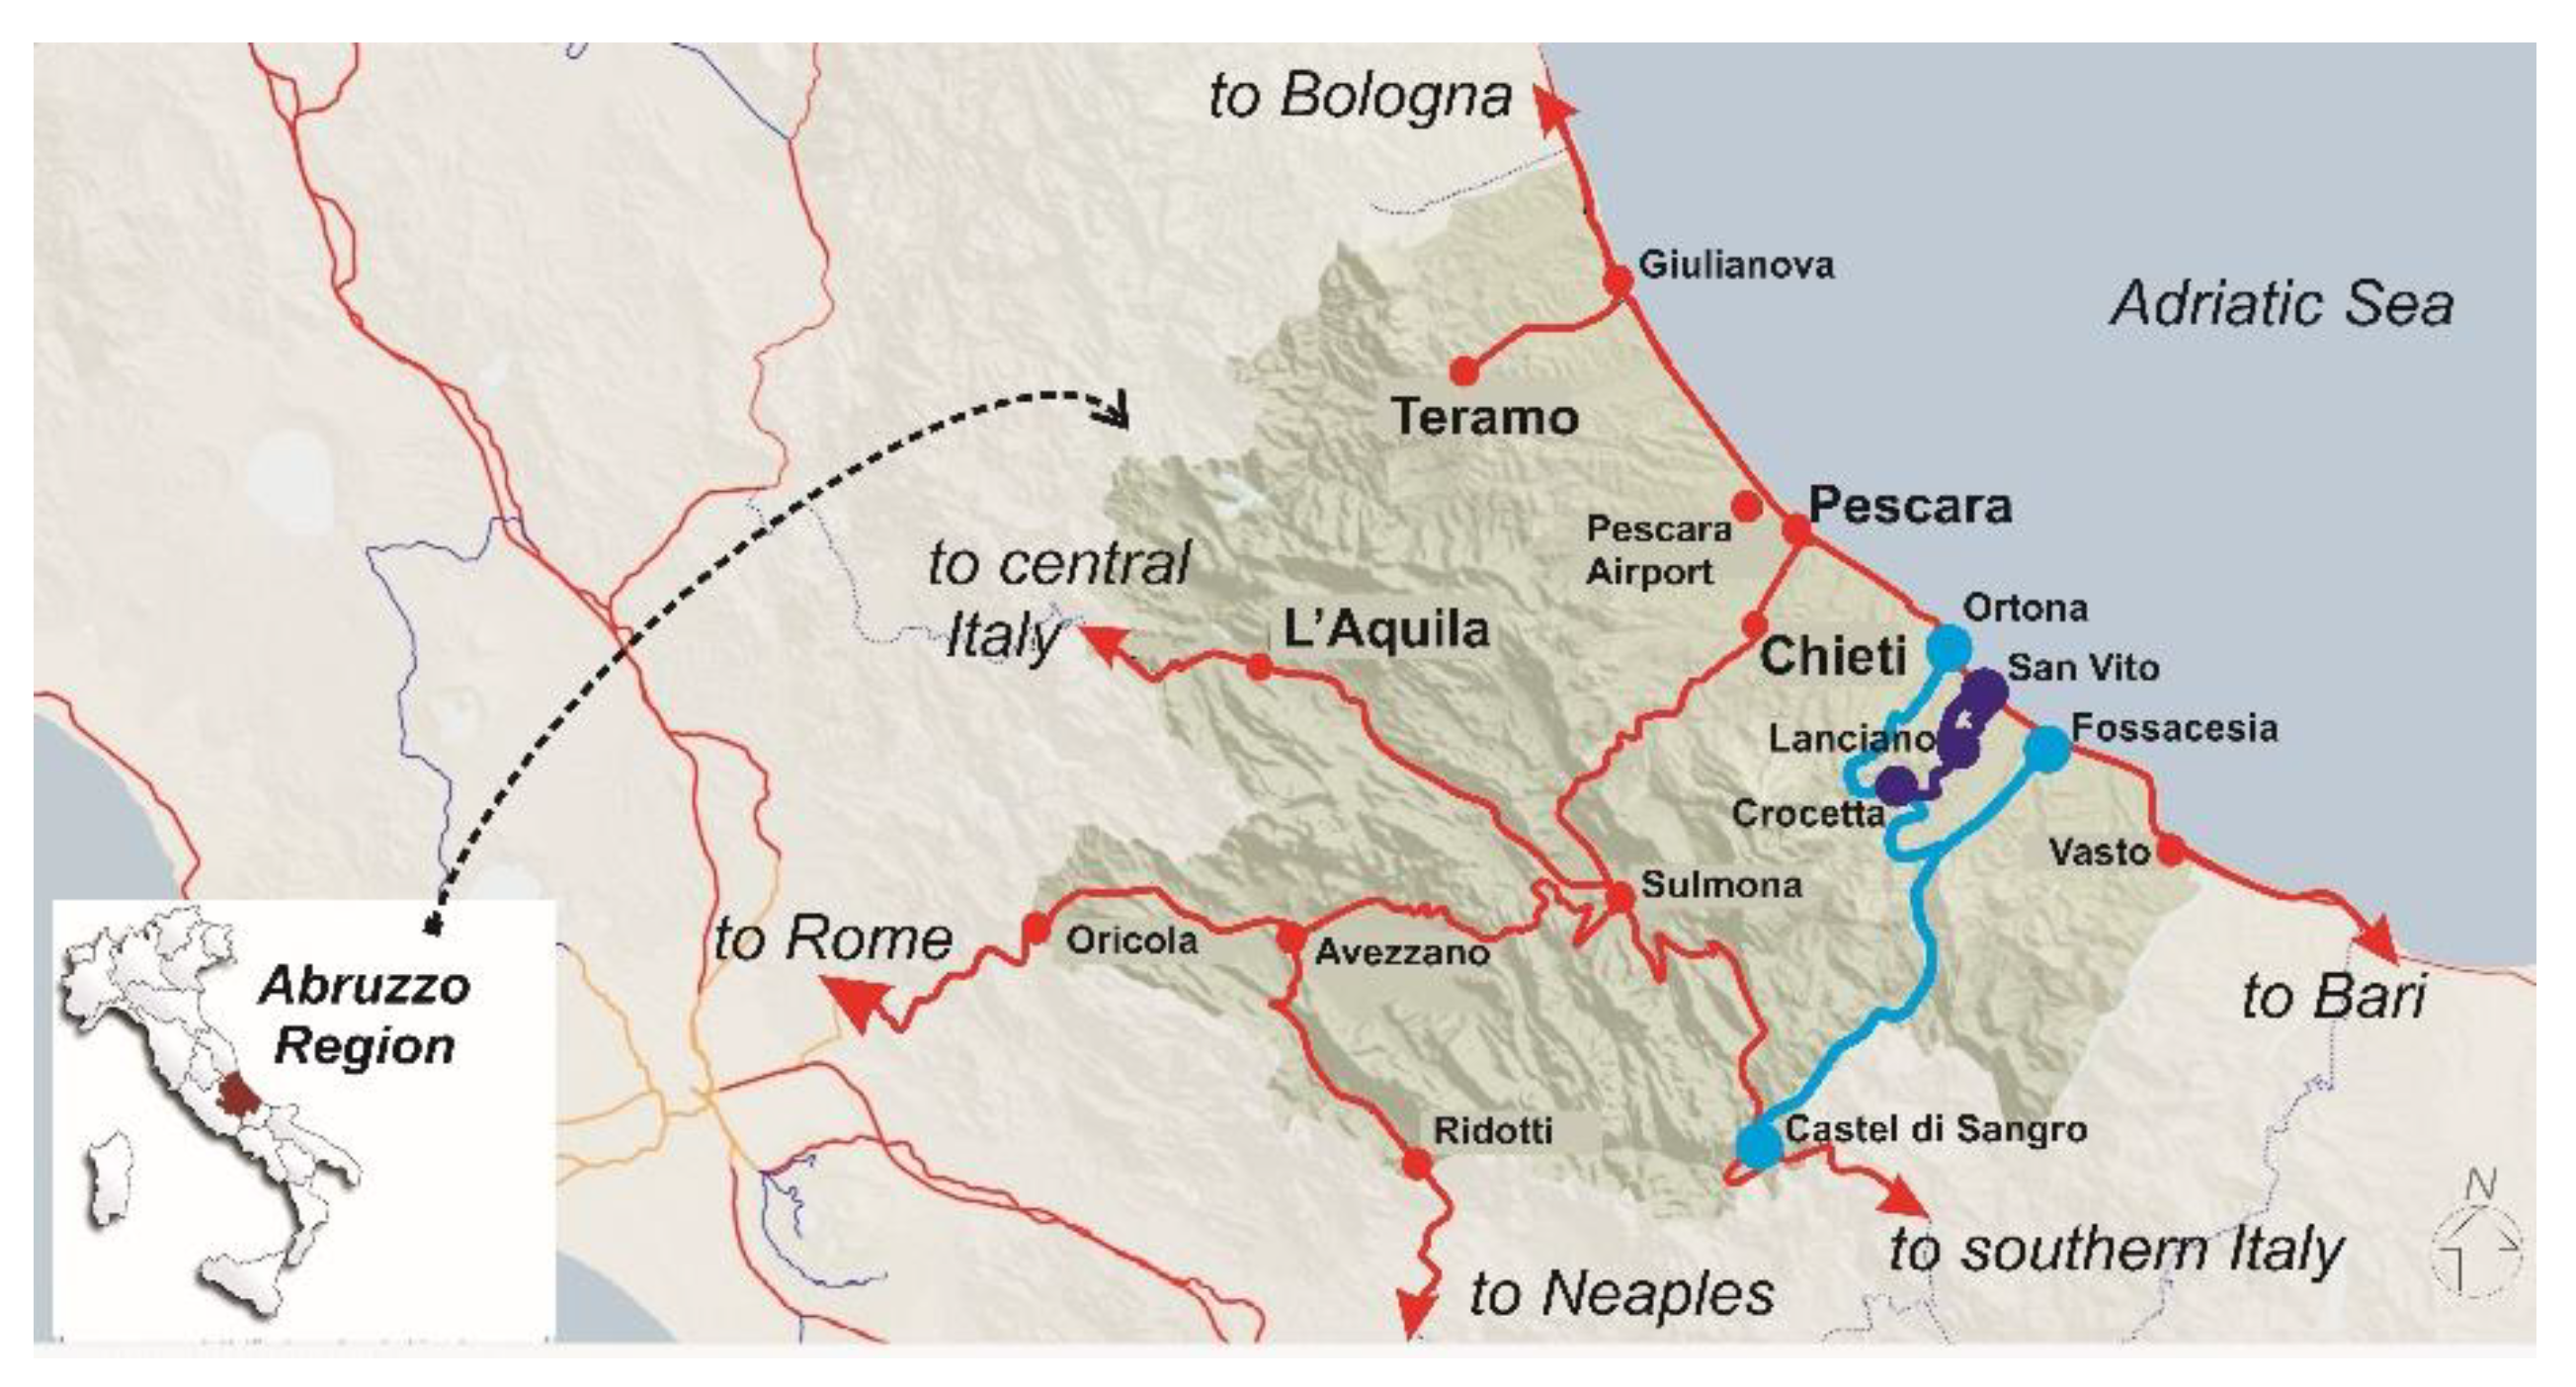
The Sangritana Railway is located in Abruzzo, a region in central Italy (
Figure 1), spreading from the Apennines mountains to the Adriatic Sea. Nowadays, Abruzzo is known for being one of the greenest regions in Europe, but in past times it was one of the most rural and secluded. Its current population density (121 inhabitants/km
2) is still one of the lowest in Italy, 93% of all municipalities being located in hilly or mountain areas [
27]. The specific characteristics of the area must then be considered to adequately understand the rehabilitation challenges for this railway.
Stretching westbound from the mountains to the sea, the local landscape varies from wilderness and isolated settlements (currently parts of a network of natural parks) to the more densely inhabited coastal towns, where tourism gives the most economic boost. The local railway network, built from the beginning of the 1900s on, was specifically designed and developed to link the most secluded areas to the sea and the major urban areas, in and outside the region (
Figure 1). In short, the Sangritana Railway (in blue in
Figure 1) was designed according to a scheme composed of an initial central leg to serve a very scarcely populated inland area, branching off into three “fingers” to further connect with the coastal settlements and the major rail supply (the so-called Adriatica Line, from Bari in southern Italy, to Bologna and Venice in the north).
Since its opening in the 1910s, the Sangritana concession was granted to a local rail company that operated regular passenger and freight services until the 1970s. The line was fully electrified. In the years after, decreased travel demand and some management issues, along with temporary service disruptions due to maintenance, led to a decommissioning of parts of the railway and the replacement of others by bus services. It was only in the beginning of the 2000s, when the railway became part of the national network, that the process for its rehabilitation was launched. Increased population, a rapidly developed territory, new business opportunities, the possibility of being included in the national rail network, and, last but not least, the need to preserve the local heritage and environment were all major drivers in the process, described in the next sections. Moreover, the participation in the ELIPTIC—Electrification of Public Transport in Cities project, funded by the European Commission to promote cleaner transit fleets and exploit electrification in urban areas [
15,
19,
20], provided Sangritana’s current owner, the Abruzzo Region, with new opportunities to relaunch the service and develop a dedicated assessment methodology, elaborated in the next sections.
2.1. The Area to Serve
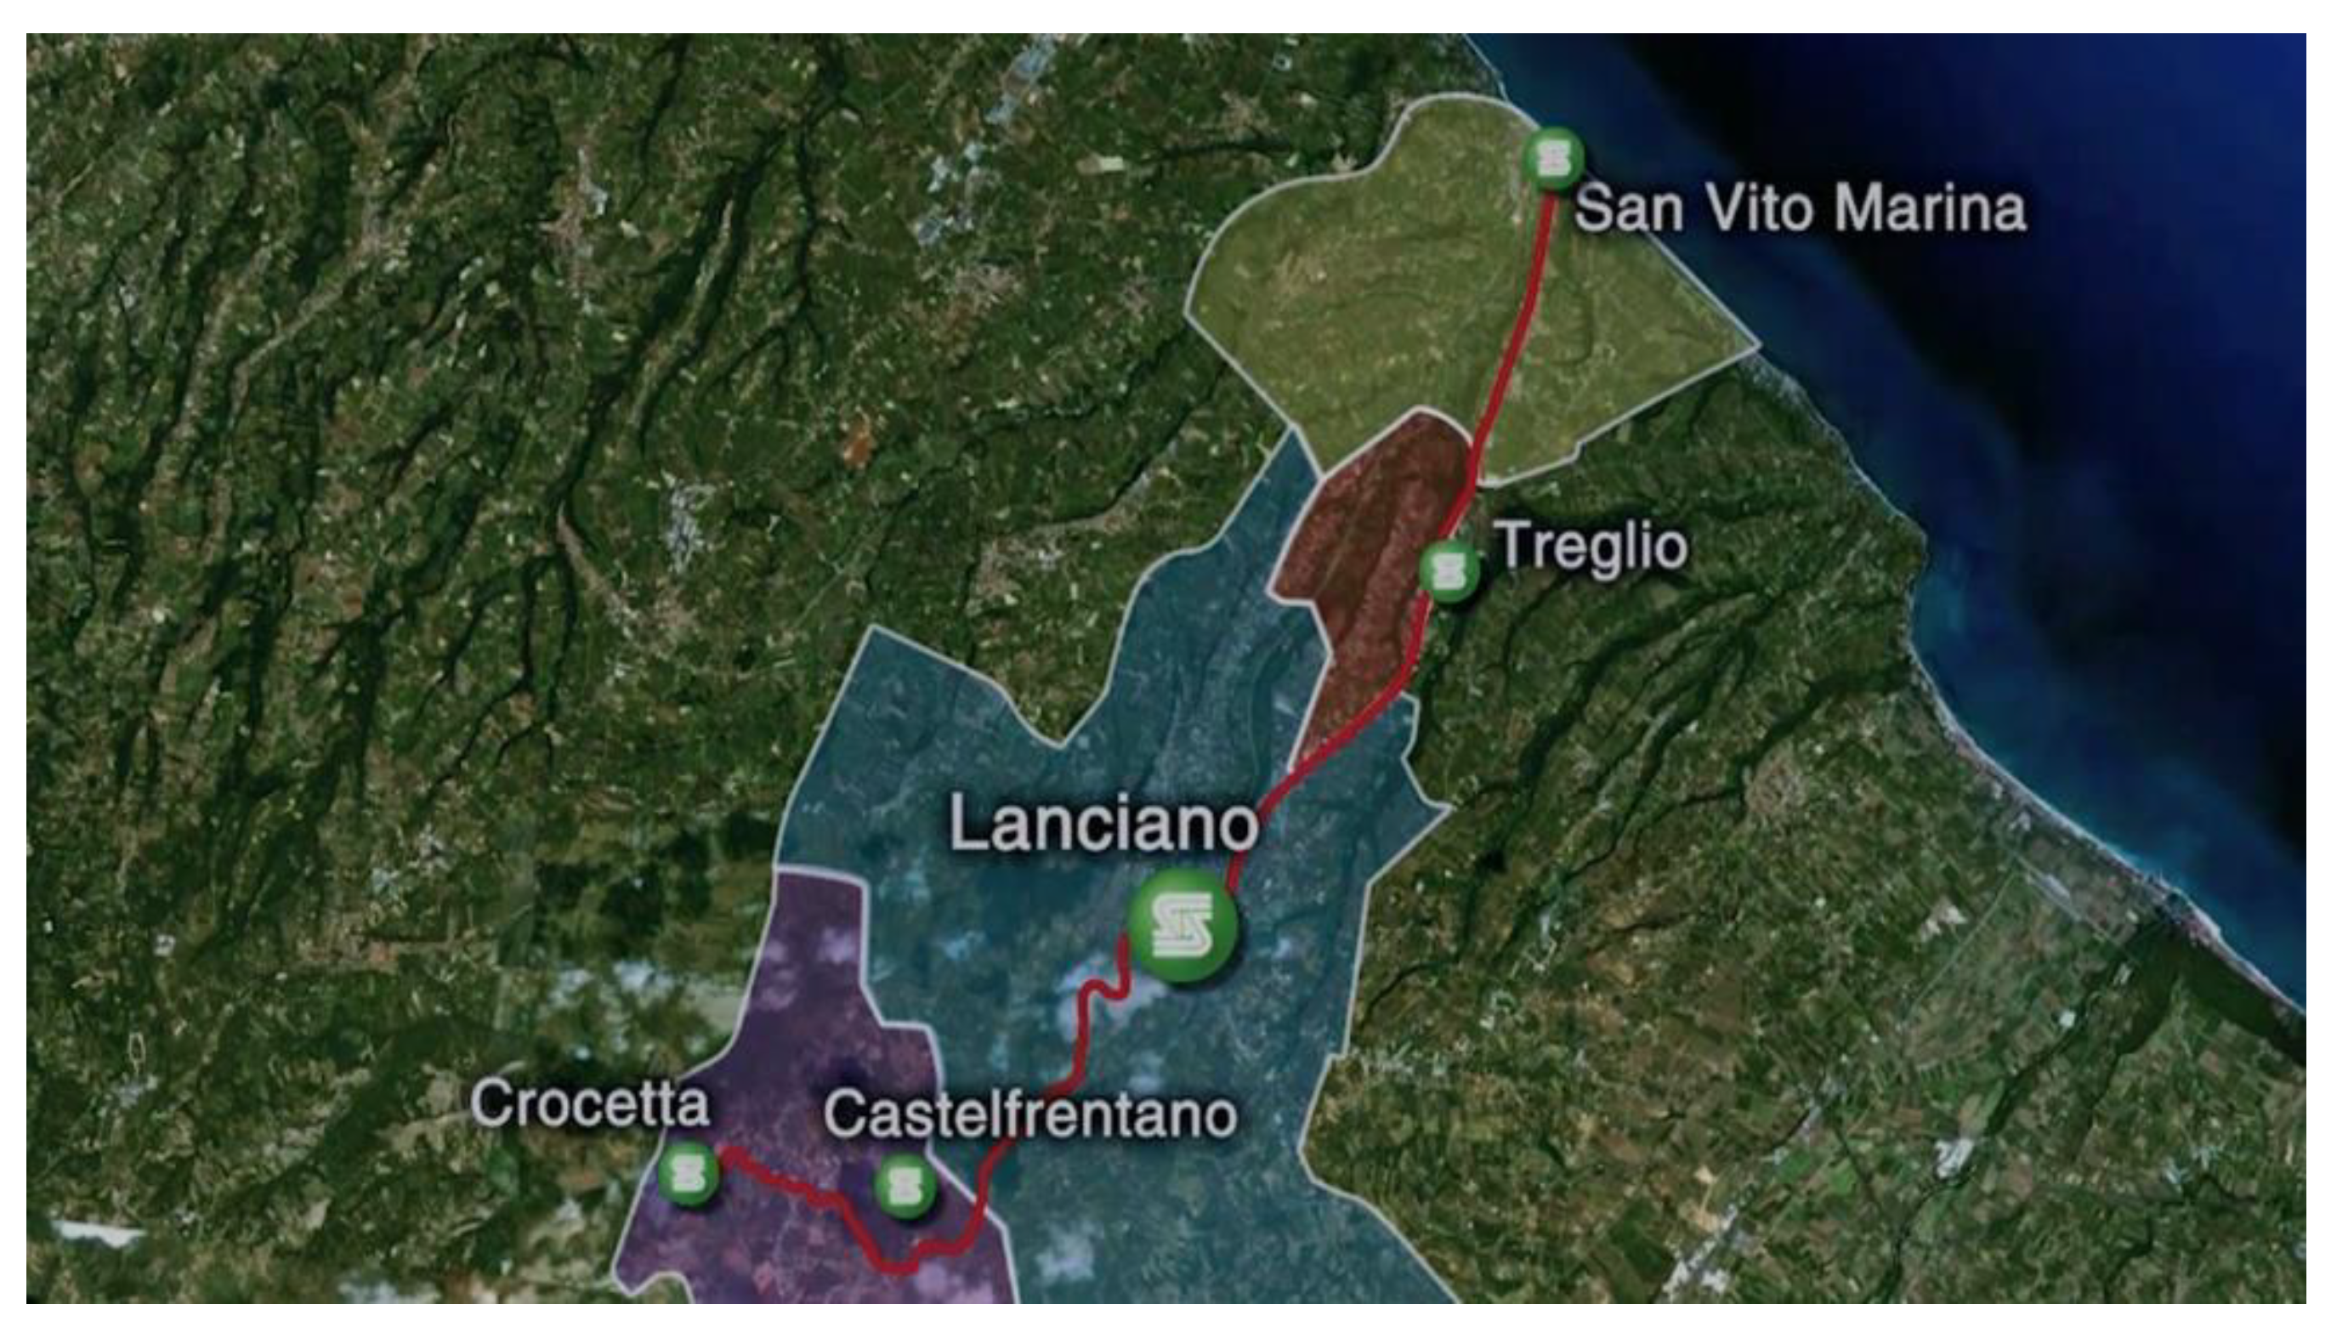
The feasibility project to revamp Sangritana was focused on a specific section, i.e., the central of the three fingers (in dark blue, in
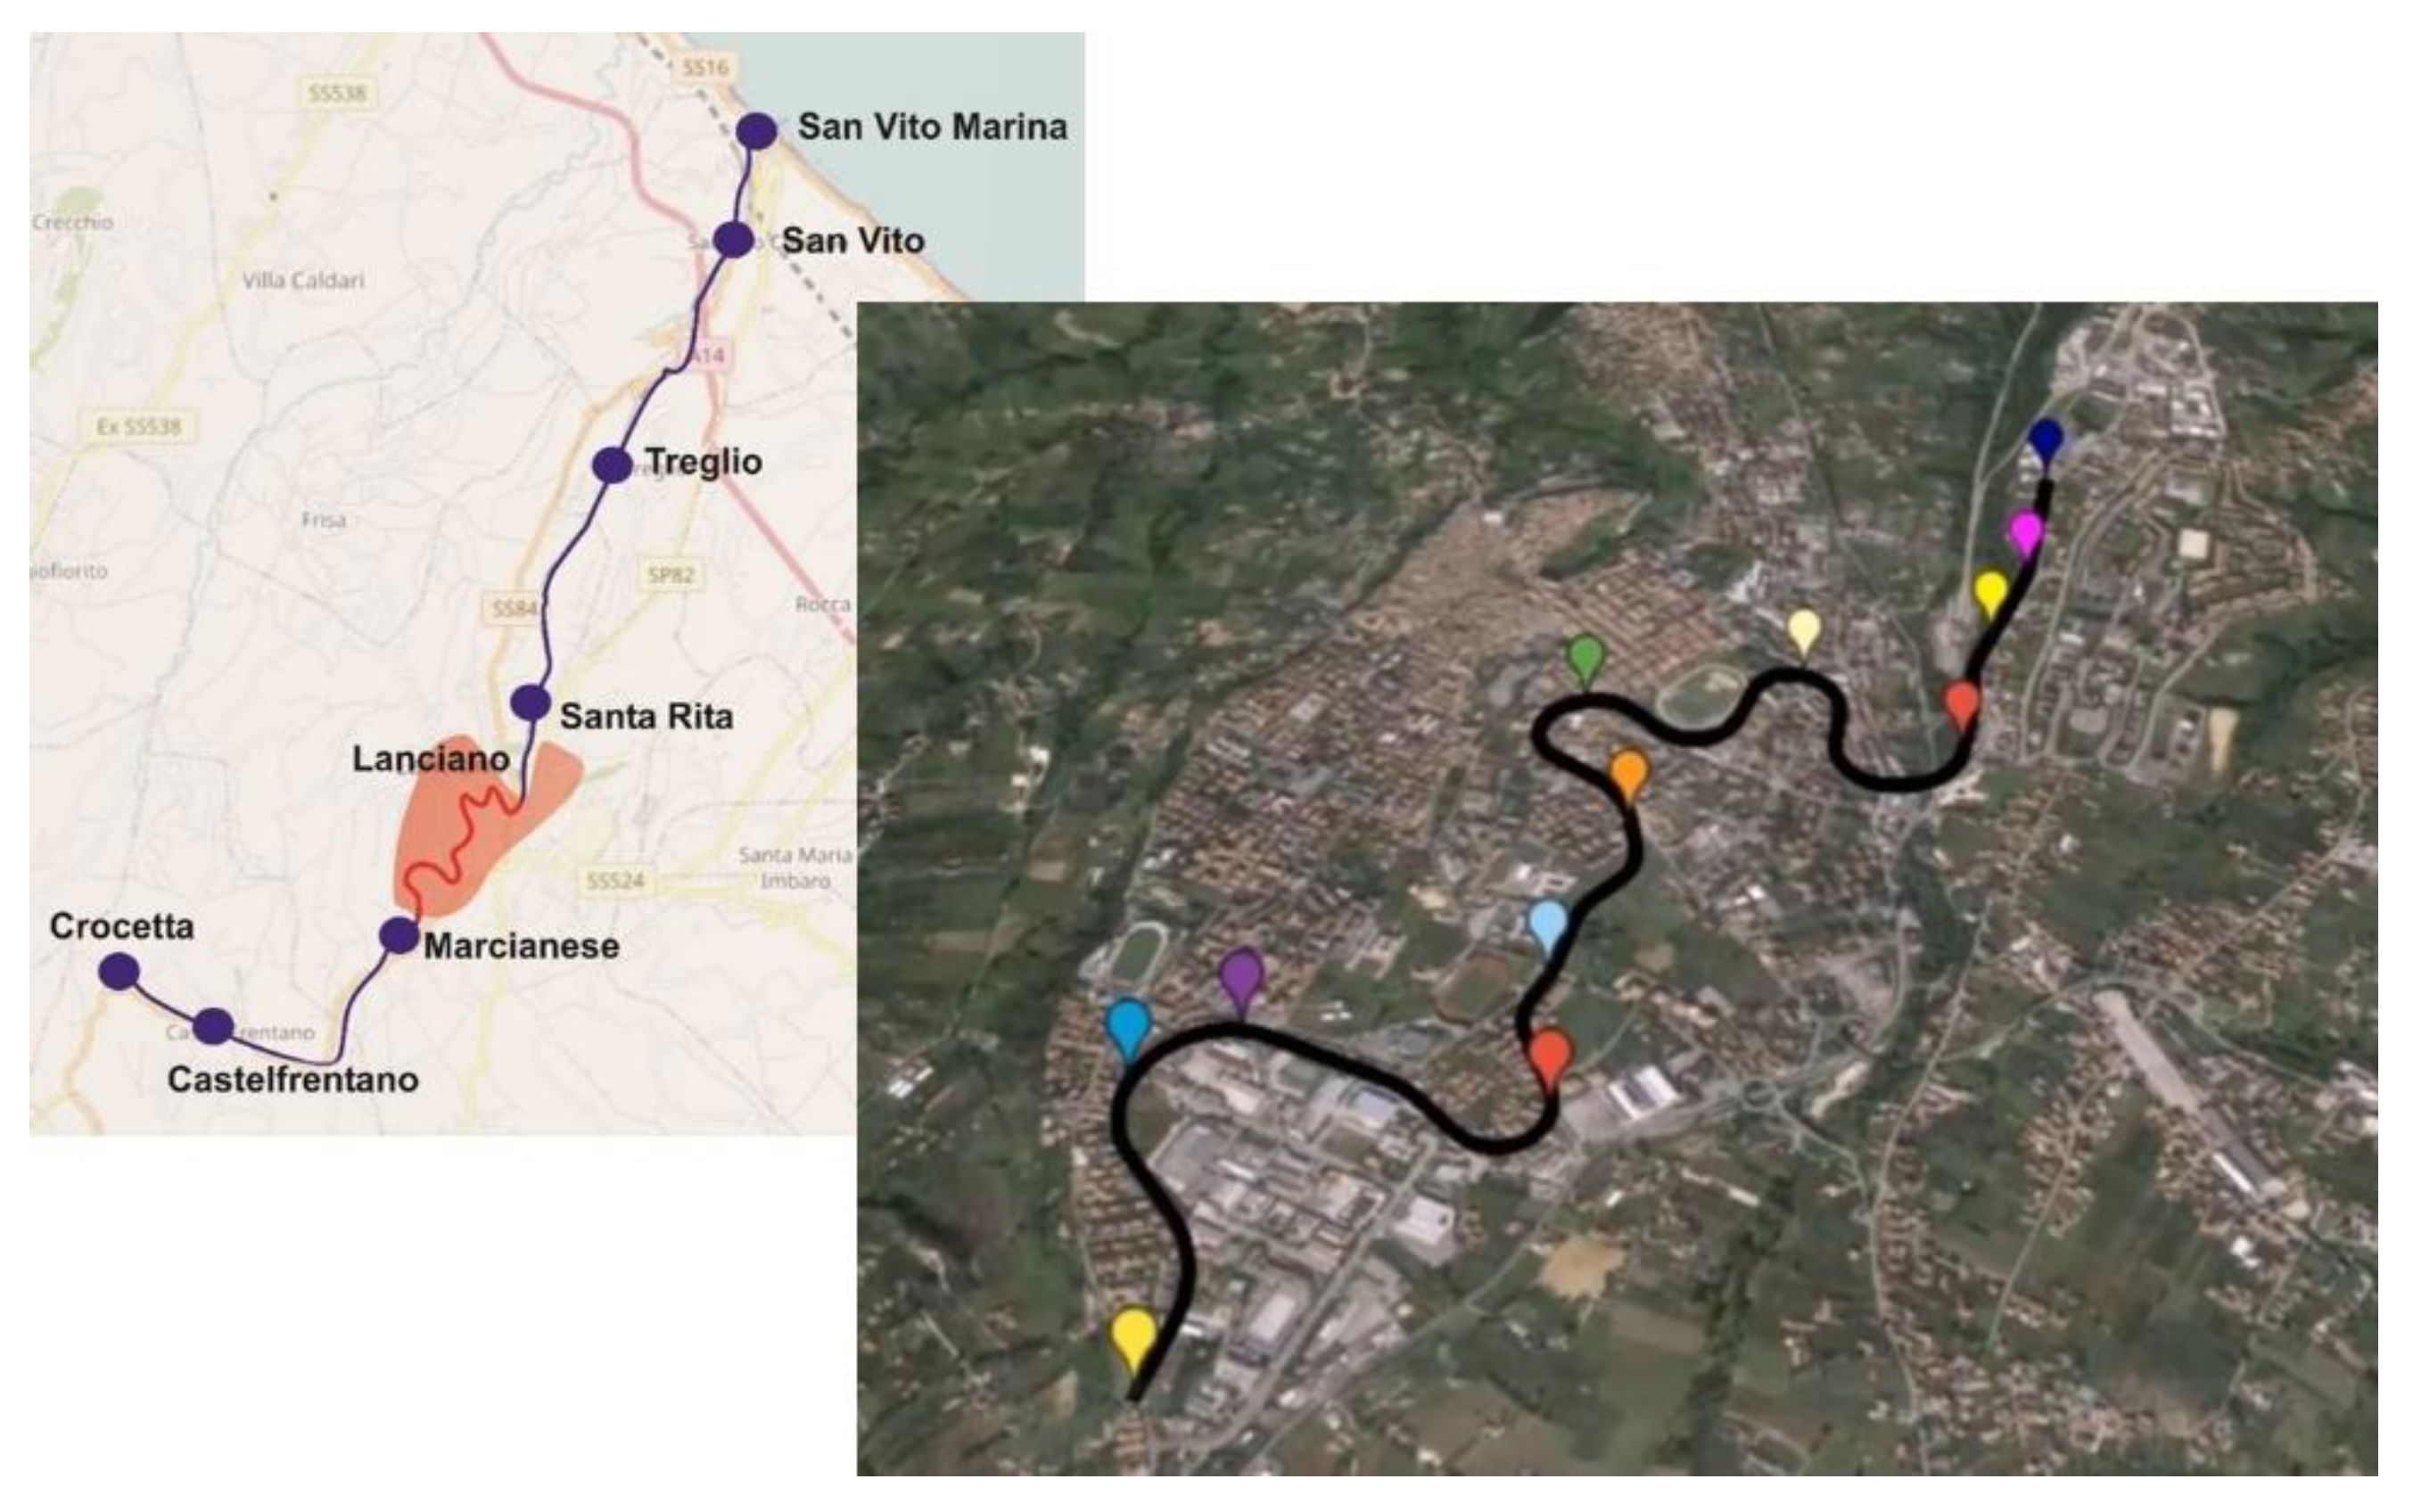
Figure 1). This finger runs through the most densely inhabited and fastest developing areas among those originally served by the whole line. The plan is to restore the service along this stretch and link it to the national railway network at its coastal terminus. More specifically, it is planned to connect the inland station of Crocetta to the coastal terminus of San Vito Marina via the cities of Castelfrentano, Lanciano, and Treglio (
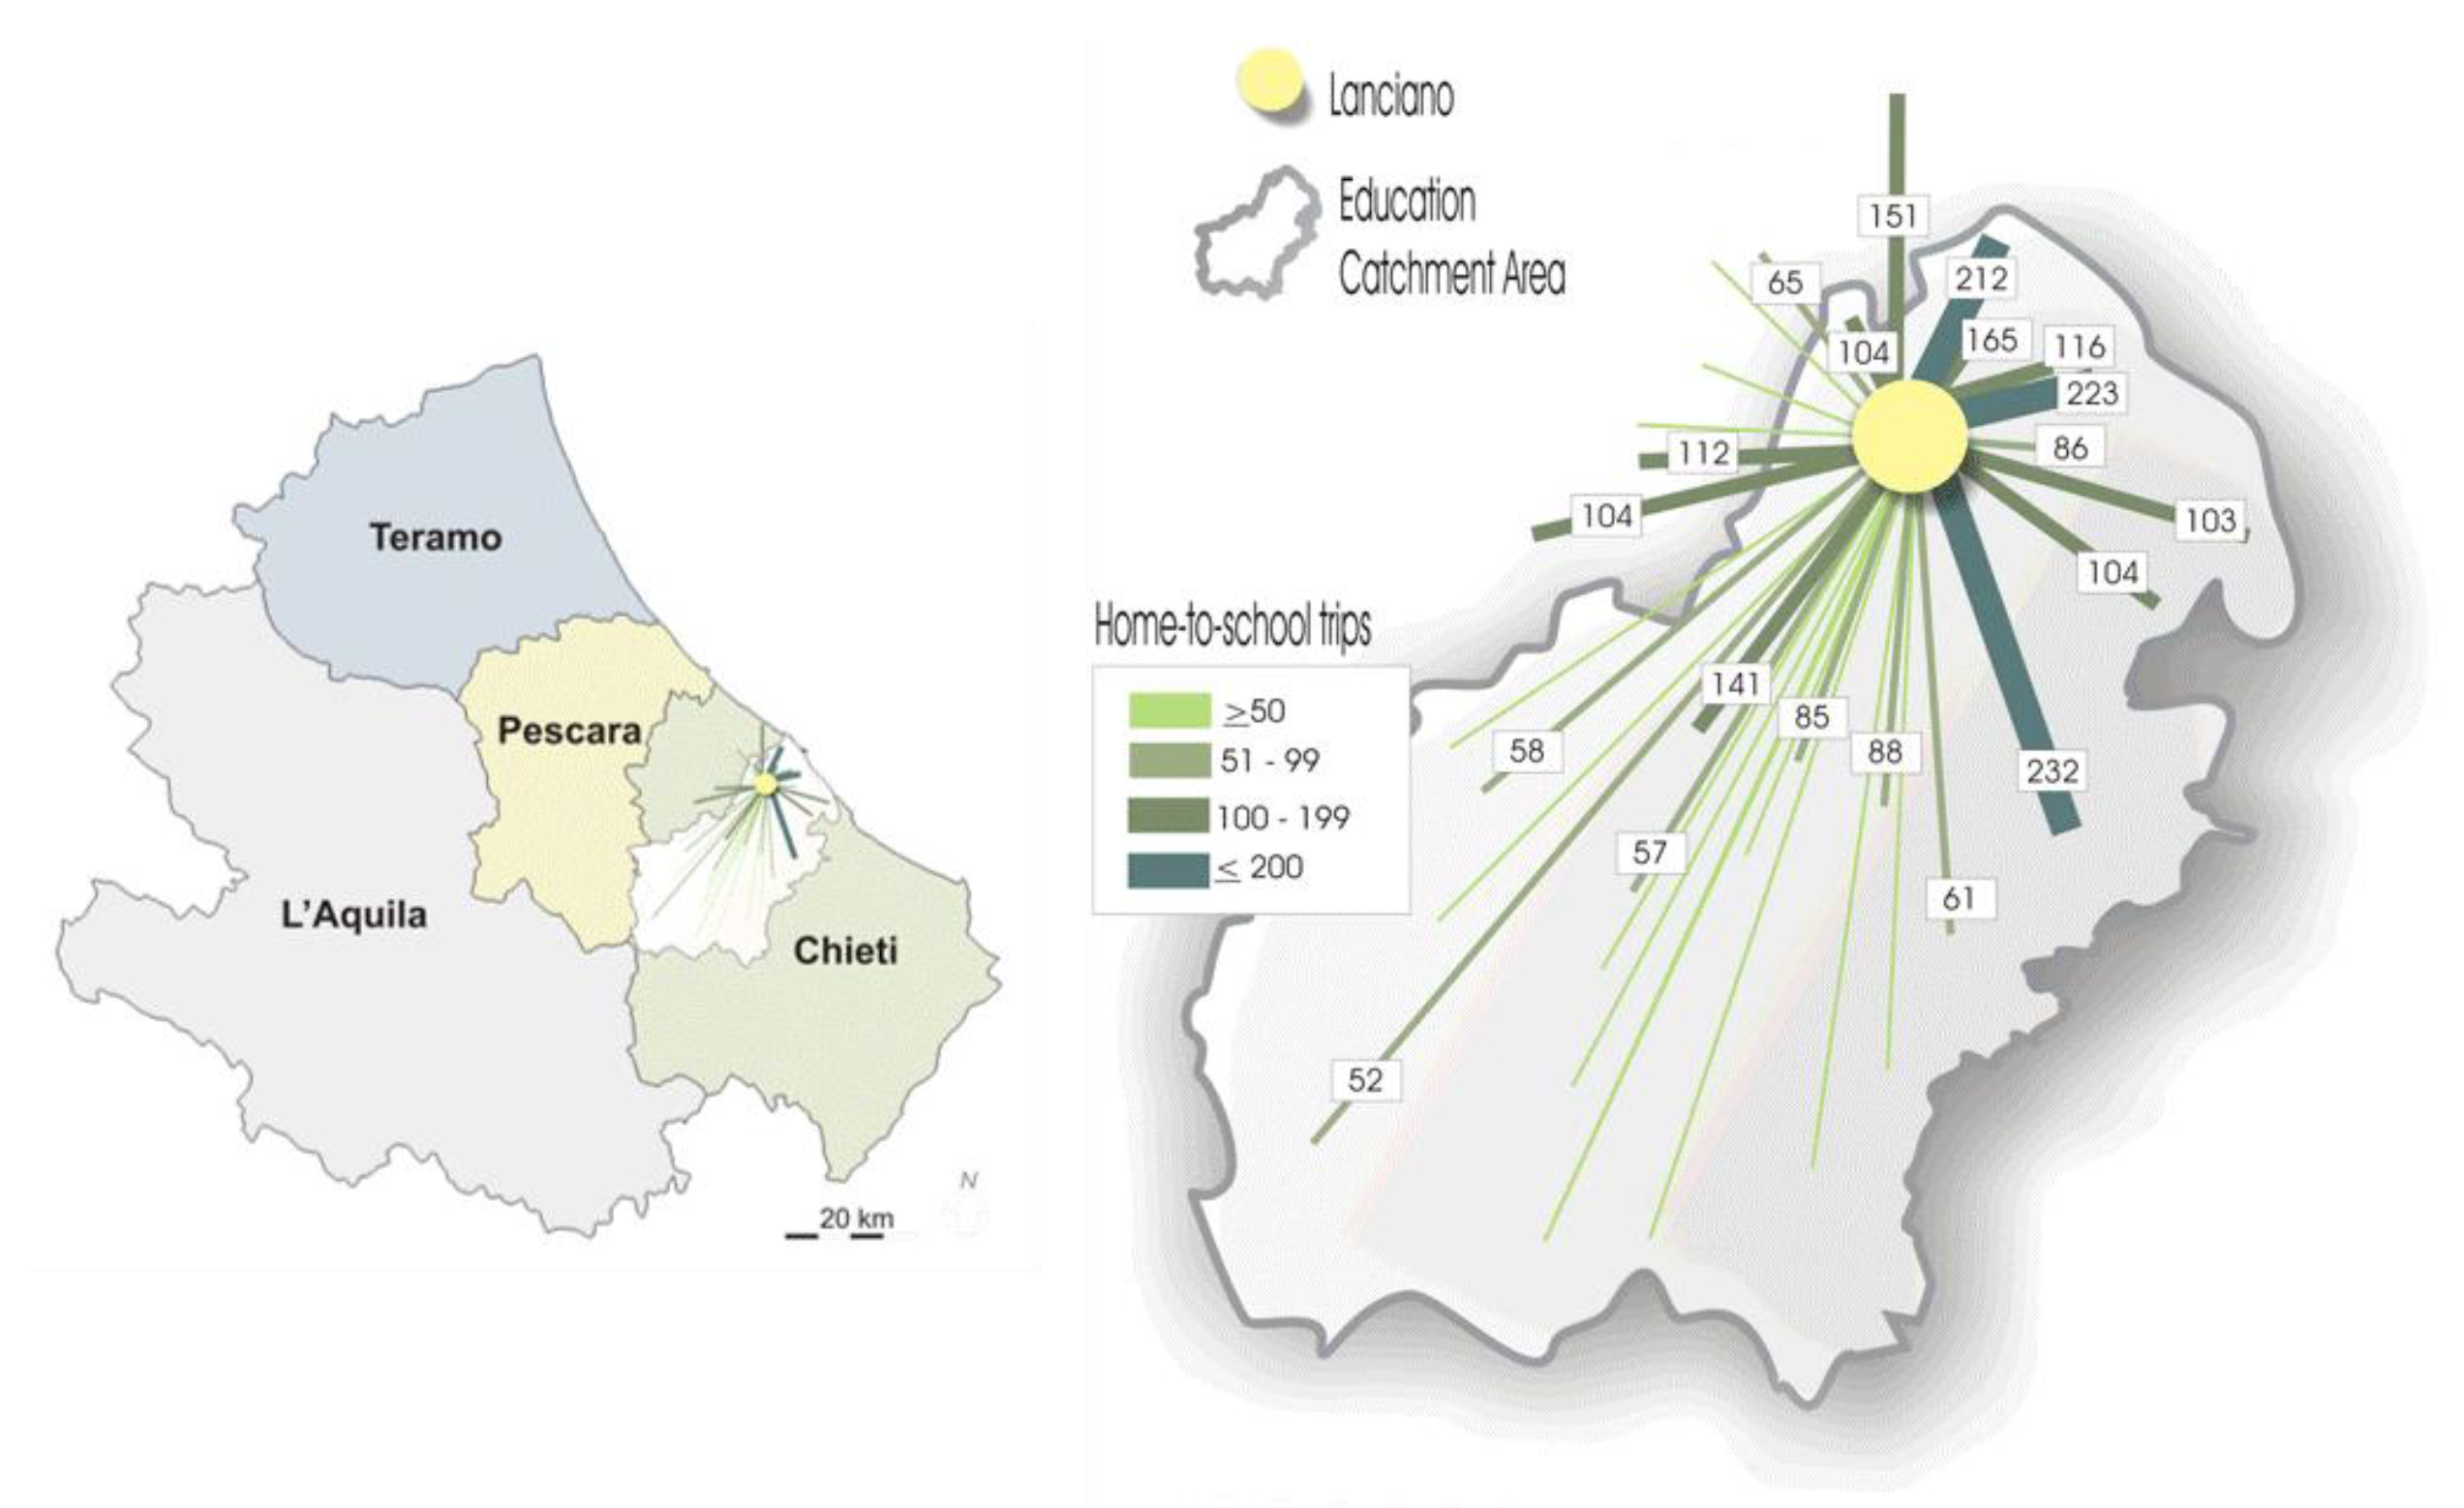
Figure 2), for a total length of about 27 km; at the San Vito terminus the service proceeds northbound along the national Adriatica railway. The finger area is subdivided into four municipalities (Castelfrentano, Treglio, Lanciano, and San Vito) for a total population of 50,000 inhabitants. Lanciano accounts for 70% of such population, but it can be also considered the main routine travel demand attractor and generator due to several local public and private services in the area (governmental agencies, branches of higher educational establishments, schools, commercial facilities, healthcare centers). Agriculture, trade, and manufacturing are core elements in the local economy, along with tourism. The Lanciano fairground, seaside resorts, and the many devotional sites in the area attract around 72,000 visitors yearly.
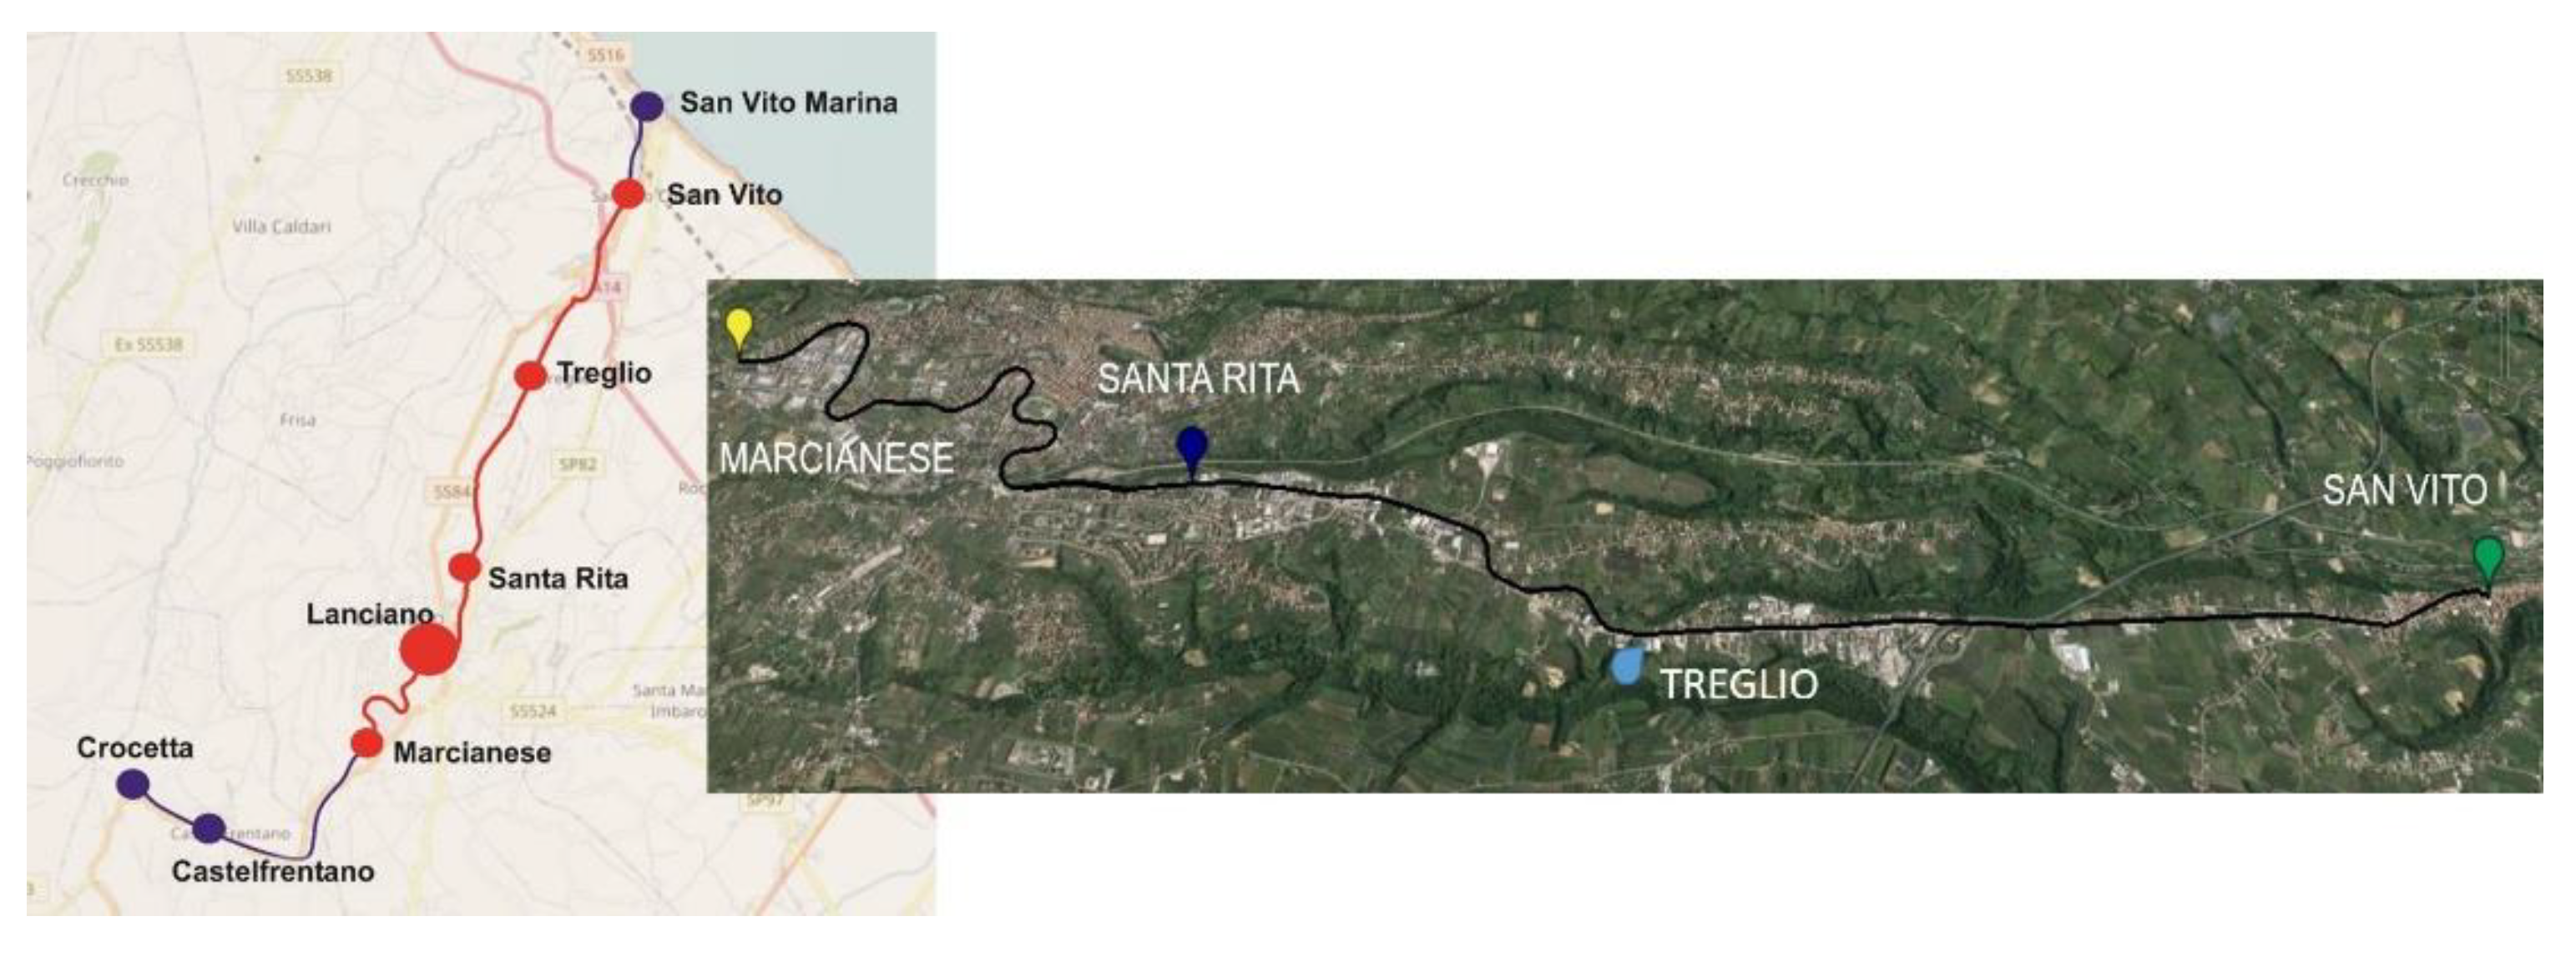
The regional transit agency TUA (Trasporto Unico Abruzzese), operating both rail and bus services, supplies Lanciano with 11 bus lines (of which three are in the city center, with a modest daily mileage). More rubber-tired services supply connections to more distant cities in the Abruzzo region and beyond, but there is no transit service among the four municipalities in the area. The restoration of the no-longer-operating rail service along these municipalities becomes, then, a natural and environmentally-appropriate measure to shift the travel demand from passenger cars to transit, although an ambitious and challenging one. The routine travel demand pattern originates in the very different land-use mix and functions concentrated in the Lanciano area, synthesized above. Specific surveys and traffic counts reveal a robust commuting traffic both home-to-work and home-to-school. As to the former, commuting occurs mostly along a 10-km strip connecting Marcianese, the suburban area of Lanciano, to the nearby San Vito municipality via the Santa Rita business park (
Figure 3).
Along this corridor, 8352 commuters and 3330 students ride daily by car, from 7:00 to 8:30. Additional non-routine trips by car, due mostly to shopping, are generated along the Santa Rita–San Vito stretch, corresponding to 9870 travelers during two peak time periods, respectively, from noon to 13:00 and between 17:00 and 18:30. As regards home-to-school, the commuting demand to Lanciano (eight high schools, with an average population of 4200 students, plus several graduate and post-graduate courses at two university local branches) originates also from distant municipalities (
Figure 4, with the Lanciano destination centroid in yellow).
2.2. Directions from Best Practice to Rehabilitate the Local Railway
The traffic generated by commuters is not negligible for a small conurbation like the one at hand, and the recurring congestion phenomena along the corridor in
Figure 3 stress the imperative to shift from cars to transit. That railway should be the eligible choice is not only dictated by the higher capacity of this option over cars, the availability of the local infrastructure, and the need to operate more environmentally-friendly services, but also by a series of best practices found especially in Europe, where demand, population density, and land-use patterns are close to those of the Lanciano area, that clearly demonstrate that light rail, and, more specifically, tram–train are viable options.
Tram–train, first developed in Germany, was planned and designed to serve scattered, medium- to low-density inhabited urban areas. By combining the infrastructure and operations of both modes, with trams and trains mutually using tracks and stops, this travel option proved to be successful and was soon replicated elsewhere in Europe [
28,
29,
30,
31,
32]. Tram–train is a best practice that can be transferred to the Lanciano area, too, although a mix of opportunities and constraints is to be highlighted.
2.2.1. Opportunities and limitations
Scientific literature shows two specific tram–train features that qualify this mode for the Sangritana case, i.e., the opportunity to exploit the already available infrastructure; and its capacity and size, suitable to operate in mixed environments (from consolidated urban streets to newly-built or rural roads) [
30]. Moreover, considerations of capacity support the suitability of tram–trains to operate in small towns like the four municipalities at hand, where local passenger volume would be too modest to be served by a conventional regional rail service. One more advantage is the same gauge for both Sangritana and the national railway tracks on the Adriatica Line, which enables the connection between the two links at the coastal terminus at San Vito (it is noted that Sangritana underwent a massive adaptation in 1956 to pass from narrow to standard gauge).
Eventually, the overall rail asset rehabilitation, which would result from the introduction of the tram–train, but also in general from restoring any light-rail services, is coherent with the regional transit agency’s vision of attracting visitors to the area to further consolidate the role of railways for residents. A case is already available: the recent reopening of a nearby historic line (the Castel di Sangro–Fossacesia scenic railway) by TUA was specifically planned to attract tourists with the goal of operating regular passenger services on the near horizon. By contrast, possible constraints are often associated with transit electrification in consolidated urban areas: power supply (where to install catenaries and, more specifically, their visual impact); affordability; streetscape redesign to accommodate rail stops and tracks [
20,
24]. In the case of Sangritana, the availability of an existing infrastructure markedly mitigates all of the above, as elaborated in
Section 3 and
Section 4.
However, the local decision process illustrated different sorts of obstacles. An initial issue was the perception of transit as a marginal opportunity by people used to driving, even for short trips. The innovation potential of revamping the rail service was at first underestimated by the local population and even thwarted by more appealing, competing ideas. The proposal launched by some advocacy groups to turn the abandoned rail infrastructure into a bike trail was one of them, but an accurate analysis proved its unaffordability. The costs for dismantling and disposing of the rail superstructure (tracks, ballast still in place) to accommodate the bike trail were much higher than those needed to reintroduce a light-rail service, thus resulting in a fast dismissal of the bike-trail option. It is also to be noted that successful examples of the conversion of rail tracks into bike trails or walkways call for massive streetscaping (for example, the Bastille Viaduct in Paris [
33]) and adequate funding [
34,
35].
Nevertheless, the economic efforts of restoring an abandoned railway like Sangritana are not negligible and also introduce additional technical issues to be addressed (further reported in
Section 3.3 and
Section 3.4). In this case, even though the superstructure can be “recuperated,” the catenary is partially dismantled and the power supply system in need of modernization. Expenditures for the new rolling stock and staff to operate the new service need to be taken into account. The former also might call for specific restrictions to enforce when tram–trains circulate on the national railway network: Italian standards and regulations on contemporary circulation of different categories of rolling stock on the same line are exceptionally strict, therefore specific rules are expected to be enforced accordingly.
2.3. The Adopted Methodology for the Feasibility Assessment
The abovementioned participation in the ELIPTIC project was the occasion for a full assessment of the tram–train service feasibility. To this end, along with the study of the operational, economic, and environmental aspects, a dedicated Strength Weakness Opportunity Threat—SWOT analysis was developed to stress general drivers and barriers to promoting electrification in the project case studies, and among these, the Sangritana’s. The SWOT methodology is extensively described in [
20]. This assessment relied on an initial data collection on local conditions and operational requirements to qualitatively build a reference scenario for the further development of the SWOT analysis, whose results created, in turn, the so-called Technical Viability assessment, described in the next section.
It is to be noted that the use of SWOT analyses in the field of technology assessment of electric mobility is still uncommon in scientific literature [
36,
37,
38], but within ELIPTIC it became a key analytical framework, which enabled the building of a reliable feasibility scenario.
Eventually, the outcomes of the SWOT analysis were also summarized, critically reviewed, and synthesized in the form of key findings to assess the transferability potential at the European level. Evaluators in the whole assessment process were all participants in the ELIPTIC evaluation team (academics and high-profile experts) or members of the ELIPTIC User Forum (public transport operators, local authorities, and practitioners), all selected on the basis of their substantial expertise. They all provided an independent assessment of results.
3. Results from Feasibility Assessment
The assessment goal was to highlight any potential hindrance to the development of the new service. To this aim, the evaluation was multi-scope and subdivided into several tasks: the quantification of the potential demand that the new tram–train could attract; the new operational requirements with a focus on the energy issue; the potential environmental benefits; a general expenditure breakdown; and eventually the concluding evaluation of the SWOT analysis outcomes.
The reference scenario was built on the performance of the bus operations currently replacing the rail service. The bus service is operated by a private company and mostly serves the Lanciano area, not covering all four municipalities. A couple of figures convey the extent of the service: a small fleet of six vehicles regularly operating daily in the city center, resulting into an annual mileage of 720,000 km. All are diesel-fueled, each with 220 kW engine power and no auxiliaries. Each vehicle has a passenger capacity of 60 units (seated and standing), supplying a monthly passenger demand of 300,000 passengers/km. Commercial speed is rather low, 11 km/h, and routes have an average number of 13 stops, with a dwell time not exceeding one minute. To be noted is a high mileage due to empty journeys back and forth from the local depot, accounting for around 34 km daily per vehicle [
39].
It is not surprising that the service is modest, given the high motorization rate of the area: 620 (as the ratio number of registered vehicles/number of inhabitants × 1000, in 2017 [
40]) and the generated congestion phenomena in the area reported in
Figure 3, along with those in the central areas of Lanciano. Accordingly, a specific assessment of the potential demand to attract from passenger cars was developed, also in relation to peak and off-peak traffic phenomena observed.
3.1. The Potential Demand
The assessment of the demand was specifically focused on a sensitive area, i.e., a 5.65-km strip in the Lanciano municipality (
Figure 5). This area is representative of the general local congestion problems, but it is also the most densely inhabited in the whole conurbation. Main tasks were the identification of the peak traffic slots (according to the traffic counts and the surveys on routine and non-routine trips, previously described in
Section 2.1), i.e., the demand-time assessment, and the assessment of the catchment areas for the new rail service, i.e., the demand-area assessment.
As to the former, according to the traffic counts, it was possible to identify five different peak times for a total estimation of around 6400 passengers to be potentially diverted from passenger cars to transit. Such slots are partly overlapping, thus virtually affecting the circulation all day long, more specifically:
Slot 1: 7:00–8:30, mostly home–work and home–school trips;
Slot 2: 12:30–14:00, mostly school–home trips;
Slot 3: 18:00–19:30, mostly work–home trips;
Slot 4: 9:30–11:30 and 14:00–16:00, home–downtown leisure (shopping and/or other personal purposes) trips;
Slot 5: 12:00–13:00 and 16:30–19:30, downtown–home leisure trips.
This demand-time assessment was used to outline the main operational requirements to plan the new tram–train service described in
Section 3.2. Within the demand-area assessment, a new service is planned to have a total of 12 stops in this central area (highlighted with different colors in
Figure 5) with spacing not exceeding 1 km along the old Sangritana railway tracks. Such stops are to be within walking distance of all main attractors, with the priority of serving schools, given their relevant generated commuting traffic. Each stop is associated with a catchment area, according to an Origin—Destination zoning resulting into 12 tracts.
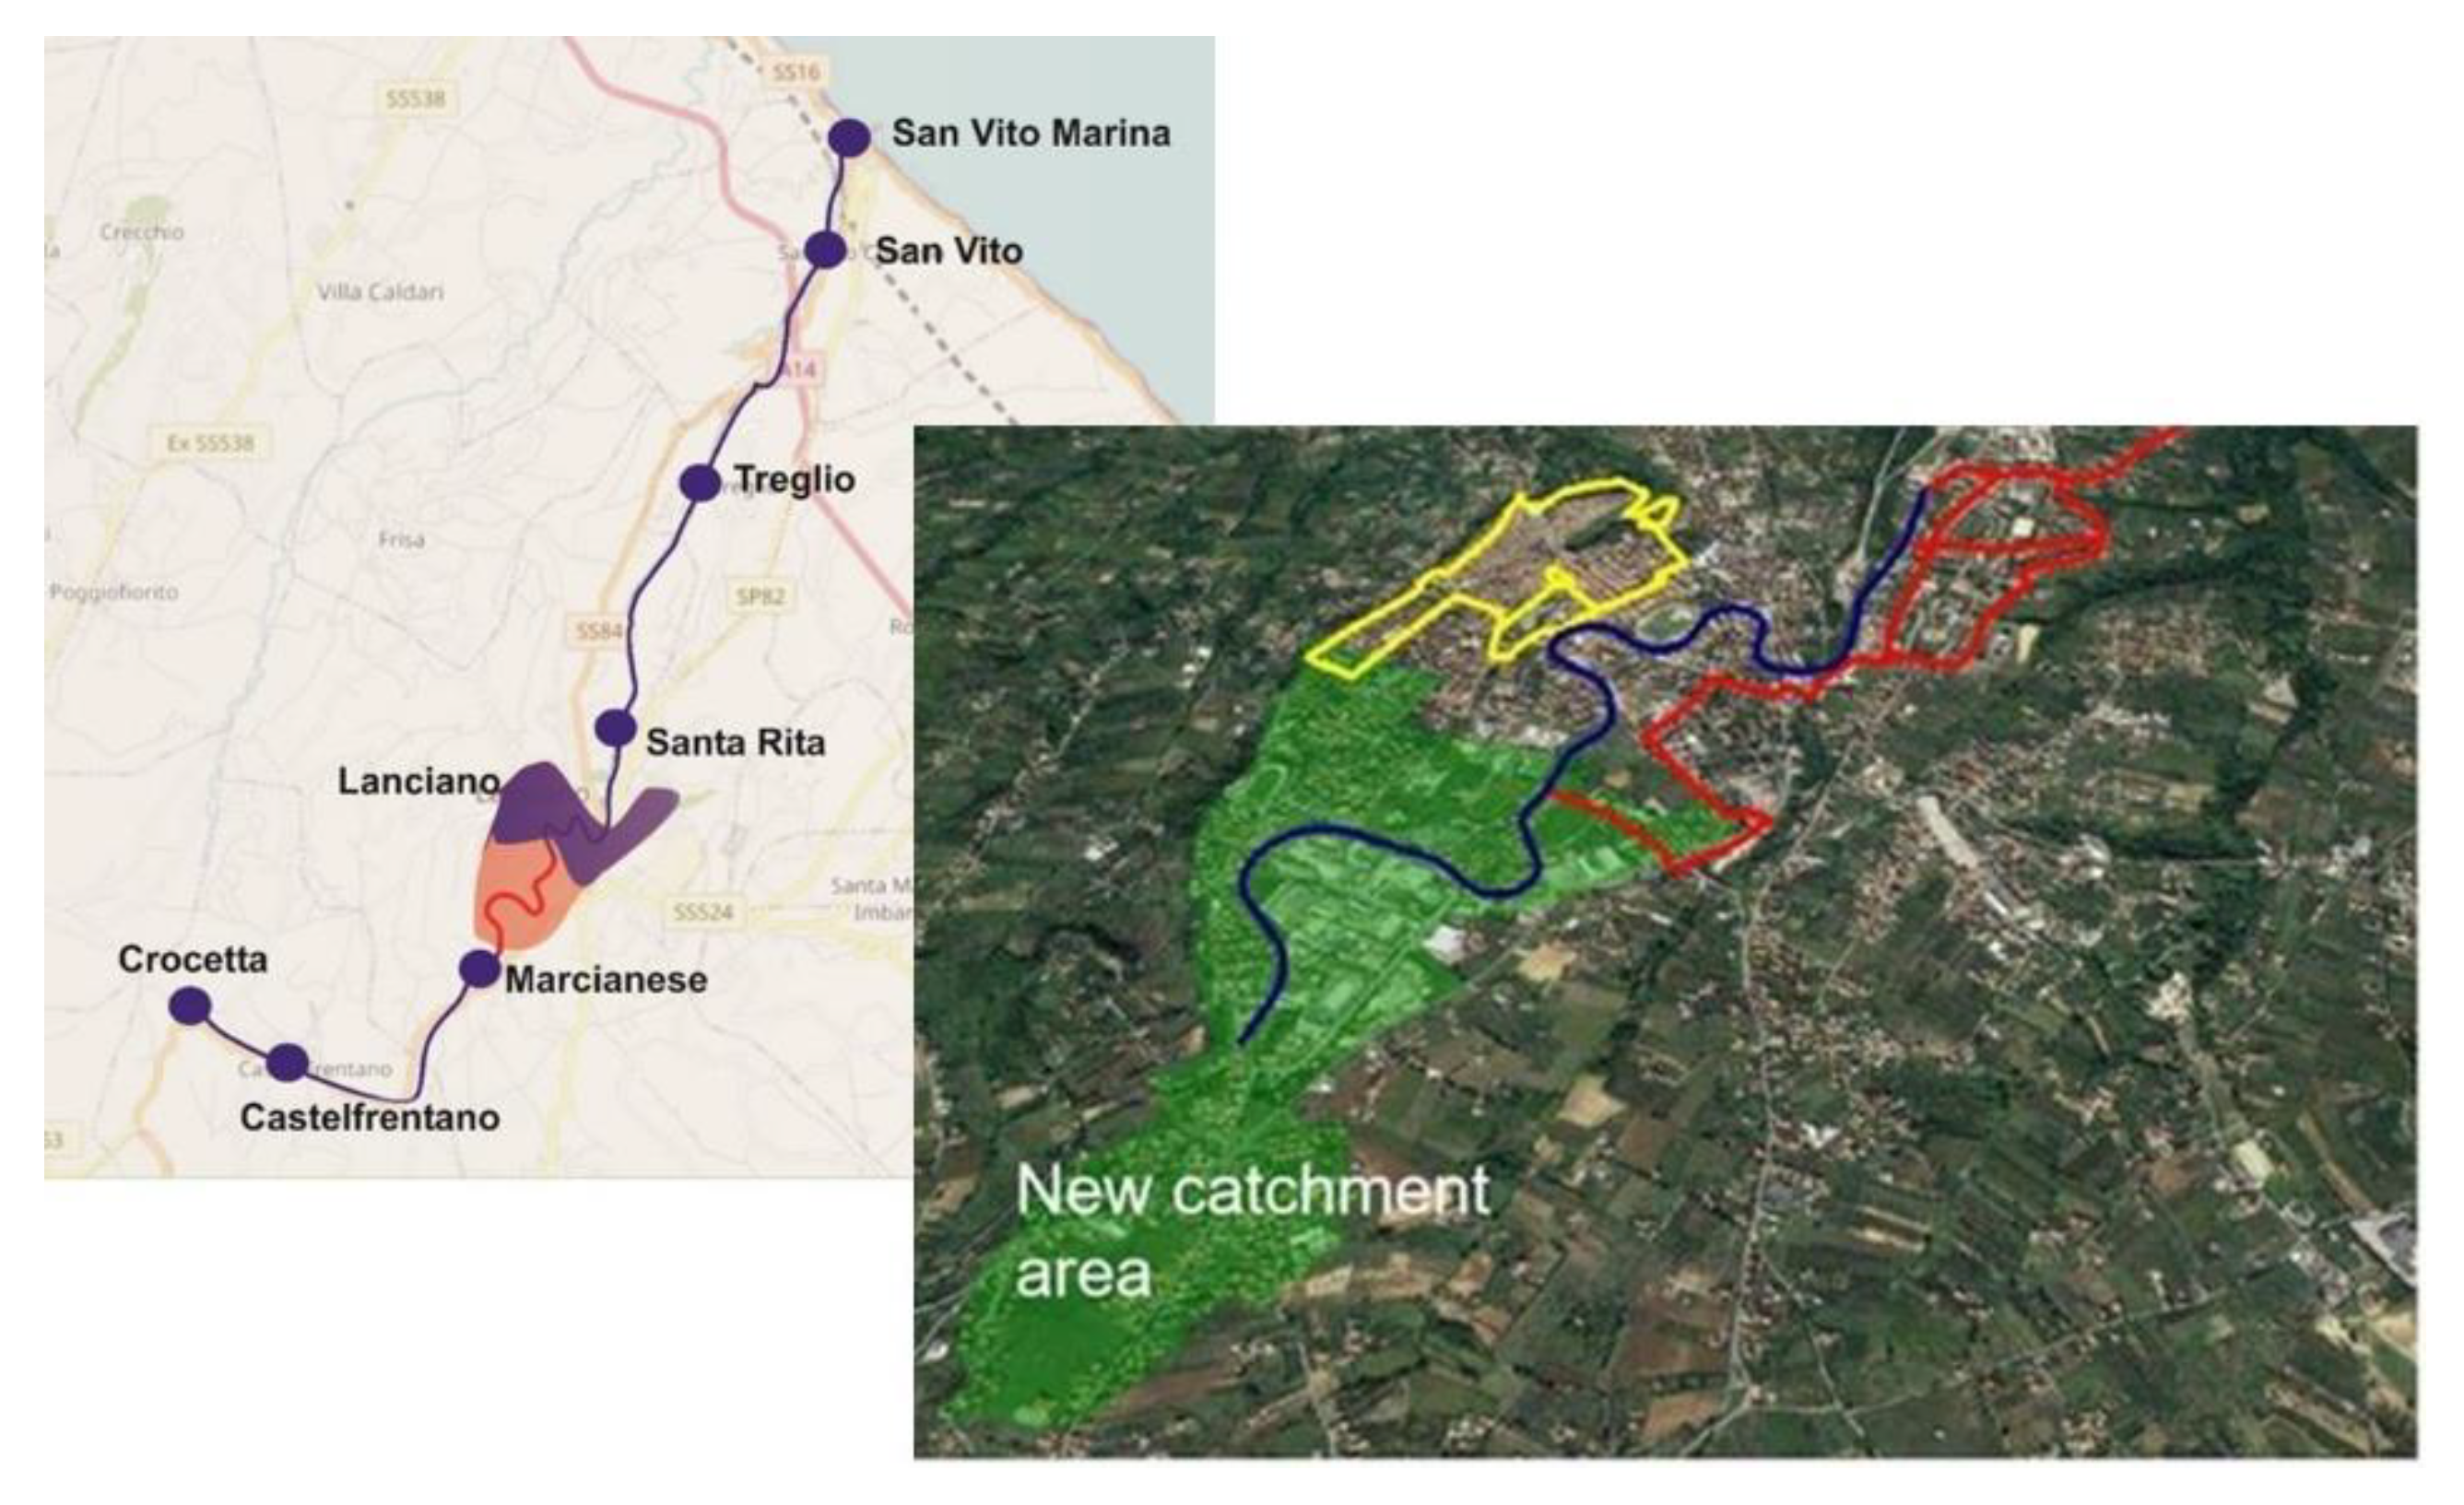
Stops located along the lower bend in
Figure 5 are specifically planned to connect areas where currently no public transport service is available; this is limited to the nearby areas as shown in
Figure 6, where two out of the three bus routes currently operational are marked in red and yellow. This new service configuration is expected to be beneficial as the new catchment area is specifically designed to attract a so far unmet demand; the new tram–train route, by serving in a capillary way the urban environment, can potentially attract 13,615 users, i.e., around 40% of the local population, only in this area.
3.2. Planned Operations
The critical traffic slots described above serve as a basis to plan the tram–train operations. Main service assumptions are to operate three vehicles with a capacity of 160 passengers, with schedules based on 20-minute headways (to be reduced to 15 min, in peak times) and a commercial speed of 22.5 km/h. Service is planned to run year-round (365 days), from 7:00 to 21:00, to operate 13,797 rides (two-way) per year. This is expected to produce 160,000 train-km yearly (including mileage to/from the depot), with a corresponding average mileage per train of 53,000 km. A 7-unit driving staff is required. Thus, the planned service performance would be much superior to those currently supplied by bus in terms of capillarity (
Figure 6), capacity, commercial speed, schedule, and production. The resulting operational scenario is summarized in
Table 1.
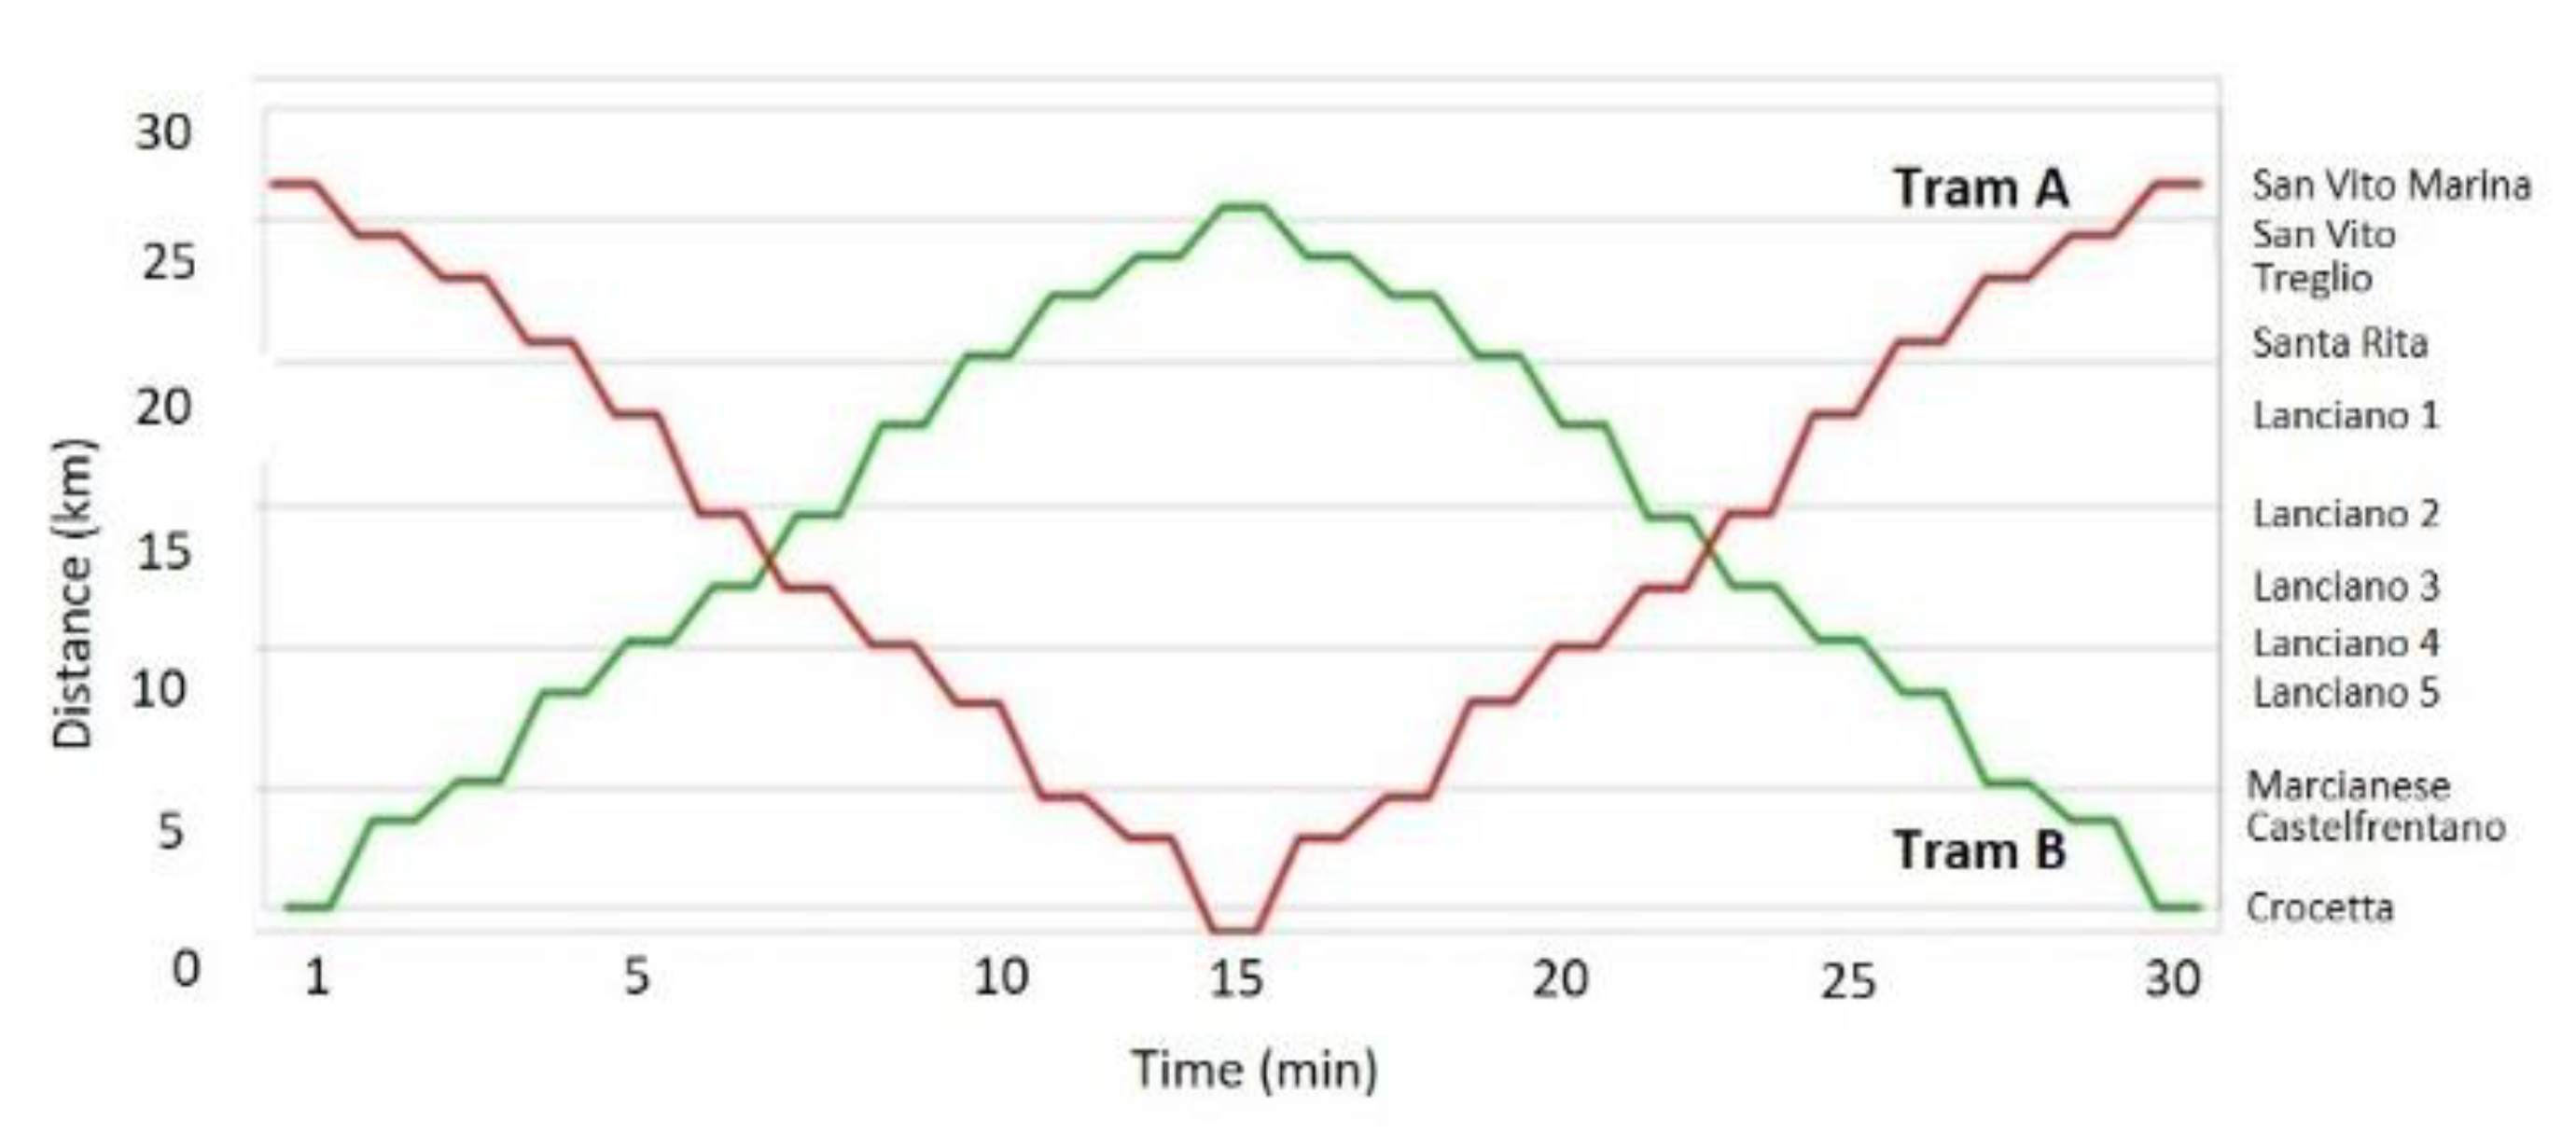
The draft timetable is reported in
Figure 7, where major stops are shown. The service will be operated by two vehicles, average dwell time at stops is estimated to be 30 to 120 seconds and that at the terminuses 120 seconds, also depending on the energy requirements described in
Section 3.4.
3.3. Operability of the Tram–Train within the National Rail Network
Specific solutions regarding the integration of the tram–train with the national rail network at the coastal terminus are under study; they are partly affected by the initial design and the development of the Sangritana line at the beginning of the last century. However, major issues to consider hinge on the integration of the two services in terms of gauge, power supply, and signaling. As anticipated in
Section 2.2.1, as regards the permanent way (under design), the gauge will not be a problem, being the railway standard (1435 mm) common to both the Sangritana and Adriatica lines, which largely facilitate the access of the service to the national network. The new overhead contact line to be installed will depend on the rolling stock to operate (still to be decided); both, in turn, will affect the decision about the electric power supply and, more specifically, which voltage would be more appropriate. When operating, the line was 3000 Vdc powered. Concerning the short leg of the route shared with trains moving from/to depots, the optimal solution would be to maintain such voltage, though this would require a specific verification in terms of compatibility with tram–train systems. Mixed traffic between tram–trains and medium-to-long distance trains on the coastal line is fully operable and possible differences in signaling between trams and trains can be solved by the available ETCS management, which can also be operable for tram–trains. The latter’s lower speed, when operating on the coastal line, can be managed by suitable scheduling, dispatching, and integrated synchronized timetables.
3.4. Energy Issues
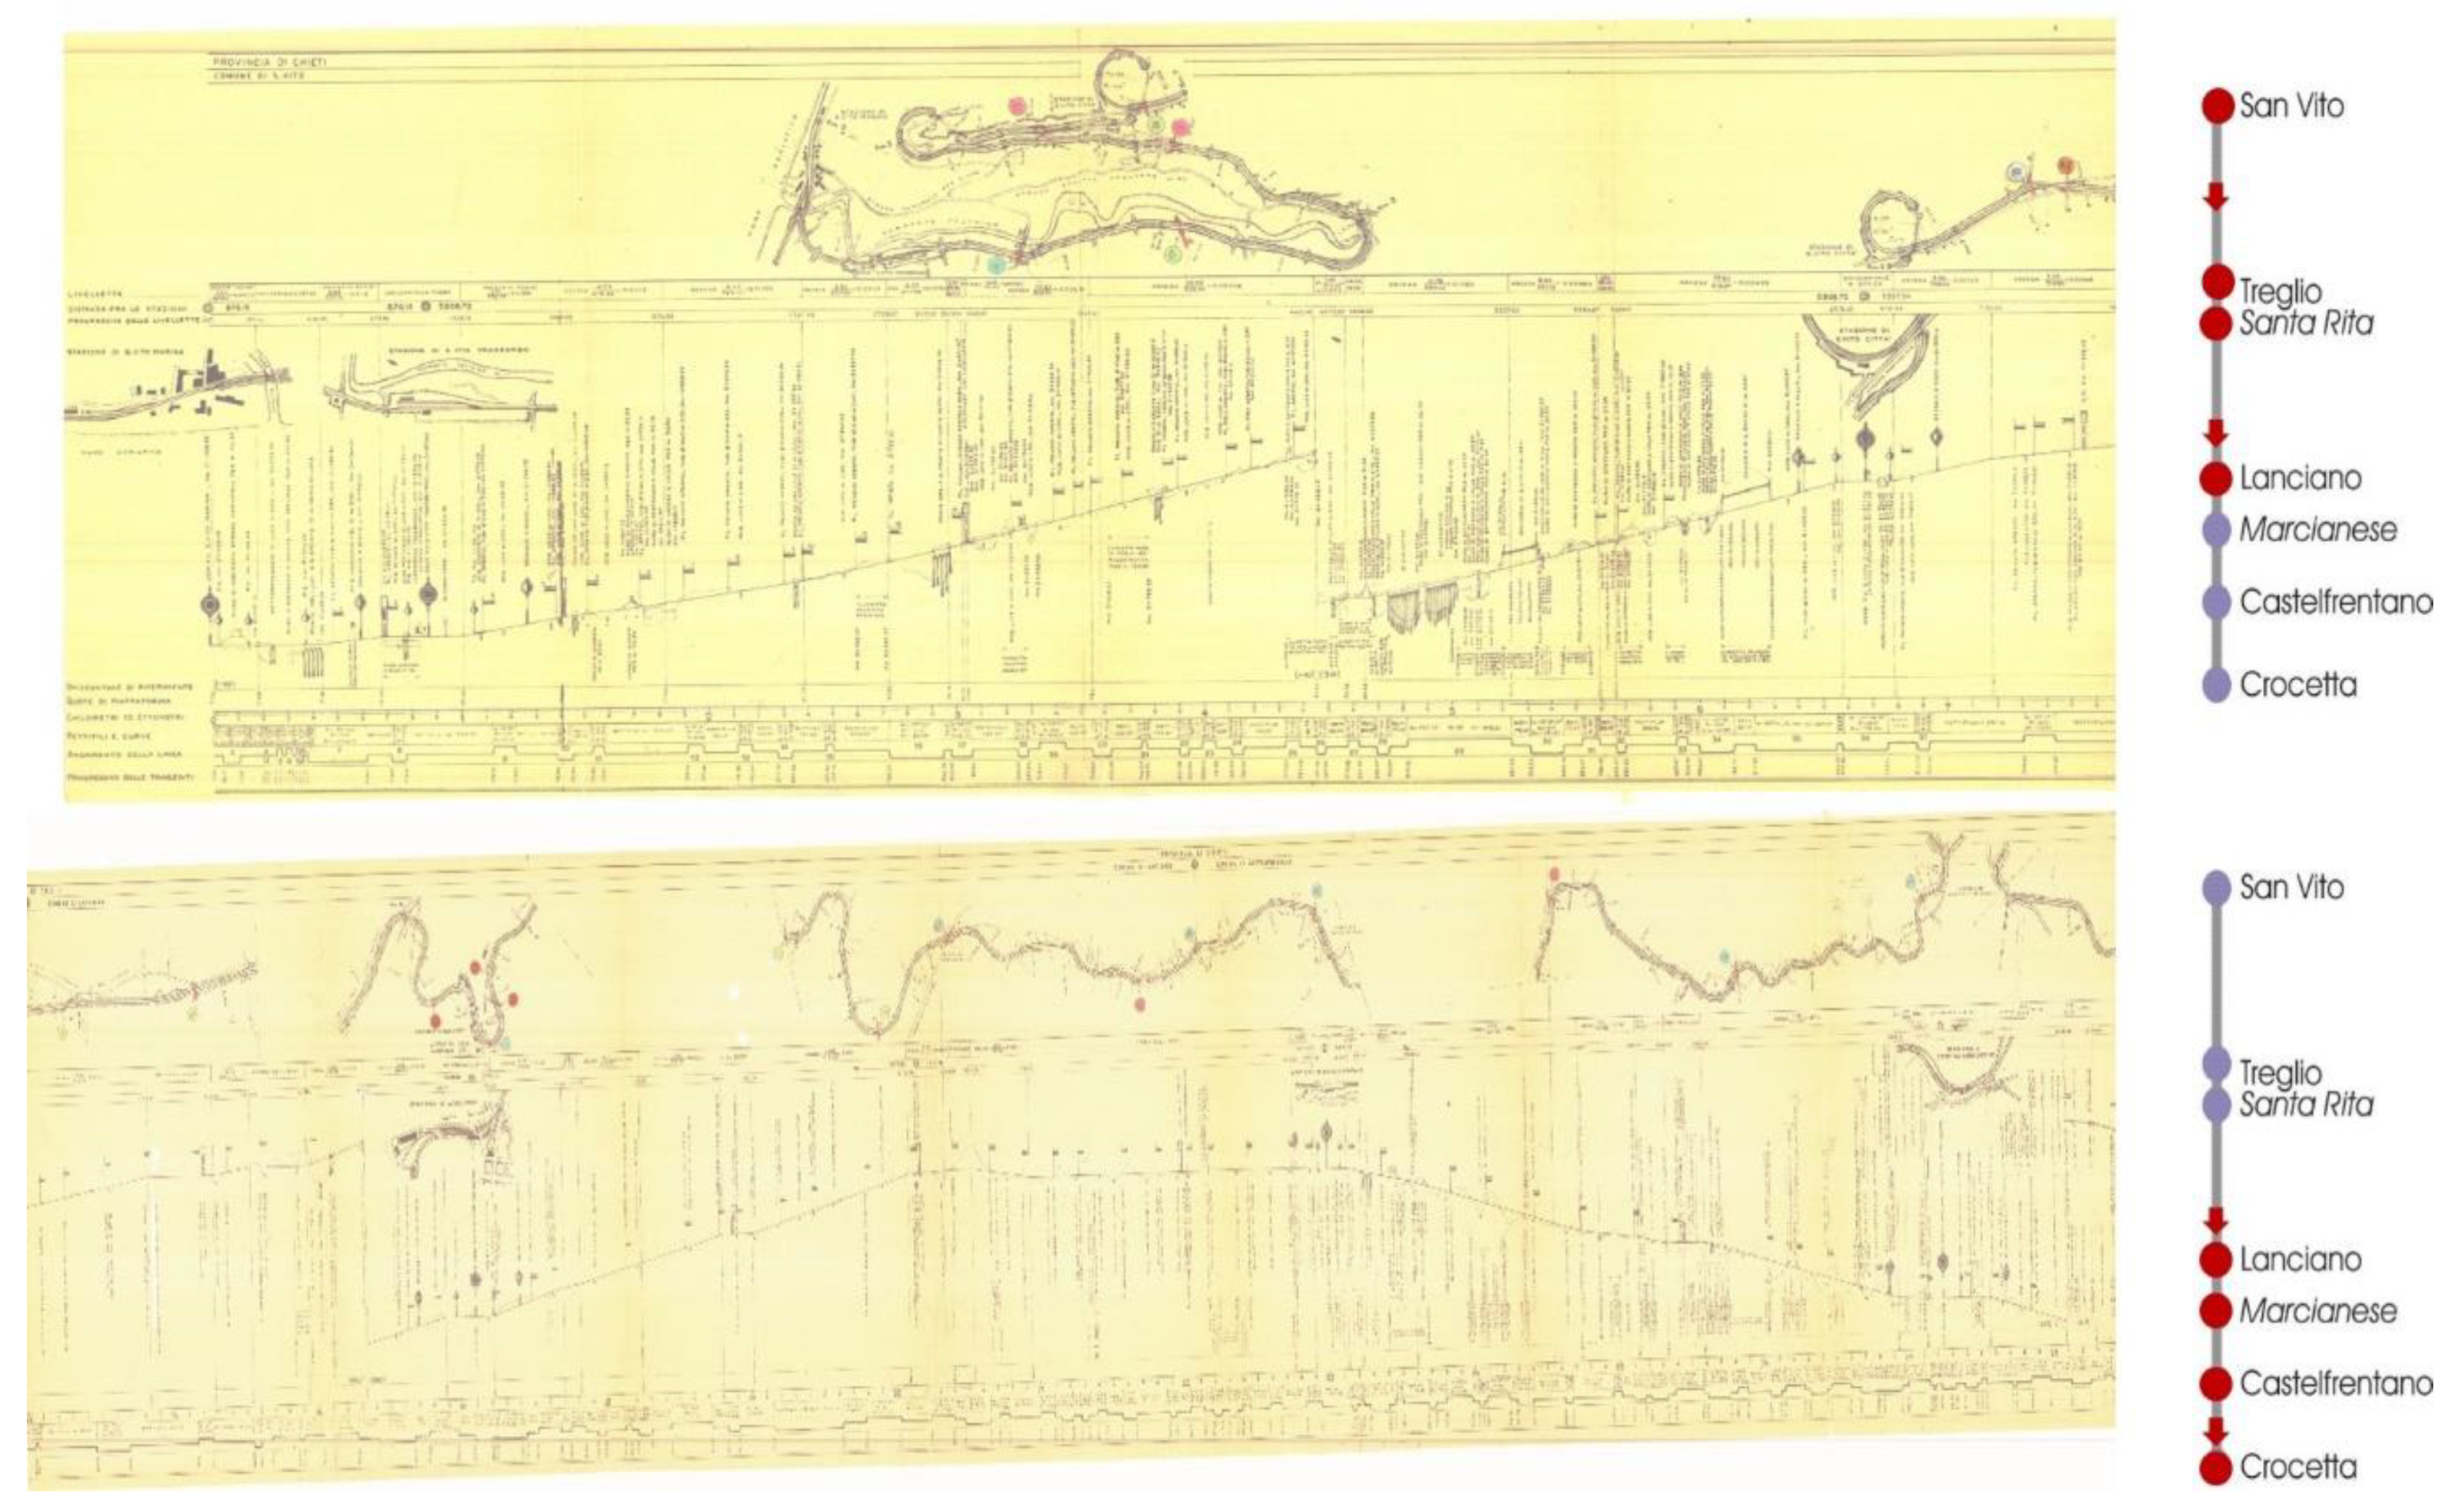
The original concept of the Sangritana line not only affects the operational requirements under the abovementioned design, but also the energy requirements associated with the electrification. The 1960s track plans (
Figure 8) show the local hilly morphology: soon after the coastal terminus at San Vito, the line runs uphill until Lanciano and beyond for a total stretch of about 20 km. Once over the ridge at Castelfrentano (a 2-km long strip, virtually flat), the line continues downhill until the inland Crocetta terminus for its final 4-km leg. Along with the gradient variations, it is also possible to observe that the line is partly winding.
The redesign of the traction system needs to consider such physical features of the line in light of the most suitable, state-of-the-art rolling stock to select and the opportunity to operate an energy regeneration system. The latter is made possible by some specific features of the line in its rural sections (i.e., thus excluding the Lanciano 5.65-km strip, which is flat and affected by built environment constraints, but less challenging for the redesign of the traction system). These are: (i) the regularity in terms of spacing between the stations, on average 3 km along the whole line; (ii) more or less constant gradients (
Figure 9), for which it is assumed an average value
i equating to 22‰; and (iii) specific curve radii.
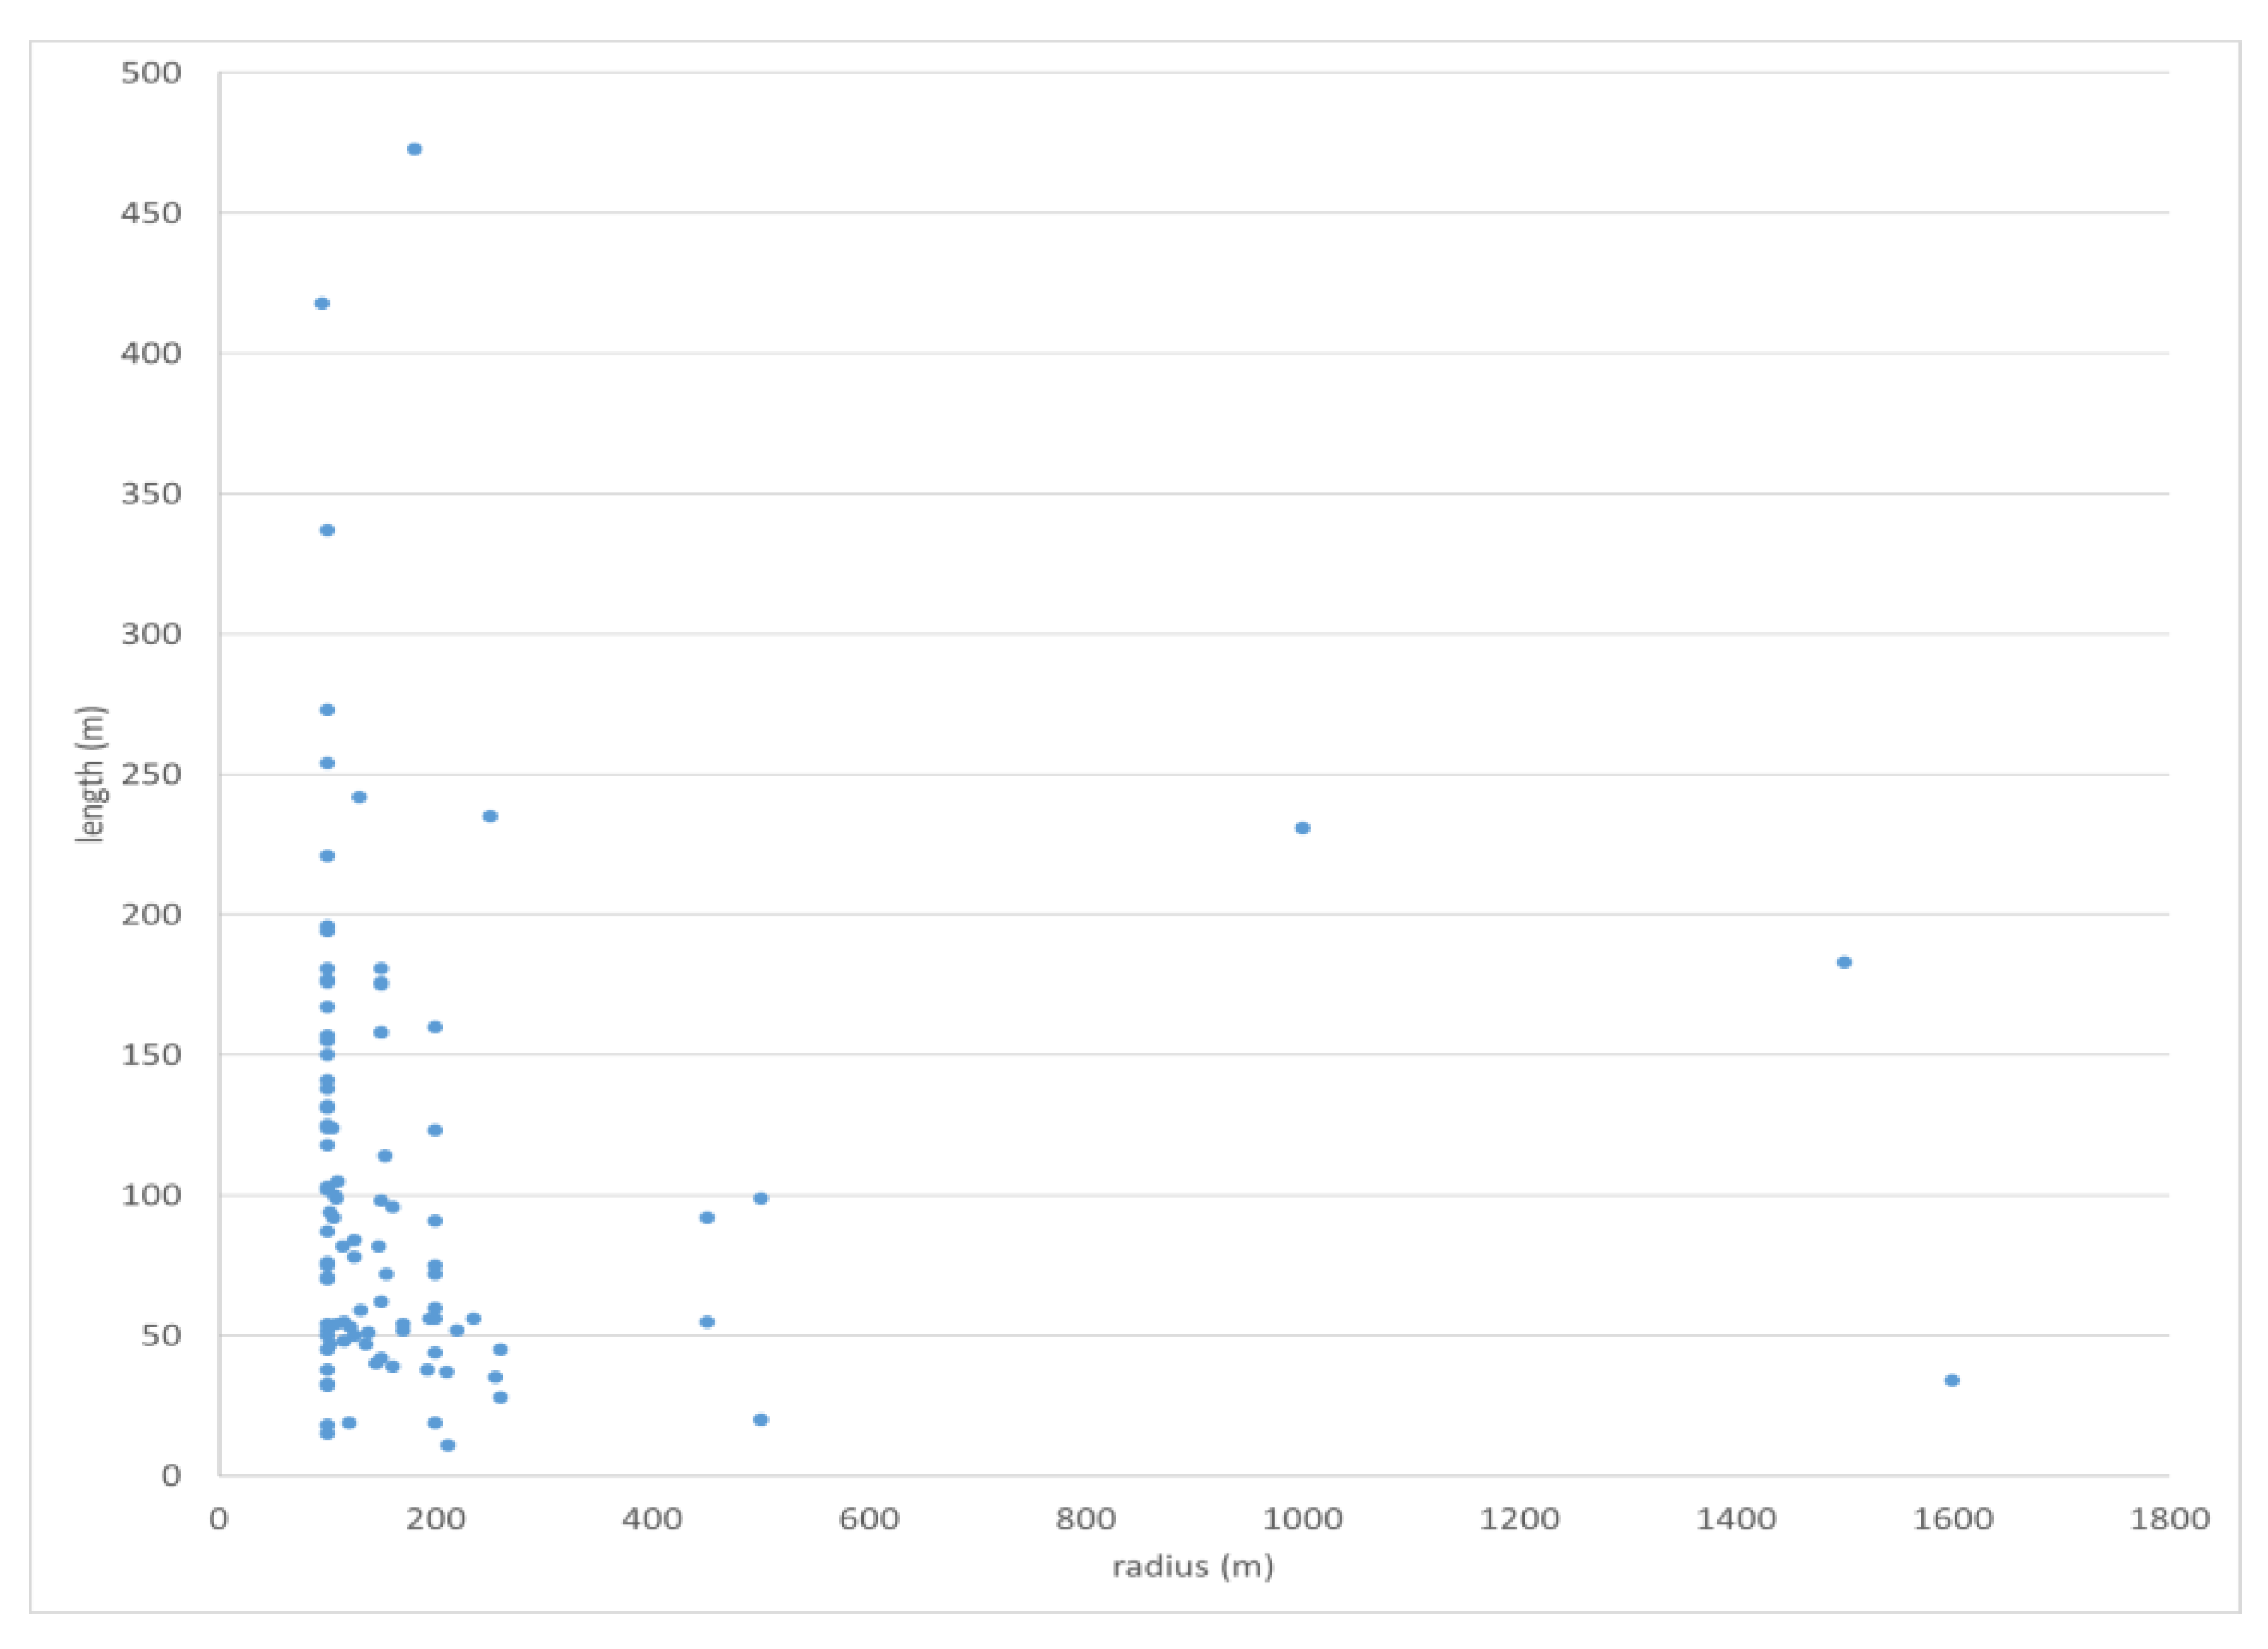
Such radii are in the range of 150 m (
Figure 10), and in case of curves of a smaller radius, the resulting higher resistance to compute is compensated by the gradient local reduction.
These enable trains to run at a constant speed (50 km/h) between two stations, with the exception of the two starting and ending legs, which are uniformly accelerated/decelerated (respectively, let a
s = 0.8 m/s
2 be the starting acceleration; and a
d = 0.8 m/s
2 the ending leg deceleration due to braking). The resulting kinematics parameters are reported in
Table 2, for an average running distance between two stations calculated as
s = 2760 m, with the 22‰ constant gradient
i, thus excluding a 240-m level section at stations. It is noted that the driver’s behavior might affect acceleration and deceleration parameters, resulting in higher values.
Likewise, the dynamics parameters are reported in
Table 3, where for the traction force, the amount of energy consumed to overcome the 5-daN/ton train resistance is dissipated into heat or wear, mainly in the wheel/rail contact area. It is to be stressed that all abovementioned forces are related to wheel/rail contact area.
Figure 11 summarizes the design dynamics features and timetable required to operate the service between two stations at a 3-km distance from each other, and the forces reported are designed for an ideal vehicle, with 1 ton weight reference, according to standard calculation procedures.
Figure 11 also shows the energy needed to overcome the drop (difference in height) and the one dissipated into heat due to resistances (aerodynamic, rolling and curves).
According to the calculations in
Table 4, it is possible to describe energy and power features while the train progresses from any
x to any
x + 1 positions, still related to wheel/rail contact area and for 1 ton weight reference.
More generally, the energy issue needs to be addressed also considering the energy supplied by the contact wire and the energy that could be regenerated and stored on board. This is represented by E
p calculated in
Table 4. Therefore, to convert E
p into electric energy to deploy for traction, a transforming system is needed, with the storage as main equipment.
There are some constraints to consider, however. First, a part of E
p needed to overcome the dissipating resistances cannot be regenerated. Second, the energy to be regenerated cannot be transferred from one train to another because their mutual spacing, on a single track line, has to be greater than 3 km, not a feasible condition for a light system such as the Sangritana’s. The case of two trains crossing at a given station is not applicable, either: both trains should be moving at the same time, which is prevented by the enforced traffic safety requirements. In addition, the amount of energy mutually transferable between the two trains is negligible [
41].
Therefore, Ep, when stored on board, can be deployed only when the vehicle runs downhill, i.e., when the electric motor becomes an electric energy generator. All of the above leads to contemplation of the following options, when descending from x + 1 to x positions:
The energy can be stored on board in batteries;
The energy can be accumulated in supercapacitors;
The energy generated is transformed into AC current electric energy, to be possibly sold to external energy providers. However, although simple, this option might face energy market or regulatory limitations.
An interesting Case
Considering all of the above, a most interesting design application relies on regeneration systems based on E
p stored by the vehicle itself by the altimetric position of its mass. The vehicle itself also serves as the energy storage system as long as the gradient varies along the route (increasing when downward, and, vice versa, decreasing when upward). More specifically, in case of maximum speed at 50 km/h, the time needed to run the central leg at constant speed between two stations equates to 198.72 seconds (
Table 2), i.e., compatible with the 800/900-second discharge time of many batteries and capacitors currently available in the market.
Thanks to such storing capacity, trains may run more 3-km long sections consecutively. But two facts are to be taken into account: (i) the energy needed to overcome the dissipating resistances is directly supplied from the contact wire (there is no reason to store such additional energy); (ii) along each section, a 1-minute long dwell time is to be computed. This implies that if the overall storage capacity enables the train to run n sections, the additional energy stored during n stops, actually, enables the train to run n + 1 sections. Such n + 1 sections can be also considered as energy reserves to mitigate the consequence of possible breakdowns.
The energy supplied from the contact wire is needed only to compensate for the dissipating resistances, thus deploying an amount of absorbed energy lower than that of a conventional electric traction system without regeneration devices. Spacing between stations varies and in some cases stops are closer than 2760 m, especially in the urban area of Lanciano. In this case, the performance calculated above for 3-km long sections can be considered more than satisfactory; moreover, a higher number of stops associated with where the regeneration occurs will increase the vehicle’s autonomy.
Thus, what are usually considered as constraints for operating a tram–train service, i.e., not much variable gradients and low speed (50 km/h), prove here to be two favorable conditions; as to the former, the majority of the energy to be stored relies on the train mass as mechanical accumulator and on the altimetry; as to the latter, the low speed reduces the electric energy if compared to that of a full electric traction vehicle. To conclude, no unfavorable elements hinder the implementation of a regeneration system, which could largely optimize the energy management for the service.
3.5. Economic Considerations and Costs
The above considerations lead to an analysis of the expenditures needed to reopen the service. The favorable condition of having the permanent way already in place helps to mitigate the magnitude of the total costs estimated in
Table 5. Additional costs to this breakdown are related to energy (102,000 EUR/year) and human resources. The latter includes management and driving personnel, corresponding to 300,000 EUR/year, almost entirely needed to cover costs for driving staff. Yet, these costs amount to about 1/3 of those needed for an equal performance bus service.
The affordability of the above costs can be corroborated by two considerations, highlighted in scientific and grey literature. The first concerns the comparison with the bus service: it is generally acknowledged that fuel expenditures can be considered as around 15% of the general directly-operated costs [
42,
43,
44], but this percentage may increase according to the extent of operations [
44], local fuel taxation, and types of subsidy. But even if significant, fuel costs are not comparable to those related to labor, which usually correspond to the higher percentage in the operational costs breakdown. In the case of Sangritana, the electrification option associated with the possibility of regenerating energy and the abovementioned possibility of operating with a reduced driving staff become winning arguments over the reiteration of the current bus supply.
The second consideration relies on the convenience of this option in terms of costs for the local community if compared with that of passenger cars. The investment costs in
Table 5 can be interpreted as a theoretical yearly cost per inhabitant of EUR 327, i.e., less than one Euro per day. The corresponding private car’s yearly management costs account for EUR 2782 per single vehicle [
45], which in a four-member household becomes an estimated expenditure of EUR 696 per capita (a rather optimistic and underestimated assumption, considering the previously mentioned local motorization rate of 620 vehicles per 1000 inhabitants). According to such figures, it is safe to assume that the tram–train is not only reasonably priced, but also more environmentally-friendly, given the major share of fuel (54.5%) among the private car’s yearly management costs [
45].
3.6. The Enviromental Potential
The environmental friendliness of the tram–train is further stressed by the following opportunities and benefits. The higher capacity of this service is designed to partly replace the current bus supply and increase the daily capacity from a current 2200 to a planned 11,566 passengers, 40% of whom will be served in peak hours. The expected environmental benefits rely on the mileage reduction of the diesel fleet, virtually halved from 250 km/day to 138 km/day, which would enable a marked decrease in emissions; more specifically, according to the study simulations, daily CO2 and PM10 emissions are expected to decrease from 364 kg to 206 kg, and from 97 g to 55 g, respectively.
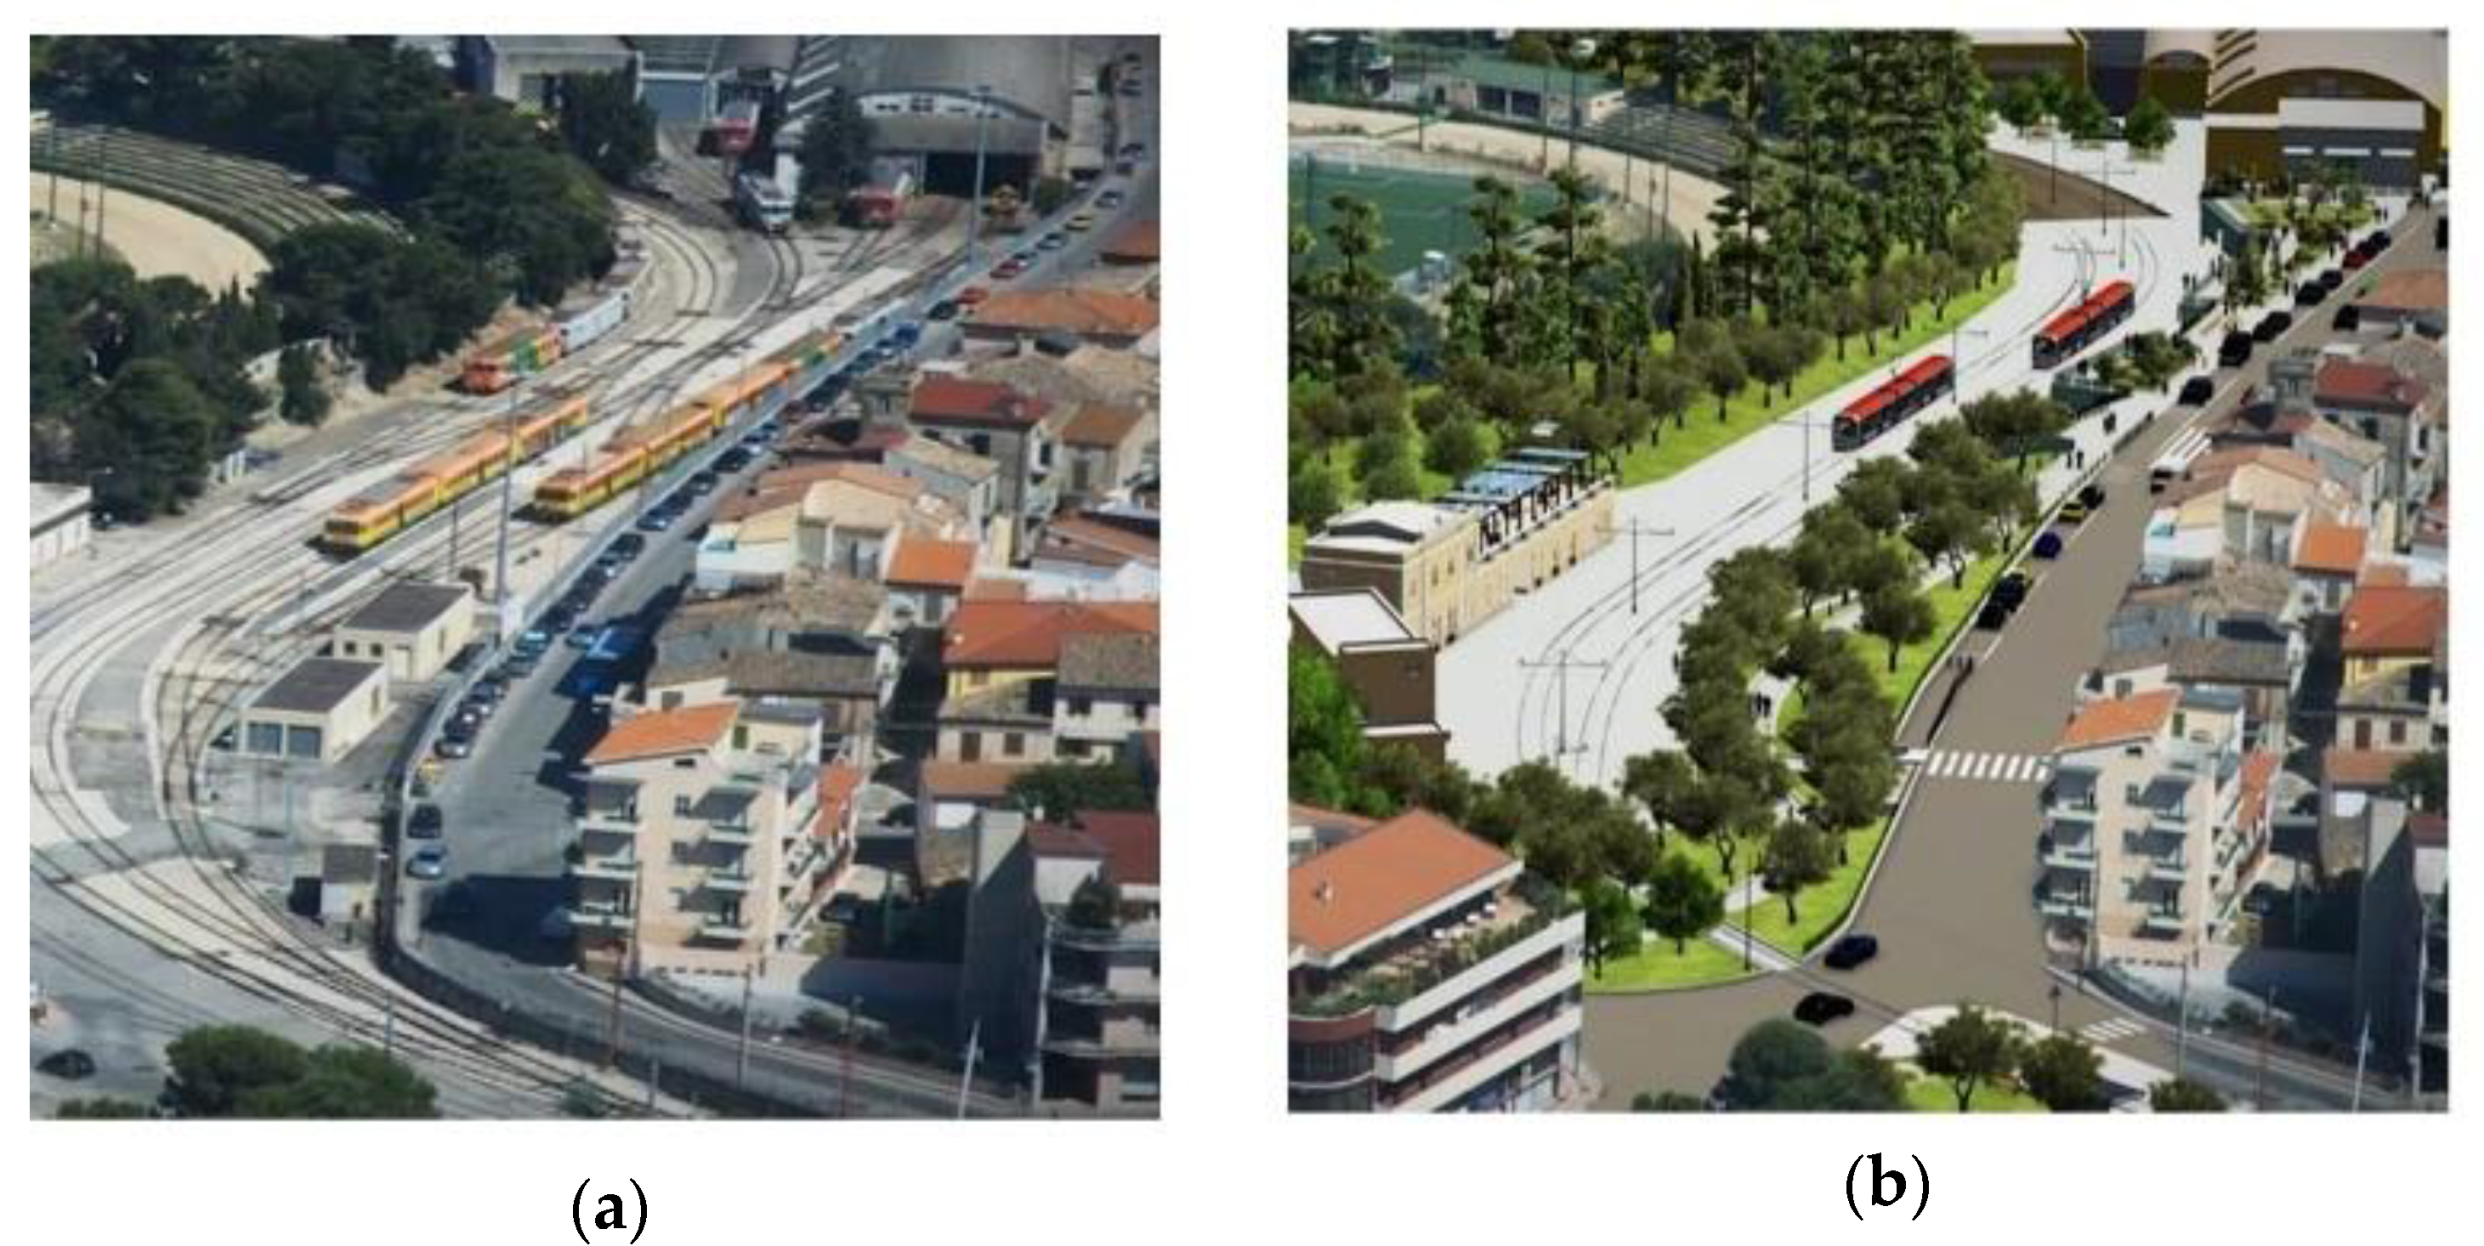
One more potential benefit comes from the possibility of avoiding land consumption for the new supply, as the superstructure is already in place. This makes possible the smooth reintegration of the tracks in the urban environment and landscape. Moreover, the fact that a rail infrastructure previously existed mitigates the negative impacts often perceived by communities due to typical rail equipment like tracks and rolling stock (associated with noise) and catenaries (associated with visual obstruction). The redesign of the track areas will result in a general beautification process (
Figure 12), thanks to the possibility of adding vegetation and refurbishing stops. Also noteworthy is the possibility of further enhancing the vegetation process by implementing green tracks, following several examples in Europe [
46,
47].
3.7. Further Elements of Strength
To conclude, the results from the SWOT analysis by the independent ELIPTIC panelists confirm many of the potential elements already presented [
48]. The SWOT analysis highlights the generally-acknowledged opportunity to revamp the railway as an option to rebalance the local modal share in favor of transit modes. This relies on a major element of strength such as the availability of the infrastructure which, in turn, helps to mitigate the building costs for the civil works and facilitates the acceptance of the new rail service by the communities, as the rail supply has been part of the local landscape since the beginning of the last century. More opportunities can be associated with the fact that tram–trains, although well-known, are still relatively less exploited systems, as they call for specific know-how. The regional operator in charge of the Sangritana line also successfully manages other railway services, demonstrating its capability in managing, operating, and maintaining the prospective service. Moreover, such supply, when revamped and reintegrated in the local operator network, can pave the way for further upscaling of tram–train operations at the regional level.
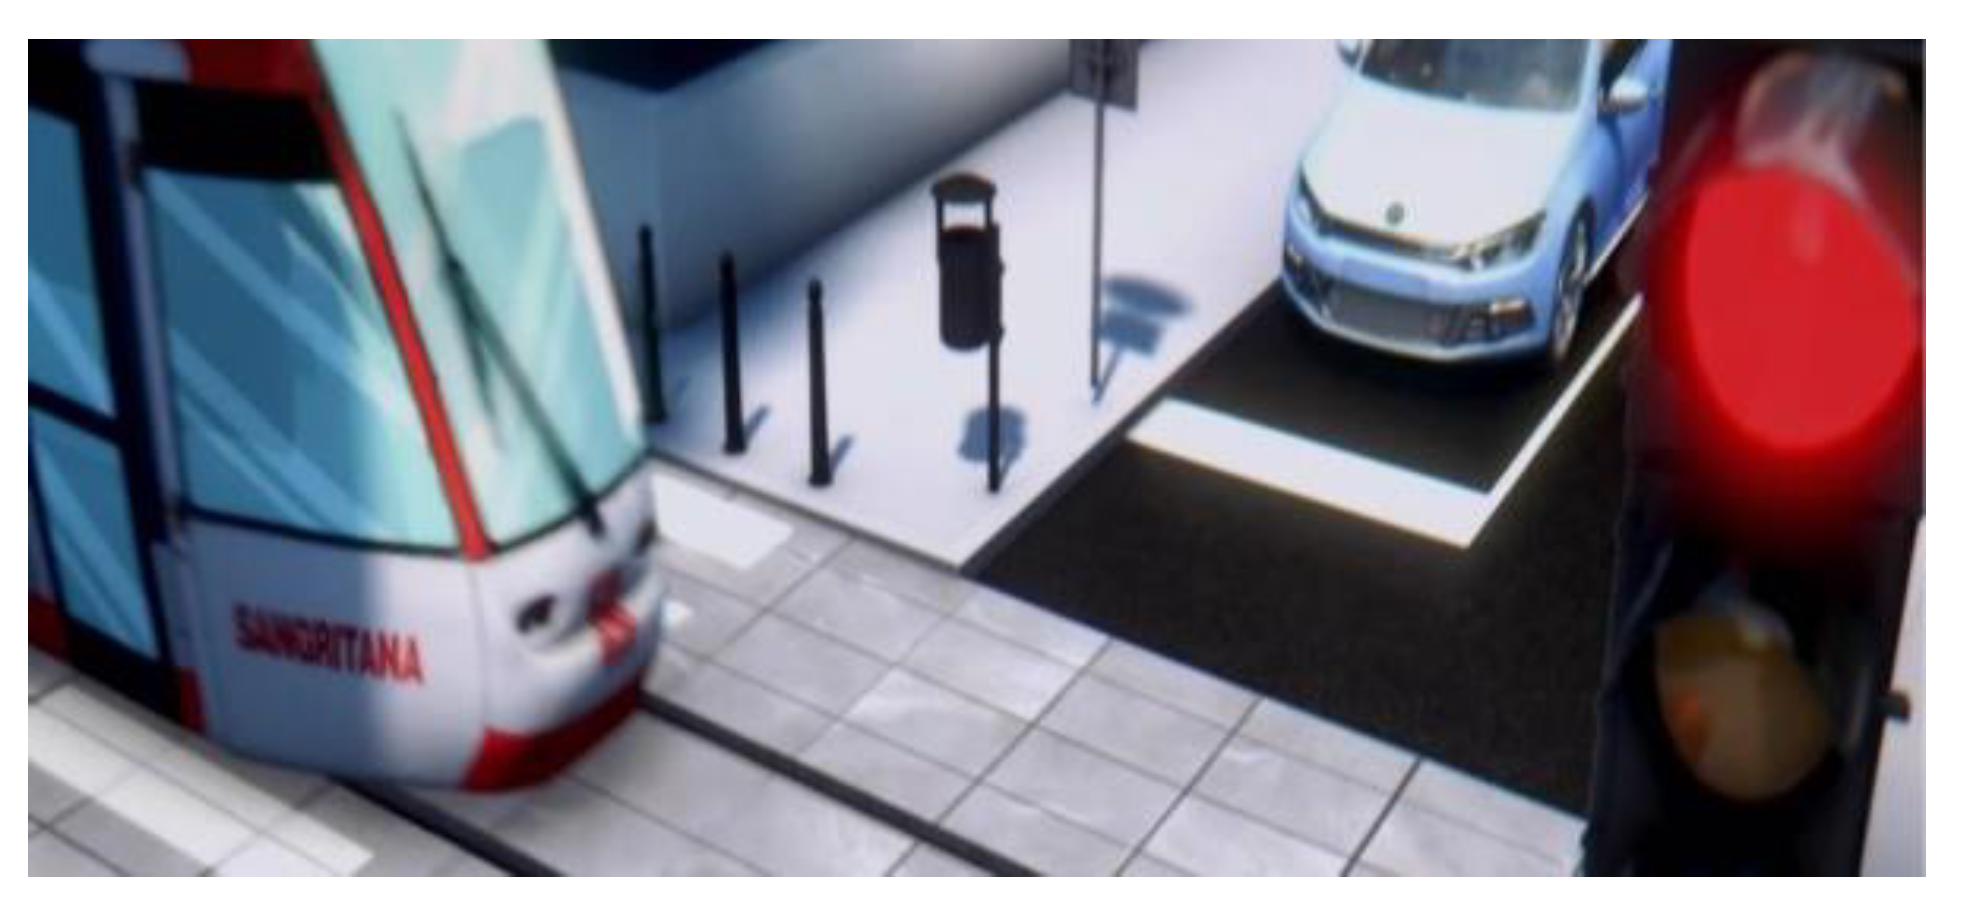
By contrast, a few factors might be considered elements of weakness and threats. On the one hand, the reuse of the infrastructure might require adapting design criteria to it rather than developing innovative solutions in terms of routes, alignment, rolling stock, etc. This can be interpreted as a weakness in terms of further service development, should the demand increase strongly. The major element of threat might be the perception of the railway as an artifact splitting the urban fabric, and in the case of Lanciano, reestablishing a physical barrier within the town. Accordingly, great attention has been attached to the redesign of sensitive areas such as level crossings, which for tram–train are without barriers (
Figure 13) and stops.
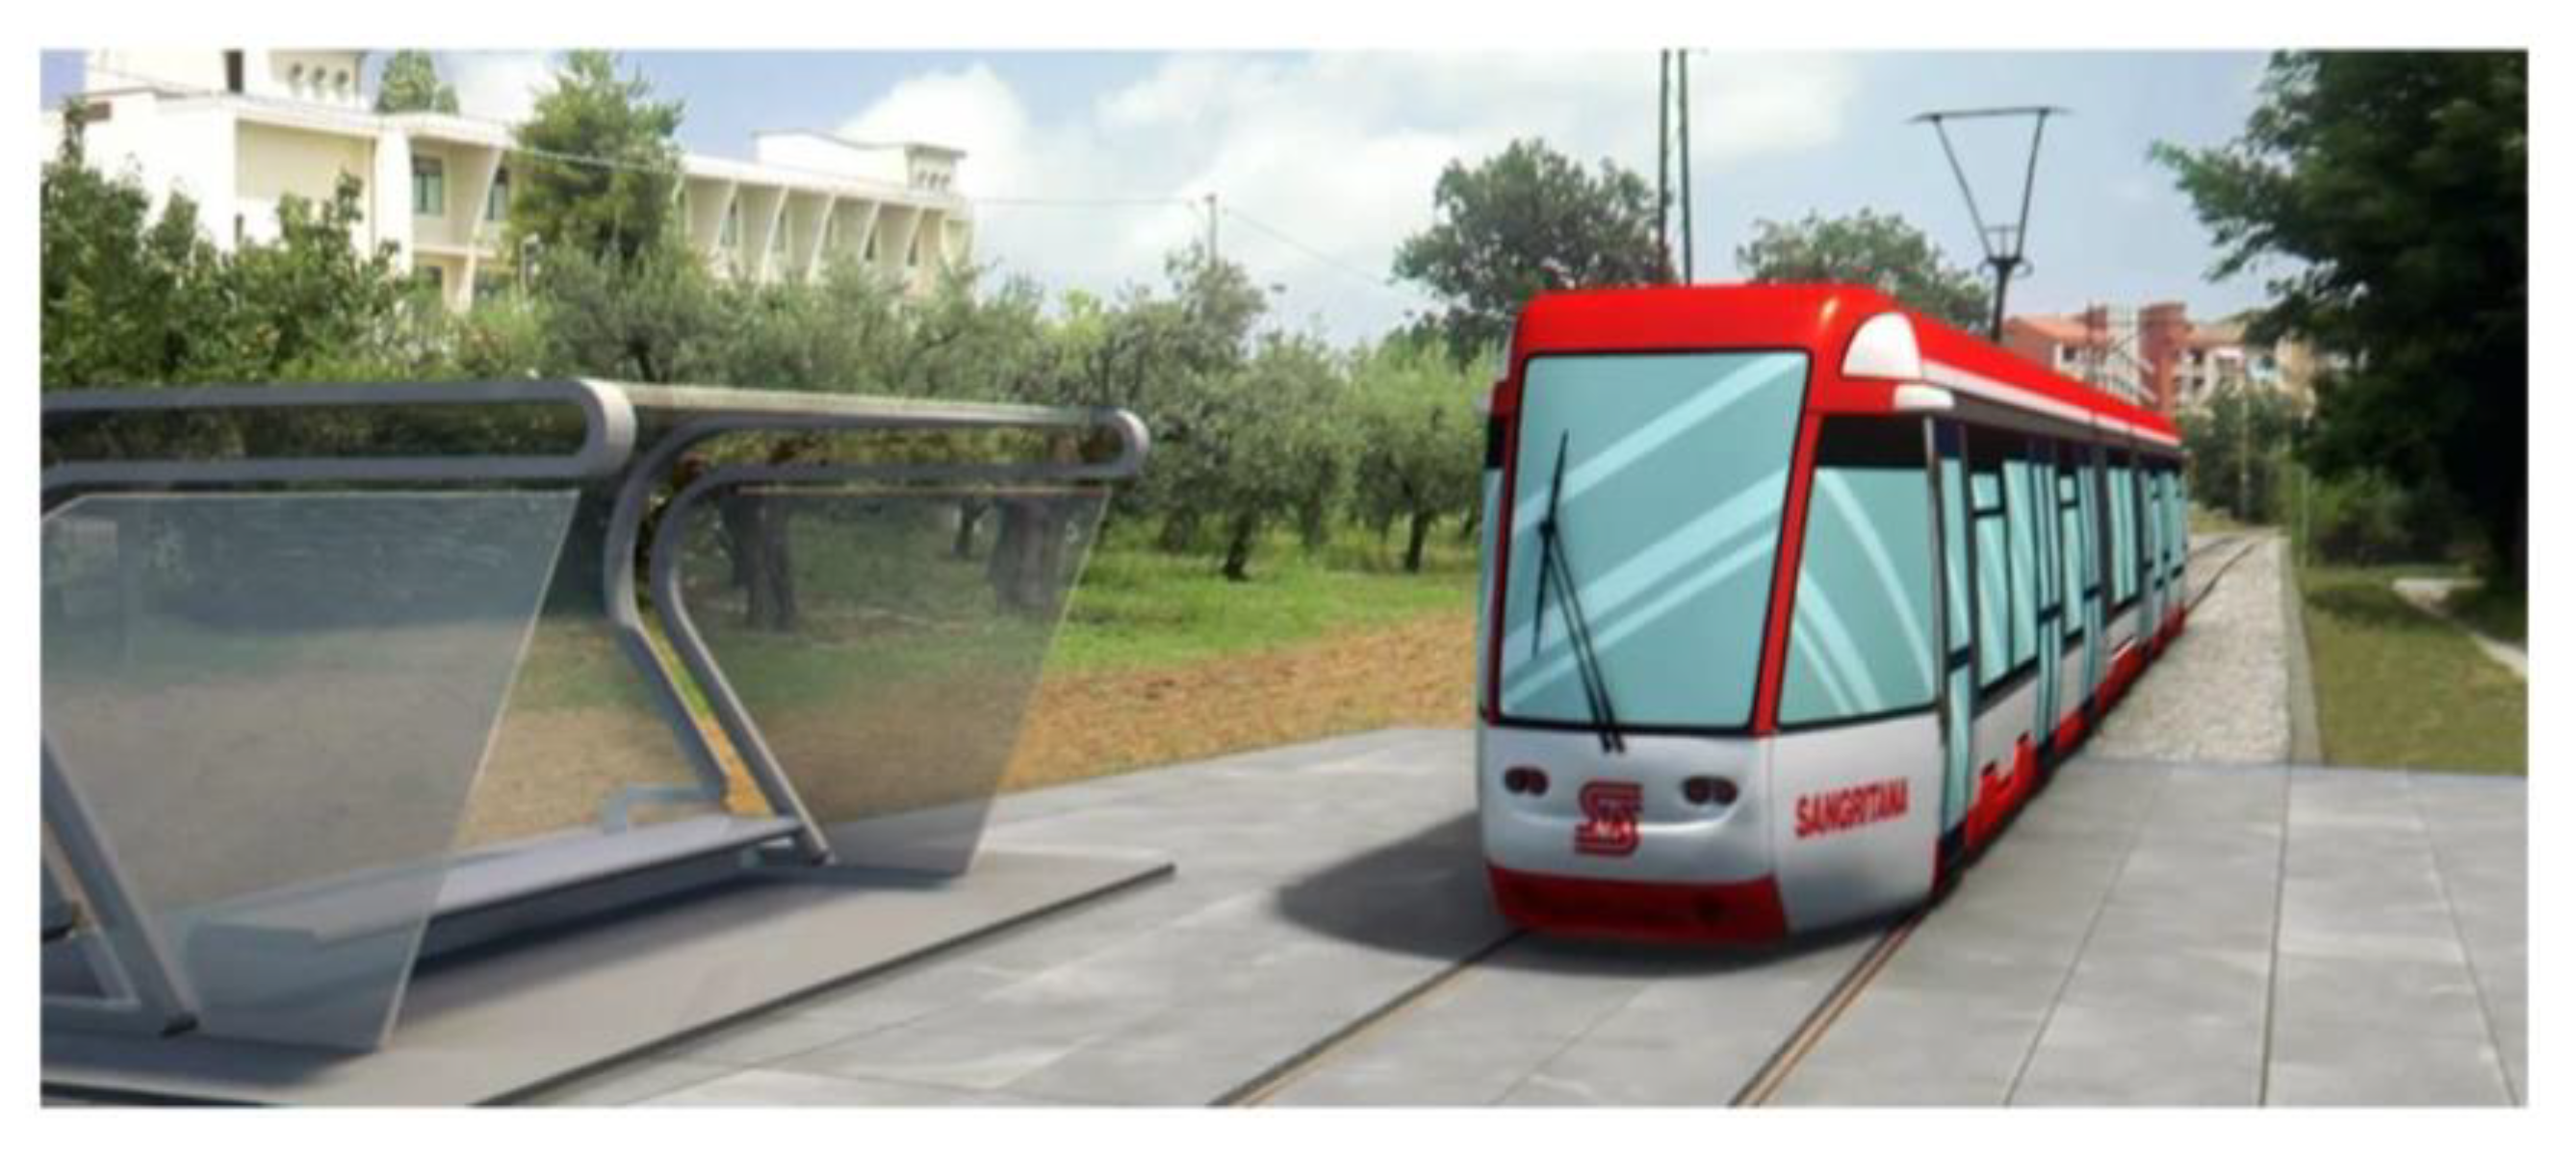
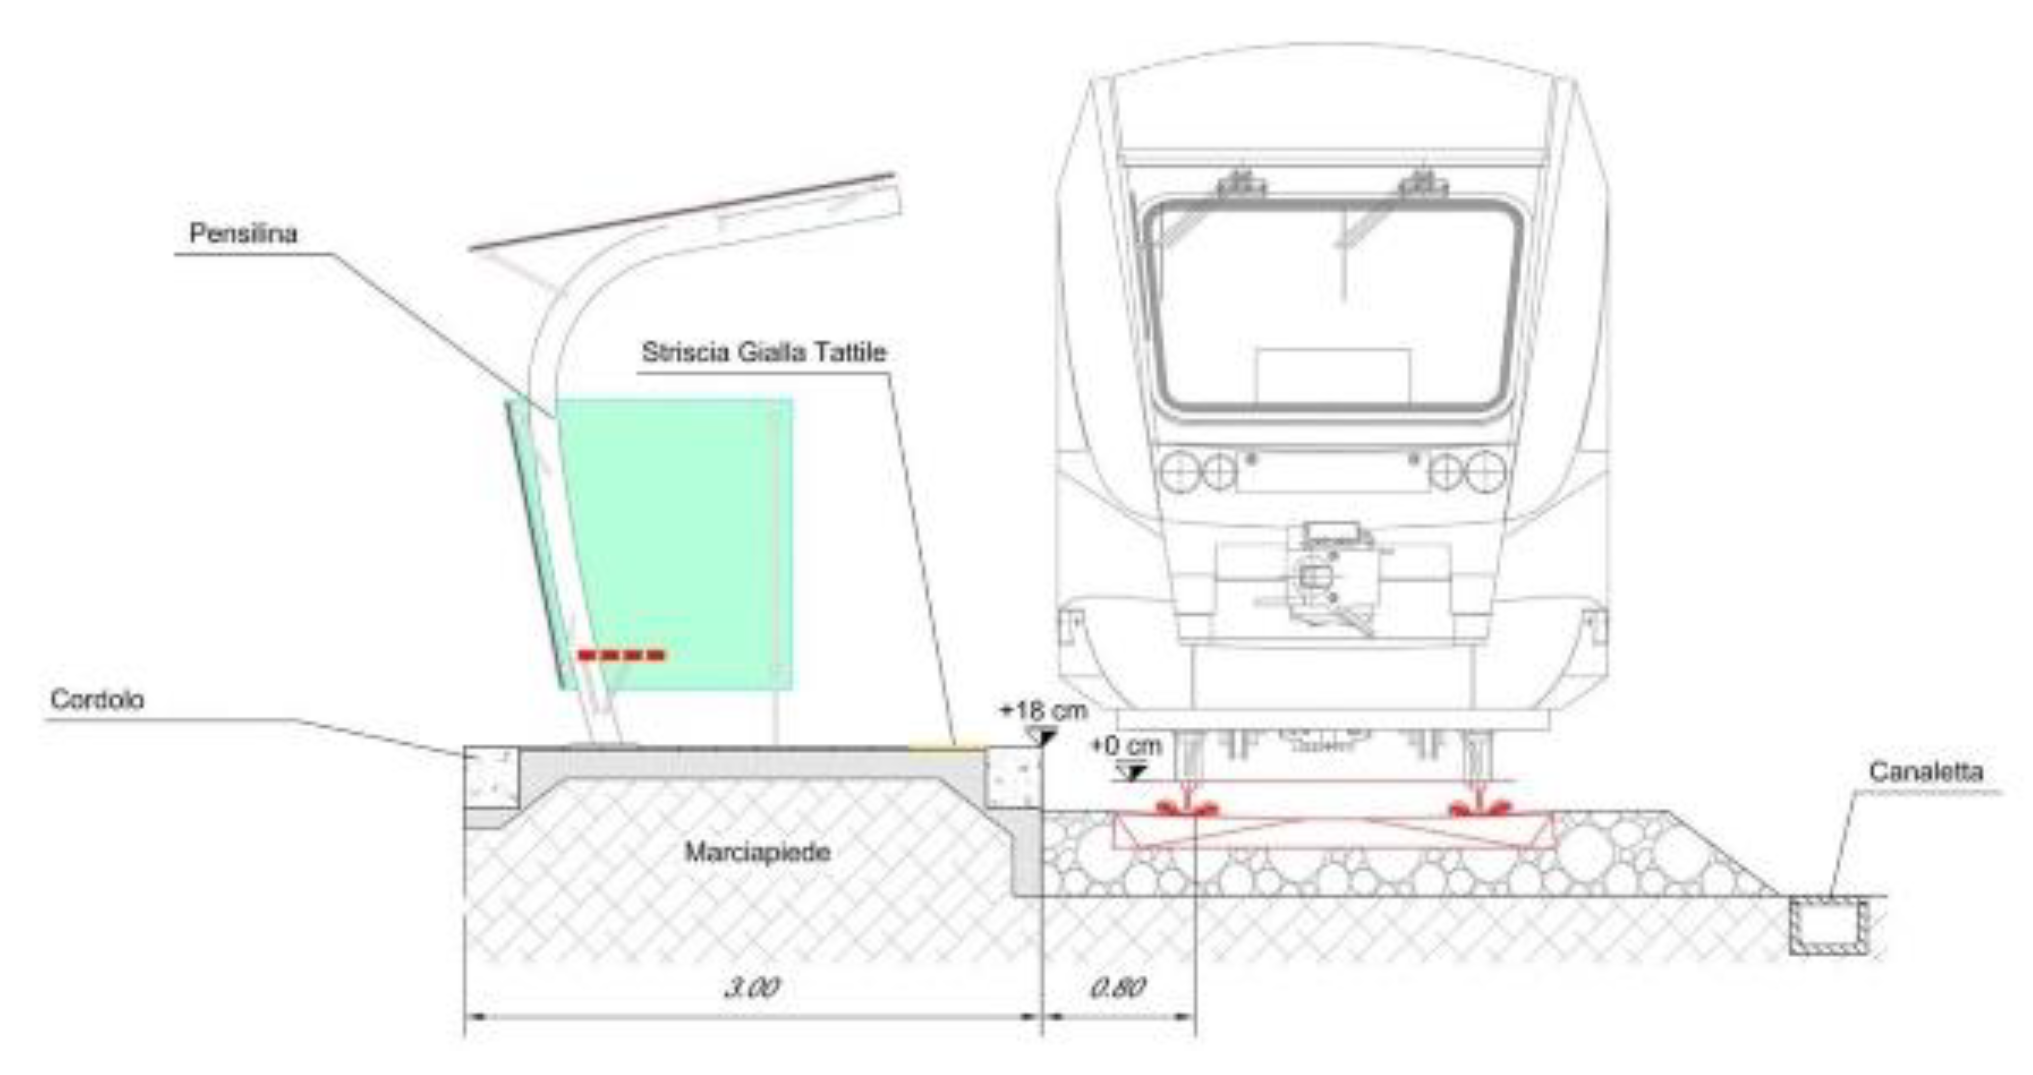
The accessibility and attractiveness of bus stops in general, and of tram stops specifically, are becoming more and more pivotal as factors in assessing the quality of the transit service. Although accessibility and attractiveness may be interpreted, perceived, and measured in many ways [
49,
50], they must rely on Universal Design criteria as prerequisite. This was mandatory in the design of the new Sangritana’s stops (
Figure 14).
Consequently, since the availability of preliminary design studies (such as those presented in
Figure 13,
Figure 14 and
Figure 15), local authorities favorably assessed the proposal, as it met all the mandatory regulatory requirements in the field of accessibility.
3.8. The Path from Plans to Implementation
All the analyzed issues rely on specific procedures based on dedicated studies and technical know-how, which will lead to the final implementation. These are associated with three major factors: the local decision-making process to launch the conversion of the abandoned railway; the technical maturity to develop a new tram–train service; and, eventually, the new impetus, at national and supranational level, to speed up the adoption of greener transit modes.
The decision-making process made use of established procedures for a participatory process involving all the local communities to reach a satisfactory solution for the largest part of the population. Participative planning was essential to launch this process and each step was conceived to be adequately corroborated by professional, technical, and political evaluations. Necessary talks were supported by facts and figures to steer the process towards shared decisions and avoid further conflicts, also when more attractive proposals were on the table (e.g., the bike trail). The availability of such quantitative analyses to support the decision process are a part of the necessary technological skill to operate a tram–train service. In this case the procedure was based on two main steps: on the one hand, the assessment of the current situation with do-nothing or do-something scenarios to describe prospective environmental, social, and operational outcomes (presented in the previous sections); on the other, the coherent development of the necessary planning phases, which will lead to the final implementation (from feasibility to implementation plans, to the assessment of the regulatory compliance with the local master plans and transport plans, at municipal and regional levels).
More specifically, regarding the scenarios development, the environmental assessment was based on the simulation of the pollutant packages and comparing the status quo with the introduction of the tram–train. The cost breakdown presented in
Table 5 was part of a larger cost–benefit analysis, which gave rise to the focus on the energy issue. This, in turn, was studied within a draft plan to calculate the new energy demand and its feasibility with the current operational requirements (especially in view of the integration of the service in the national network). All the operational issues were assessed via the scenario comparison, which was fed by massive surveys and traffic countings to assess the potential demand to serve.
To conclude, a favorable circumstance was certainly the possibility for Sangritana to be included as a case study within the ELIPTIC project, which is part of a supranational vision to develop more environmentally-friendly transit options [
15,
51]. The ELIPTIC participation was essential to developing an independent assessment of the feasibility of tram–train in the area via the SWOT analysis, but it was a one-off opportunity and limited to the study phase. However, more opportunities are available under the regulatory point of view. Like in many other countries where specific plans have been enforced to support the transition towards cleaner transit fleets, in Italy the recent Sustainable Mobility Strategic Plan also subsidizes such a process within an 8-year horizon, by granting EUR 2.5 billion per year to purchase more eco-friendly vehicles, thus paving the way to replicate the Sangritana case.
4. Discussion: the Multiple Rs Vision to Support the Feasibility Assessment
The results described in
Section 3 convincingly respond to the research question about possible pros and cons associated with the feasibility of reopening an abandoned rail supply, to serve a community of around 50,000 inhabitants. They also prove applicable to other situations similar to the Lanciano one, and are of general validity. Under the operational and technical points of view, the main drivers are
the possibility to reuse the available infrastructure, which partly mitigates the investment costs if compared to new supplies yet to build (in this case, a bike trail);
the fact that the railway has been part of the local landscape forever facilitates its acceptance by the served communities and prevents problems about usually unpopular factors associated with railways (catenaries, noise, etc.);
the appropriateness of the tram–train option to serve the area (demand patterns, planned operations to supply and performance, all consistent with the German lessons as in [
30]);
Sangritana’s full operability and integration within both the regional rail network and, above all, the coastal national rail service;
the affordability of this option if compared to the per capita expenditure for passenger cars;
the higher performance of this service compared to the current diesel bus service. This relies not only on the higher environmental friendliness of this mode, but also on the potential benefits associated with capacity. In fact, the tram–train can compete also with other electrified modes, for example, trolleybuses; for both buses and trolleybuses, the vehicle supply would be doubled or even trebled if compared to the tram–train, with passengers being provided with the same comfort levels. Moreover, the average life-cycle of railcars is much longer (up to 40 years) than that of these other modes. In the comparison with bus performance, it is also to be considered that each railcar weight equates to that of two buses, occupancy rate and comfort being equal. But the rolling resistances of the latter are about 10 times higher than the same type of resistance on rail. This and the possibility to regenerate energy highlight the higher potential in terms of the energy savings of the tram–train option, in line with the technical trends associated with rail traction [
52,
53,
54].
Therefore, the technical feasibility is not in dispute, and only one additional research question remains open: whether the local concurrence of moderate demand and the dominance of passenger cars can, on the far horizon, thwart the full development of tram–train operations. Scientific literature showcases many European examples of tram–train operations progressively attracting more demand and becoming profitable in medium- to low-density inhabited and even rural areas [
28,
30]. But this would be the first time in this study area, and no other Italian examples are available to corroborate here the success of these operations achieved elsewhere.
This shifts the focus of the research from the technical to the political and cultural levels, and especially to the decision process in the field of mobility management. The approach developed in many metropolitan areas to discourage the use of private cars is based on the enforcement of push-and-pull measures [
4,
55]. Here, revamping a rail service could play the role of “the carrot”, while restricting private car traffic could work as “the stick.” Yet it is arguable whether this would result in a more sustainability-conscious behavior among drivers and the general population. The solution could be, then, to frame the implementation of the tram–train within the recurring patterns behind many urban transformations, which can be synthesized into the Multiple Rs vision.
The Multiple Rs Vision for More Sustainable Environments
Rehabilitating the urban environment is complex. This implies the upgrade of the original functions or their conversion into new ones in order to meet the evolution of the local community requirements. Oftentimes, the focus of interventions is on a specific urban item: a given area, a building, or parts of some building stocks, with the final goal to trigger an overall rehabilitation process involving larger parts of the urban areas. Typical examples are the rehabilitation of railway passenger buildings to meet higher traffic demand and (especially when no longer operating as such) to accommodate commercial or leisure functions. Elements of success are their central locations and the consistency of the new functions with their original role of urban attractors. Several examples worldwide demonstrate the profitability, public acceptance, and attractiveness associated with this type of intervention [
56,
57,
58,
59]. But their potential in terms of the possibility to reduce the visitors’ reliance on private cars is rarely emphasized [
60].
At the same time, when the urban item to rehabilitate is an infrastructure, the choice is either to downgrade it to non-routine mobility functions (typically greenways, heritage trails or railways, or any other leisure use) or to increase its capacity due to occurring higher demand. In the first case, the affected communities perceive the new opportunity in terms of profitability or a new leisure occasion, but tensions might result if the revamping process is not based on participatory policies [
61]. In the second case, citizens perceive it simply in terms of increased supply and convenience, but again, if not involved in the process, they are scarcely aware of the consequences in terms of land-use development and prospective environmental opportunities.
In both cases, the general perception is that something new is provided, but the links among sustainability, land-use policies, heritage preservation, development, mobility management, and transport planning behind the revitalization process are mostly missed [
62]. When this happens in even less-densely inhabited areas, and the development involves something already existing, like the case in hand, the resulting problem may be even greater. The communities involved might have difficulties in perceiving the advantages of the reintroduced services in terms of environmental safeguards. Therefore, policy makers should aim to place such rehabilitation interventions, in this case the revamping of the Sangritana Railway, within a wider vision, i.e., the Multiple Rs, encompassing the following concepts.
When interventions like the rehabilitation of a railway are planned in urban areas, one of the goals is to Reduce waste of resources (for example, abandoned infrastructure, passenger buildings, or facilities) as a way to Relieve specific urban areas deteriorated by typical problems like decay or congestion, and Rebalance situations towards more sustainable mobility patterns, typically in favor of transit. Once implemented, these interventions result in a sequence of opportunities; in fact, they give rise to more appropriate Reuse of resources (for example, exploiting higher-capacity transit); means to Recover from the problems that triggered the rehabilitation (i.e., decreasing pollution or land waste); and eventually Rehabilitate the affected components of the local environment (by redesigning infrastructure, stops, nearby areas).
If all the community actors take part in this process (citizens, decision-makers, stakeholders, advocacy groups, social and conventional media, etc.) and all the community components are affected (from the natural environment and the building stock, to the waste, energy and mobility management, to education), the result will be to Regenerate, in a holistic and integrated way, the urban environment in its physical, social, and economic components, to Revert lifestyle towards more sustainable patterns, and to Reappropriate the sense of belonging. Needless to say, all of the above require Resources in terms of funding, time, voluntaries and staffed personnel; Responsibility in the case of unpopular decisions; Reciprocity as cooperative interchange of opportunities for all the community involved groups; and Results from the continuous assessment of the process, to turn this experience into a successful Reference, i.e., assigning significance to specific matters like mobility or environmental policies, for its Replication elsewhere.
Sangritana perfectly fits in this vision: it is meant to
Reduce waste of land due to the no longer used railway, to
Relieve the four municipalities from the surveyed traffic problems, and to
Rebalance the local modal shift to transit, thanks to the new tram–train supply, which implies
Reuse of the existing infrastructure. It is expected that the electrification will contribute to
Recovery from problems like pollution generated from private traffic and rubber-tired bus supply (as highlighted in
Section 3.6). New operations will be based on the redesign of stops and surrounding areas, so as to
Rehabilitate large parts of the local built environments (as in
Figure 12). This process involves the four local municipalities, their administrations, and communities, as well as the involved railway operators, which together steered decisions towards the revamping process; all expect to
Regenerate the area, once the tram–train operations will consolidate and
Revert the railway into a community-favored mode in the region. The required
Resources for the new operations are reasonable (as described in
Table 5) and affordable by the communities. Each expect a
Reciprocity of opportunities for all the inhabitants through the increased accessibility provided by the new rail supply.
Vision and Responsibility are fully demonstrated thanks to the shared decision in favor of the tram–train instead of the bike trail (based on economic and utility grounds), and so is the ambition to become a Reference by participating as a case study in the ELIPTIC project. Here, the SWOT analysis stressed how positive Results can be achieved from the technical point of view, which, once implemented and consolidated, will qualify the Sangritana Railway as a case in point for the Replication of projects based on the rehabilitation of abandoned railways.
5. Concluding Remarks: Regenerating one to Regenerate Many
The rehabilitation of the Sangritana Railway can be considered a case in point for similar examples elsewhere. More specifically, from the technical point of view, it proves to be a viable and reliable option if compared to the current bus service, as it meets all requirements highlighted in the introduction and synthesized in the previous section: it is based on a cleaner technology, electrification, which can imply also energy regeneration; it is accepted by local communities, since it is already part of the landscape (as also demonstrated by the unwillingness to dismantle its permanent way and to find a new function for it); it is affordable, as part of the superstructure can be used and upgraded, and convenient if compared to the per capita cost to own and maintain a private car; it avoids further land consumption as it rehabilitates its own premises; and finally, it is a flexible travel option as designed to meet the different peak and off-peak demand requirements, according to the preliminary studies and operational plans presented in
Section 3.1 and
Section 3.3.
However, not all of the above can be taken for granted, as highlighted in the SWOT analysis developed within the ELIPTIC project. Electrification, especially in urban consolidated areas, might encounter difficulties in accommodating opportune charging operations or implementing catenary-based systems. In fact, the latter may be the most negatively-perceived aspect by the public in general due to its unacceptable visual impacts. At the same time, environmental concerns and the operators’ general willingness to switch to cleaner transit options are strong drivers in the process of wider electrification in cities. To oversee electrification mature skills and resources are required (operators, if not big-scale, tend to avoid managing different technologies in the same depot), as well as a general disposition to cooperate (in the case at hand, between the regional transit operator and the national railway one).
The problem is, therefore, not technical but cultural and rests on the need to understand that from a single component it is possible to regenerate more aspects of the community life. Envisioning the introduction of the tram–train for the Sangritana case within the Multiple Rs approach helps us to understand that improving transit supply goes beyond the possibility of increasing capacity; it creates a virtuous circle where the transit improvement is just the first step towards the overall enhancement of more components of the built environment and the full involvement of the affected communities. The latter represents a further potential to consider: unlike trams or trolleybuses, which are mostly “mono-urban” modes, tram–trains by operating on longer routes involve different areas and communities—in other words, they affect more and unite more.
This point considerably characterizes the model for the Multiple Rs vision and the Sangritana case specifically, i.e., the possibility of applying increasingly advanced transit options, affecting larger components of the urban environment, by deploying a wider array of supply (including more and more requirements in the regeneration process), maintaining scalability (being adaptable to different urban sizes and policy timeframes), creating significant collective transport flows (being updatable according to newer needs), and multiplying positive effects.


