Article

Assessing New Biotechnologies by Combining TEA and TM-LCA for an Efficient Use of Biomass Resources

1
DTU Management, Department of Technology, Management and Economics, Technical University of Denmark, Akademivej, Bld. 358, DK-2800 Kgs. Lyngby, Denmark
2
Food & Biobased Research, Wageningen University & Research, Bornse Weilanden 9, 6708 WG Wageningen, The Netherlands
3
Institute of Chemical Engineering, Biotechnology and Environmental Technology, The University of Southern Denmark, Campusvej 55, DK-5230 Odense M, Denmark
*
Authors to whom correspondence should be addressed.
Sustainability 2020, 12(9), 3676; https://doi.org/10.3390/su12093676
Submission received: 29 March 2020 / Revised: 22 April 2020 / Accepted: 24 April 2020 / Published: 2 May 2020

Abstract

:
An efficient use of biomass resources is a key element of the bioeconomy. Ideally, options leading to the highest environmental and economic gains can be singled out for any given region. In this study, to achieve this goal of singling out an ideal technology for a given region, biotechnologies are assessed by a combination of techno-economic assessment (TEA) and territorial metabolism life cycle assessment (TM-LCA). Three technology variations for anaerobic digestion (AD) were assessed at two different scales (200 kW and 1 MW) and for two different regions. First, sustainable feedstock availability for two European regions was quantified. Then, the environmental impact and economic potential of each technology when scaled up to the regional level, considering all of the region’s unique sustainably available feedstock, was investigated. Multiple criteria decision analysis and internalized damage monetization were used to generate single scores for the assessments. Preference for the technology scenario producing the most energy was shown for all regions and scales, while producing bioplastic was less preferable since the value of the produced bioplastic plastic was not great enough to offset the resultant reduction in energy production. Assessing alternatives in a regional context provided valuable information about the influence of different types of feedstock on environmental performance.

1. Introduction

One of the goals of the European Union (EU) is to stimulate the creation of a competitive low carbon economy that is able to provide a reduction of 80%–95% greenhouse gas (GHG) in Europe by 2050 [1]. Energy production is an important sector where changes can be made in order to reach this ambitious target. Shifting from fossil-based energy to renewable sources of energy can lead to GHG reductions, provided the value chains for the renewable energy sources can lead to better overall environmental performance. A careful evaluation of new renewable energy pathways has previously been recommended [2] and various studies have shown wide ranges for GHG emissions of renewable energy systems [3,4]. Moreover, and particularly relevant to biomass based renewable energy, in some cases lower GHGs are not accompanied by lower emissions of other environmentally concerning emissions, such as those contributing to eutrophication, acidification, and human/ecosystem toxicity [5,6]. Within the various renewable energy sources, biomass is important as in 2015 it already supplied 10% of the global demand for primary energy consumption [7]. In Europe, demand for electricity biomass, heating, and transport was around 5010 PJ in 2012 and it is estimated to rise to 7437 PJ in 2020 in order to meet renewable energy targets in the EU. Thereby, it is important to consider additional renewable energy with holistic perspectives that can quantify the environmental performance of renewable energy from biomass resources. Life cycle assessment (LCA) is an internationally recognized, standardized tool with a mature methodology capable of assessing large systems and giving a complete assessment of environmental impacts [8]. As such, LCA has been used widely and is aligned with the sustainable development goals (SDGs) developed by the United Nations [9], which incorporate life cycle thinking into, for example, goal number 12 (sustainable production and consumption patterns) [10]. Under the umbrella of SDGs, decoupling economic growth from the unsustainable use of resources is of prime importance so that future generations may enjoy precious natural resources. Thus, measuring progress towards these goals is necessary from both an economic and environmental perspective, which makes the use of mixed assessments necessary.
Out of the estimated 7437 PJ demand for biomass energy in 2020, 887 PJ are expected to come from biogas [11]. Biogas production has increased significantly in the EU, from 92 PJ in 2000 to 654 PJ of primary energy in 2015, with a total of 17,400 installed biogas plants [7]. Anaerobic digestion (AD) is a versatile technology for many reasons, one being that it is possible to install decentralized plants near agricultural sources of feedstock. In terms of biomass resources, AD can utilize various types of organic waste aside from agricultural residues, including industrial wastes such as slaughterhouse wastes and residues from food production, sewage sludge and the organic fraction of municipal solid waste. The produced biogas can be valorized in several ways, such as for heat and electricity production in combined heat and power engines (CHP); injection into the natural gas grid after an upgrade to biomethane; or use in the transport sector. It is at least in part due to this versatility that AD can serve as a successful platform for the bioeconomy. In addition, the latest developments in biogas technology expand the platform beyond energy into materials production [12]. While some of the advances focus on optimizing energy extraction, such as wet explosion pretreatment aimed at unlocking the lignocellulosic fraction of waste [13], or adding a separate dark fermentation step before methanization so as to increase hydrogen content of the biogas [14], other innovation allows for the production of biopolymers via the modification of the AD process [15]. By isolating the volatile fatty acids (VFAs) produced during the AD process and feeding them to microbes in a multi-stage process, intracellular polymer, such as polyhydroxybutyrate (PHB) of the polyhydroxyalkanoates (PHAs) family of biodegradable polymers can be produced and later extracted from the bacteria. In this way, it is possible to turn biogas plants into chemical platforms, which can expand the acting field of AD to new utilization and valorization opportunities.
Needless to say, biogas relies on available biomass and by definition is constrained to these finite resources. Various studies have focused on mapping out the availability of biomass in Europe for the production of energy and biogas [16,17,18,19,20,21]. Though the quantified potentials vary widely due to methodological selections and database choice, it is generally acknowledged that the extraction of biomass must be done with care to avoid competition with food resources and unwanted market effects, such as increases on land and maize prices [22,23]. Still, Scarlat et al. [11] warns that even though domestic biomass supply in the EU is enough to satisfy the demand required to accomplish national renewable targets, as much as a quarter of the biomass demand may be sourced from third countries (outside of the EU) in 2020. Since this is due to market effects, it is imperative to take economics as well as environmental aspects into account so that the appropriate support systems are in place for the development of a sustainable renewable energies market and thereby a sustainable biogas sector. In this regard, it is important to determine if the emerging biogas innovations mentioned are environmentally sound and lead to environmental performance improvements in comparison to the status quo. As has been pointed out before, the prefix bio does not guarantee sustainability [24]. Biogas capacity already built in Europe is an important aspect when analyzing any additional capacity that may be built in an area, e.g., considering that 50% of the EU’s biogas capacity is in Germany [7]. As has been pointed out by Bojesen [25] and colleagues, who estimated service areas for existing and future biogas plants in Denmark, the availability of feedstock in relation to plant location is an important aspect. An inadequate assessment of a plant’s sourcing ability may lead to high operation costs from increased transport demand or inadequate sourcing of feedstock [25]. In turn, high transport distances may negate the environmental benefits brought about by biorefineries, as shown in Croxatto Vega et al. [26] which applied the territorial metabolism-LCA approach (TM-LCA) [27] and found distances of 50 km to be the upper limit.
This study performs a step-wise assessment starting from individual plant level and investigates the implementation potential of the PHB and AD-Booster technologies in two different plant scales. A techno-economic assessment (TEA) and LCA are carried out for this aim. The results from the TEA-LCA are used to structure implementation of the technologies at the regional level. The TEA relates the plant scale and processing capacity to capital expenditure (CapEx) and operational expenditure (OpEx) of the plant, and to the break-even prices of products. In the LCA, the environmental aspects of different technologies are quantified. The implementation of the two technologies is analyzed for two regions defined by the nomenclature of territorial units for statistics (NUTS) from Eurostat’s definition of regions (NUTS2 regions): Bavaria, Germany and Veneto, Italy. We analyze the potential impacts of the two innovative technologies (PHB and AD-Booster) against the current level of biogas implementation for the regions. First, we use TEA to analyze the effect of scale on the economic potential considering relevant plant sizes. Concurrently, we provide a mass flow analysis for the regions to better understand the energetic potential of agricultural residues produced within the regions (i.e., both the residues already in use for biogas and not yet exploited) as well as the level of development of the biogas sector (i.e., installed capacity). Finally, we use the results from the TEA of each technology to perform a TM-LCA, which will be able to tell us the possible environmental improvements (or deterioration) potentials for the whole region, if all of the residues are processed with the new technologies. We place special attention on the repercussions for the farmer, especially from installation of large biogas plants, which can potentially monopolize biomass resources over a large area. Vice versa, we explore the possible needs and constraints for biogas developers in the two regions. In this way, we seek to explore new biotechnological implementation potentials from a stakeholder’s perspective.

2. Method

2.1. Plant Level Assessment

The potential of implementing new AD technology was analyzed at two different scales. Data was collected from two biogas plants: a 1 MW installed electric capacity plant in Veneto, Italy and a smaller 200 kW plant in Bavaria, Germany, hereafter referred to as “the farms”. Both plants operate on a mixture of cow manure, crop residues, and maize silage (Table 1). Both plants valorize biogas in CHP units, which produce heat as a waste product. Both plants utilize the co-produced heat in the plant’s operation and additionally, in the Bavarian case, the surplus heat produced is utilized in the district heating network for a nearby village [28].

2.2. Technology Description

Three technology scenarios were assessed. Conventional AD was chosen as the baseline and two emerging treatment processes that can be added to existing AD were assessed for the comparison. All technology scenarios are modelled with a biogas leak of 3% of the produced biogas [22]. The technology set ups are: AD, AD + Booster, and AD + PHB.

2.2.1. Anaerobic Digestion

Conventional AD was modelled using SuperPro Designer, following the details received from the farms (Figure 1). The feedstock is grinded before it enters the anaerobic digester. The anaerobic digester produces biogas and digestate. The AD model was populated with the most common stoichiometric equations governing anaerobic digestion in [29]. Internal electricity consumption for the whole process was 7.5% of produced electricity based on data obtained from the farms operating biogas plants. A methane content of 50% for the biogas and an electrical efficiency of 38% for the CHP unit was used, based on the received data, yielding a 1.9 kWh/m3 of biogas. Internal thermal energy usage was assumed to be 40%. The methane content, electrical efficiency, energy content of the biogas, and internal heat use was equal in all technology scenarios.

2.2.2. AD + Booster

The AD + Booster technology consists of an extra tank where the wet explosion technology is applied under high heat and pressure conditions [13]. The AD + Booster scenario (Figure 2) was designed with information obtained from the technology developers [30]. In comparison to AD, the AD + Booster technology increases the conversion yield of cellulose to biogas from 52% to 88% and the conversion yield of hemicellulose to biomass from 75% to 98%. This scenario has an internal electricity consumption of 9.5% of produced electricity. On the other hand, the biogas yield is 12% to 16% higher than the AD scenario.

2.2.3. AD + PHB

In order to include a PHB producing section into an existing AD plant, a few extra pieces of equipment are necessary (Figure 3). AD is split into two tanks, the first is of short retention time and is where the VFA are produced and rerouted for PHB production. After this step, a screw press and a filtration unit separate solid from liquid. The solid fraction is fed to the AD tank where it continues the regular AD process, while the liquid fraction goes into a series of bio-oxidation units where selection and accumulation occurs via the feast and famine method [15]. The bio-oxidation equipment, in SuperPro Designer, was populated with stoichiometric equations obtained from the technology developers. Finally, PHB can be extracted using sodium hypochlorite and a final filtration step recovers a crude PHB. In comparison to AD, this scenario has an internal electricity consumption of 15% of produced electricity and a biogas yield from 24% to 30% lower than AD.

2.3. Regional Feedstock Availability

2.3.1. Crops

Primary production amounts and land cover of individual crops was obtained from the Eurostat database (apro_cpnhr, [31]) for the two NUTS2 regions. As much as possible, the most recent data on production statistics was used, for the period of 2008–2018. For Veneto, data coverage on crops by Eurostat was very incomplete. Thus, it was preferable to use data from the National Italian Institute of Statistics (ISTAT) [32], where data is available for the whole period at the NUTS2 level. The production yield (production amounts divided by area of production) was then averaged over the period to derive an average production per year for the regions. Residue:crop ratios where then applied to the production yield to derive a total annual amount of residues for each crop. A list of the residue:crop ratios (Table 2), as well as grouping of Eurostat categories used are provided (Table A1, in Appendix A). For the most part, it was assumed that only residues are used for AD (or AD + innovation), with the exception of energy crops where the whole plant is assumed to enter digestion. Energy crops included are maize silage, green maize, and sorghum. Only crops which are most commonly considered for biogas operation were included in the study; we excluded horticultural crops that do not typically serve a purpose in AD.
Because wine grapes are an important crop in the Veneto region, they are also present, though to a smaller extent in the crop mix of Bavaria. Amounts of winery pomace were also taken into account as potential AD feedstock. Data on wine production was obtained from Eurostat (vit_t1, vit_an5, vit_an7, [33,34]) for both regions and the data for Veneto was checked against ISTAT data. The period for Eurostat wine data differed slightly and included the years 2001–2009, and 2015. The amount of pomace produced was estimated based on [35], which reports a 25% conversion rate from grapes to pomace.
After obtaining total crop residue amounts for the region, it is necessary to estimate a technical and sustainable potential for collection of the residues. The technical potential may potentially exclude the share of residues which is too difficult to collect, as well as the share that has known competing applications (Table 3). For example, this is the case for straw from cereal production, which is typically used for bedding and feed for cattle and other animals [36]. Sustainable potential collection, on the other hand, takes into consideration soil fertility. Residues may, for example, be left on agricultural fields to uphold the organic matter content of the soil and protect it from excessive erosion. Sustainable potential collection factors typically used in the literature vary from around 10% to 50% of the most common types of residues, i.e., excluding pomace and energy crop [37], and it has been shown that residue removals above 50% may negatively affect soil organic carbon storage [38]. Nearly all studies [11,16,19,20,21,36,39] that evaluate biomass potential for bioenergy purposes apply some sort of technical/sustainable collection factor, yet many of these studies do not report the actual values used or leave values out. We report all the values used in Table 2, since this is one of the most important determinants of potential for biomass utilization.

2.3.2. Manure

Animal production data was obtained from the Eurostat database (agr_r_animal) for bovine, swine, sheep, and goats for the period of 2008–2018. At the NUTS2 level, it is possible to obtain data for the number of animals in thousand heads. It is then necessary to estimate the amounts of manure excreted by the different types of animal, which varies also with their age (dairy cows, calves, sows, piglets, etc.). Values of manure production are calculated using the methodology detailed in [43] following the definitions for the various animals in [44]. The values are reported in Appendix A, in Table A2. Poultry production is not reported in the above-mentioned database, thus it was necessary to use the ef_lsk_main Eurostat database, which reports livestock units (LSU) for poultry for the years 2005, 2007, 2010, 2013, and 2016 at the appropriate regional level. This was the best available data for poultry at the NUTS2 level. LSU values were converted to poultry heads, following the methodology outlined in [43].
Similarly to crop residues, a technical potential was considered for animal manures. Here, for cattle, the potential collectable manure was estimated based on the type of housing and rearing. Since European regulation on organic production of agricultural products specifies that organic “livestock should have permanent access to open air areas” in most cases [45] and that there shall be a connection between land management by the use of manure, i.e., meaning that organic production must maintain the fertility of soil by applying cover crops, green manures or organic livestock manure, it was assumed that manure could only be collected in the harsh winter months (at most) from organic cattle farms [46]. The estimate for housing types was derived from the Farm Structure Survey (FSS) [47] carried out in 2010, since more recent FSS could not be located. The types of housing were assumed to stay proportionally equal to the values in 2010, though after taking into consideration the growth in the organic farming sector for cattle rearing. Data on the share of organic livestock was obtained from statistical data summarized by Eurostat at the national level [48]. For animals other than cattle, the share of organic production was disregarded since the share is very low (<1% of animals) [48]. Manure collection factors are given in Table A3 of Appendix A, for all animals and various types of housing.

2.3.3. Installed AD Capacity

Already installed AD capacity has to be considered when assessing additional potential implementation in the regions. Regional data on biogas installation was collected from various sources. In Veneto, a total of 220 biogas plants were in operation by 2018, of which 89% were considered agricultural plants, i.e., treating crop residues, energy crops and animal manures [49]. By contrast, 2566 plants were installed in Bavaria by 2019 [50], of which 93% were considered agricultural AD [7], while the rest were landfill gas and sewage gas. A breakdown of types of installed capacity (scale) was obtained from a census of installed plants [51] in 2011 in the Veneto region. It was assumed that installation continued in the same fashion through to 2018, with a preference for plants of capacity slightly lower than 1MW, due to an all-encompassing subsidy [52]. For Bavaria, data obtained was detailed down to city/rural district level, which made it possible to use average capacity to determine the scale breakdown of installed capacity. The types of capacity installed estimated for Veneto and Bavaria are shown in Table 4.

2.3.4. Regional Energetic Potential

The methane potential of various feedstocks (Table A4, Appendix A) was used to derive the quantities of feedstock currently being processed by the already installed AD capacity in each region. Since it was not possible to obtain specific data on precisely what types of feedstock are used at the NUTS2 level, statistics on the manure to crop share processed in AD were scaled down from national to regional level. For Germany, feedstock inputs for agricultural biogas plants are on average 45% manures and 55% crop material [28], while in Veneto the mix is on average 55% manures and 45% crop material [53]. A CHP electrical efficiency of 38% and a value of 9.97 kWh per liter of methane (CH4) were assumed. The capacity installed in each region corresponds to 137 MW in Veneto and 1237 MW in Bavaria. Taking account for the installed capacity, the average mix of manure and crop material present in each region is then used to estimate more precisely the feedstock already used in AD. The final available potential can then be calculated by taking the total agricultural feedstock produced and subtracting competing applications for animals, soil organic matter and already installed capacity.

2.4. TEA Method

TEA of the different technologies, utilizing different feedstock mixes was carried out. Financing costs, maintenance and plant overhead costs, labor related costs, and feedstock costs were aspects considered for the TEA. For all scenarios, it was assumed that the AD plant has a productivity of 8760 hours per year.
The CapEx of the AD plants were estimated using a CapEx of M€ 4 for a 1 MW plant complete with AD, H2S washer, and generator as a reference, which scales with a power of 2/3 to the electricity output [28,54]. The AD + Booster technology requires extra equipment for the separation and heat treatment, but it also reduces the required hydraulic retention time and therefore the required equipment size of the digester. Based on expert knowledge, it was assumed that regarding the CapEx these aspects equalize and therefore the CapEx of the AD + Booster scenarios is equal to that of the AD plants. The PHB production requires extra equipment for separation, filtration, selection, accumulation, and concentration. Based on expert knowledge, the CapEx for the AD + PHB scenarios was estimated to be 25% higher compared to that of the AD plant.
The financing costs were based on an amortization of the CapEx over 10 years with no interest. Maintenance, tax, insurance, rent, plant overhead, environmental charges, and royalties were assumed to be 10% of the CapEx per year [55,56].
The AD plants were assumed to have a high level of automation, thus, the labor related costs for a 1 MW plant are based on a 1 shift position. Assuming that an operator earns a salary of €18/h and including costs for supervision (+25%), direct salary overhead (+63%), and general plant overhead (+122%) [55], resulted in total labor related costs of k€ 500/y. For the 200 kW plant the labor related costs were divided by five, assuming farm personnel are available part-time. As the PHB production requires a number of extra unit operations and produces an extra product, the labor related costs were assumed to be 50% higher.
The feedstock costs including raw material, and handling and transportation costs are shown in Table 5. The costs for the different types of manure were estimated based on short distance transport costs of manure of €1/ton wet weight (WW) and thereby depend on the dry weight (DW) content of each feedstock. Grass and corn silage were assumed to be produced close to the AD plant and costs were estimated based on [57] and [58]. The costs for wheat straw, corn stover, and soybean straw were based on baling and transportation costs. The costs for vine shoots were based on harvesting and transportation costs. The costs for grape pomace, sugar beet pulp, and grain were based on [58].
Based on the total costs, the break-even prices for electricity and crude PHB were calculated. In the scenarios in which crude PHB is produced, the break-even price of electricity is equal to the regular AD scenario. The break-even prices were compared to selling prices of electricity and PHB (Table 6). As in the AD + PHB scenarios a concentrated crude PHB is produced, extra required purification costs were included. For comparison between the economic performance of each scenario, the required subsidy, i.e., the difference between the selling prices and the break-even prices was calculated.

2.5. LCA Method

LCA is a standardized methodology governed by international standards and guidelines [8]. Among these, the ILCD handbook offers detailed guidance on how to carry out LCAs in accordance with the definitions set out by the European guidelines [63]. Using this guidance, the study at hand is considered a situation A “micro-level decision support”, since structural changes are not foreseen to occur in the background system, due to the small share of biogas in the overall context of renewable energy. Thus, average mixes were used for the background system and replacement of substituted products. Where co-products are produced, such as in the case of AD + PHB, system expansion is used. The same was done for heat, which is produced as a by-product when biogas is burned in a CHP unit. Though in the latter no credits were awarded in the Veneto region for the produced heat, since this is not yet valorized in Italy [51], apart from what is used for own consumption from operation of the plant. In Germany, the situation is slightly different, and thus, a credit was given to the co-produced heat at a rate of 0.52 kwh heat/kwh electricity, based on the amount of heat utilized at national level [28].
Residue feedstocks that are presently not typically valorized, apart from biogas production, come into the system burden free, since the burden of production was allocated solely to the main product. This is the case for animal manures, pomace and vine shoots. However, for energy crops, the full burden of production was taken into account, i.e., maize silage, grain and grass silages. For agricultural residues currently valorized in the market, such as sugar beet pulp, corn stover, and soybean straw, the burden of production was distributed by economic allocation, while for wheat straw an existing Ecoinvent process was used. The allocation key is shown in Table 7.
In order to visualize the benefit of digesting manure, emissions from storing manure have been included in the assessment. A period of 50 days of manure storage, minus two weeks of unavoidable storing to account for losses and manure in housing units, is avoided by instead treating the manure with the technology scenarios. The quantity of avoided methane is directly proportional to the quantity of manure available in the region or the amount of manure is the feedstock mix. Values used for the calculation are included in Table A5 of Appendix A.
The product system modelling software OpenLCA [68] was used for the modelling and subsequent analysis, utilizing the Ecoinvent v3 database [69]. ReCiPE Hierarchist (H) [70] was chosen as the impact assessment method, and results were generated at midpoint and endpoint. The time horizon for calculation of impacts is 100 years from point of emission.

2.5.1. Plant Level

The functional unit (FU) at plant level is the treatment of 1 ton of feedstock of local characteristics, defined in Table 1 for each plant. Biogas is burned in a CHP, producing heat and electricity. Electricity substitutes the production mix corresponding to the geographical location of each biogas plant. Heat utilization was modeled as substituted district heat for the 200 kW Bavarian plant based on their data, while there is no heat utilization for the industrial size plant in Veneto. PHB production offsets average global thermoplastic production (Table A6, Appendix A).

2.5.2. Regional Level

The FU at NUTS2 level is the treatment of all the AD compatible feedstock defined through the mass flow analysis of available potential for each region (see Section 3.1). An energetic cut off of 1% was applied, so that feedstocks contributing less than 1% of total energetic potential of all feedstock in the region were left out. To simplify matters further, partly due to results from the TEA, the regional assessment was done for plants of industrial size, i.e., 1000 kW for both locations, processing a feedstock mix corresponding to the regional availability, which is defined in the regional feedstock availability assessment. Transport for the regional and plant level assessments was included as 1 km of feedstock transport, and other distances were tested in a sensitivity analysis.
A second sensitivity analysis was also included. The energy grid of each location was replaced with a theoretical future green energy mix, in order to observe the effect of changing energy grids through time. This follows best practices for including partially dynamic LCA in systems with a long service life [71].

2.6. Interpretation of Environmental Impacts

In order to interpret the results, several methods were used. Because of political importance as well as ease of understanding, GHG emissions were used as a proxy for environmental impacts in some discussion, though due to the potential issues with only using GHG emissions, e.g., burden shifting [72], other interpretation methods are were also used. In particular, two methods were used: the first is a monetization of environmental impacts based on endpoint damages [73] and the second uses a form of multiple criteria decision assessment called technique for order of preference by similarity to ideal solution (TOPSIS) [74], utilizing the implementation method ArgCW-LCA [75].
In the first of these two methods, monetization and ReCiPe endpoint damages [76,77] are used to calculate the external costs of the implementation of a given technology at a given scale or region. This was done through two methods. The first, for ecosystem damages, is based on budget constrained ability to pay, which is used to derive a valuation for species years (Species.Yr) gained or lost [78], as this is suggested as the least uncertain method for this valuation [79]. For that valuation, 65,000 USD2003 per Species.Yr was utilized. In order to evaluate the disability adjusted life year (DALY) loss or gain, a value from Dong et al., who assessed a number of different methods, was utilized [80]. The valuation derived in these different methods varies significantly, on the range of 1 to 2 orders of magnitude. Therefore, here we used the average of these values, 110,000 USD2003 per DALY, which is also in line with the value derived from budget constraint monetization [78], which again should have the least uncertainty. Since resource scarcity endpoint damages are already expressed in monetary terms, no further interpretation is necessary.
In the second method used for deriving a single score, based on the ArgCW-LCA method [75], ReCiPe midpoint environmental impacts [76] along with a valuation of required subsidy for profitability to represent the economic impacts were used as the input criteria for TOPSIS utilizing weighting based on what Sohn et al., describe as a context weighting factor (CWF) [75]. Per a suggestion from the ArgCW-LCA method, as there was no specific stakeholder group present, the stakeholder perspective element was omitted from the method application. For this application, normalization for an average European person year emission was used [81]. Thus, weighting of the environmental impacts is derived, as described in the ArgCW-LCA method, by taking an average of two values: the average of the normalized midpoint impacts for impact category ‘i’ amongst all assessed scenarios, and the difference of the minimum and maximum normalized impacts for impact category ‘i’ amongst all assessed scenarios. This accomplishes two things: (1) taking the average of the normalized impacts scales the importance of emissions of the system to status quo emissions and (2) taking the difference between the maximum and minimum normalized impacts is to scale relative to the ability for choosing amongst the available alternatives to cause significant change in status quo emissions. This was completed for all impact categories resulting in the CWF for the environmental impacts. Economic impacts were ascribed a range of weights relative to the sum of weighting given to environmental impacts ranging from 10%–90%. The system was also run using equal weights for all criteria as a point of comparison to the context weighted and the other single score results.

3. Results and Discussion

3.1. Regional Feedstock Availability and Potential Bioenergy Production

A complete table of the sustainable/technical feedstock potential is presented in Appendix B, Table A7, for Bavaria and Veneto. These amounts were used for the TEA-LCA as the regional feedstock mix, though with a 1% cut-off based on the energetic potential of the feedstock.
When graphed on a % wt basis (Figure 4), a relatively large proportion of production of energy crops is evident in Bavaria. Both regions are rich in cattle manure and have a noteworthy amount of swine manure. After energy crops, the most abundant residues are cereal straw for Bavaria and sugar beet straw and soybean residues for Veneto. The regions notably differ from each other, in particular with regard to the production of certain crops, for example sugar beet, soya and grapes. The grapes, represented by pomace, are much more prominent in the Veneto region.
In comparison to Veneto, Bavaria has a much larger share of energy crops, mainly maize silage. This greater share of energy crops is explained by feed incentives given to biogas plants using energy crops in Germany during 2004–2008 [82]. Although maize production has been capped by several German rulings, from 60% by mass input in 2014 lowered to 50% in 2018 and 44% by 2021, the combination of a high animal density and fodder production means that growing of maize has increased exponentially with unintended consequences, such as increasing land prices [22,82]. In Veneto, the feedstock mix exhibits more variability and the expansion of energy crops has not been as dramatic. This may likely be due to the Biogasdoneright™ concept promoted by the Italian Biogas Association, which originates in northern Italy, under which sequential crop cultivation is practiced, where the primary food crop goes to its intended purpose, and a secondary cover crop serves as feedstock for biogas plants [83].
Nevertheless, in energy terms, the potential of the feedstock mix is different than the availability based on mass, mostly due to the poor methane potential of some of the feedstocks. Without subtracting the feedstock that is already being used in the installed capacity of these regions, the energetic potential (based on electrical power) is seen in Figure 5. The largest share of potential is dominated by different feedstocks in the two regions. In Bavaria, the largest share can be obtained from energy crops, while in Veneto the largest share can come equally from cattle manure or energy crops. As a rough estimate, 153 PJ and 38 PJ remain as unexploited feedstock. This represents 31% and 54% of the total available feedstock potential, in Bavaria and Veneto, respectively, which is estimated as described in Section 2.3.4. However, for the LCA, all of the feedstock in the region was assumed to be utilized by the technologies, since in theory biogas plants can be retrofitted with the additional equipment needed for implementation of the AD + Booster technology and PHB production.

3.2. TEA Results

Based on the technical description of the different technologies and the different feedstock compositions, the flow sizes, flow compositions, production of electricity, heat, and crude PHB were estimated. Linking these process parameters to the economic parameters results in the TEA in Table 8.
In all scenarios, the financing, maintenance, labor-related, and feedstock costs are in the same order of magnitude. The contributions of these cost aspects to the total cost vary between 19% and 34%. The small-scale scenarios have, relative to annual production, a larger CapEx compared to the industrial scale, therefore financing and maintenance costs increase the break-even prices for the small-scale scenarios. This results in a break-even price are 34% higher for electricity and 27% higher for crude PHB for the small-scale scenarios, compared to the industrial scale scenarios. As all cost aspects are in the same order of magnitude, the extra required labor in the AD + PHB scenarios results in a significant contribution to the total costs. Logically, the extra labor related costs increase the break-even price of crude PHB. Compared to the feedstock costs of the studied plants, the regional level feedstock in both Bavaria and Veneto have a slightly higher contribution to the costs and to the break-even prices. In the Bavaria scenarios, the revenues of the thermal energy cause a reduction to the break-even prices of 8% for the small scale and 6% for the industrial scale, relative to scenarios that do not utilize the thermal energy.
For the 1 MW AD plant scenarios the average estimated break-even price for electricity is €0.22/kWh. For the AD + Booster scenarios, the average estimated break-even price for electricity is €0.19/kWh, a reduction of 12% in comparison to AD alone. Using the break-even for electricity of regular AD in the AD + PHB scenarios results in an estimated break-even price for crude PHB in the range €4.3/kg to €4.7/kg. When the purification costs of €1.8/kg are included, the break-even price range for PHB is in the range €6.1/kg to €6.5/kg. Due to the difference between market price and the break-even prices, as outlined in Section 2.4 (Table 6), it is clear that both electricity and PHB require large subsidy contributions to be profitably produced in AD plants. Relative to their respective market prices, the required amount of subsidy for the production of PHB is smaller compared to the subsidy for the production of electricity. Nevertheless, the production of PHB requires the co-production of electricity (Table 8).

3.3. LCA Results

3.3.1. Midpoint Results

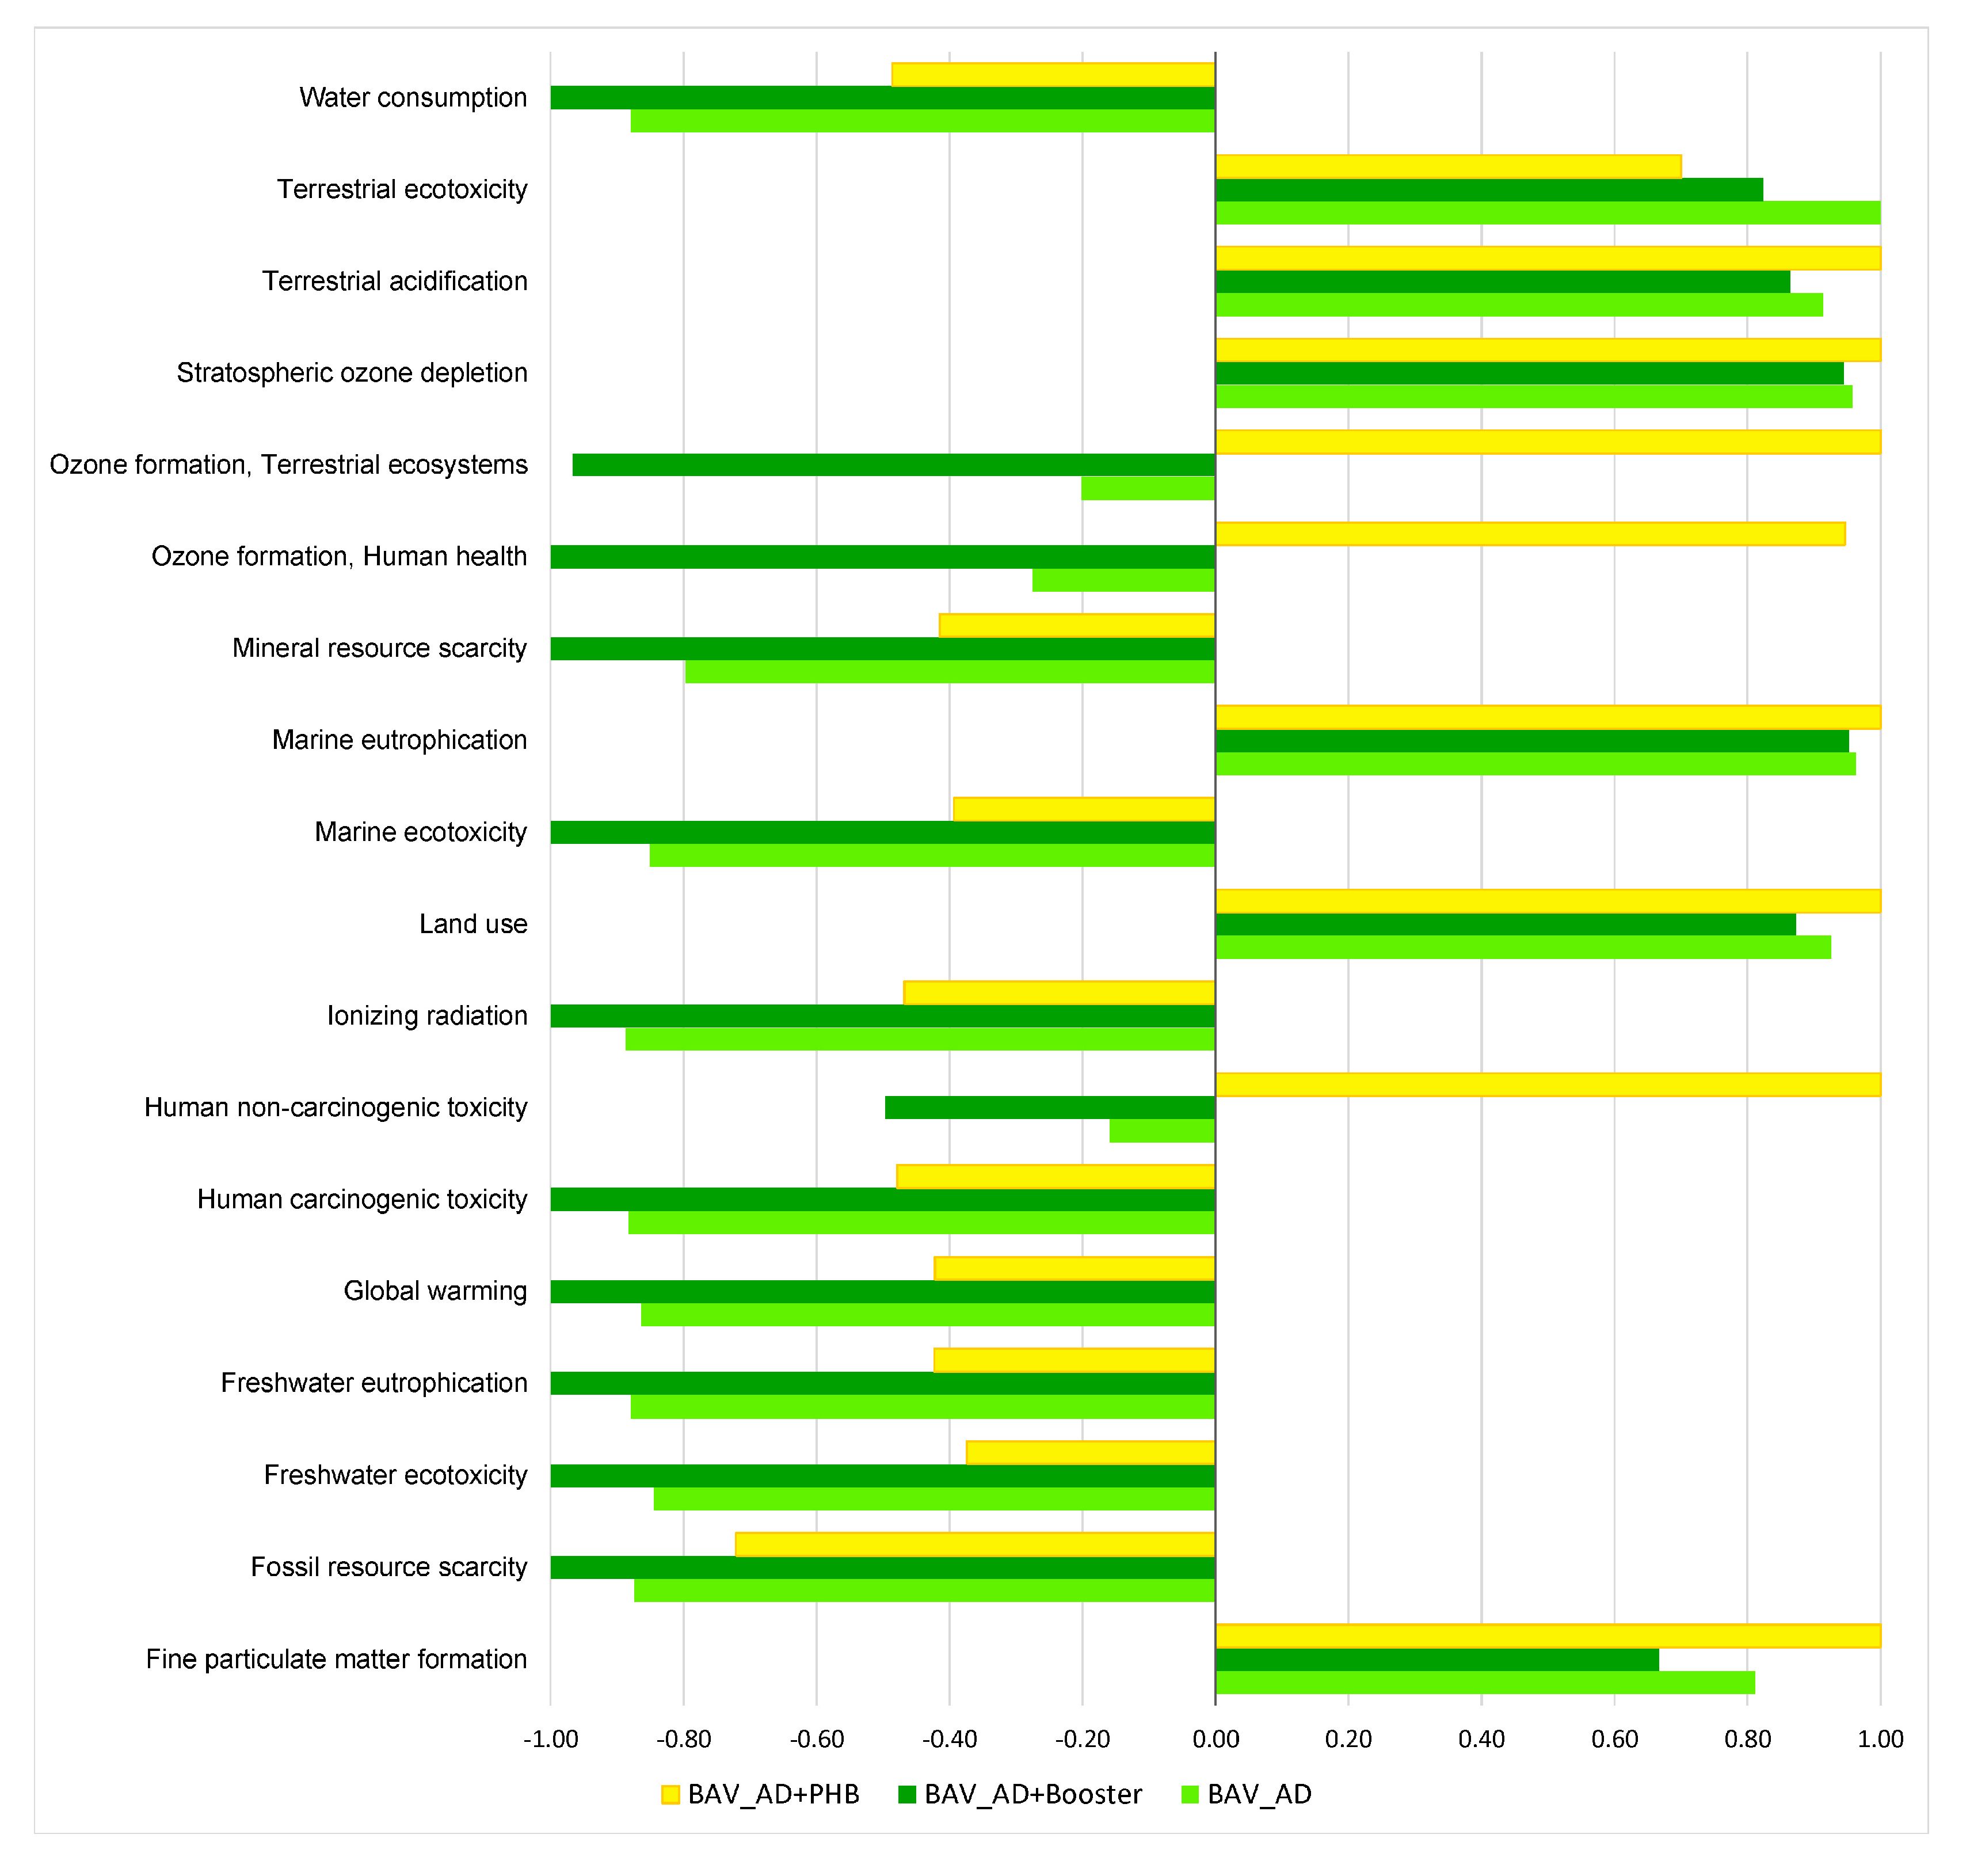
Results were obtained both at midpoint and endpoint level, using the ReCiPE 2016 (H) LCIA methodology. The results were internally normalized and ranked relative to the best-performing technology scenario. Midpoint level results for both regions and scales showed, for the most part, the same technology preference, pointing to AD + Booster as the best performer across impact categories (ICs), followed by AD and lastly AD + PHB. In the Veneto region, slightly more variation is observed across impact categories (Figure 6) and AD + PHB can at times be the best performer, as seen in the Ionizing Radiation, Land Use, and the Mineral Resource Scarcity ICs. The importance of this variation was tested with TOPSIS and is discussed further in Section 3.4.
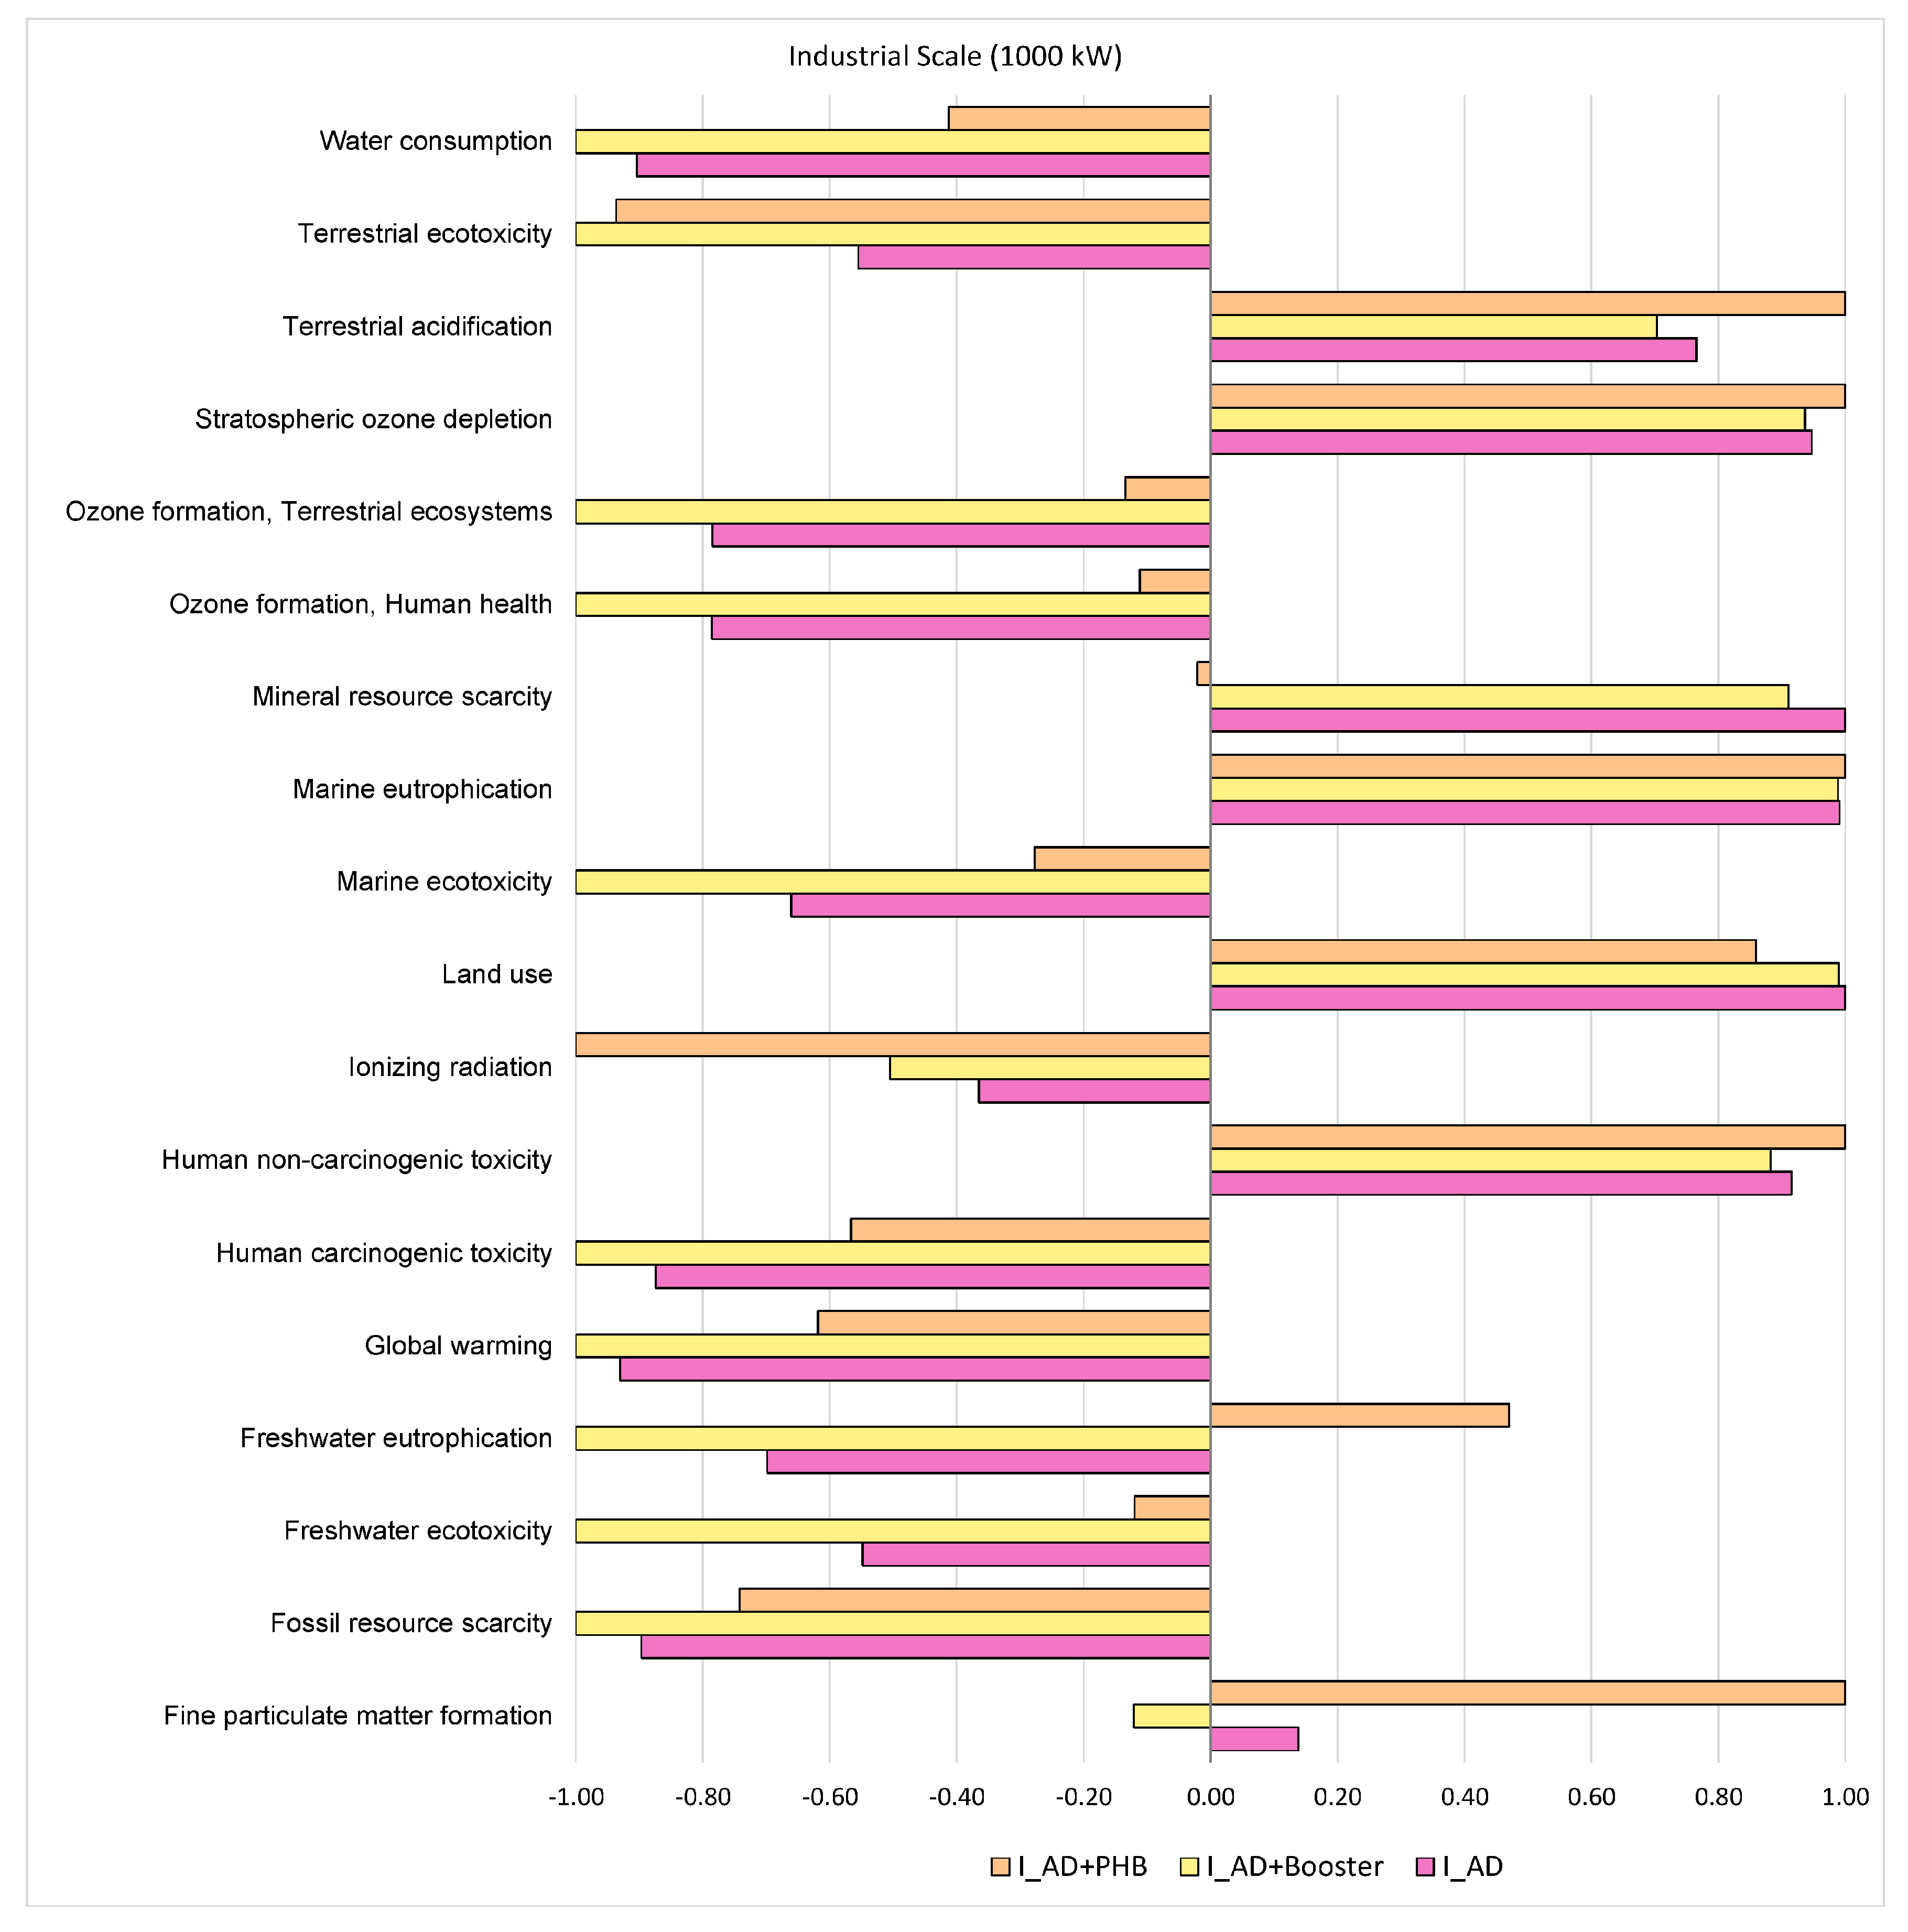
Midpoint results for the two farms assessed the small scale 200 kW farm in Bavaria and the 1000 kW farm in the Veneto region showed identical preference to the regional assessment when ranked within geographical location. However, more rank switching is observed when ranking is done across scales; this is explored further and discussed in Section 3.4., where rank reversal is checked thoroughly for both regional and scale assessments. Figures of normalized midpoint impacts for the Bavarian region, small and industrial scale are shown in Appendix B (Figure A1, Figure A2 and Figure A3), as well as tables of raw midpoint/endpoint results (Table A8, Table A9, Table A10 and Table A11).

3.3.2. Global Warming

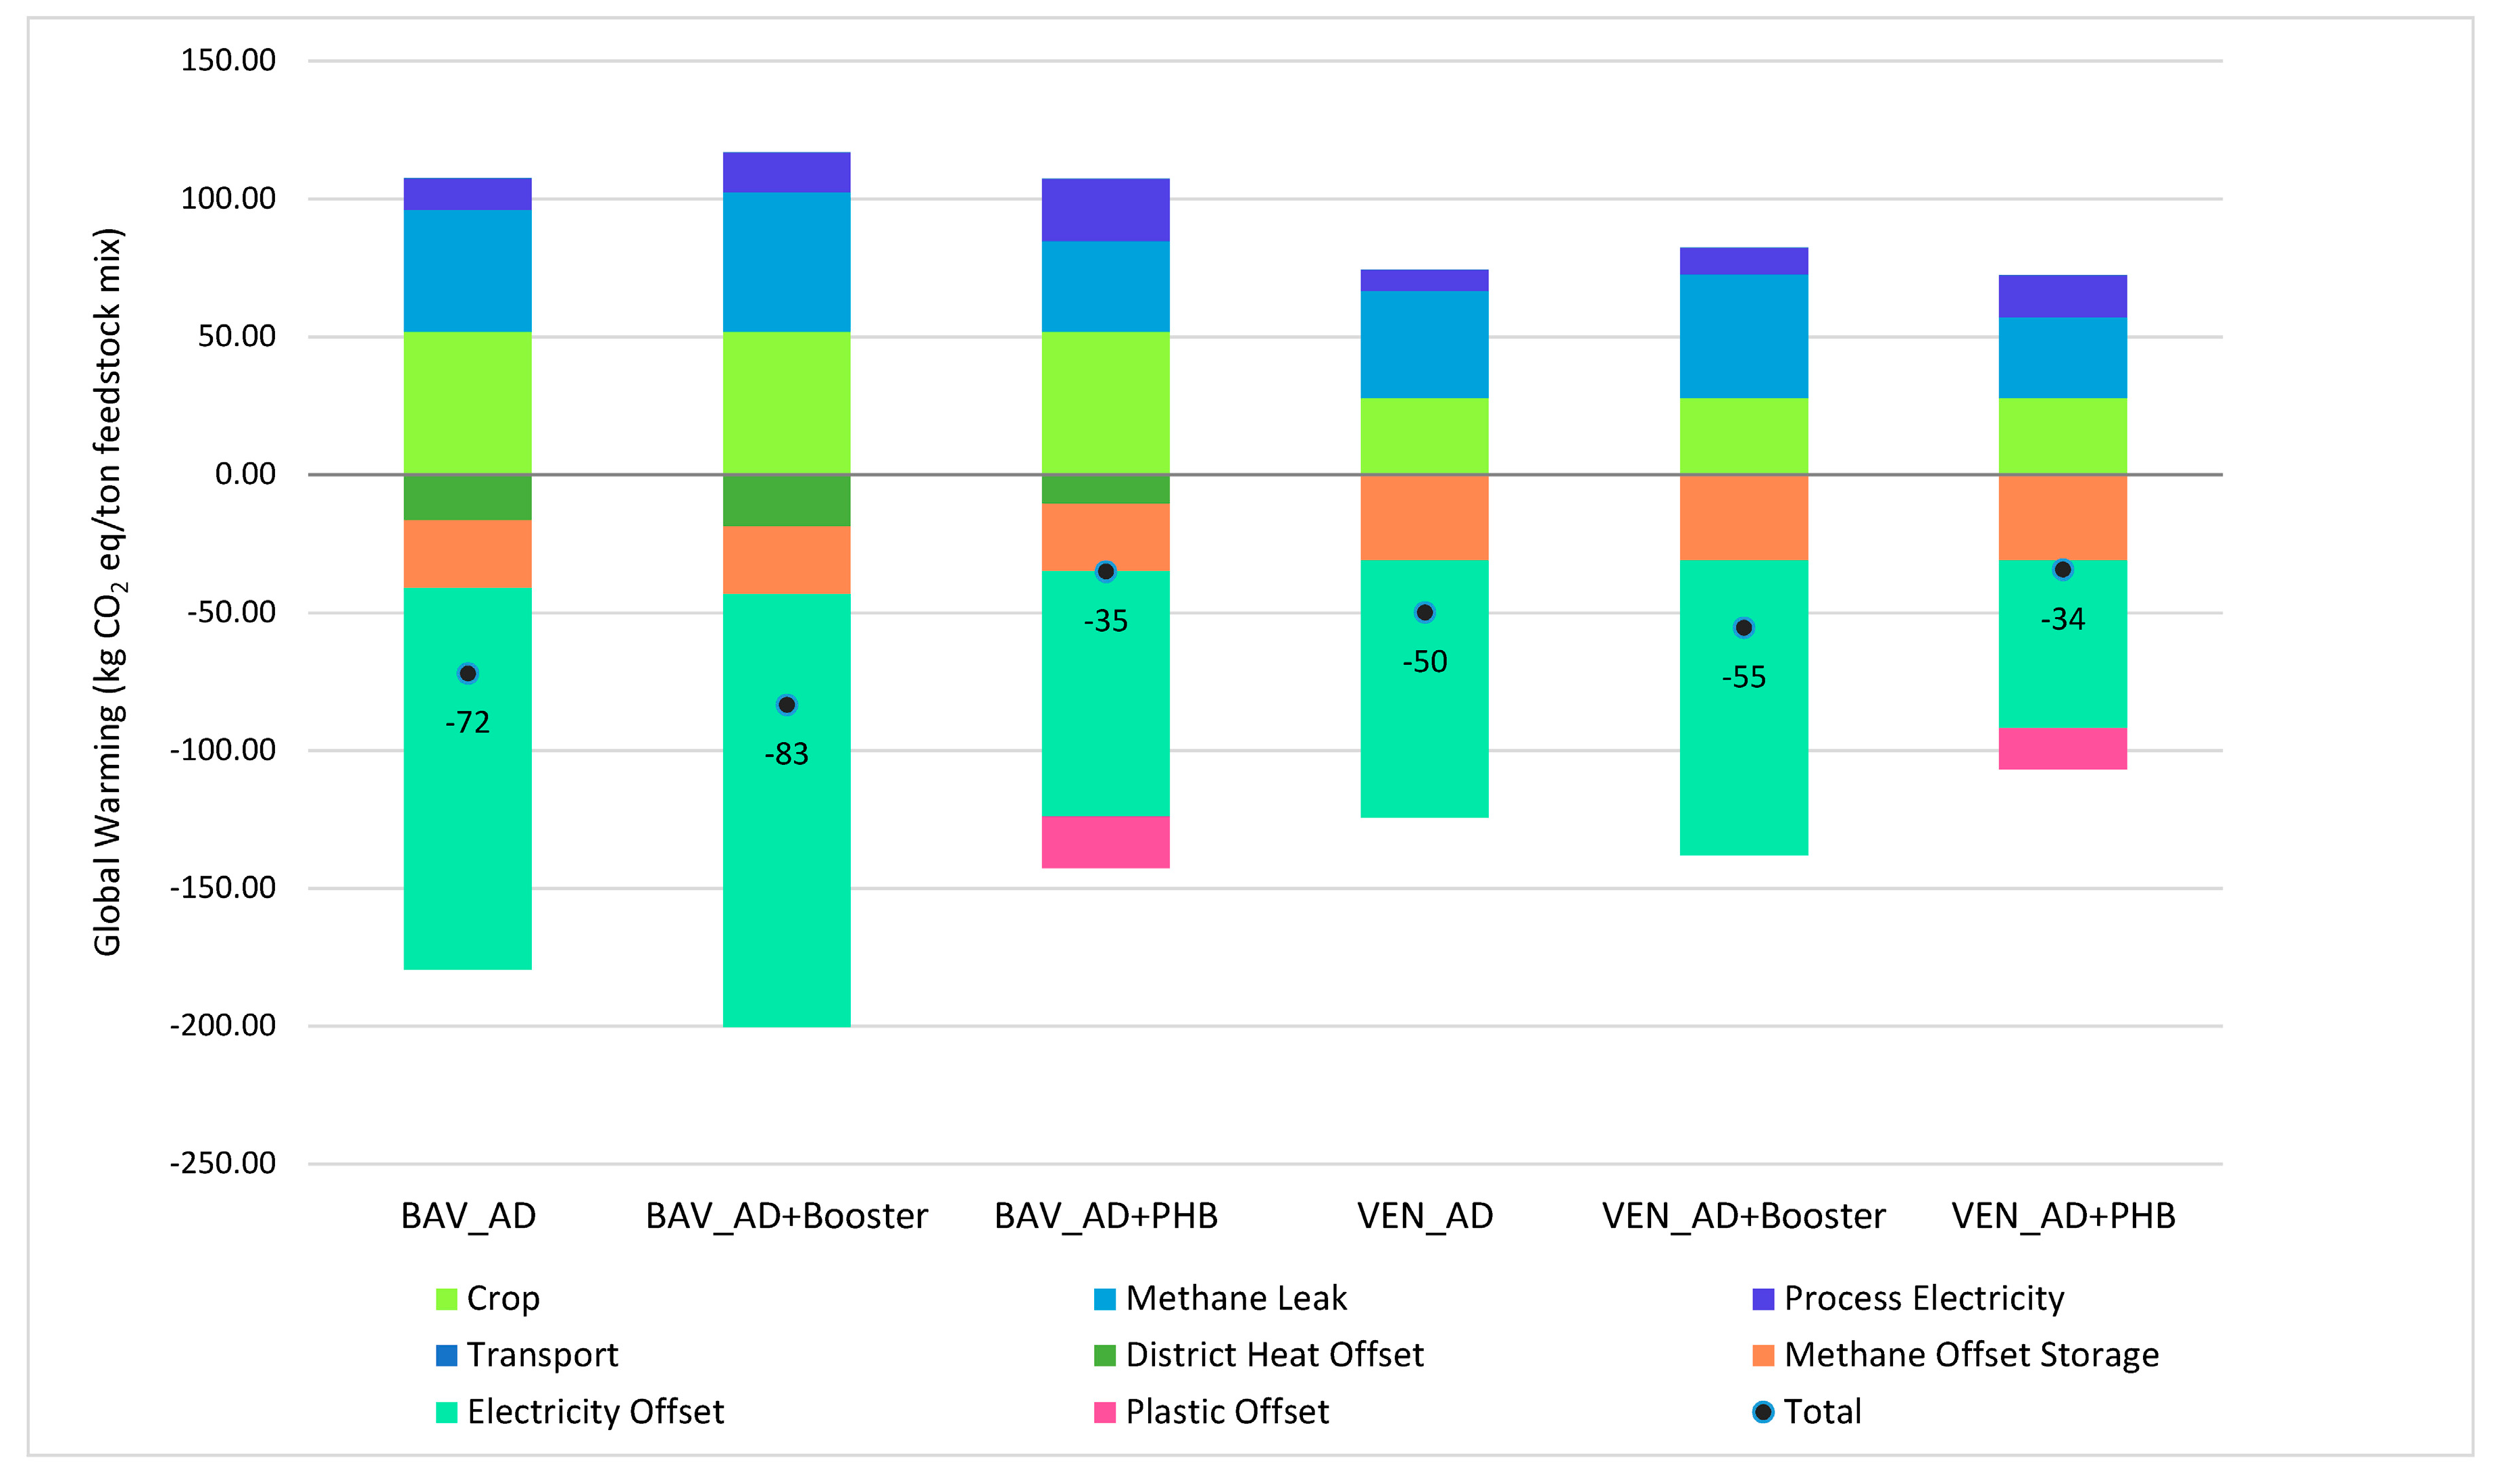
As mentioned previously, global warming potential (GWP) shows the same technology preference as other ICs, with AD + Booster performing better than AD, which in turn performs better than AD + PHB. Looking at the contribution to GWP from the various elements that make up the system, it is possible to understand this preference. As can be seen in Figure 4, the higher energy production of the AD + Booster induces a higher electricity offset, which is largely responsible for the technology preference exhibited by the results. It is also evident that the offset for substituting plastic in the market for the AD + PHB options is very moderate and occurs on account of lower energy production, resulting overall in the lowest GWP savings out of all technology options. Figure 4 also shows the difference between the two regions on a per ton feedstock mix basis. An important difference can be observed in the crop mixture used for each region, where it is evident that Bavaria uses a more burdensome mix than Veneto. Other than crop differences, methane leaks from the facilities, here assumed to be 3% of the biogas produced, is an important source of GHGs. This is worth noting, as it can diminish the savings intended by these technologies. On the other hand, an important savings is attained by degassing animal manures, which would otherwise sit in storage facilities for a longer period producing methane that would be released to the atmosphere. This benefit can be seen in Figure 7 as the “methane offset storage” and is higher for Veneto due to the higher availability of animal manures on a %wt basis in this region.
Figure 8A,B, shows total GWP savings for both Veneto and Bavaria, respectively. As a total, the Bavaria region is capable of obtaining GWP savings 7.4, 7.7, and 5.4 times higher than in the Veneto region for AD, AD + Booster, and AD + PHB, respectively, on an annual basis. This is explained in part by the scale of the regions, feedstock density of the regions, as well as the energy density of each feedstock employed in the mix. While Veneto is also the smaller of the two regions, the lower GWP savings are partly due to an average 25% lower feedstock mass production per area relative to Bavaria. Moreover, the regional feedstock mix in Bavaria contains ca. 7% more crops and crop residues, among which maize silage is a prominent one, whilst Veneto contains ca. 7% more animal manures, which have a low methane/VFA productivity. The feedstock mix of Bavaria results in a higher electricity offsets, even though its feedstock mix contains a higher share of primary production (1st Generation) feedstock, i.e., maize silage, rather than secondary production such as straw. In addition, the utilization of waste heat in the Bavarian system for district heating gives an extra considerable impact offset to the region. If the heat were to be utilized in Veneto, then an extra 23%–25% savings in GWP could be attained there.
The pattern of feedstock efficiency is repeated when comparing the technologies on a scale basis. In fact, using more energy dense feedstock, i.e., feedstock that has a higher methane potential, leads to higher GWP savings for the small-scale facility (S + technology scenario), on a per ton feedstock basis, than for the industrial scale (I + technology scenario) (Figure 9). This is true even though the feedstock mix used in the small scale is more burdensome in terms of GWP, due to the cultivation phase of the feedstocks. The industrial scale facility still incurs savings to GWP, albeit lower, due to the poor characteristics of the feedstock utilized, which in this case is ca. 80% cow manure. Technology preference largely stays the same for both scales, though it is worth mentioning that a friendlier feedstock mix, i.e., with less first generation feedstocks, such as the one in the industrial scale is more important for the AD + PHB option, as can be observed when comparing S_AD + PHB and I_AD + PHB, which have savings of −15 and −25 kg CO2 eq/ton, respectively.

3.3.3. Sensitivity

Two parameters were tested to assess the sensitivity of the results: transport distance of the feedstock and the effect of a theoretical future green energy mix in the system.
The effect of transport varies depending on how well the technologies perform. The initial results, which include a 1 km transport distance were varied and transport was added up to 100 km. The result can be observed in Figure 10, where it is evident that a further transport distance can be allowed for the AD + Booster technology in both regions since this is the best performing technology. The point at which each technology scenario goes from GWP saving to GWP burden can also be seen in the graph. This point (the y-intercept) is 86, 99, and 42 kilometers respectively for BAV_AD, BAV_AD + Booster and BAV_AD + PHB, in Bavaria. In Veneto these distances are lower, because of the lower performance of the technologies in this region, where a transport distance below 59, 65, and 41 kilometers for VEN_AD, VEN_AD + Booster, and VEN_AD + PHB respectively, would ensure that the technologies continue to induce GWP savings. Needless to say, the lower the transport distances for the feedstock, the better the technologies perform.
The effect of switching the current production mix for the provisioning of process electricity and electricity offset with a future energy mix mainly composed of renewable sources is substantial for GWP results. For the regional assessment in Bavaria, all technology options result in impact burdens for GWP, while they continue to be impact savings for Veneto (Figure 11). This is due to the feedstock mix emissions in Bavaria, which are no longer counterbalanced by high emissions savings from offsetting of electricity. As has been shown before [26,84], offsets from replacing GHG intensive sources of electricity production such as coal, diminish as ‘green’ energy sources are implemented in the energy grid. The implications of this are very important for technologies producing renewable fuels, as their potential to produce savings will be bound to this future component.
On the other hand, BAV_AD + Booster, which is the worst performing scenario in terms of GWP continues to be the best performing scenario for most other impact categories in the green energy future SA (normalized midpoint results in Appendix B, Figure A4 and Figure A5). As this clearly points to burden shifting the results were subjected to two single indicator interpretation methods to clarify the results.

3.4. Single Score Interpretations

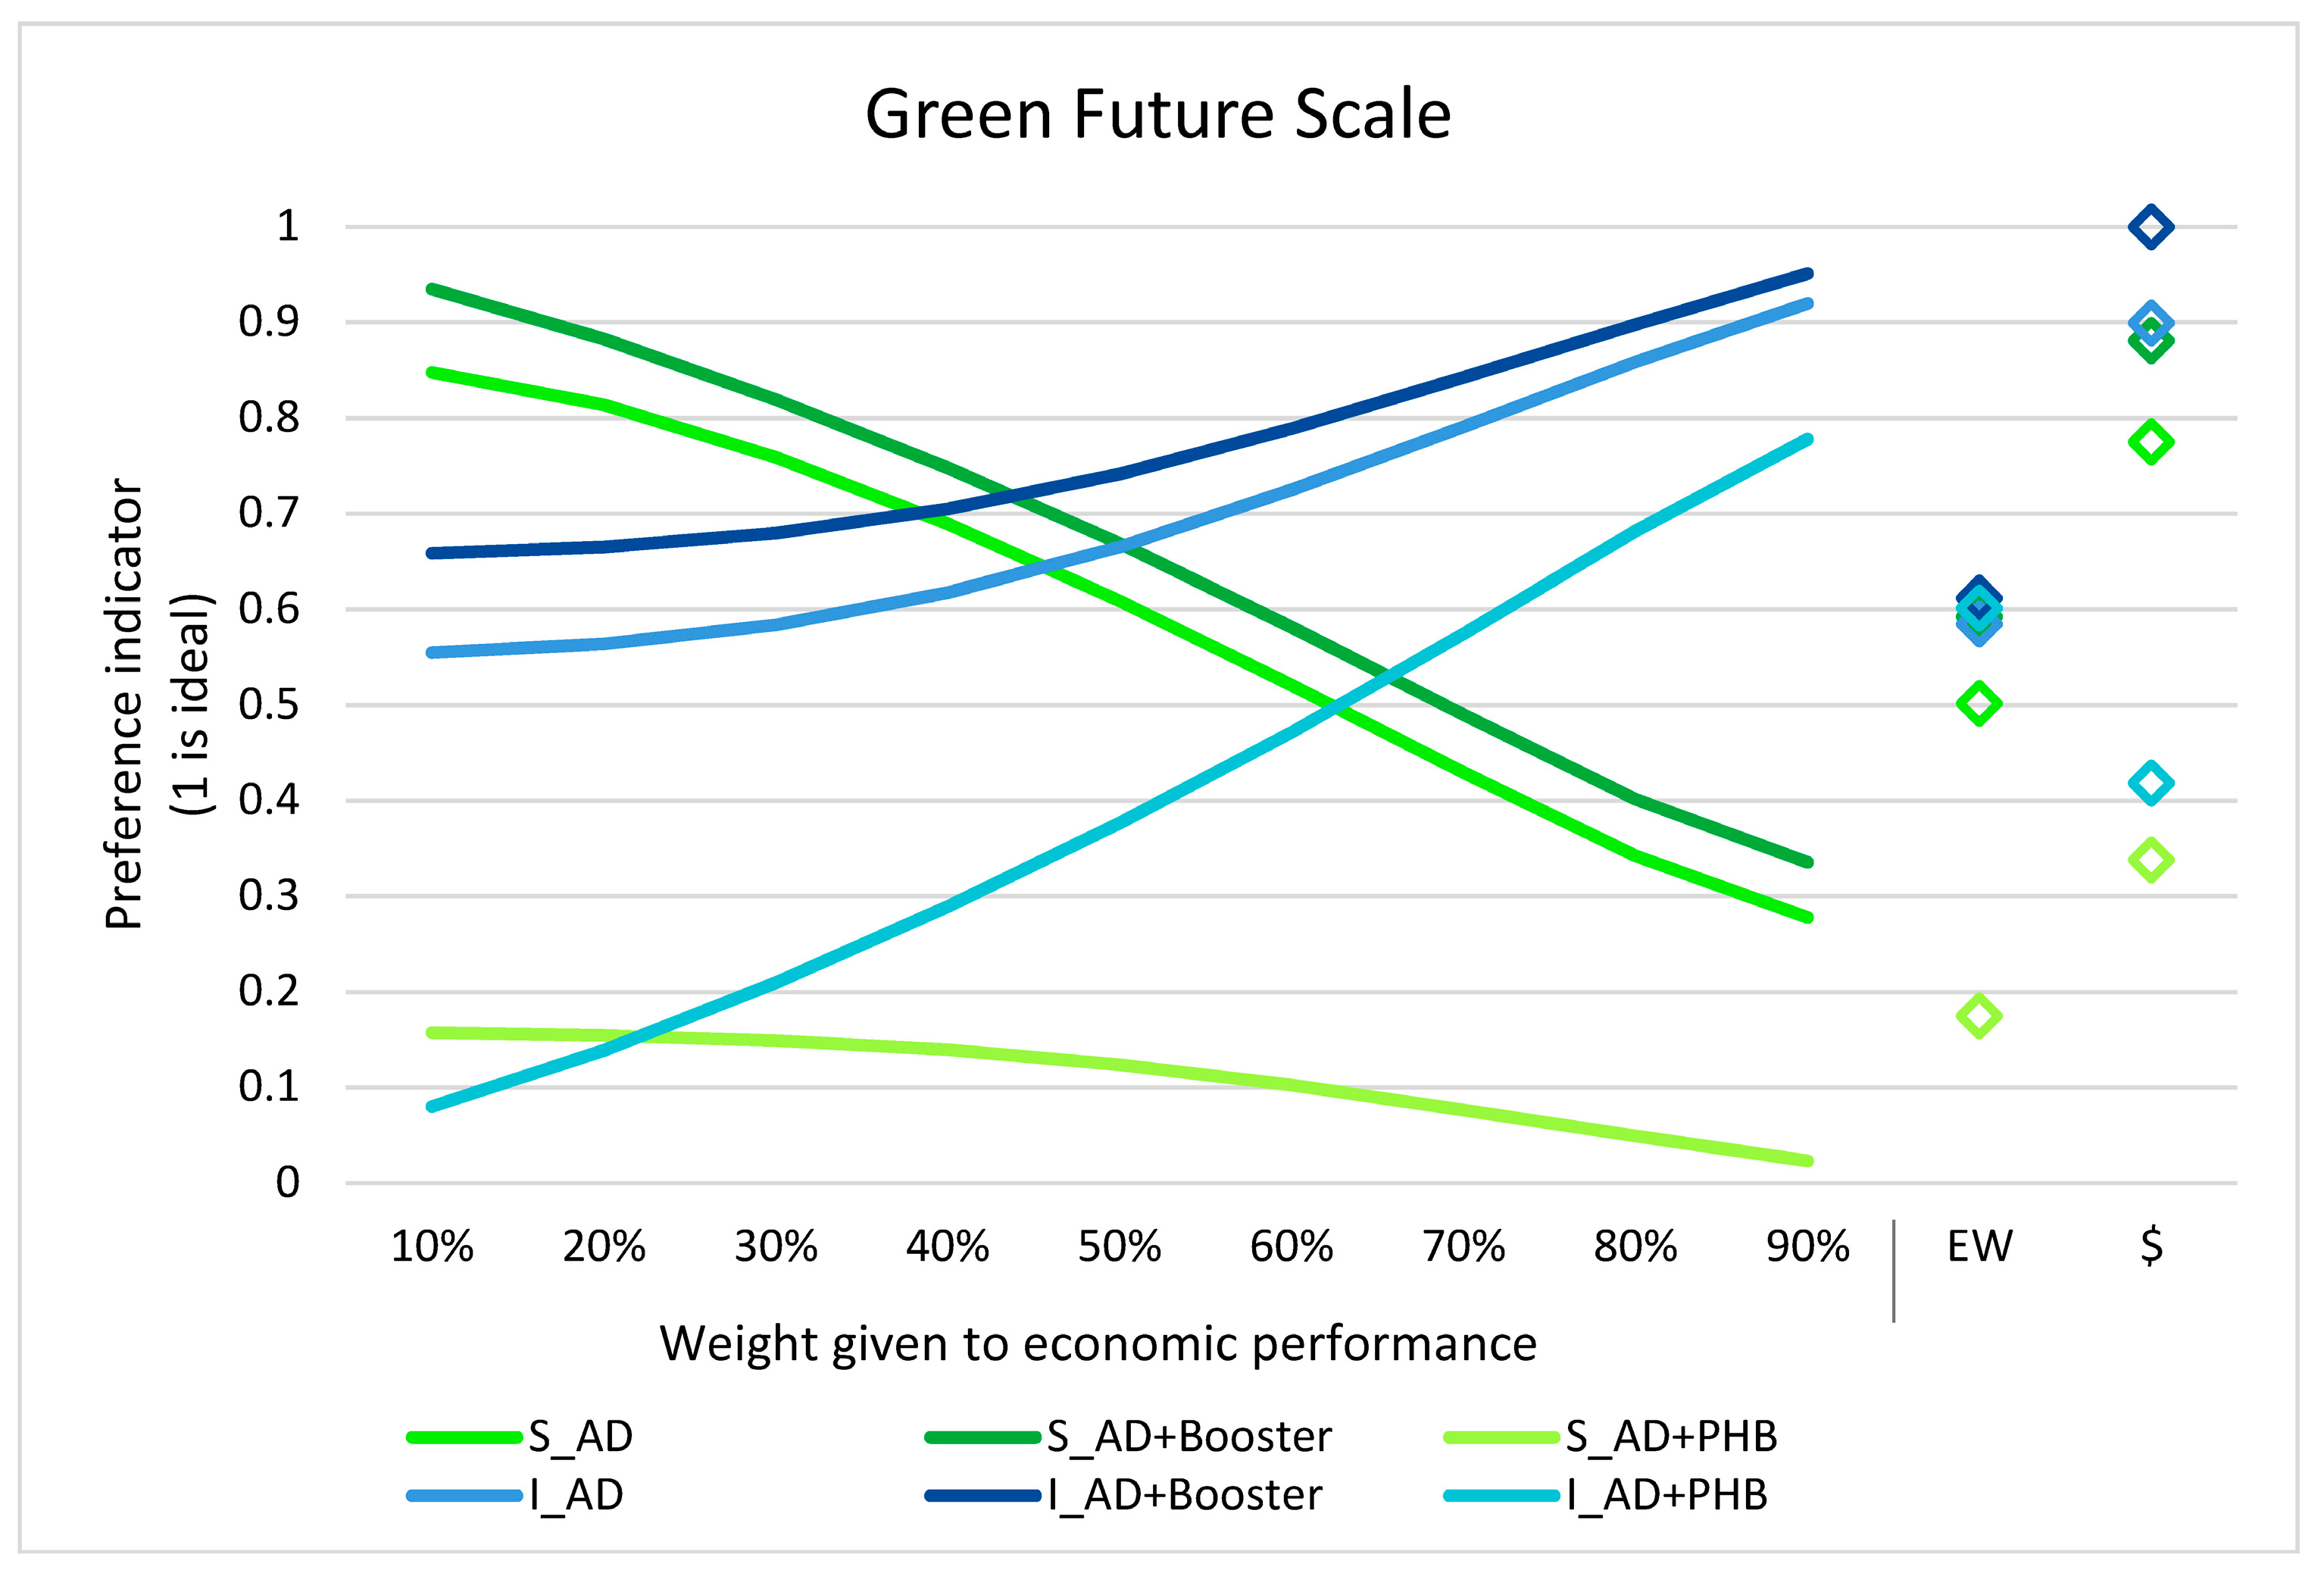
Single score results, via TOPSIS developed by applying the ArgCW-LCA methodology [75], with environmental weights relating the results to a European’s consumption patterns, and an economic weight derived from the TEA are discussed in this section. When assessed through TOPSIS (Figure 12), the initial regional results are very clear. Technology preference does not change within each region no matter which weighting is given to the results. AD + Booster is always the preferred choice, whether there are equal weights and high or low weight is given to economics. Furthermore, when impacts are monetized ($) so that the costs of environmental protection are visualized, these results also agree with the ArgCW-LCA and equal weights (EW) TOPSIS results. From the figure it is clear that the AD + Booster is also the best performer in terms of economic preference in Veneto (going up to 90% econ level), and on the contrary AD + PHB appears to be the worst. However, it is worth noting that in the Veneto region, if environmental concerns are weighed more heavily (<55% econ level), it is not easy to single out one of the technologies as unequivocally the best performing option, since the results perform close to equally well. This is not the case for Bavaria where the more burdensome feedstocks result in a more indisputable preference for the AD + Booster option, which produces the most energy. The implication of these results, namely that the more burdensome the energy production is, the more important the energy offsets become, is even more obvious for the plant level assessment. Here we see that though the technology preference is always the same (AD + Booster > AD > AD + PHB), the relative difference between the options becomes smaller the higher the economic weight (approaching 90%) for the Industrial plant in Veneto. This is a different pattern than the one observed for the regional level, where the distance between options, with and without PHB, increases with economic weight, and as supported by the assessment of midpoint results, the technology scenarios are closer to each other when the feedstock mix contains more animal manures than crop residues (see Figure 9). The same trend is seen for the small-scale plant in Bavaria, where the distance between the AD + Booster and AD + PHB option decreases with increasing economic weight. Though in this case, the plant’s economic performance, which is very low in comparison to the industrial plant, is an important factor pulling all technology options further from the ideal.
The green energy future sensitivity was also checked with the single indicator methodology. The results again showed to be robust in terms of technology preference for the assessment (Figure A6 and Figure A7). It is important to point out, however, that if the decision was based solely on GWP, then when looking at the green energy future one would choose AD + PHB in Bavaria, but continue to choose the AD + Booster in Veneto (Figure A6, Appendix B).
Overall the results are robust, though some clear patterns emerge. The single indicator results clearly highlight the dependency on the energy extraction efficiency of the options, which have increasing importance for regions with a more burdensome production, i.e., in the cultivation of energy crop for biogas production (the BAV and S scenarios). In this case, the electricity offsets are very important, not only for GWP, but all impact categories considered in an LCA, as evidenced by the single indicator preference. There are trade-offs when production utilizes a higher share of energy crops. On the one hand, electricity production is higher and with today’s electricity mixes offsetting this type of production is highly valuable. On the other hand, it is worth noting that sustainability criteria for biofuels and biomass fuels might limit this type of production even more in the future. As it stands today, the renewable energy directive II sets out a cap on energy crops for renewable fuels and national caps are also present in various member states. The EC has also singled out feedstock of high potential for indirect land use change (iLUC), so that renewable fuels do provide the GHG reductions they are meant to bring. Though small plants are exempt from this cap (ca. <500 kW electric), one needs only to look at the German case, where around 50% of plants are small, as an example of how many small biogas plants can in fact have large consequences for how agricultural land is used.
The assessment also shows that varied production, i.e., not only energy, can be a viable option for plants with a high content of manures in the mix. In a future with an optimized PHB production this might be even more beneficial, also if we are to avoid the impacts of microplastic pollution, which are yet to be included in LCA studies. For now, strong subsidies are needed to increase technology penetration in the market with constant revision on sustainability targets. Continuing to green the energy grid should be a top priority by making as much energy as possible and fomenting technologies that increase the energy that can be obtained from biomass (like the AD booster). Future research on the possible synergies between technologies such as the AD-Booster + PHB could be interesting to explore.
4. Conclusions

The production scale of the industrial set up assessed, with electricity ca. 1 MW and crude PHB production at ca. 300 ton/y, is small compared to their fossil and non-fossil alternatives. As a result, the financing, maintenance, and labor related costs increase the break-even prices significantly. Crude PHB production in AD plants requires the co-production of electricity in order to be adequately valorized, though benefits from avoided plastic particle pollution, which could be important, have not been included in the TEA and LCA. With today’s energy mixes in the regions in question, it is highly valuable to offset electricity production and thereby options such as the AD + Booster are preferred for all environmental areas of protection. Material production in scenarios such as the AD + PHB perform equally well to more energy efficient scenarios for plants with a feedstock mix high in animal manures. Future caps on certain types of feedstock are worth considering when deciding on technology options to be implemented and/or subsidized.

Author Contributions

Conceptualization, G.C.V., J.V., J.S., and M.B.; methodology, G.C.V., J.V., and J.S.; formal analysis, G.C.V., J.V., and J.S.; writing—original draft preparation, G.C.V., J.V., J.S.; writing—review and editing, G.C.V., J.V., J.S., M.B., and S.I.O.; visualization, G.C.V., J.V., and J.S.; supervision, M.B. and S.I.O.; project administration, G.C.V.; funding acquisition, M.B. All authors have read and agreed to the published version of the manuscript.

Funding

This study is part of the NoAW project, which has received funding from the European Research Council under the European Union’s Horizon 2020 research and innovation program, grant agreement No. 688338.

Acknowledgments

The authors would like to thank various members of the NoAW project for their unwavering support and crucial sharing of expert knowledge. In particular, we thank associated farms “La Torre” and “Schiessl” for providing data on their yearly operations. For their valuable insights on the technology scenarios, we thank Innoven and BioVantage, as well as prof. Majone. Finally, we thank Eng. Kayser for her help in finding data pertaining the status of biogas in Bavaria.

Conflicts of Interest

The authors declare no conflict of interest.

Appendix A

Table A1. Grouping of crops, Eurostat names, and codes for crops and residue crop ratios.
GroupingEurostat Code and NameResidue:Crop RatioReference/Assumption for Residue:Crop Ratio
Cereal StrawC1110-Common wheat and spelt1.00[19,21,85]
C1111-Common winter wheat and spelt1.00assumed same as wheat
C1120-Durum wheat0.95Assumed as triticale, [19,21,85]
C1200 - Rye and winter cereal mixtures (maslin)1.10[19,21,85]
C1300-Barley0.93[19,21,85]
C1410-Oats1.13[19,21,85]
C1420-Spring cereal mixtures (mixed grain other than maslin)1.00Average of common wheat, durum wheat, barley and rye
C1600-Triticale0.95[19,21,85]
Rice StrawC2000-Rice1.70[19,21,85]
MaizeC1500 - Grain maize and corn-cob-mix1.13[19,21,85]
LeguminousP0000 - Dry pulses and protein crops for the production of grain (including seed and mixtures of cereals and pulses)1.50Assumed as soy
P1100-Field peas1.50Assumed as soy
Oil-bearingI1140-Linseed (oilflax)1.42[19,21,85]
RapeI1110-Rape and turnip rape seeds1.70[19,21,85]
SunflowerI1120-Sunflower seed2.70[19,21,85]
SoyaI1130-Soya1.50[19,21,85]
Industrial I3000-Tobacco Not relevant for regions
Energy CropC1700-Sorghum1.30[19,21,85]
G3000-Green maize1.00Whole plant [21]
ForageG1000-Temporary grasses and grazing1.00Whole plant [21]
G2000-Leguminous plants harvested green1.00Whole plant [21]
G9100-Other cereals harvested green (excluding green maize)1.00Whole plant [21]
Sugar BeetR2000-Sugar beet (excluding seed)0.23[19,21,85]
Table A2. Livestock unit conversion factors and manure production per animal type [7].
Livestock UnitManureManure
LSUkg/head/dayt/head/year
calves0.408.002.90
bovine0.7020.007.30
male bovine1.0025.009.10
dairy cows1.0053.0019.30
other cows0.8025.009.10
piglets0.030.500.20
other pigs0.304.501.60
sows0.5011.004.00
sheep0.101.500.50
goat0.101.500.50
broilers0.010.100.04
laying hens0.010.200.07
other poultry0.030.300.11
Live poultry average 0.020.200.07
Table A3. Manure collectability factors based on different types of housing and type of production [47,48].
Collectability
factor
Stanchion0.98
Loose housing0.95
Organic0.25
Poultry0.98
Swine0.98
Sheep0.5
Goat0.1
Table A4. Methane potentials of various feedstocks [7].
DMVSMethane YieldMethane Yield
%%L CH4/kg VSL CH4/kg fresh
Pig slurry5.57530014
Cattle slurry977.522516.5
Poultry manure207532552.5
Sheep1 16.5
Goat 1 16.5
Maize silage 23592.5350119
Grass 32592.537591.5
Alfalfa 422.592.540087.5
Sugar beet17.592.530551.5
Straw 587.585225169
Pomace3592.5600194.5
1 Assumed same as cattle slurry. 2 Used for energy crops. 3 Used for forage crops. 4 Used for leguminous crops. 5 Used for rice straw, rape straw, sunflower straw, soya straw, oil-bearing straw, industrial crop straw, and vine shoot.
Table A5. Parameters used for methane emission from manure storage [86].
CattlePigPoultry
Dry matter contentkg DM/kg WW10.85.520
Volatile solidskg VS/kg DM0.7140.6380.638
Methane production in storage (50 days)g CH4/kg VS1998.598.5
Inevitable storage and losses (15 days)g CH4/kg VS5.729.5529.55
Table A6. Composition of global average plastic production, including low density polyethylene (LDPE), high density polyethylene (HDPE), polypropylene (PP), polystyrene (PS), polyvinyl chloride (PVC), polyethylene terephthalate (PET) and polylactic acid (PLA) [87].
Polymer Type
LDPE22.8%
HDPE18.6%
PP24.3%
PS8.9%
PVC13.6%
PET11.8%
PLA0.1%

Appendix B

Figure A1. ReCiPE 2016 (H) midpoint results for the region of Bavaria. Results are normalized per impact category to the worst or best performing scenario. Negative values show impact savings while positive values show burdens.
Sustainability 12 03676 g0a1
Figure A2. ReCiPE 2016 (H) midpoint results for the region of the industrial scale plant. Results are normalized per impact category to the worst or best performing scenario. Negative values show impact savings while positive values show burdens.
Sustainability 12 03676 g0a2
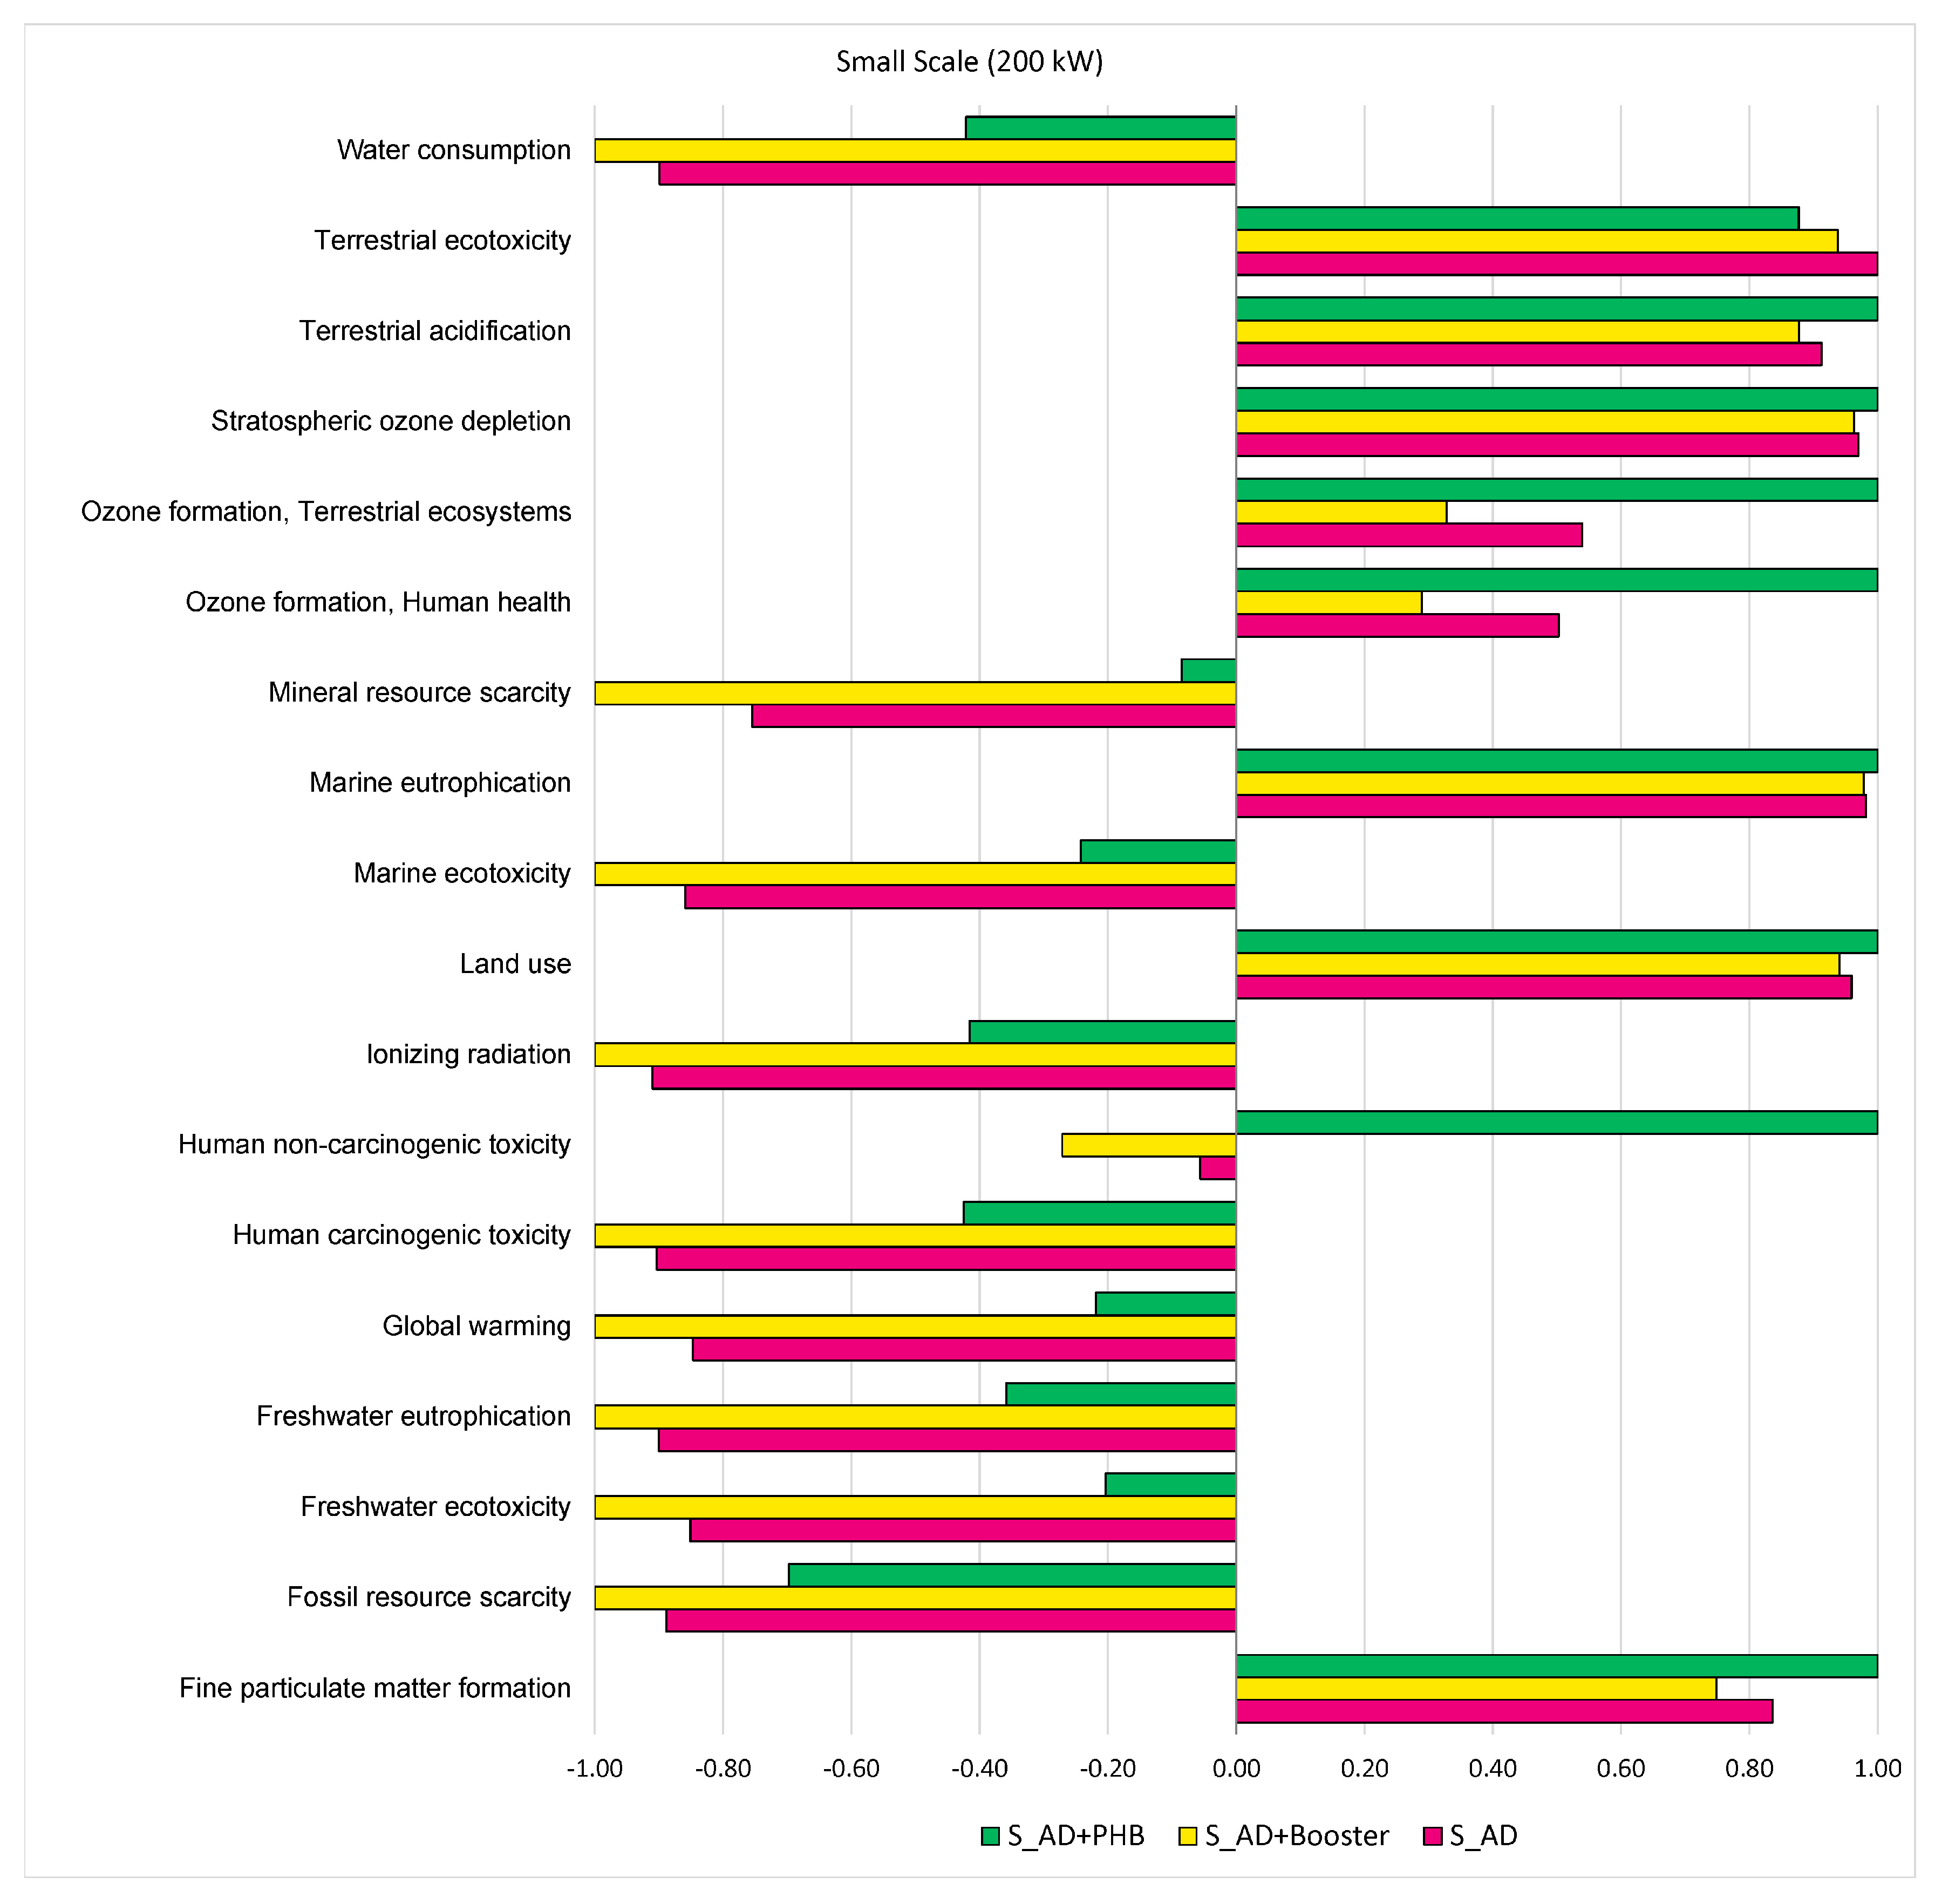
Figure A3. ReCiPE 2016 (H) midpoint results for the small-scale plant. Results are normalized per impact category to the worst or best performing scenario. Negative values show impact savings while positive values show burdens.
Sustainability 12 03676 g0a3
Figure A4. ReCiPE 2016 (H) midpoint results with theoretical green energy grid for the region of Bavaria. Results are normalized per impact category to the worst or best performing scenario. Negative values show impact savings while positive values show burdens.
Sustainability 12 03676 g0a4
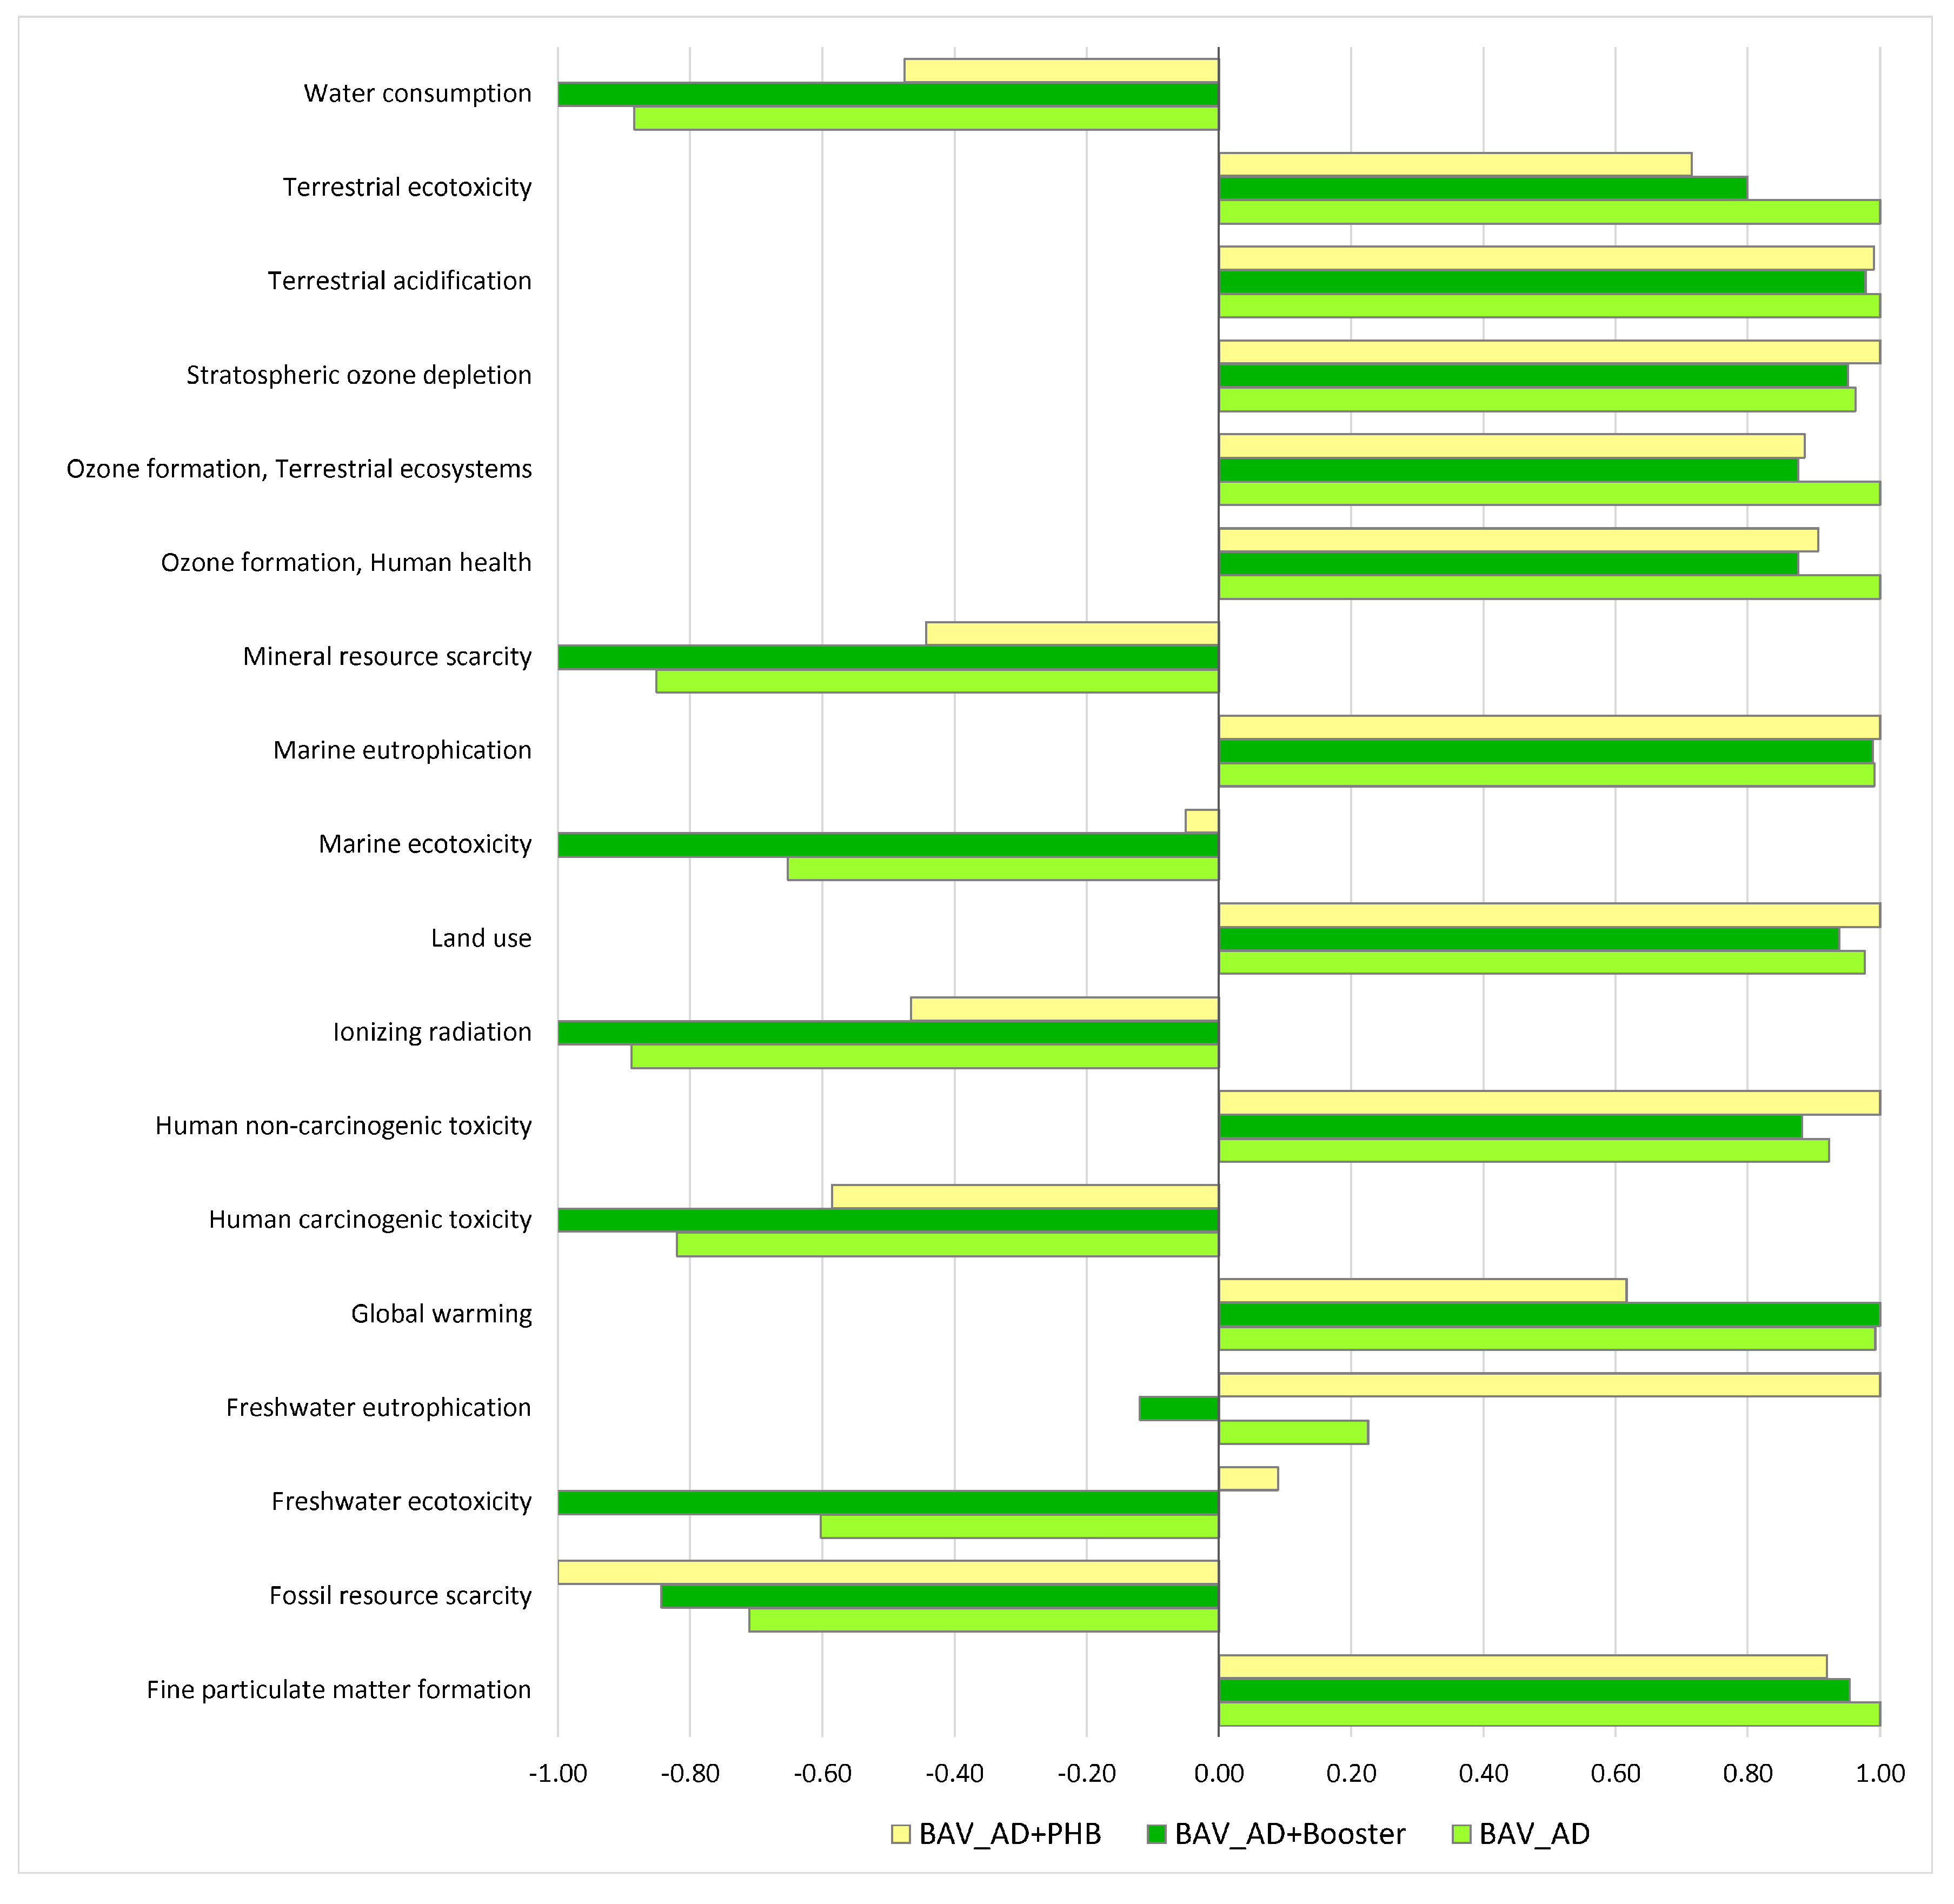
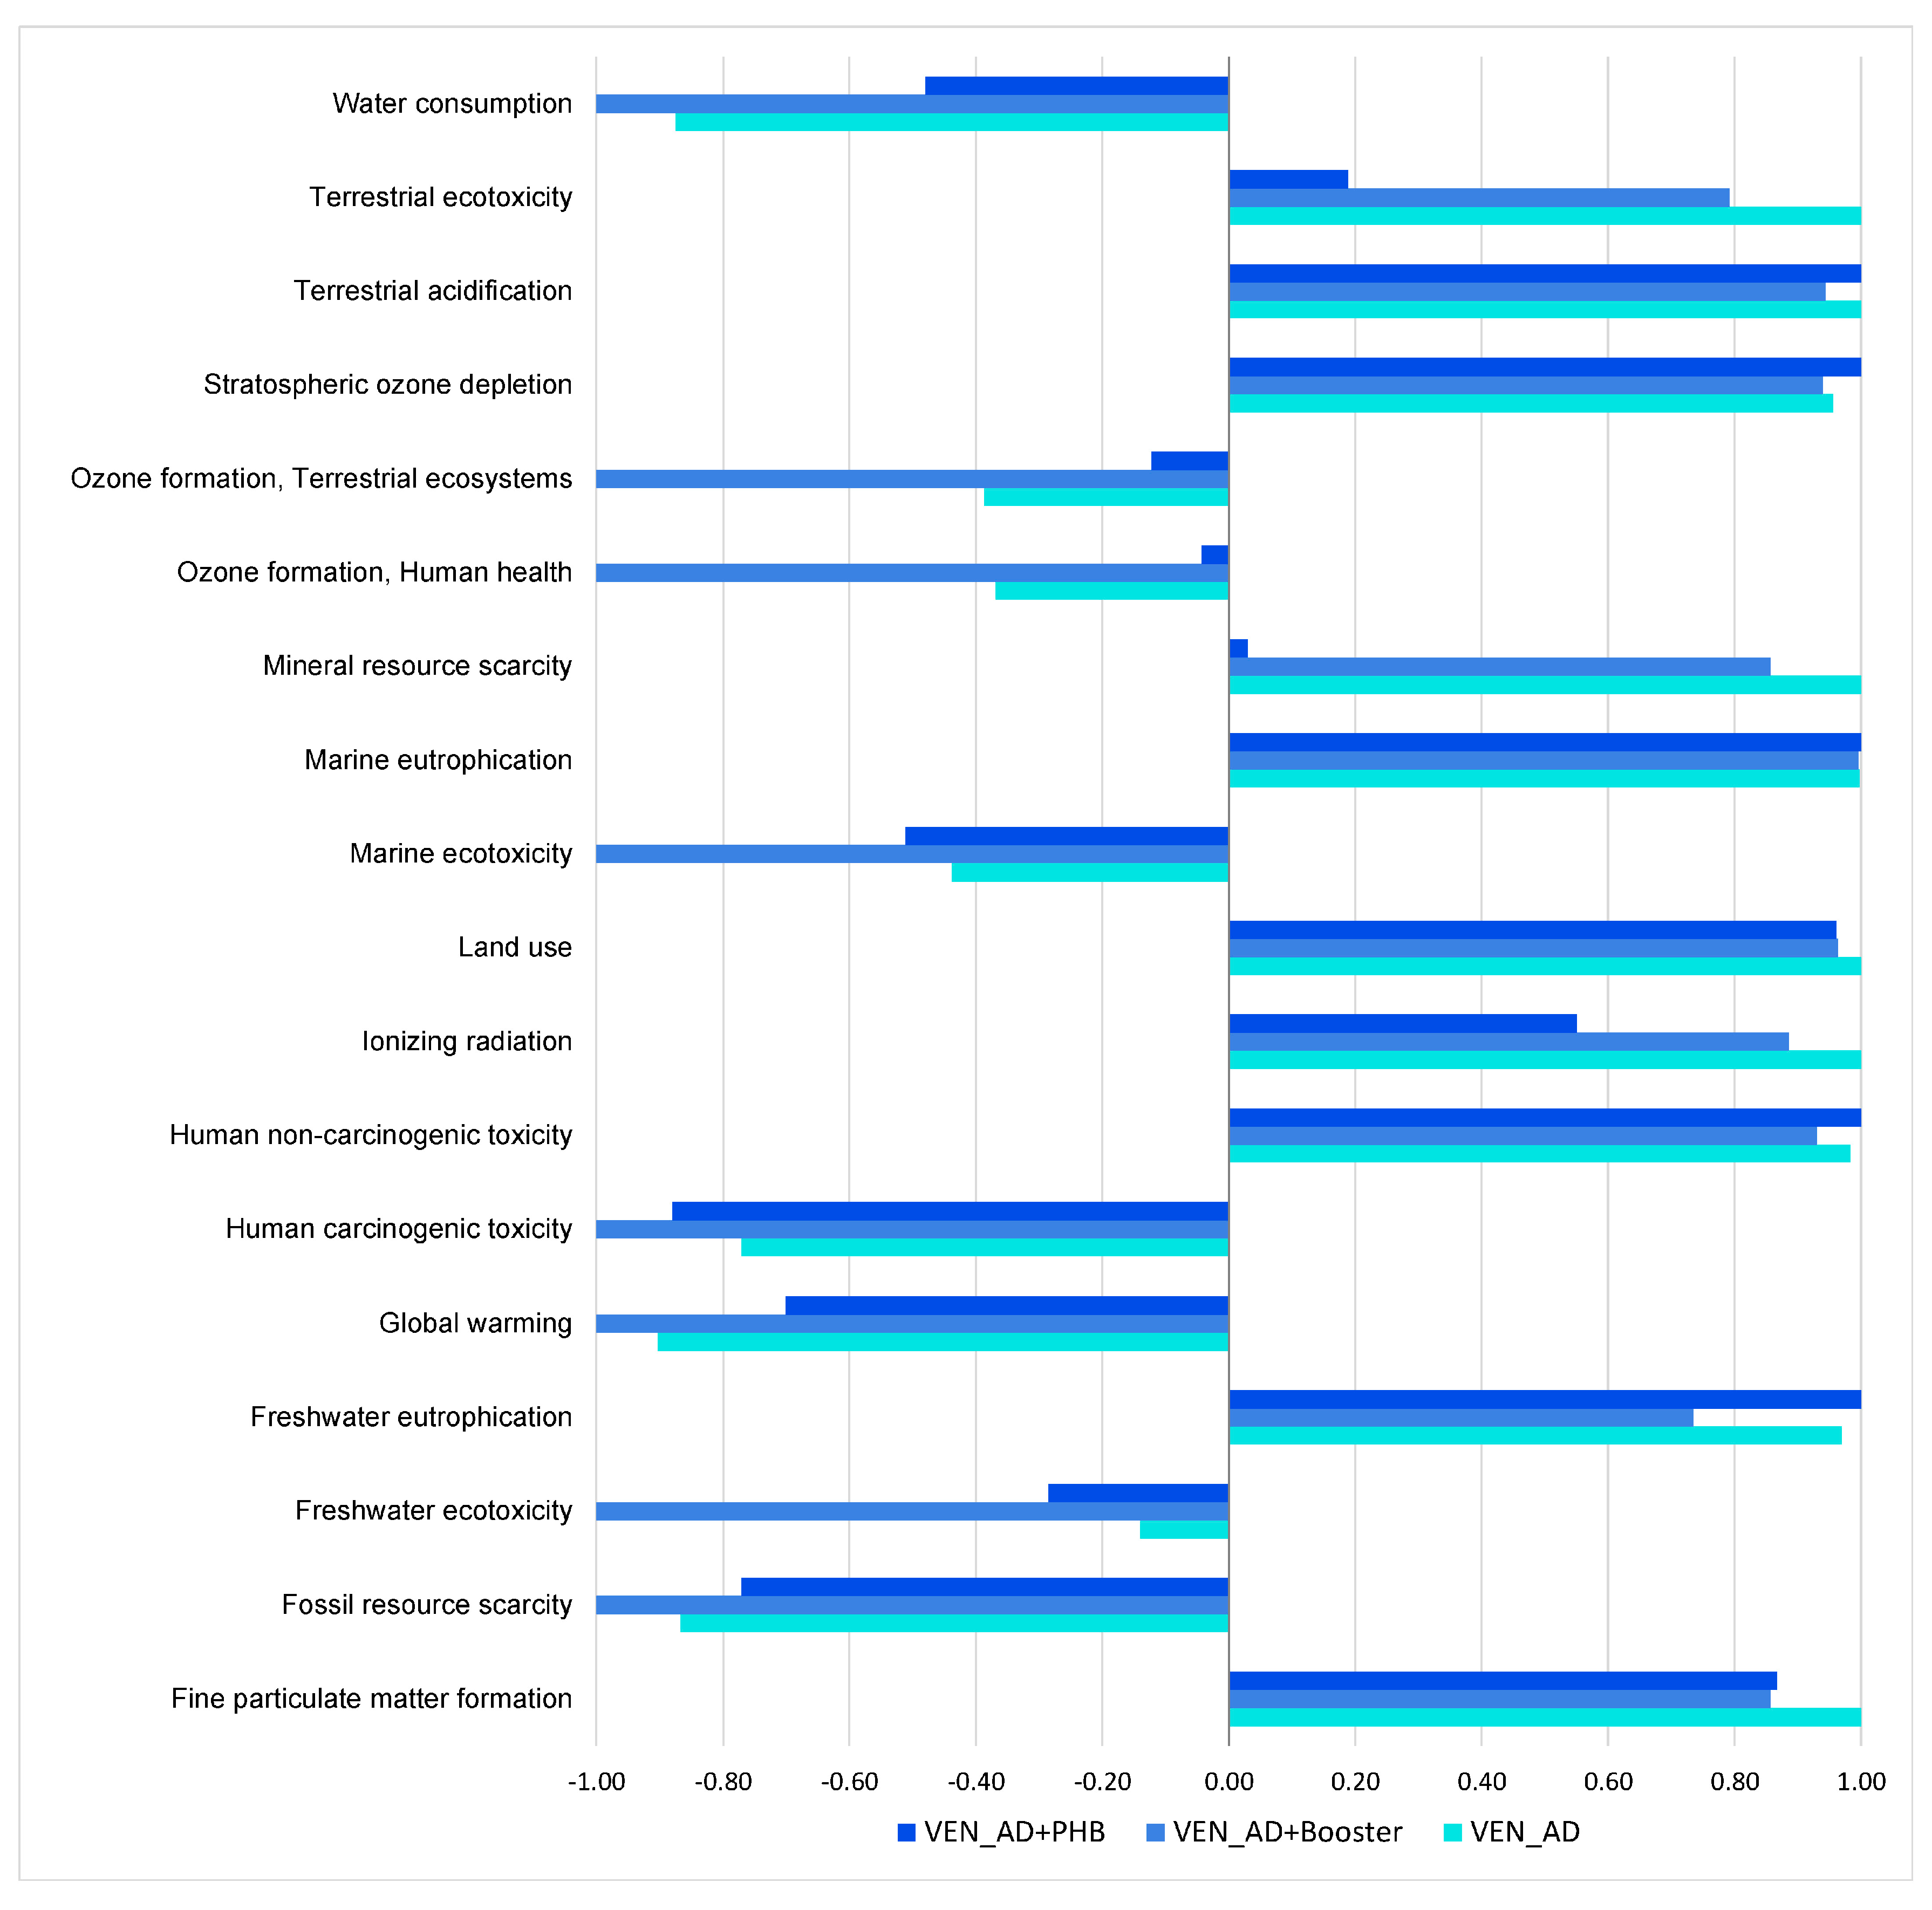
Figure A5. ReCiPE 2016 (H) midpoint results with theoretical green energy grid for the region of Veneto. Results are normalized per impact category to the worst or best performing scenario. Negative values show impact savings while positive values show burdens.
Sustainability 12 03676 g0a5
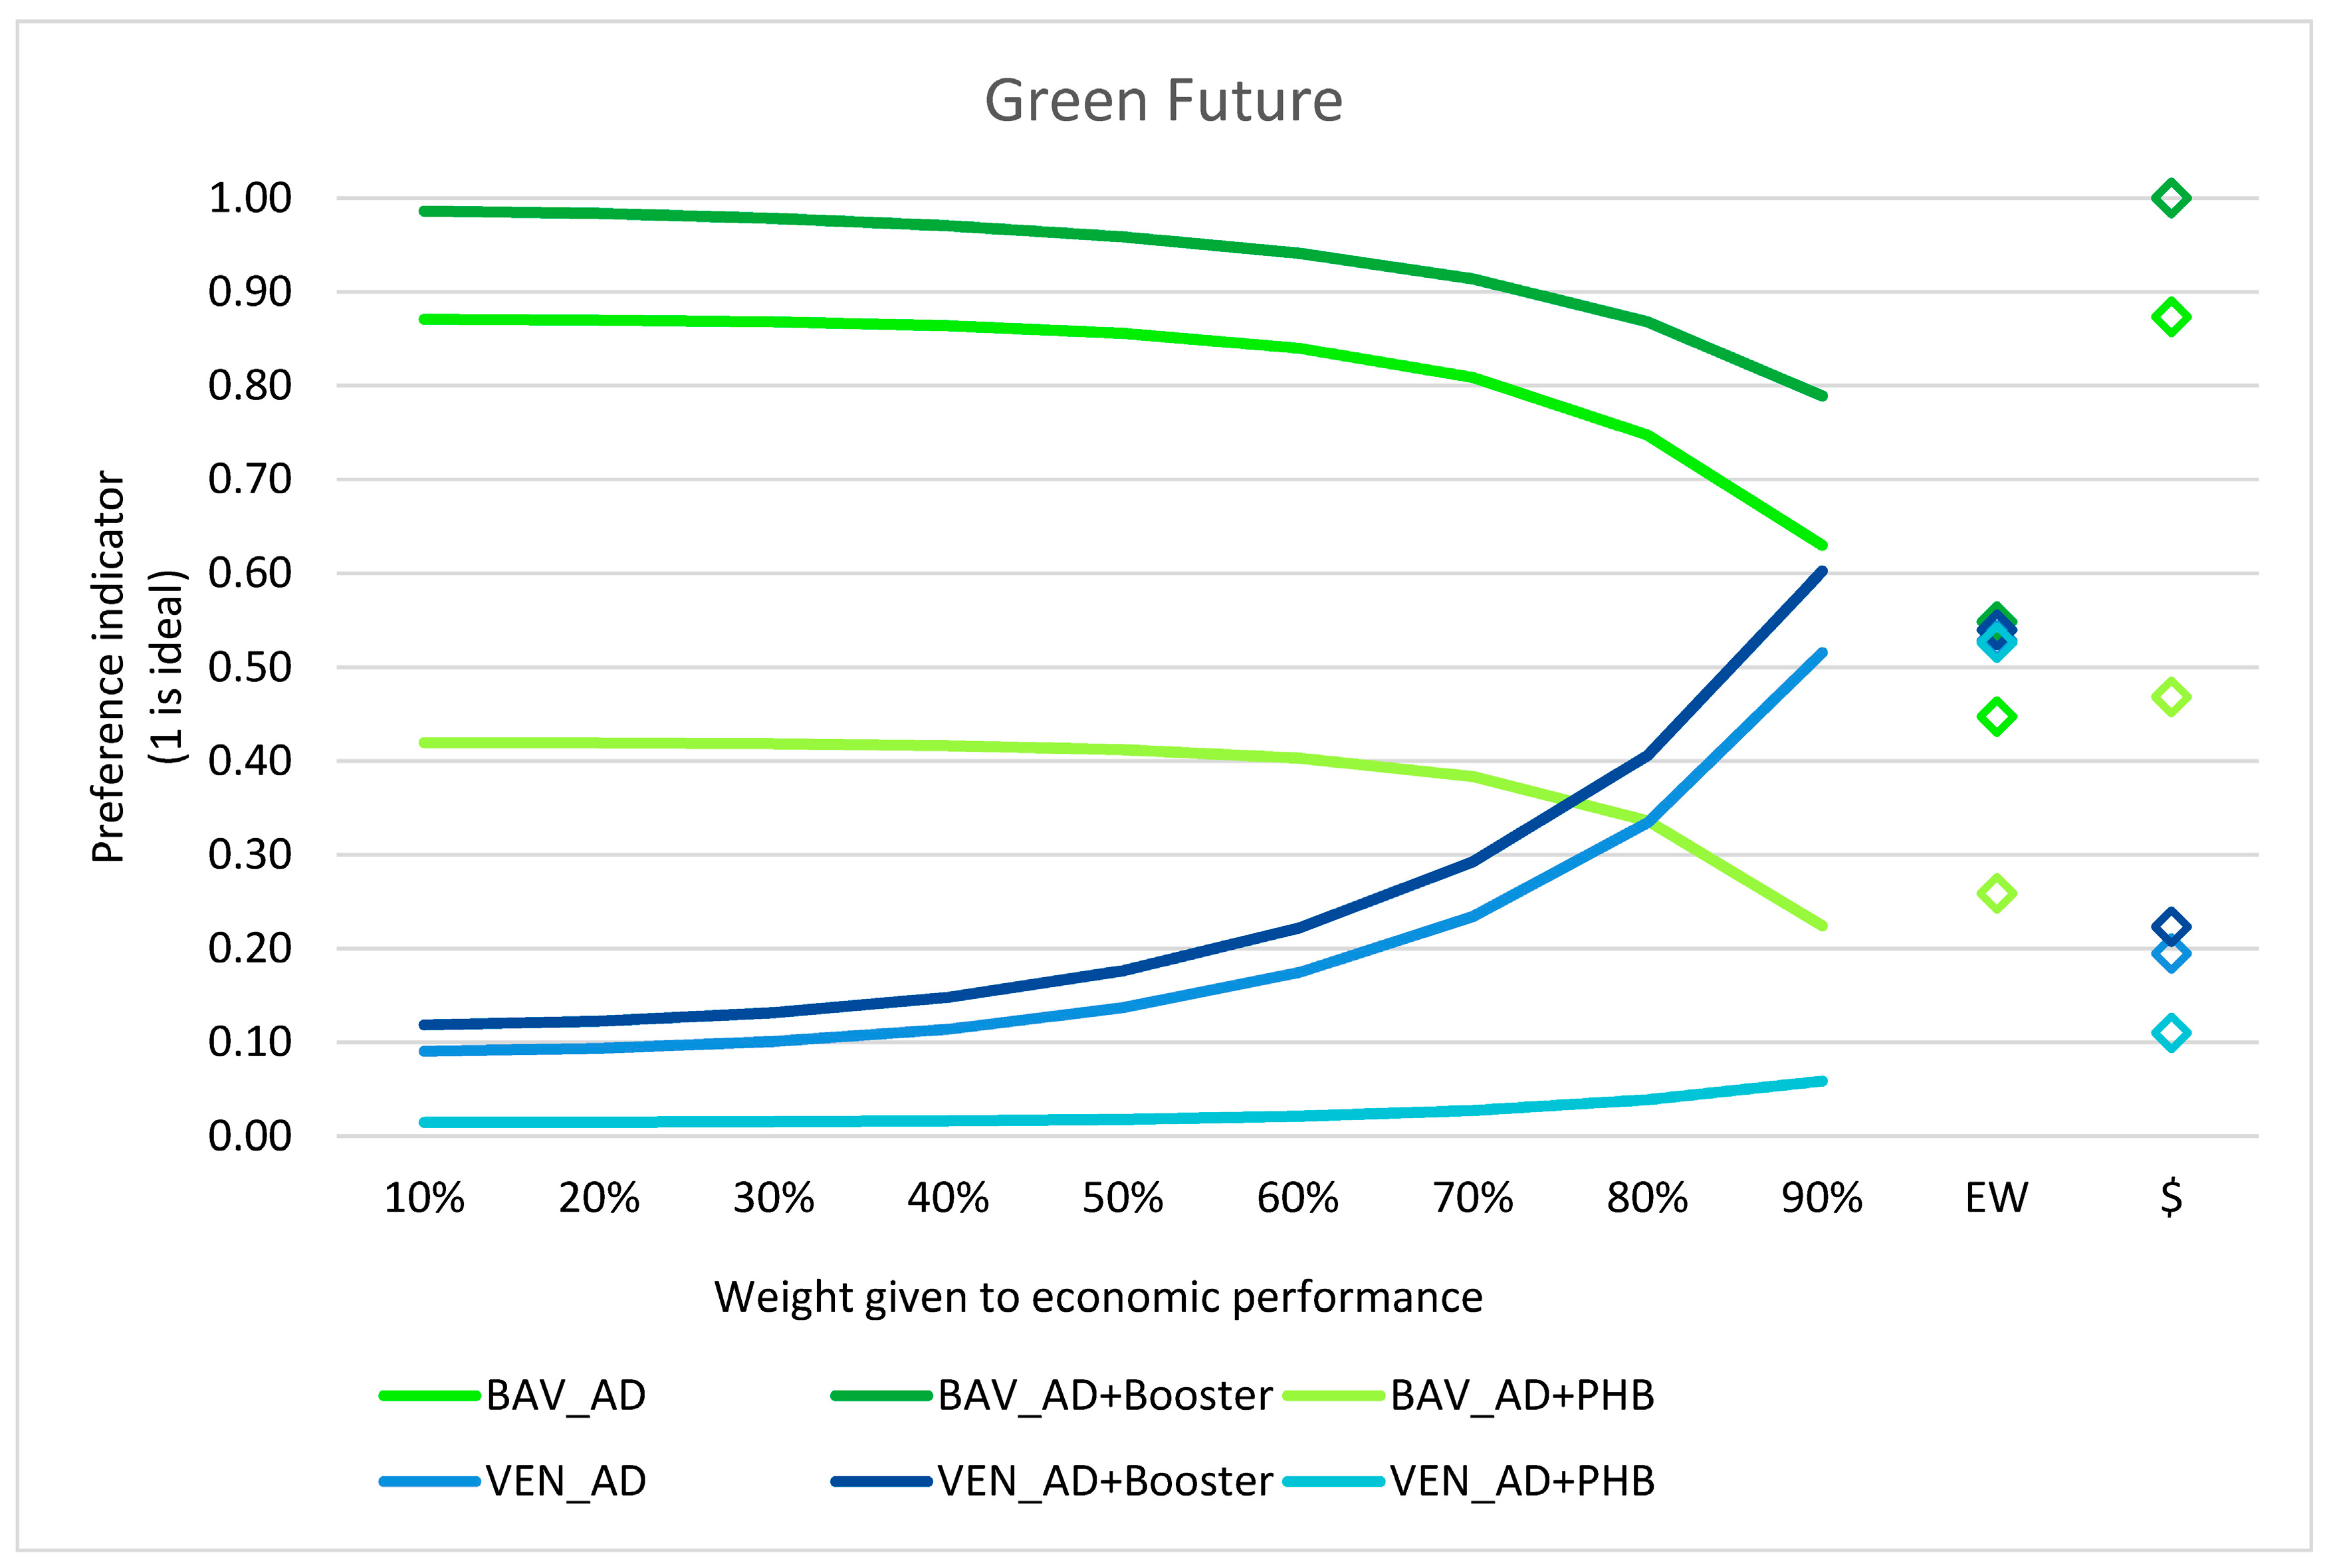
Figure A6. TOPSIS results for the regions with the theoretical green energy mix, with varying economic importance (10% to 90%), equal weights (EW), and internally normalized monetization ($) of endpoint damages.
Sustainability 12 03676 g0a6
Figure A7. TOPSIS results for the two scales S = 200 kW and I 1000 kW, with the theoretical green energy mix, with varying economic importance (10% to 90%), equal weights (EW), and internally normalized monetization ($) of endpoint damages. Scenarios are named as S for small scale and I for industrial scale followed by each technology scenario (AD, AD + Booster, AD + PHB).
Sustainability 12 03676 g0a7
Table A7. Total amount of sustainable/technical feedstock potential in Mtonne/year, sorted from highest to lowest amount.
BavariaVeneto
Cattle manure35.087.58
Energy crop 17.651.04
Straw7.090.42
Swine manure4.730.92
Corn Stover0.710.49
Sugar Beet0.560.97
Rape0.380.02
Forage0.170.05
Sheep manure0.140.02
Soybean straw0.020.79
Pomace0.020.31
Poultry manure0.010.20
Leguminous residue0.010.00
Vine shoots0.010.12
Sunflower straw0.010.03
Goat manure0.010.01
Rice straw0.000.02
Oil crop residue0.001.12 × 10−5
Industrial crop residue 0.002.26 × 10−3
Table A8. ReCiPE 2016 (H) midpoint results for the regional assessment.
Scenario Name
IndicatorBAV_ADBAV_AD + BoosterBAV_AD + PHBVEN_ADVEN_AD + BoosterVEN_AD + PHBUnit
Fine particulate matter formation3.27 × 1062.69× 1064.04 × 106−3.89 × 10⁵−5.44 × 10⁵−7.52 × 10⁴kg PM2.5 eq
Fossil resource scarcity−2.06 × 10⁹−2.35 × 10⁹−1.70 × 10⁹−3.03 × 10⁸−3.49 × 10⁸−2.61 × 10⁸kg oil eq
Freshwater ecotoxicity−2.54 × 10⁸−3.01 × 10⁸−1.13 × 10⁸−3.52 × 10⁶−5.72 × 10⁶−2.19 × 10⁶kg 1,4-DCB
Freshwater eutrophication−1.12 × 10⁷−1.27 × 10⁷−5.39 × 10⁶−1.18 × 10⁵−1.52 × 10⁵−3.86 × 10⁴kg P eq
Global warming−4.74 × 10⁹−5.49 × 10⁹−2.32 × 10⁹−6.40 × 10⁸−7.12 × 10⁸−4.42 × 10⁸kg CO2 eq
Human carcinogenic toxicity−5.77 × 10⁸−6.54 × 10⁸−3.13 × 10⁸−1.48 × 10⁷−1.75 × 10⁷−1.07 × 10⁷kg 1,4-DCB
Human non-carcinogenic toxicity−5.59 × 10⁸−1.75 × 1093.52 × 1094.02 × 1083.56 × 1084.72 × 108kg 1,4-DCB
Ionizing radiation−1.35 × 10⁹−1.53 × 10⁹−7.14 × 1085.87 × 1064.93 × 1063.38 × 106kBq Co-60 eq
Land use1.21 × 1071.14 × 1071.31 × 1071.95 × 1061.93 × 1061.76 × 106m2a crop eq
Marine ecotoxicity−3.62 × 10⁸−4.25 × 10⁸−1.67 × 10⁸−6.66 × 10⁶−9.65 × 10⁶−4.56 × 10⁶kg 1,4-DCB
Marine eutrophication1.02 × 1071.01 × 1071.06 × 1071.42 × 1061.41 × 1061.43 × 106kg N eq
Mineral resource scarcity−6.88 × 10⁵−8.63 × 10⁵−3.58 × 1053.79 × 1043.26 × 1041.68 × 103kg Cu eq
Ozone formation, Human health−4.79 × 10⁵−1.75 × 1061.65 × 106−9.61 × 10⁵−1.23 × 10⁶−4.54 × 10⁵kg NOx eq
Ozone formation, Terrestrial ecosystems−3.38 × 10⁵−1.62 × 1061.68 × 106−9.67 × 10⁵−1.24 × 10⁶−4.72 × 10⁵kg NOx eq
Stratospheric ozone depletion4.86 × 1044.79 × 1045.07 × 1045.93 × 1035.83 × 1036.21 × 103kg CFC11 eq
Terrestrial acidification3.26 × 1073.09 × 1073.57 × 1077.66 × 1053.04 × 1051.82 × 106kg SO2 eq
Terrestrial ecotoxicity2.73 × 1092.25 × 1091.91 × 109−7.79 × 10⁷−1.81 × 10⁸−1.27 × 10⁸kg 1,4-DCB
Water consumption−2.27 × 10¹⁰−2.59 × 10¹⁰−1.26 × 10¹⁰−6.75 × 10⁹−7.73 × 10⁹−3.72 × 10⁹m3
Table A9. ReCiPE 2016 (H) midpoint results for the scale assessment.
Scenario Name
IndicatorS_ADS_AD + BoosterS_AD + PHBI_ADI_AD + BoosterI_AD + PHBUnit
Fine particulate matter formation0.080.070.090.000.000.03kg PM2.5 eq
Fossil resource scarcity−33.44−37.61−26.22−16.66−18.58−13.79kg oil eq
Freshwater ecotoxicity−3.26−3.83−0.78−0.11−0.20−0.02kg 1,4-DCB
Freshwater eutrophication−0.17−0.19−0.070.000.000.00kg P eq
Global warming−59.78−70.58−15.43−37.69−40.51−25.06kg CO2 eq
Human carcinogenic toxicity−8.73−9.67−4.11−0.80−0.92−0.52kg 1,4-DCB
Human non-carcinogenic toxicity−3.81−18.3367.5952.5350.6357.37kg 1,4-DCB
Ionizing radiation−20.37−22.38−9.31−0.10−0.14−0.28kBq Co-60 eq
Land use0.370.370.390.100.100.08m2a crop eq
Marine ecotoxicity−4.74−5.52−1.33−0.24−0.37−0.10kg 1,4-DCB
Marine eutrophication0.370.370.380.070.070.07kg N eq
Mineral resource scarcity−0.01−0.010.000.000.000.00kg Cu eq
Ozone formation, Human health0.040.020.08−0.04−0.05−0.01kg NOx eq
Ozone formation, Terrestrial ecosystems0.050.030.08−0.04−0.05−0.01kg NOx eq
Stratospheric ozone depletion0.000.000.000.000.000.00kg CFC11 eq
Terrestrial acidification0.610.590.670.240.220.31kg SO2 eq
Terrestrial ecotoxicity106.4099.8393.32−5.38−9.70−9.08kg 1,4-DCB
Water consumption−331.10−368.38−155.31−386.92−428.04−176.73m3
Table A10. ReCiPE 2016 (H) endpoint results for the regional assessment.
Scenario Name
IndicatorBAV_ADBAV_AD + BoosterBAV_AD + PHBVEN_ADVEN_AD + BoosterVEN_AD + PHBUnit
Fine particulate matter formation2.06 × 1031.70 × 1032.54 × 103−2.44 × 10²−3.41 × 10²−4.67 × 101DALY
Fossil resource scarcity−1.69 × 10⁸−2.06 × 10⁸−3.28 × 10⁸−8.80 × 10⁷−1.02 × 10⁸−8.53 × 10⁷USD2013
Freshwater ecotoxicity−1.76 × 10⁻¹−2.09 × 10⁻¹−7.80 × 10⁻²−2.43 × 10⁻³−3.96 × 10⁻³−1.52 × 10⁻³species.yr
Freshwater eutrophication−7.49 × 10¹⁰−8.53 × 10¹⁰−3.61 × 10¹⁰−7.90 × 10⁻²−1.02 × 10⁻¹−2.57 × 10⁻²species.yr
Global warming, Freshwater ecosystems−3.63 × 10⁻⁴−4.20 × 10⁻⁴−1.77 × 10⁻⁴−4.90 × 10⁻⁵−5.44 × 10⁻⁵−3.38 × 10⁻⁵species.yr
Global warming, Human health−4.39 × 10³−5.09 × 10³−2.15 × 10³−5.94 × 10²−6.60 × 10²−4.10 × 10²DALY
Global warming, Terrestrial ecosystems−1.33 × 101−1.54 × 101−6.49 × 10¹⁰−1.79 × 10¹⁰−1.99 × 10¹⁰−1.24 × 10¹⁰species.yr
Human carcinogenic toxicity−1.92 × 10³−2.17 × 10³−1.04 × 10³−4.90 × 101−5.82 × 101−3.54 × 101DALY
Human non-carcinogenic toxicity−1.28 × 10²−4.00 × 1028.03 × 1029.16 × 1018.13 × 1011.08 × 102DALY
Ionizing radiation−1.15 × 101−1.29 × 101−6.05 × 10104.98 × 10−24.18 × 10−22.87 × 10−2DALY
Land use1.08 × 10−11.01 × 10−11.16 × 10−11.73 × 10−21.71 × 10−21.56 × 10⁻²species.yr
Marine ecotoxicity−3.80 × 10⁻²−4.47 × 10⁻²−1.76 × 10⁻²−7.00 × 10⁻⁴−1.01 × 10⁻³−4.79 × 10⁻⁴species.yr
Marine eutrophication1.73 × 10−21.71 × 10−21.80 × 10−22.41 × 10−32.40 × 10−32.42 × 10⁻³species.yr
Mineral resource scarcity−1.59 × 10⁵−2.00 × 10⁵−8.29 × 1048.78 × 1037.54 × 1033.88 × 102USD2013
Ozone formation, Human health−4.36 × 10⁻¹−1.59 × 10101.51 × 1010−8.74 × 10⁻¹−1.12 × 10¹⁰−4.13 × 10⁻¹DALY
Ozone formation, Terrestrial ecosystems−4.36 × 10⁻²−2.09 × 10−12.16 × 10−1−1.25 × 10⁻¹−1.60 × 10⁻¹−6.09 × 10⁻²species.yr
Stratospheric ozone depletion2.58 × 1012.54 × 1012.69 × 1013.15 × 10103.10 × 10103.29 × 1010DALY
Terrestrial acidification6.92 × 10106.55 × 10107.57 × 10101.63 × 10−16.53 × 10−23.86 × 10−1species.yr
Terrestrial ecotoxicity3.12 × 10−22.57 × 10−22.18 × 10−2−8.80 × 10⁻⁴−2.06 × 10⁻³−1.45 × 10⁻³species.yr
Water consumption, Aquatic ecosystems−1.37 × 10⁻²−1.56 × 10⁻²−7.61 × 10⁻³−4.08 × 10⁻³−4.67 × 10⁻³−2.25 × 10⁻³species.yr
Water consumption, Human health−5.05 × 10⁴−5.75 × 10⁴−2.80 × 10⁴−1.50 × 10⁴−1.72 × 10⁴−8.26 × 10³DALY
Water consumption, Terrestrial ecosystem−3.07 × 10²−3.50 × 10²−1.70 × 10²−9.11 × 101−1.04 × 10²−5.02 × 101species.yr
Table A11. ReCiPE 2016 (H) Endpoint results for the scale assessment.
Scenario Name
IndicatorS_ADS_AD + BoosterS_AD + PHBI_ADI_AD + BoosterI_AD + PHBUnit
Fine particulate matter formation4.73 × 10−54.24 × 10−55.66 × 10−52.24 × 10⁻⁶−1.85 × 10−61.58 × 10−5DALY
Fossil resource scarcity−2.77 × 10¹⁰−3.38 × 10¹⁰−5.28 × 10¹⁰−4.82 × 10¹⁰−5.39 × 10¹⁰−4.66 × 10¹⁰USD2013
Freshwater ecotoxicity−2.26 × 10⁻⁹−2.65 × 10⁻⁹−5.40× 10⁻¹⁰−7.75× 10⁻¹¹−1.41× 10⁻¹⁰−1.68× 10⁻¹¹species.yr
Freshwater eutrophication−1.12 × 10⁻⁷−1.25 × 10⁻⁷−4.47 × 10⁻⁸−2.19 × 10⁻⁹−3.14 × 10−91.49 × 10−9species.yr
Global warming, Freshwater ecosystems−4.57× 10⁻¹²−5.40× 10⁻¹²−1.18× 10⁻¹²−2.88× 10⁻¹²−3.10× 10⁻¹²−1.92× 10⁻¹²species.yr
Global warming, Human health−5.54 × 10⁻⁵−6.54 × 10⁻⁵−1.42 × 10⁻⁵−3.50 × 10⁻⁵−3.76 × 10⁻⁵−2.33 × 10⁻⁵DALY
Global warming, Terrestrial ecosystems−1.67 × 10⁻⁷−1.98 × 10⁻⁷−4.33 × 10⁻⁸−1.06 × 10⁻⁷−1.13 × 10⁻⁷−7.02 × 10⁻⁸species.yr
Human carcinogenic toxicity−2.90 × 10⁻⁵−3.21 × 10⁻⁵−1.36 × 10⁻⁵−2.66 × 10⁻⁶−3.04 × 10⁻⁶−1.73 × 10⁻⁶DALY
Human non-carcinogenic toxicity−8.74 × 10⁻⁷−4.18 × 10−61.54 × 10−51.20 × 10−51.15 × 10−51.31 × 10⁻⁵DALY
Ionizing radiation−1.73 × 10⁻⁷−1.90 × 10⁻⁷−7.90 × 10⁻⁸−8.60× 10⁻¹⁰−1.19 × 10⁻⁹−2.36 × 10⁻⁹DALY
Land use3.31 × 10−93.25 × 10−93.45 × 10−98.55× 10−108.46× 10−107.35× 10⁻¹⁰species.yr
Marine ecotoxicity−4.98 × 10⁻¹⁰−5.80× 10⁻¹⁰−1.40× 10⁻¹⁰−2.55× 10⁻¹¹−3.87× 10⁻¹¹−1.07× 10⁻¹¹species.yr
Marine eutrophication6.31× 10−106.28× 10−106.42× 10−101.18× 10−101.18× 10−101.19× 10⁻¹⁰species.yr
Mineral resource scarcity−1.48 × 10⁻³−1.97 × 10⁻³−1.67 × 10−45.79 × 10−45.27 × 10⁻⁴−1.23 × 10⁻⁵USD2013
Ozone formation, Human health3.77 × 10−82.17 × 10−87.49 × 10−8−3.71 × 10⁻⁸−4.72 × 10⁻⁸−5.28 × 10⁻⁹DALY
Ozone formation, Terrestrial ecosystems5.87 × 10−93.57 × 10−91.09 × 10−8−5.31 × 10⁻⁹−6.77 × 10⁻⁹−9.10 × 10⁻¹⁰species.yr
Stratospheric ozone depletion6.61 × 10−76.57 × 10−76.82 × 10−71.84 × 10−71.81 × 10−71.94 × 10⁻⁷DALY
Terrestrial acidification1.29 × 10−71.24 × 10−71.42 × 10−75.03 × 10−84.62 × 10−86.57 × 10⁻⁸species.yr
Terrestrial ecotoxicity1.21 × 10−91.14 × 10−91.07 × 10−9−6.10× 10⁻¹¹−1.10 × 10⁻¹⁰−1.04 × 10⁻¹⁰species.yr
Water consumption, Aquatic ecosystems−2.00 × 10⁻¹⁰−2.23 × 10⁻¹⁰−9.38 × 10⁻¹¹−2.34× 10⁻¹⁰−2.59 × 10⁻¹⁰−1.07 × 10⁻¹⁰species.yr
Water consumption, Human health−7.35 × 10⁻⁴−8.18 × 10⁻⁴−3.45 × 10⁻⁴−8.59 × 10⁻⁴−9.50 × 10⁻⁴−3.92 × 10⁻⁴DALY
Water consumption, Terrestrial ecosystem−4.47 × 10⁻⁶−4.97 × 10⁻⁶−2.10 × 10⁻⁶−5.22 × 10⁻⁶−5.78 × 10⁻⁶−2.39 × 10⁻⁶species.yr

References

  1. The European Parliament. Report on a Roadmap for Moving to a Competitive Low Carbon Economy in 2050; The European Parliament: Brussels, Belgium, 2014; Volume 2011/2096. [Google Scholar]
  2. Cherubini, F.; Bird, N.D.; Cowie, A.; Jungmeier, G.; Schlamadinger, B.; Woess-Gallasch, S. Energy- and greenhouse gas-based LCA of biofuel and bioenergy systems: Key issues, ranges and recommendations. Resour. Conserv. Recycl. 2009, 53, 434–447. [Google Scholar] [CrossRef]
  3. Amponsah, N.Y.; Troldborg, M.; Kington, B.; Aalders, I.; Hough, R.L. Greenhouse gas emissions from renewable energy sources: A review of lifecycle considerations. Renew. Sustain. Energy Rev. 2014, 39, 461–475. [Google Scholar] [CrossRef]
  4. Gnansounou, E.; Dauriat, A.; Villegas, J.; Panichelli, L. Life cycle assessment of biofuels: Energy and greenhouse gas balances. Bioresour. Technol. 2009, 100, 4919–4930. [Google Scholar] [CrossRef] [PubMed]
  5. Hijazi, O.; Munro, S.; Zerhusen, B.; Effenberger, M. Review of life cycle assessment for biogas production in Europe. Renew. Sustain. Energy Rev. 2016, 54, 1291–1300. [Google Scholar] [CrossRef]
  6. von Blottnitz, H.; Curran, M.A. A review of assessments conducted on bio-ethanol as a transportation fuel from a net energy, greenhouse gas, and environmental life cycle perspective. J. Clean. Prod. 2007, 15, 607–619. [Google Scholar] [CrossRef]
  7. Scarlat, N.; Dallemand, J.F.; Fahl, F. Biogas: Developments and perspectives in Europe. Renew. Energy 2018, 129, 457–472. [Google Scholar] [CrossRef]
  8. Finkbeiner, M.; Inaba, A.; Tan, R.; Christiansen, K.; Kluppel, H. The new international standards for life cycle assessment: ISO 14040 and ISO 14044. Int. J. life cycle Assess. 2006, 11, 80–85. [Google Scholar] [CrossRef]
  9. UNEP; Beaton, C.; Perera, O.; Arden-Clarke, C.; Farah, A. Global Outlook on Sustainable Consumption and Production Policies Taking Action Together; UNEP: Paris, France, 2012. [Google Scholar]
  10. Sonnemann, G.; Gemechu, E.D.; Sala, S.; Schau, E.M.; Allacker, K.; Pant, R.; Adibi, N.; Valdivia, S. Life Cycle Thinking and the Use of LCA in Policies Around the World. In Life Cycle Assessment: Theory and Practice; Hauschild, M.Z., Rosenbaum, R.K., Olsen, S.I., Eds.; Springer International Publishing: Cham, Switzerland, 2018; pp. 429–463. ISBN 978-3-319-56475-3. [Google Scholar]
  11. Scarlat, N.; Dallemand, J.F.; Monforti-Ferrario, F.; Banja, M.; Motola, V. Renewable energy policy framework and bioenergy contribution in the European Union - An overview from National Renewable Energy Action Plans and Progress Reports. Renew. Sustain. Energy Rev. 2015, 51, 969–985. [Google Scholar] [CrossRef]
  12. Lee, W.S.; Chua, A.S.M.; Yeoh, H.K.; Ngoh, G.C. A review of the production and applications of waste-derived volatile fatty acids. Chem. Eng. J. 2014, 235, 83–99. [Google Scholar] [CrossRef]
  13. Biswas, R.; Uellendahl, H.; Ahring, B.K. Wet Explosion: A Universal and Efficient Pretreatment Process for Lignocellulosic Biorefineries. Bioenergy Res. 2015, 8, 1101–1116. [Google Scholar] [CrossRef]
  14. Toledo-Alarcón, J.; Capson-Tojo, G.; Marone, A.; Paillet, F.; Ferraz Júnior, A.D.N.; Chatellard, L.; Bernet, N.; Trably, E. Basics of bio-hydrogen production by dark fermentation. In Green Energy and Technology; Springer Verlag: Berlin/Heidelberg, Germany, 2018; pp. 199–220. [Google Scholar]
  15. Majone, M.; Chronopoulou, L.; Lorini, L.; Martinelli, A.; Palocci, C.; Rossetti, S.; Valentino, F.; Villano, M. PHA copolymers from microbial mixed cultures: Synthesis, extraction and related properties. Curr. Adv. Biopolym. Process. Charact. 2017, 223–276. [Google Scholar]
  16. Hamelin, L.; Borzęcka, M.; Kozak, M.; Pudełko, R. A spatial approach to bioeconomy: Quantifying the residual biomass potential in the EU-27. Renew. Sustain. Energy Rev. 2019, 100, 127–142. [Google Scholar] [CrossRef]
  17. Einarsson, R.; Persson, U.M. Supporting Information: The potential for biogas production from crop residues and manure in the EU, accounting for key technical and economic constraints. PLoS ONE 2017, 12, e0171001. [Google Scholar] [CrossRef] [PubMed] [Green Version]
  18. Scarlat, N.; Dallemand, J.-F.; Monforti-Ferrario, F.; Nita, V. The role of biomass and bioenergy in a future bioeconomy: Policies and facts. Environ. Dev. 2015, 15, 3–34. [Google Scholar] [CrossRef]
  19. Scarlat, N.; Martinov, M.; Dallemand, J.F. Assessment of the availability of agricultural crop residues in the European Union: Potential and limitations for bioenergy use. Waste Manag. 2010, 30, 1889–1897. [Google Scholar] [CrossRef] [PubMed]
  20. Monforti, F.; Lugato, E.; Motola, V.; Bodis, K.; Scarlat, N.; Dallemand, J.F. Optimal energy use of agricultural crop residues preserving soil organic carbon stocks in Europe. Renew. Sustain. Energy Rev. 2015, 44, 519–529. [Google Scholar] [CrossRef]
  21. Thorenz, A.; Wietschel, L.; Stindt, D.; Tuma, A. Assessment of agroforestry residue potentials for the bioeconomy in the European Union. J. Clean. Prod. 2018, 176, 348–359. [Google Scholar] [CrossRef]
  22. Appel, F.; Ostermeyer-Wiethaup, A.; Balmann, A. Effects of the German Renewable Energy Act on structural change in agriculture – The case of biogas. Util. Policy 2016, 41, 172–182. [Google Scholar] [CrossRef]
  23. Bartoli, A.; Cavicchioli, D.; Kremmydas, D.; Rozakis, S.; Olper, A. The impact of different energy policy options on feedstock price and land demand for maize silage: The case of biogas in Lombardy. Energy Policy 2016, 96, 351–363. [Google Scholar] [CrossRef]
  24. Ögmundarson, Ó.; Herrgård, M.J.; Forster, J.; Hauschild, M.Z.; Fantke, P. Addressing environmental sustainability of biochemicals. Nat. Sustain. 2020, 3, 167–174. [Google Scholar] [CrossRef]
  25. Bojesen, M.; Birkin, M.; Clarke, G. Spatial competition for biogas production using insights from retail location models. Energy 2014, 68, 617–628. [Google Scholar] [CrossRef]
  26. Croxatto Vega, G.C.; Sohn, J.; Bruun, S.; Olsen, S.I.; Birkved, M.; Croxatto Vega, G.; Sohn, J.; Bruun, S.; Olsen, S.I.; Birkved, M. Maximizing Environmental Impact Savings Potential Through Innovative Biorefinery Alternatives: An Application of the TM-LCA Framework for Regional Scale Impact Assessment. Sustainability 2019, 11, 3836. [Google Scholar] [CrossRef] [Green Version]
  27. Sohn, J.; Vega, G.C.; Birkved, M. A Methodology Concept for Territorial Metabolism – Life Cycle Assessment: Challenges and Opportunities in Scaling from Urban to Territorial Assessment. Procedia CIRP 2018, 69, 89–93. [Google Scholar] [CrossRef]
  28. Federal Ministry FACP Bioenergy in Germany: Facts and Figures—Solid Fuels, Biofuels & Biogas. 2019. Available online: http://www.fnr.de/fileadmin/allgemein/pdf/broschueren/broschuere_basisdaten_bioenergie_2018_engl_web_neu.pdf (accessed on 30 April 2020).
  29. Serrano, R.P. Biogas Process Simulation using Aspen Plus. Master’s Thesis, Syddansk Universitet, Odense, Denmark, 2011. [Google Scholar]
  30. BioVantage.dk Aps; Ribe Biogas A/S/; AAU.; Sweco. Final Report over the EUDP Project: “Demonstration of the AD-Booster System for Enhanced Biogas Production”. 2017. Available online: https://energiforskning.dk/sites/energiteknologi.dk/files/slutrapporter/ad-booster_final_report_eudp.pdf (accessed on 30 April 2020).
  31. Eurostat Crop Production in National Humidity by NUTS 2 Regions. Available online: https://ec.europa.eu/eurostat/data/database?node_code=apro_cpnhr (accessed on 1 November 2019).
  32. Stat Agricoltura. Available online: http://dati.istat.it/ (accessed on 1 November 2019).
  33. Eurostat Wine Grower Holding by Production. Available online: https://ec.europa.eu/eurostat/data/database?node_code=vit_t1 (accessed on 1 November 2019).
  34. Eurostat Area under wine-grape vine varieties by type of production, yield class and regions (vit_an5). Available online: https://ec.europa.eu/eurostat/data/database?node_code=vit_an5 (accessed on 1 November 2019).
  35. Dwyer, K.; Hosseinian, F.; Rod, M. The Market Potential of Grape Waste Alternatives. J. Food Res. 2014, 3, 91. [Google Scholar] [CrossRef]
  36. Camia, A.; Robert, N.; Jonsson, R.; Pilli, R.; García-Condado, S.; López-Lozano, R.; van der Velde, M.; Ronzon, T.; Gurría, P.; M’Barek, R.; et al. Biomass Production, Supply, Uses and Flows in the European Union. First Results from an Integrated Assessment; Publications Office of the European Union: Luxembourg, 2018. [Google Scholar]
  37. Einarsson, R.; Persson, U.M. Analyzing key constraints to biogas production from crop residues and manure in the EU—A spatially explicit model. PLoS ONE 2017, 12, e0171001. [Google Scholar] [CrossRef] [Green Version]
  38. Ruis, S.J.; Blanco-Canqui, H. Cover crops could offset crop residue removal effects on soil carbon and other properties: A review. Agron. J. 2017, 109, 1785–1805. [Google Scholar] [CrossRef]
  39. Meyer, A.K.P.; Ehimen, E.A.; Holm-Nielsen, J.B. Future European biogas: Animal manure, straw and grass potentials for a sustainable European biogas production. Biomass Bioenergy 2018, 111, 154–164. [Google Scholar] [CrossRef]
  40. RENEW European Project. Renewable Fuels for Advanced Powertrains Integrated Project Sustainable Energy Systems; RENEW European Project: Warszawa, Poland, 2004. [Google Scholar]
  41. Jölli, D.; Giljum, S. Unused Biomass Extraction in Agriculture, Forestry and Fishery; Sustainable Europe Research Institute: Vienna, Austria, 2005. [Google Scholar]
  42. Spigno, G.; Marinoni, L.; Garrido, G.D. State of the Art in Grape Processing By-Products. In Handbook of Grape Processing By-Products; Galanakis, C.M., Ed.; Academic Press: London, UK, 2017; pp. 1–27. [Google Scholar]
  43. European Commission—Directorate General for Agriculture and Rural Development. Definition of Variables Used in FADN Standard Results; European Commission: Brussels, Belgium, 2014. [Google Scholar]
  44. Commission, E. Handbook on the Concepts and Definitions Used in Animal Production Statistics Item 5 on the Agenda; European Commission: Brussels, Belgium, 2012. [Google Scholar]
  45. EUR-Lex. European Comission (EC) No 889/2007. Official Journal of the European Union. 2008. Available online: http://data.europa.eu/eli/reg/2008/889/oj (accessed on 30 April 2020).
  46. EUR-Lex. European Comission (EC) No 834/2007. Official Journal of the European Union. 2007. Available online: http://data.europa.eu/eli/reg/2007/834/oj (accessed on 30 April 2020).
  47. Eurostat Archive: Agri-environmental indicator—Animal Housing. Available online: https://ec.europa.eu/eurostat/statistics-explained/images/9/95/Fact_sheet_11.3_SE.xls (accessed on 1 November 2019).
  48. Eurostat Organic Farming Statistics. Available online: https://ec.europa.eu/eurostat/statistics-explained/index.php/Organic_farming_statistics#Organic_production (accessed on 1 November 2019).
  49. Banzato, D. 10 anni di biogas in Veneto. Available online: http://levicases.unipd.it/wp-content/uploads/2018/06/banzato.pdf (accessed on 1 November 2019).
  50. Bayerische Landesaanstalt für Landwirtschaft (LfL) Biogas in Zahlen – Statistik zur bayerischen Biogasproduktion. Available online: https://www.lfl.bayern.de/iba/energie/031607/ (accessed on 1 November 2019).
  51. Fabbri, C.; Soldano, M.; Piccinini, S. Il Biogas Accelera la Corsa Verso gli Obiettivi 2020; L’Informatore Agrario: Verona, Italy, 2011. [Google Scholar]
  52. Benato, A.; Macor, A. Italian biogas plants: Trend, subsidies, cost, biogas composition and engine emissions. Energies 2019, 12, 979. [Google Scholar] [CrossRef] [Green Version]
  53. Bahrs, E.; Angenendt, E. Status quo and perspectives of biogas production for energy and material utilization. GCB Bioenergy 2019, 11, 9–20. [Google Scholar] [CrossRef]
  54. Zema, D.A. Planning the optimal site, size, and feed of biogas plants in agricultural districts. Biofuels Bioprod. Biorefining 2017, 11, 454–471. [Google Scholar] [CrossRef]
  55. Sinnott, R.K.; Towler, G. Chemical Engineering Design, 5th ed.; Butterworth-Heinemamn: Oxford, UK, 2009; ISBN 9780750685511. [Google Scholar]
  56. Peters, M.S.; Timmerhaus, K.D.; West, R.E. Plant Design and Economics for Chemical Engineers, 5th ed.; McGraw-Hill: New York, NY, USA, 2003; ISBN 0072392665. [Google Scholar]
  57. Blanken, K.; De Buisonje, F.; Evers, A.; Ouweltjes, W.; Verkaik, J.; Vermeij, I.; Wemmenhove, H. Kwantitatieve Informatie Veehouderij 2017–2018; Wageningen Livestock Research: Wageningen, The Netherlands, 2017. [Google Scholar]
  58. Wageningen University & Research Agro and Food Portal (Agrimatie). Available online: https://www.agrimatie.nl/agrimatieprijzen/default.aspx?Lang=1 (accessed on 1 November 2019).
  59. European Commission. Quarterly Report on European Electricity Markets with Focus on Corporate Power Purchase Agreements and Residential Photovoltaics—1st Quarter; European Commission: Brussels, Belgium, 2019. [Google Scholar]
  60. European Commission. Quarterly Report on European Electricity Markets with Focus on Corporate Power Purchase Agreements and Residential Photovoltaics—4th Quarter; European Commission: Brussels, Belgium, 2018. [Google Scholar]
  61. European Commission. Quarterly Report on European Electricity Markets with Focus on Corporate Power Purchase Agreements and Residential Photovoltaics—3rd quarter; European Commission: Brussels, Belgium, 2019. [Google Scholar]
  62. Bengsston, S.; Werker, A.; Visser, C.; Korving, L. PHARIO: Stepping Stone to a Sustainable Vaue Chain for PHA Bioplastic Using Municipal Activated Sludge; STOWA Report 2017-15; STOWA: Amersfoort, The Netherlands, 2017. [Google Scholar]
  63. European Commission—Joint Research Centre. International Reference Life Cycle Data System (ILCD) Handbook: General guide for Life Cycle Assessment—Detailed guidance; Publications Office of the European Union: Luxembourg, 2010. [Google Scholar]
  64. Edwards, W. Corn Stover Harvest; Iowa State University Extension & Outreach: Ames, IA, USA, 2014. [Google Scholar]
  65. Grinsted, H.; Haldrup, A.; Martin Hjorth, K. By-products from Ethanol Production—The Forgotten Part of the Equation. IFRO Report, No. 219; University of Copenhagen: Copenhagen, Denmark, 2013. [Google Scholar]
  66. Agri G 4, Committee for the Organisation of Agricultural Markets. Sugar price reporting 2019. Available online: https://ec.europa.eu/info/food-farming-fisheries/farming/facts-and-figures/markets/overviews/market-observatories/sugar_en (accessed on 30 April 2020).
  67. USDA. Oilseeds: World Market and Trade; USDA: Washington DC, USA, 2019.
  68. GreenDelta OpenLCA 1.8.0. Available online: www.greendelta.com (accessed on 30 April 2020).
  69. Wernet, G.; Bauer, C.; Steubing, B.; Reinhard, J.; Moreno-ruiz, E.; Weidema, B. The ecoinvent database version 3 ( part I ): Overview and methodology. Int. J. Life Cycle Assess. 2016, 3, 1218–1230. [Google Scholar] [CrossRef]
  70. Huijbregts, M.A.J.; Steinmann, Z.J.N.; Elshout, P.M.F.; Stam, G.; Verones, F.; Vieira, M.; Zijp, M.; Hollander, A.; van Zelm, R. ReCiPe2016: A harmonised life cycle impact assessment method at midpoint and endpoint level. Int. J. Life Cycle Assess. 2017, 22, 138–147. [Google Scholar] [CrossRef]
  71. Sohn, J.; Kalbar, P.; Goldstein, B.; Birkved, M. Defining Temporally Dynamic Life Cycle Assessment: A Literature Review. Integr. Environ. Assess. Manag. 2019. In press. [Google Scholar] [CrossRef] [PubMed]
  72. Laurent, A.; Olsen, S.I.; Hauschild, M.Z. Limitations of carbon footprint as indicator of environmental sustainability. Environ. Sci. Technol. 2012, 46, 4100–4108. [Google Scholar] [CrossRef] [PubMed]
  73. Ögmundarson, Ó.; Fantke, P.; Herrgard, M. Life Cycle Assessment of chosen Biochemicals and Bio-based Polymers. PhD Thesis, Technical University of Denmark, Lyngby, Denmark, 31 December 2018. [Google Scholar]
  74. Hwang, C.-L.; Yoon, K. Multiple Attribute Decision Making: Methods and Applications A State-of-the-Art Survey; Springer-Verlag: Berlin/Heidelberg, Germany, 1981; ISBN 978-3-540-10558-9. [Google Scholar]
  75. Sohn, J.; Bisquert, P.; Buche, P.; Hecham, A.; Kalbar, P.P.; Goldstein, B.; Birkved, M.; Olsen, S.I. Argumentation Corrected Context Weighting-LCA: A Practical Method of Including Stakeholder Perspectives in Multi-Criteria Decision Support for Life Cycle Assessment. Sustainability 2020, 12, 2170. [Google Scholar] [CrossRef] [Green Version]
  76. Huijbregts, M.A.J.; Steinmann, Z.J.N.; Elshout, P.M.F.M.; Stam, G.; Verones, F.; Vieira, M.D.M.; Zijp, M.; van Zelm, R. ReCiPe 2016: A harmonized life cycle impact assessment method at midpoint and enpoint level—Report 1: Characterization. National Institute for Public Health and the Environment, 2016; p. 194. Available online: https://rivm.openrepository.com/handle/10029/620793 (accessed on 30 April 2020).
  77. Ögmundarson, Ó.; Sukumara, S.; Herrgård, M.J.; Fantke, P. Combining environmental and economic performance for bioprocess optimization. Trends Biotechnol. 2020. In press. [Google Scholar]
  78. Weidema, B.P. Using the budget constraint to monetarise impact assessment results. Ecol. Econ. 2009, 68, 1591–1598. [Google Scholar] [CrossRef]
  79. Pizzol, M.; Weidema, B.; Brandão, M.; Osset, P. Monetary valuation in Life Cycle Assessment: A review. J. Clean. Prod. 2015, 86, 170–179. [Google Scholar] [CrossRef]
  80. Dong, Y.; Hauschild, M.; Sørup, H.; Rousselet, R.; Fantke, P. Evaluating the monetary values of greenhouse gases emissions in life cycle impact assessment. J. Clean. Prod. 2019, 209, 538–549. [Google Scholar] [CrossRef]
  81. PRé, various authors. SimaPro Database Manual Methods Library; PRé Consultants: Amersfoort, The Netherlands, 2019; Volume 75, Available online: https://simapro.com/wp-content/uploads/2019/02/DatabaseManualMethods.pdf (accessed on 30 April 2020).
  82. Thrän, D.; Schaubach, K.; Majer, S.; Horschig, T. Governance of sustainability in the German biogas sector —Adaptive management of the Renewable Energy Act between agriculture and the energy sector. Energy. Sustain. Soc. 2020, 10, 1–18. [Google Scholar] [CrossRef]
  83. Dale, B.E.; Sibilla, F.; Fabbri, C.; Pezzaglia, M.; Pecorino, B.; Veggia, E.; Baronchelli, A.; Gattoni, P.; Bozzetto, S. BiogasdonerightTM: An innovative new system is commercialized in Italy. Biofuels Bioprod. Biorefining 2016, 10, 341–345. [Google Scholar] [CrossRef]
  84. Pehnt, M. Dynamic life cycle assessment (LCA) of renewable energy technologies. Renew. Energy 2006, 31, 55–71. [Google Scholar] [CrossRef]
  85. Helwig, T.; Samson, R.; Demaio, A.; Caumartin, D. Agricultural Biomass Residue Inventories and Conversion Systems for Energy Production in Eastern Canada; Resource Efficient Agricultural Production: Quebec City, QC, Canada, 2002. [Google Scholar]
  86. Petersen, S.O.; Olsen, A.B.; Elsgaard, L.; Triolo, J.M.; Sommer, S.G. Estimation of Methane Emissions from Slurry Pits below Pig and Cattle Confinements. PLoS ONE 2016, 11, e0160968. [Google Scholar] [CrossRef] [PubMed] [Green Version]
  87. European Bioplastics European Bioplastics. Available online: https://www.european-bioplastics.org/news/publications/ (accessed on 20 December 2019).
Figure 1. Simplified flow chart of anaerobic digestion.
Sustainability 12 03676 g001
Figure 2. Simplified flow chart of the anaerobic digestion (AD) + Booster technology.
Sustainability 12 03676 g002
Figure 3. Simplified flow chart of the AD + polyhydroxybutyrate (PHB) technology.
Sustainability 12 03676 g003
Figure 4. Share of total mix of agricultural residues on a % wt basis for Veneto and Bavaria.
Sustainability 12 03676 g004
Figure 5. Energetic potential from agricultural residues for Bavaria (left) and Veneto (right) as % energy basis.
Sustainability 12 03676 g005
Figure 6. ReCiPE (H) Midpoint results for the region of Veneto for the three technology options i.e., AD, AD + Booster, and AD + PHB. Results are normalized per impact category to the worst or best performing scenario. Negative values show impact savings while positive values show burdens.
Sustainability 12 03676 g006
Figure 7. Global warming potential (GWP) contribution per ton of feedstock mix for the two regions, BAV for Bavaria and VEN for Veneto, for the three technology options, i.e., AD, AD + Booster, and AD + PHB.
Sustainability 12 03676 g007
Figure 8. Global warming potential if all of the regional feedstock is treated on an annual basis for (A) Veneto and (B) Bavaria, as well as GWP contribution by the various system phases. Scenarios are named by the first three letters of the region (VEN or BAV) followed by each technology scenario (AD, AD + Booster, AD + PHB).
Sustainability 12 03676 g008
Figure 9. Global warming potential results for the small scale (200 kW) and industrial scale (1000 kW) cases, per ton of feedstock, as well as contribution to GW by each stage. Scenarios are named as S for small scale and I for industrial scale followed by each technology scenario (AD, AD + Booster, AD + PHB).
Sustainability 12 03676 g009
Figure 10. Effect of transport of feedstock on GWP savings. Scenarios are named by the first three letters of the region (VEN or BAV) followed by each technology scenario (AD, AD + Booster, AD + PHB).
Sustainability 12 03676 g010
Figure 11. Global warming result for a future with a theoretical green energy mix. Scenarios are named by the first three letters of the region (VEN or BAV) followed by each technology scenario (AD, AD + Booster, AD + PHB).
Sustainability 12 03676 g011
Figure 12. TOPSIS results for the regions (top) and scales (bottom), with varying economic importance (10% to 90%), equal weights (EW), and internally normalized monetization ($) of endpoint damages. Scenarios are named by the first three letters of the region (VEN or BAV) or scale size S for small and I for industrial, followed by each technology scenario (AD, AD + Booster, AD + PHB).
Sustainability 12 03676 g012
Table 1. Feedstock mix employed in the farms.
200 kW1 MW
% ww 1ton/day% ww 1ton/day
Cow manure57%11.382%131.4
Maize Silage27%5.514%23.0
Grass silage14%2.73%5.4
Grain2%0.40%0.0
1 Percent on a wet weight basis.
Table 2. Sustainable removal factor of various crops.
Fraction of Total ResiduesReferences
Cereal straw0.3[40]
Rice straw0.5[19,21]
Maize0.5[19,21]
Leguminous0.1[36,41]
Sugar neet0.5[36,41]
Rape0.5[19,21]
Sunflower0.5[19,21]
Soya0.4[17]
Oily0.1[36,41]
Industrial 0.4[17]
Forage0.1[36,41]
Energy crop0.9[19,21]
Pomace0.99[42]
Table 3. Competing application factors for cereal straw.
Feed 1Bedding 1
Straw for bovine 20.10.8
Straw for swine 2 0.6
Straw for sheep 30.0250.2
Straw for goat 30.0250.2
Straw for poultry 40.01250.1
1 unit is ton per livestock unit*yr. 2 [40]. 3 Estimated value. Sheep and goat use a fourth of bovine. 4 Estimated value. Poultry uses a half of sheep and goat.
Table 4. Scale of installed biogas plants in Veneto and Bavaria.
Type of CapacityVenetoBavaria
20182019
(kWe)n%n.%
<1002312%90%
101–5004322%135256%
501–100011860%101042%
>100031%110%
Biogas in broiler00%00%
No data105%151%
Table 5. Feedstock costs in euro per dry weight.
FeedstockCosts
Chicken manure€5/ton DW
Cow manure€9/ton DW
Pig manure€18/ton DW
Grass silage€100/ton DW
Corn silage€120/ton DW
Wheat straw€40/ton DW
Corn stover€40/ton DW
Soybean straw€40/ton DW
Vine shoots€60/ton DW
Grape pomace€150/ton DW
Sugar beet pulp€150/ton DW
Grain€200/ton DW
Table 6. Product selling prices.
ProductSpecificationPriceReference
Electricity Germany€0.042/kWh[59,60,61]
Italy€0.058/kWh[59,60,61]
Thermal energyGermany€0.025/kWh[28]
PHBPurified PHB€3.6/kg[15,62]
Purification costs€1.8/kg[62]
Table 7. Economic allocation key for crop by-products.
%% ofReference
Corn stover47maize production[64,65]
Sugar beet pulp6sugar production[66]
Soybean straw12soybean production [67]
Table 8. Techno-economic assessment (TEA) results of different scenarios.
Plant Level
Small scale (200 kW)Industrial scale (1 MW)
ADAD + BoosterAD + PHBADAD + BoosterAD + PHB
CapEx M€1.41.41.44.04.04.0
ElectricityProducedkW20022413810001124662
Internal usekW1519307595150
OffsetkW1852051089251029512
Thermal energyProducedkW326365224163218341080
Internal usekW13114690653734432
OffsetkW196219135
Crude PHBOffsetton/y 58 287
CostsFinancingk€/y137137171400400500
Maintenance, etc.k€/y137137171400400500
Labor-relatedk€/y100100150500500750
Feedstockk€/y142142142440440440
Totalk€/y516516634174017402190
Break-even priceElectricity€/kWh0.290.260.290.210.190.21
Crude PHB€/kg 5.7 4.3
SubsidyElectricityk€/y40539323612741222705
Crude PHBk€/y 225 711
Totalk€/y405393460127412221416
Regional Level
Bavaria region (1 MW)Veneto region (1 MW)
ADAD + BoosterAD + PHBADAD + BoosterAD + PHB
CapEx M€4.04.05.04.04.05.0
ElectricityProducedkW1000114474210001155755
Internal usekW75951507595150
OffsetkW92510495929251060605
Thermal energyProducedkW163218661211163218851232
Internal usekW653746485653754493
OffsetkW481545308
Crude PHBOffsetton/y 255 227
CostsFinancingk€/y400400500400400500
Maintenance, etc.k€/y400400500400400500
Labor-relatedk€/y500500750500500750
Feedstockk€/y558558558509509509
Totalk€/y185818582308180918092259
Break-even priceElectricity€/kWh0.220.190.220.220.190.22
Crude PHB€/kg 4.4 4.7
SubsidyElectricityk€/y1415135690613431275879
Crude PHBk€/y 660 666
Totalk€/y141513561567134312751545