Article

Automated Locating Mining-Induced Microseismicity without Arrival Picking by Weighted STA/LTA Traces Stacking

1
School of Resources and Safety Engineering, Central South University, Changsha 410083, China
2
Digital Mine Research Center, Central South University, Changsha 410083, China
*
Author to whom correspondence should be addressed.
Sustainability 2020, 12(9), 3665; https://doi.org/10.3390/su12093665
Submission received: 26 March 2020 / Revised: 20 April 2020 / Accepted: 24 April 2020 / Published: 1 May 2020

Abstract

:
The automatic location of the microseismic source is still a challenging endeavor in the microseismic field. Due to the complexity of the mining environment, the microseismic records collected by different channels vary, and generally have a low signal-to-noise ratio (SNR). Therefore, the automatic location algorithm is required to be robust and accurate. For microseismic records with low SNR, the stack-based method does not need to pick arrival, thus avoiding the large location error caused by picking arrival. However, the traditional stack-based method does not consider the influence of the waveform quality of different stations, which can bring some errors to the location result. In this paper, in order to improve the location accuracy of the traditional stack-based method, we propose a method for weighted STA/LTA traces stacking. First, we established evaluation indicators of waveform quality based on microseismic records. Then, the STA/LTA traces are given weight to stack according to the evaluation indicators. Finally, the maximum value of the stacking function is solved in the four-dimensional space to obtain the source coordinates. In the process of calculation, we use the weighted differential evolution (WDE) optimal algorithm instead of the full grid search method, which greatly improves the calculation efficiency. The blasting experiment and engineering application show that the proposed method is stable and effective, and the location accuracy is higher than the traditional stack-based method and the arrival-based method.

1. Introduction

In recent decades, microseismic monitoring technology has been widely used to reduce casualties and ensure safety in mining engineering [1,2,3,4,5]. Due to artificial mining, microseismic records are subject to various kinds of noise pollution, such as mechanical noise [6]. The different spatial arrangement of the sensors results in the presence of high and low signal-to-noise ratios (SNRs), and even the waveforms in some channels are completely contaminated by noise. The microseismic records are the basis of the source location. How to accurately locate the microseismic source with such a complex SNR is a key problem [7].
Geiger proposed a location method in the early 20th century [8]. The Geiger method first needs to solve the partial derivative and inverse matrix of the arrival time function, and then derive the iterative formula. Finally, the iterative formula is used to solve the minimum value of the residual between theoretical and observed arrival time. Many scholars have conducted in-depth research on the iterative idea of the Geiger method. Lee et al. developed the HYPO71 and HYPO78-81 series of microseismic location programs and pioneered the use of computer location [9]. In addition, many scholars combine the Geiger method with other methods to improve the accuracy of the location. For example, Shuai XU proposed an acoustic emission (AE) location algorithm based on the least-squares method and Geiger method [10]. There are also some ways to improve location accuracy through the relative location. In 2000, Waldhauser and Ellsworth [11] developed a double-difference (DD) location method that is currently widely used for seismic source location. On this basis, Zhang [12] developed double-difference tomography, relocation, and simultaneous correction of velocity models.
The above-described arrival-based location methods require to accurately pick the first arrival. However, the influence of several factors in mining engineering, such as the weak radiation energy of microseismic signals, the high noise level, and low SNR, greatly increase the picking error of first arrival [13]. Therefore, the stack-based methods are proposed. In 2004, Kao first proposed a Source-Scanning Algorithm (SSA) without identifying the phase and picking the first arrival [14]. The source location procedure is performed using a brightness function, which is obtained by stacking the absolute amplitudes of normalized seismograms recorded at different stations. In the past few years, different scholars have proposed several modified versions of the SSA [15,16,17,18]. Gharti et al. (2010) and Zeng et al. (2014) applied a waveform envelope-stacking approach using both P and S waves to perform microseismic source location [19,20]. Langet et al. (2014) proposed a kurtosis-based stacking function designed to work with P phases only [21]. Grigoli (2013) and Drew (2013) located seismic events by stacking the short-time average to long-time average ratio (STA/LTA) traces of P and S waves [22,23]. In order to evaluate the location accuracy of the above different stacking functions, Cesca (2018) tested their location effects at different noise levels by synthesizing seismic records [24]. The test results show that the STA/LTA stacking function is better. The stack-based methods are especially suitable for microseismic records with low SNR, which can greatly improve the location accuracy compared with the arrival-based method. In addition, the stack-based methods make it easier to fully automate the location process. In practical applications, a large number of microseismic events are received every day in mining. If each microseismic event is to be processed manually, this will inevitably waste a lot of time. Therefore, automatic localization of microseisms is a hot topic in recent years. The arrival-based method is difficult to automatically process waveforms with low SNR, often requiring manual and accurate arrival picking. Fortunately, the stack-based method is easier to realize automation while ensuring location accuracy. For example, Grigoli applied the stack-based method to achieve automatic localization of mining-induced earthquakes [22]. However, in the process of the stack, the above methods treat the stacking weight of each station as the same, without considering the influence of the waveform quality of different stations. Obviously, the better the quality of the waveform, the greater the reliability of the data. Therefore, based on the theory of the stack-based approach, this paper inherits the advantages of this approach without identifying the phase and picking the first arrival. Aiming at the microseismic signals with complex SNR in the mine environment, a new microseismic source location method is proposed. The proposed method mainly has the following two innovations: (1) Considering the influence of the waveform quality of different stations, adding weighting factors makes the better quality waveforms have a greater influence on location, while filtering out completely polluted waveforms, thereby improving location accuracy. (2) In the calculation process, the WDE optimization algorithm without control parameters is used to enhance the robustness of the calculation and improve calculation speed. The above two innovations make this method easy to achieve automatic location.
The proposed method is described below: First, the influences of waveform quality of different stations are considered, and evaluation indicators of waveform quality are established. Since the S wave usually overlaps with the P wave in the case study, it is difficult to distinguish, so we only use the P wave STA/LTA trace. Second, we use the STA/LTA traces that give certain weights according to the evaluation indicators of waveform quality to stack. Third, the WDE algorithm is used instead of the full grid search method to solve the corresponding source coordinates when the stacking function is optimal. It greatly improves the speed of calculation, so this method can be used well in engineering.

2. Materials and Methods

2.1. Waveform Preprocessing

The original waveform cannot be directly used for stack. The first step of the location process requires preprocessing the original waveform to obtain a stacking waveform. Below we mainly introduce three preprocessing methods.
  • Normalized absolute amplitude. Waveform normalization eliminates the effects of attenuation due to geometric expansion and avoids station main-stack near the source. Take the absolute value of the waveform to avoid the peaks and valleys offsetting each other. The equation is as follows:
    a = u m a x u
    where u is the original microseismic record, a is the normalized absolute amplitude.
  • Normalized waveform envelope:
    b = hilbert u m a x hilbert u
    where b is the normalized waveform envelope. hilbert is the Hilbert transform.
  • Normalized STA/LTA traces. STA/LTA is a classic method of arrival picking. There are many calculation methods for its characteristic function. We use an improved version of the equation proposed by Allen in 1978 [25]:
    K = i = 1 l u i / i = 1 l u i
    S T A i = 1 n s t a j = i n s t a i u i 2 + K u i u i 1 2
    L T A i = 1 n l t a j = i n l t a i u i 2 + K u i u i 1 2
    S L i = S T A i / L T A i
    c = S L m a x ( S L )
    where u i is the difference of u . l is the length of the microseismic record. K is a weighting constant that varies with sample rate and station noise characteristics. S T A and L T A are the traces of short and long windows. S L is the ratio of S T A to L T A . n s t a and n l t a are the lengths of short and long windows, respectively. c is the STA/LTA trace.
Grigoli compared the stacking effect after the three preprocessing methods in detail and concluded that the normalized STA/LTA traces had a better effect [24]. Below, we perform preprocessing of these three different methods for a noisy waveform. Figure 1 shows the original waveform of this noise signal (Figure 1a), and normalized waveform of this original waveform after absolute processing (Figure 1b), and the normalized waveform of this original waveform after Hilbert transform (Figure 1c), and the normalized waveform of this original waveform after STA/LTA processing (Figure 1d). It can be seen from Figure 1 that the waveform processed by STA/LTA has a more obvious effect. Obviously, the STA/LTA trace effect better after stacking, consistent with Grigoli’s conclusion.

2.2. Evaluation of Waveform Quality

There are a lot of different types of noise in microseismic signals collected in mining. Different stations receiving the same microseismic signal are different in noise interference. Good waveforms are collected by some stations, and poor waveforms are collected by other stations. In the process of waveform stacking, the existing methods are all equal weights stacking. Obviously, the worse the waveform quality, the greater the error of the location results.
What kind of waveform is good quality? The first is that the noise is small, and the signal segment is obvious. The second is that the first arrival of the P wave is obvious. The SNR can directly reflect the interference level of the noise. However, when the signal segment and the noise segment are not known, the SNR can only be roughly calculated. Here, we take the entire waveform as a signal and take the previous segment of the waveform as noise. In addition, we use the average value of the normalized amplitude to reflect the apparent degree of the signal segment. STA/LTA is a classic algorithm for arrival picking, so we use the average value of the amplitude after STA/LTA normalization to represent the apparent degree of the P-wave first arrival.
Therefore, we use the SNR, the apparent degree of the signal (ADS), and the apparent degree of the jump point (ADJ) to describe the quality of the waveform. Finally, the stacking weight of the waveform is calculated by these three parameters. The specific calculation process is as follows.
  • Calculate the SNR by the following equation:
    E S = i = 1 m u i 2 / m
    E N = i = 1 n u i 2 / n
    S N R = 20 l o g 10 E S E N
    where m and n are the length of the noise segment and the signal segment, respectively. E S and E N are the average energy of noise and signal, respectively. S N R is the signal-to-noise ratio.
Then, we normalize the value of SNR. We make the following rules based on the case study in this paper: If the SNR is less than 0, the signal and noise cannot be distinguished, and the evaluation factor is equal to zero. If the SNR is greater than 45, the noise has no effect on the signal, and the evaluation factor is equal to 1. If the SNR is between the two, we use the interpolation method to calculate the evaluation factor and the function has the form
n a = 0 , S N R < 0 1 45 S N R , 0 S N R 45 1 , S N R > 45
where n a is the value of the normalized SNR.
2.
The equation for calculating ADS can be written as:
A D S = 1 i = 1 l a i / l
The same as above, normalize ADS according to the case study of this paper. A waveform with an ADS value less than 0.8, the evaluation factor is equal to 0. A waveform with an ADS value greater than 0.95, the evaluation factor is equal to 1. A waveform between the two, the evaluation factor is calculated by interpolation. The equation is generated by
n b = 0 , A D S < 0.8 20 3 A D S 16 3 , 0.8 A D S 0.95 1 , A D S > 0.95
where n b is the value of the normalized ADS.
3.
We calculate the ADJ by:
A D J = 1 i = 1 l c i / l
As above, the normalized ADJ is specified as follows: A waveform with an ADJ value less than 0.8, the evaluation factor is equal to 0. A waveform with an ADJ value greater than 0.95, the evaluation factor is equal to 1. A waveform between the two, the evaluation factor is calculated by interpolation. The equation has the form:
n c = 0 , A D J < 0.7 4 A D J 2.8 , 0.7 A D J 0.95 1 , A D J > 0.95
where n c is the value of the normalized ADJ.
The numbers in the above Equations (11), (13) and (15) are set by us based on the case study in this paper. For example, there are four waveforms with different qualities in Figure 2. Their quality parameters are shown in Table 1. The waveform quality of Figure 2a is very poor, and the waveform quality of Figure 2d is very good. We found, through a large number of waveforms in the case study, that when the SNR is below 0, the waveform quality is poor, and when the SNR is greater than 45, the waveform quality is very good, so we have determined the thresholds in Equation (11). Similarly, we have determined the thresholds in Equations (13) and (15). In addition, we can roughly see the quality ranking of these four waveforms: Figure 2d > Figure 2c > Figure 2b > Figure 2a. If only SNR is used as the criterion for determining the waveform quality, the quality of Figure 2b is better than Figure 2c, which is obviously inconsistent with the real situation. Through a large number of waveforms, we found that using the three parameters SNR, ADS, ADJ to describe the waveform quality is the best.
Finally, based on the three normalized quality parameters, we calculate the stacking weight of the waveform according to the equation below.
W = n a × n b × n c
where W is the stacking weight of the waveform. n a , n b , and n c are the normalized values of SNR, ADS, and ADJ, respectively. The normalization process is for the equal impact of these three parameters on the stacking weight. When one of n a , n b , and n c is 0, W is equal to 0, which means that this is an invalid waveform. As shown in Table 1, the stacking weight of Figure 1a is 0.

2.3. Solving the Stacking Function Based on WDE

Considering the effect of different signal quality on location, we substitute the stacking weight of the waveform into the stacking function, and the new stacking function is:
F ( x , y , z , t ) = 1 N n = 1 N W n m = M 1 M 2 f m c n t + t x y z n + m δ t m = M 1 M 2 f m
where F x , y , z , t is the stacking function. x , y , z are the source coordinates and t is the original time. N is the number of receivers. c n is the waveform normalized of the P wave of the n-th station after being processed by STA/LTA. M 1 and M 2 are the numbers of samples before and after the predicted arrival time, respectively. δ t is the sampling interval and f m is a weighting factor. W n is the stacking weight of the n-th waveform. t x y z n is the travel time from the source to the n-th receiver, calculated by:
t x y z n = ( x x n ) 2 + ( y y n ) 2 + ( z z n ) 2 v
where x n , y n , z n are the coordinates of the n-th receiver. v is the equivalent velocity of the P wave propagation in the medium. For complex velocity models, we can use ray tracing to calculate t x y z n [26].
Then, we need to solve the minimum value of the stacking function. Since there are four unknowns in the stacking function, we have more than four valid waveforms to get a stable solution.
In the current literature, in order to solve the objective function optimally, a full grid search method is adopted [27]. However, the calculated time of the full grid search method will be very long, and we use the WDE optimal algorithm to save a lot of time.
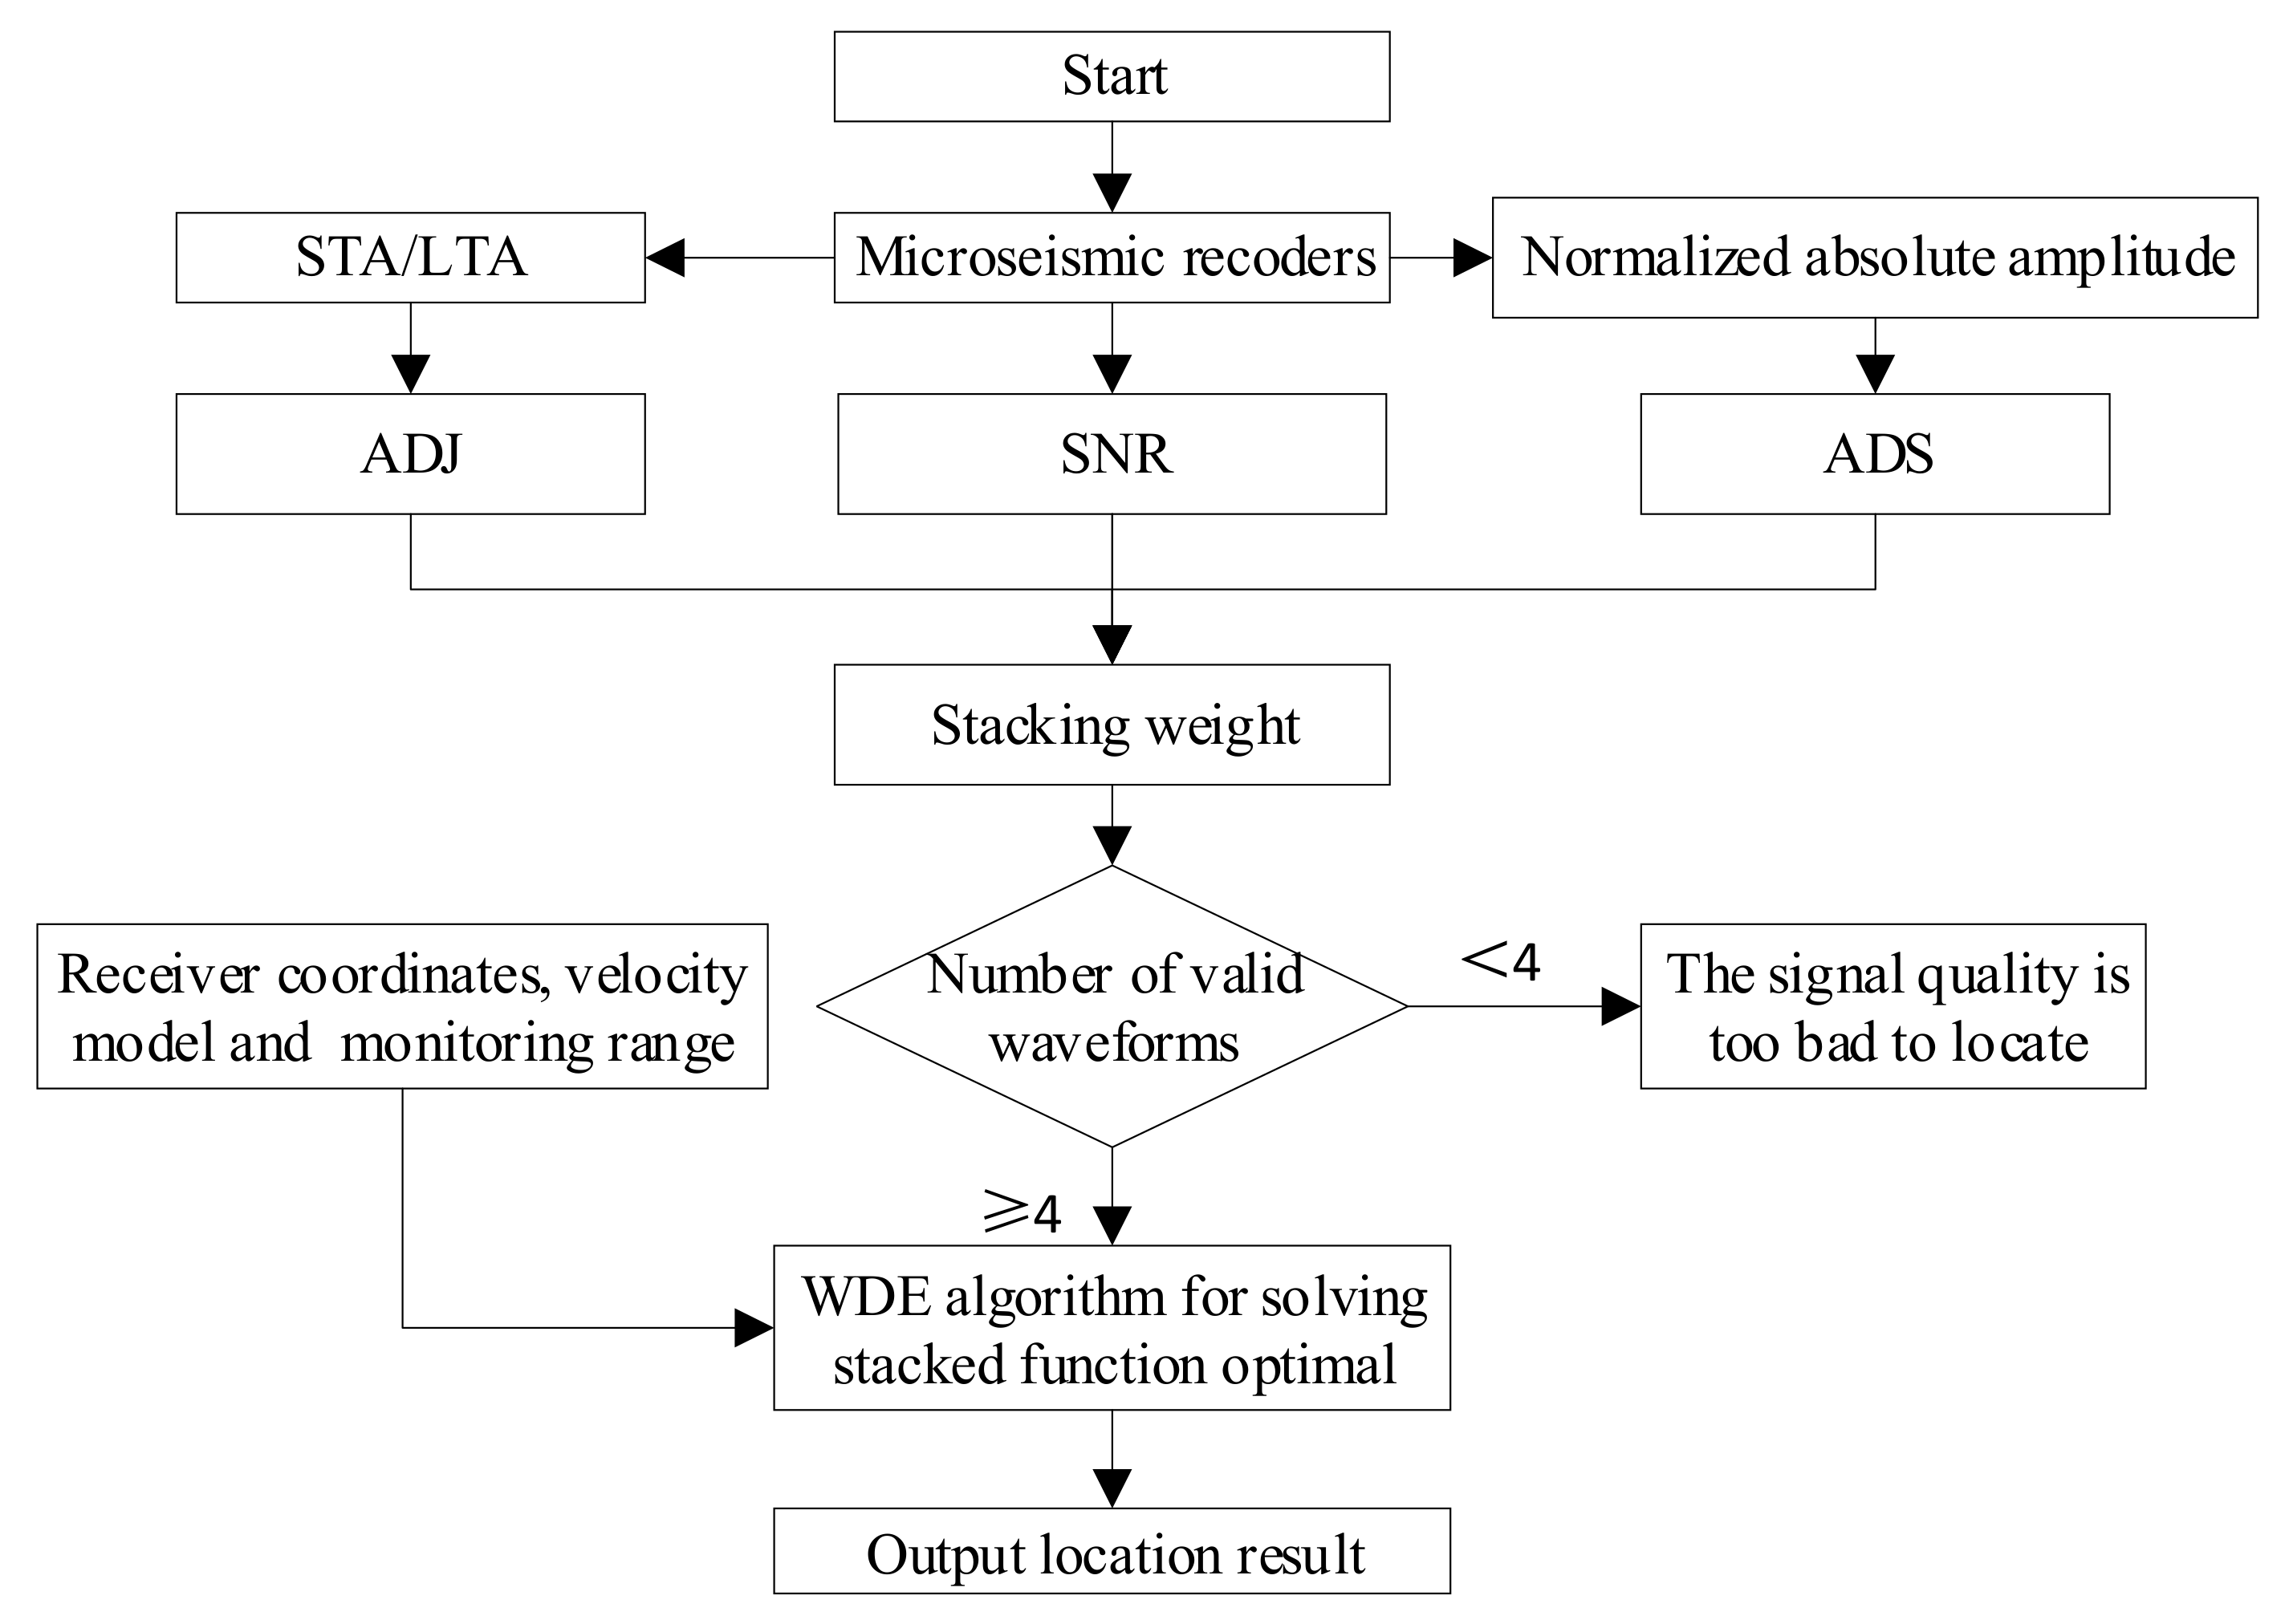
WDE is an improved version of the differential evolution (DE) algorithm. The DE is a statistical, powerful, and widely used evolutionary computation algorithm for solving real-valued numerical optimization problems. DE is robust, and its implementation is relatively easy, and its structure is simple. Recently applied to many fields, but for different types of problems, DE is not enough to determine the effective evolutionary direction and evolutionary step-size. Therefore, Pina [28] proposed the WDE algorithm in 2018, and WDE has the ability to determine the very efficient evolutionary direction and evolutionary step-size. Moreover, WDE has no control parameters in practice, and no parameter tuning is required. The flowchart of the new method proposed in this paper is shown in Figure 3. When a waveform’s stacking weight is not 0, it is a valid waveform.

3. Blasting Experiment Verification

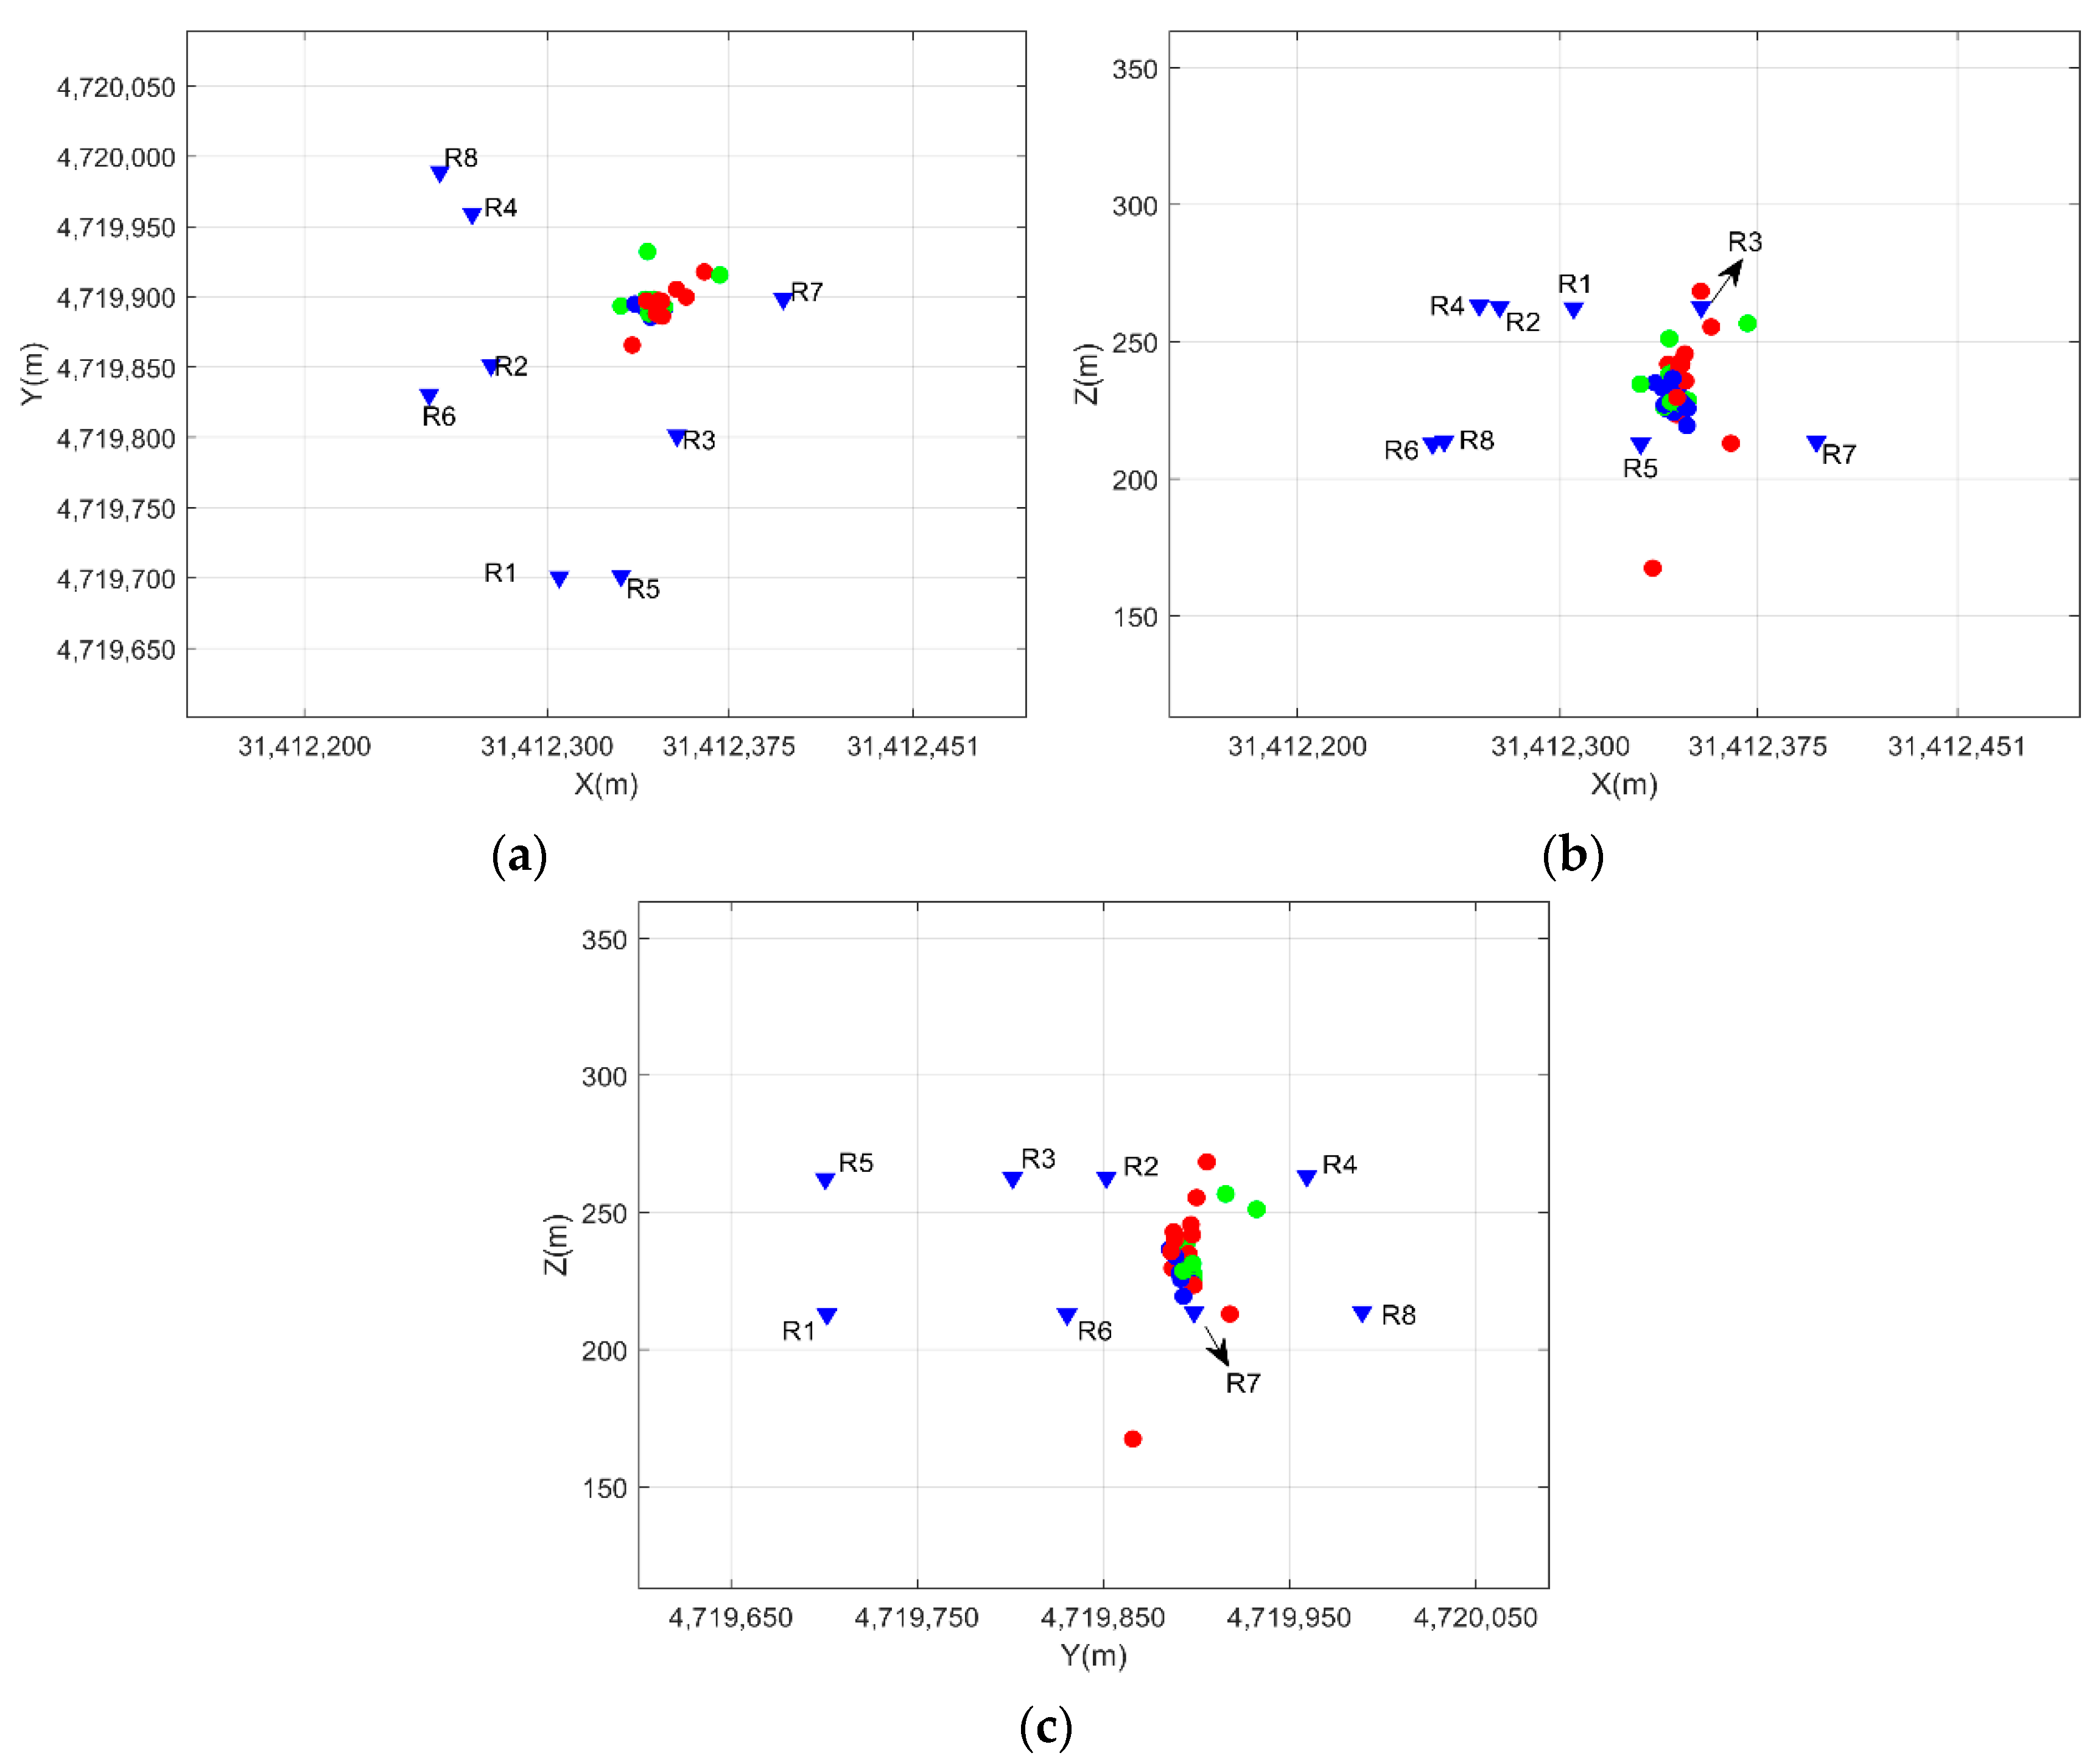
We apply the proposed method to the Huangtupo Copper-Zinc Mine at about 160 km southwest of Hami City, Xinjiang Uygur Autonomous Region, China. The network layout of microseismic monitoring is shown in Figure 4, and the receiver coordinates are shown in Table 2. In order to test the effectiveness of the proposed method, we did three blasting experiments. The coordinates of the three blasting events are shown in Table 3. According to geological data, the equivalent P-wave velocity we use is 5400 m/s.
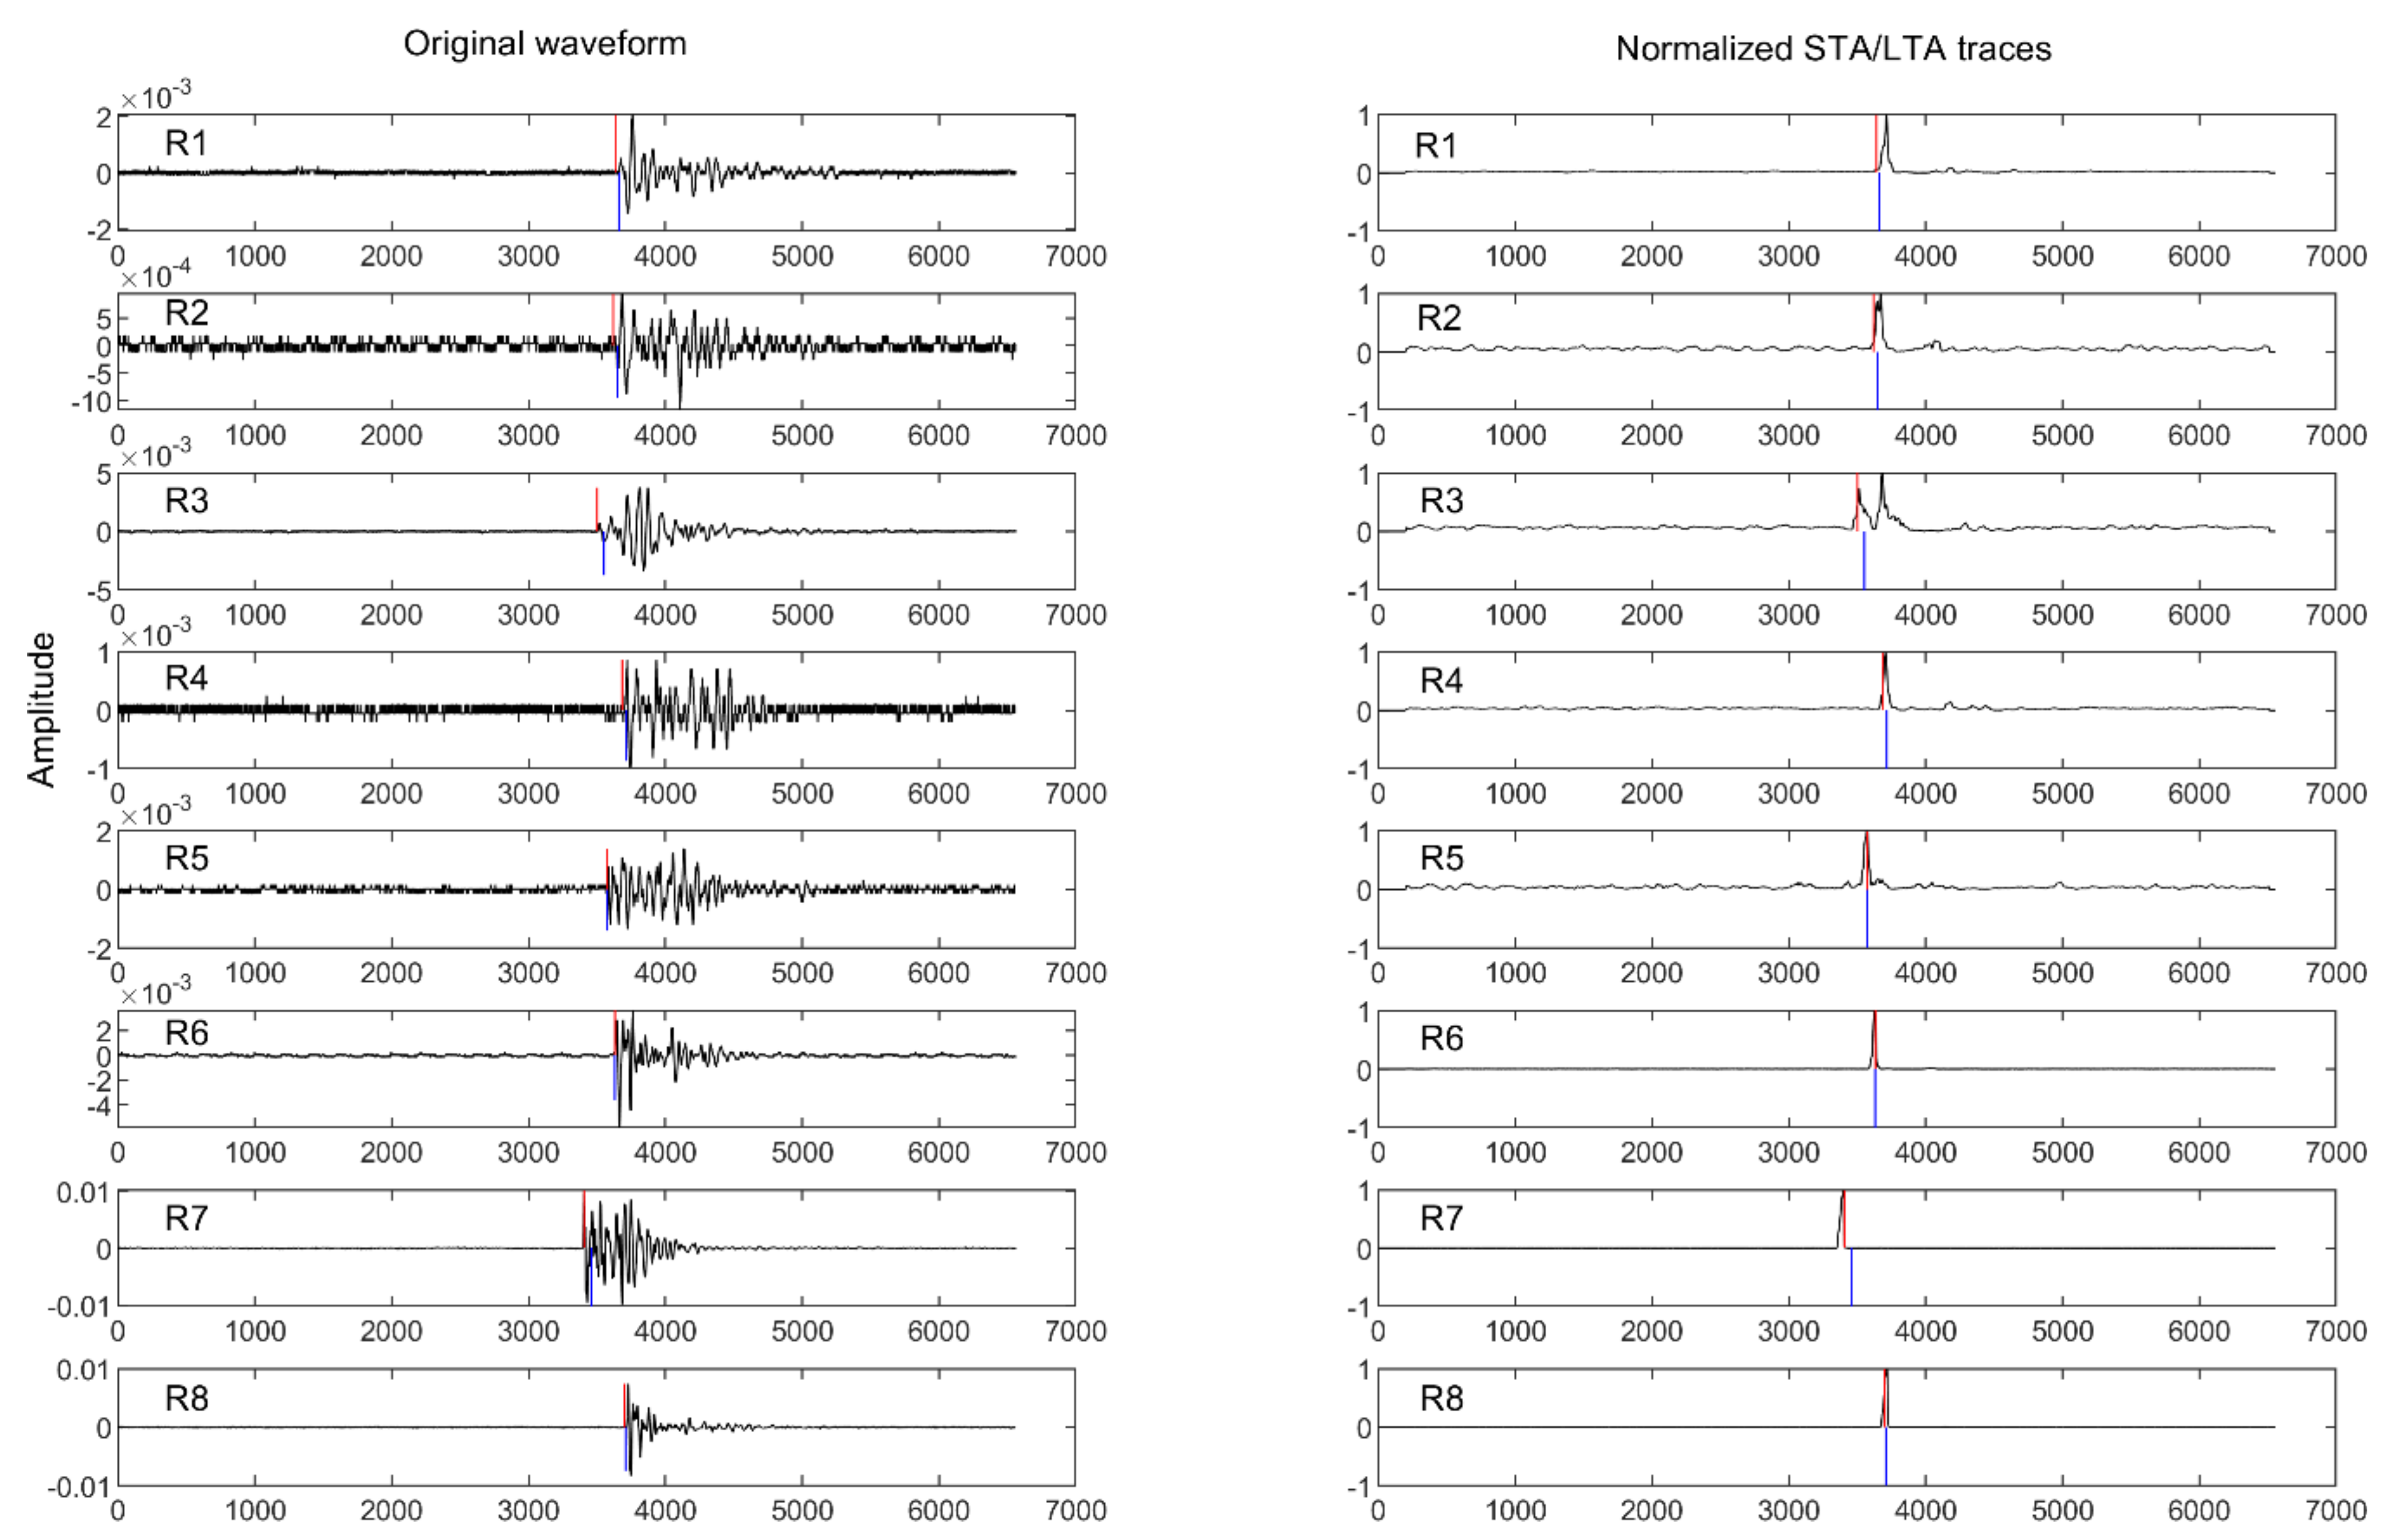
The waveforms of blasting events A and B we collected are shown in Appendix A.1 and Appendix A.2, and the waveforms of blasting event C are shown in Figure 5. It can be seen that the degrees of noise pollution of each channel are different, but the quality of the blasting waveform is good overall, and the SNR is relatively high. First, we calculate the STA/LTA traces according to Equations (3)–(7), as shown in Appendix A.1 and Appendix A.2 and Figure 5. In general, the maximum value on the STA/LTA traces corresponds to the first arrival. Then, the waveform quality is evaluated according to Equations (8)–(15), and the stacking weights of the waveforms are calculated according to Equation (16), and the results are shown in Table 4.
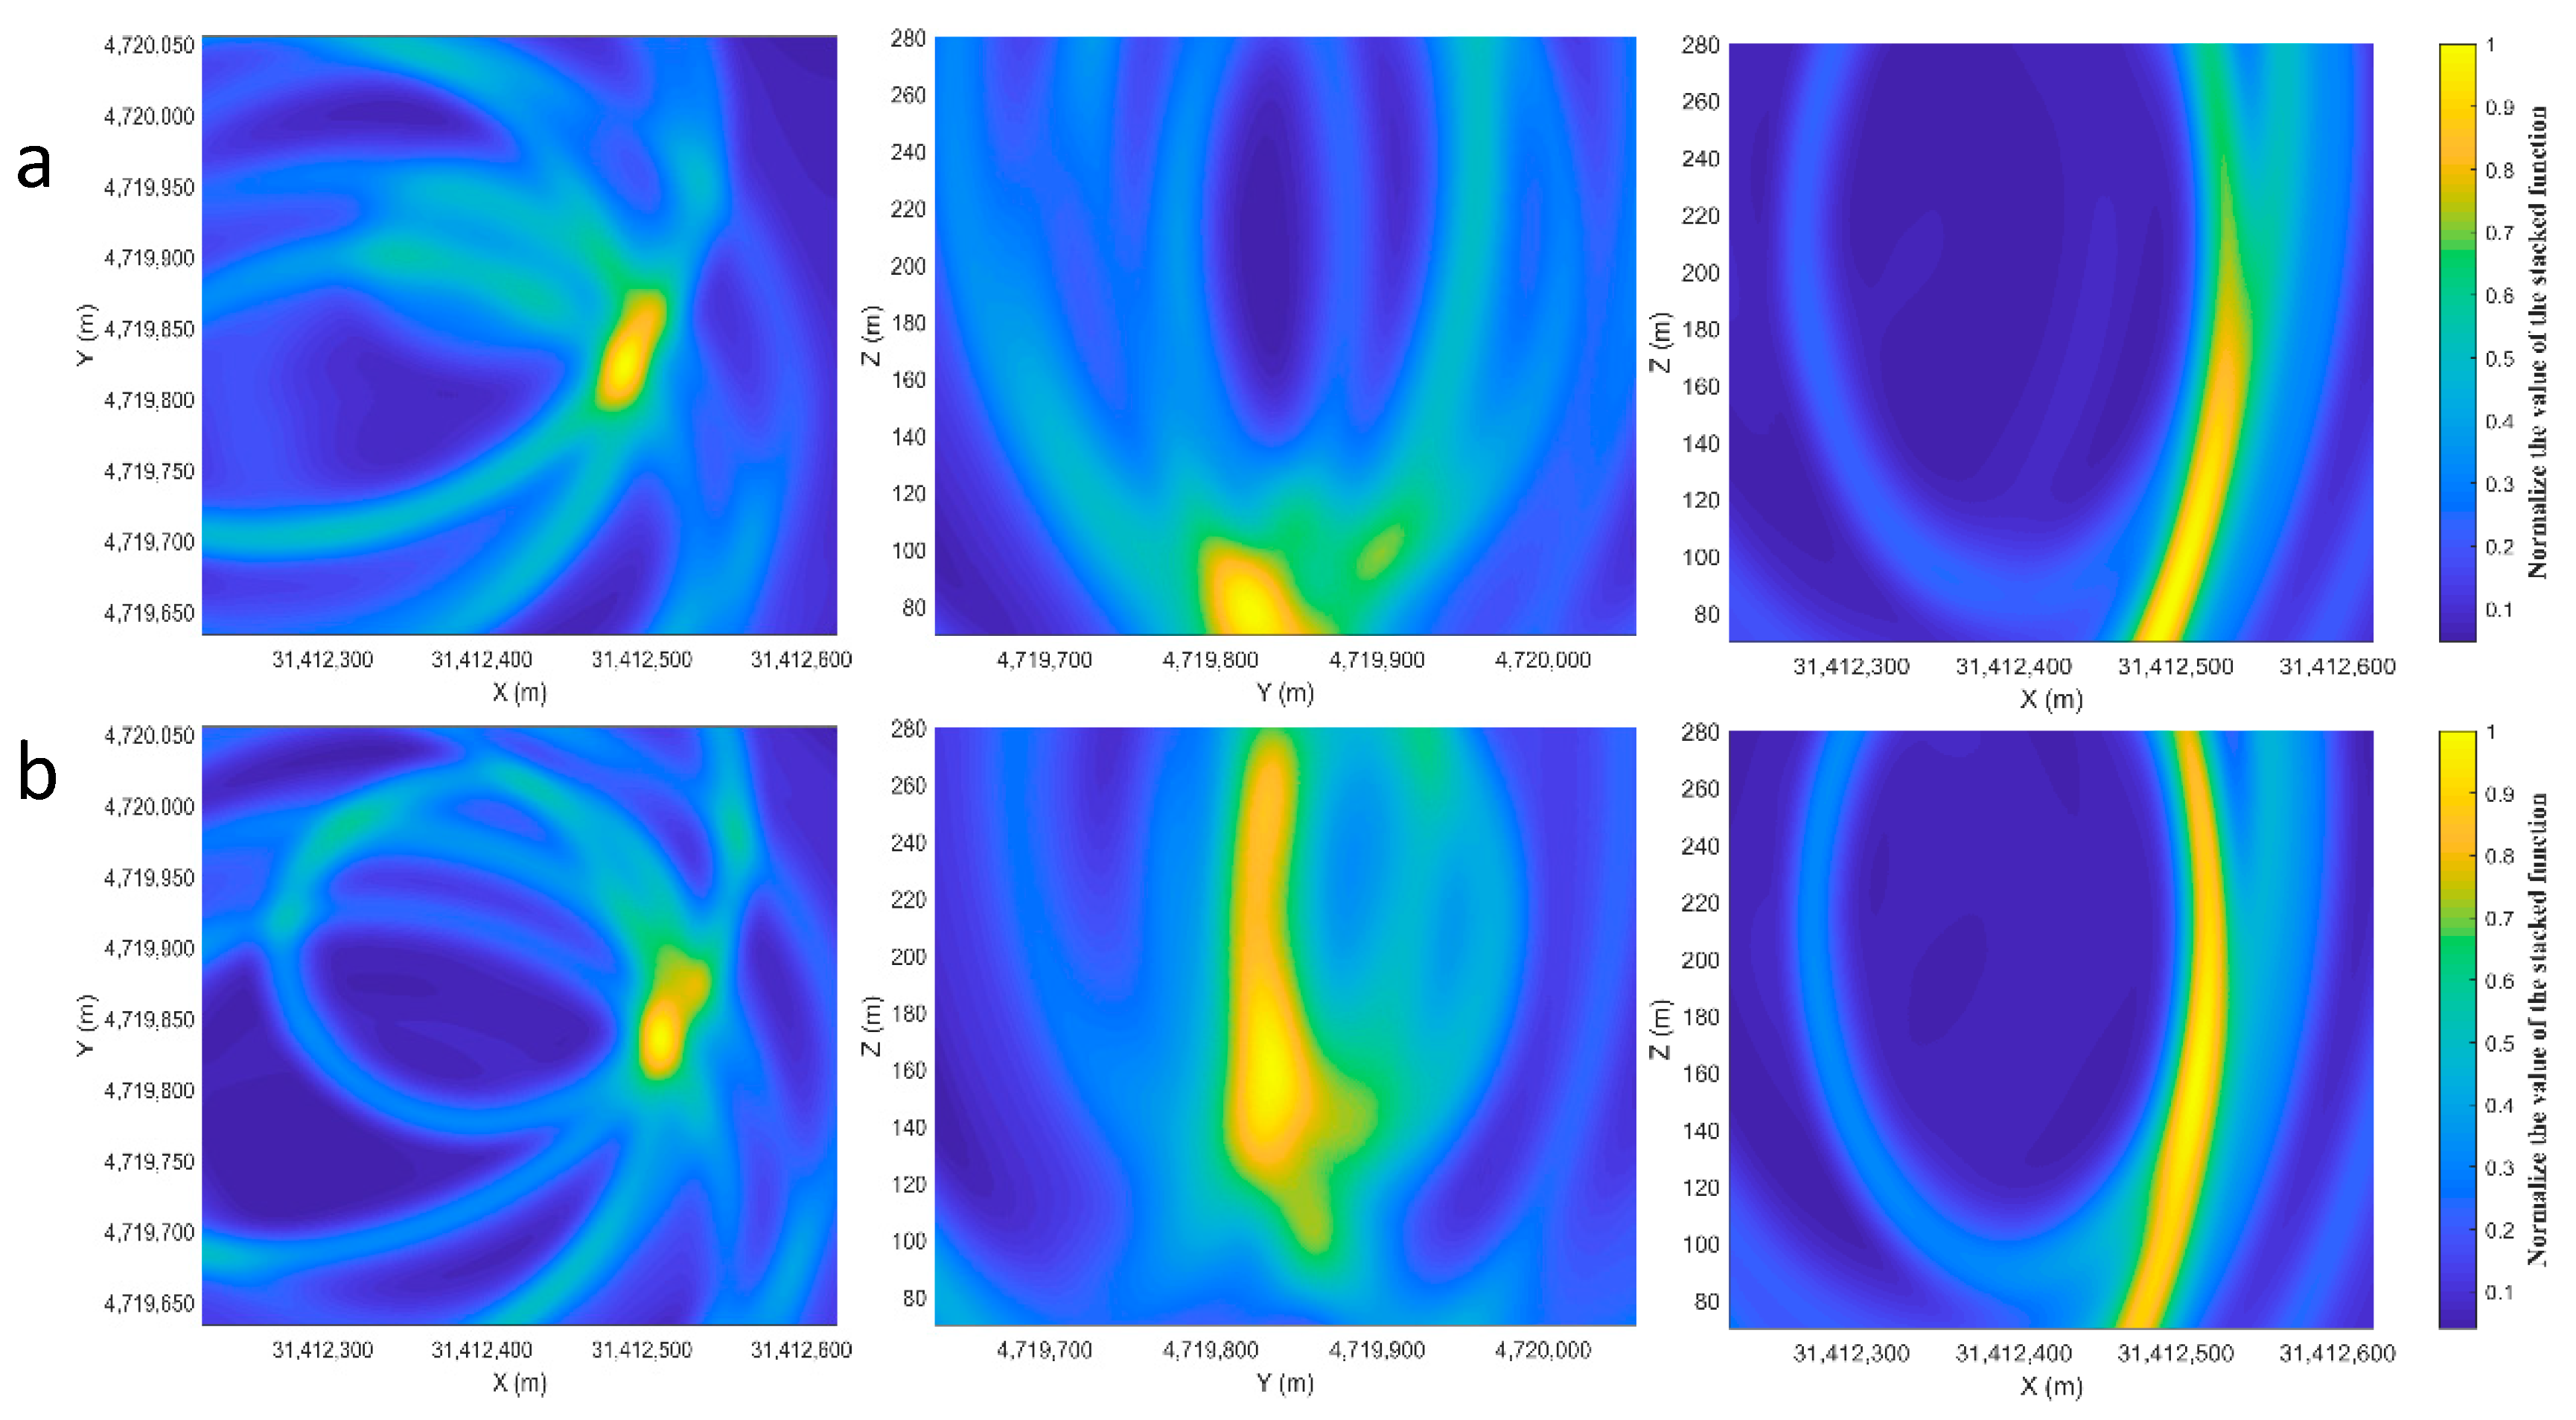
Then, we use the proposed method and the traditional stack-based method [15] to locate these three blasting events. Appendix A.3 and Appendix A.4 and Figure 6 are the stacking function matrix of the proposed method and the traditional stack-based method for the blasting event A, B, C, respectively. It can be clearly seen that the proposed method and the traditional stack-based method have little difference to the stacking function matrix of the blasting events A and B. However, the two methods have a large difference in the Z-direction for the stacking function matrix of the blasting event C. We can also see from Table 3 that the location results of the proposed method for the blasting event C is very close to the true position, while the location error of the traditional stack-based method in the Z direction reaches 80 m. Why are the location errors so different? It can be seen from Figure 6 that the R2 and R4 channel waveforms quality of the blasting event C is not good, and the proposed method has relatively low stacking weights for R2 and R4, which reduces their influence on the location result.
Through the location results of these two methods, we calculate the first arrival according to Equation (19).
t n p = t + t x y z n
where t n p is the first arrival at the n-th station. The first arrival calculated by the traditional stack-based method (blue line), and the proposed method (red line) is shown in Appendix A.1 and Appendix A.2 and Figure 5. The blue lines in Appendix A.1 and Appendix A.2 are basically the same as the red lines, but the blue lines and red lines of the R2, R3, R4, and R7 channels in Figure 5 are different. We can clearly see that R3 and R7 have higher SNR, and R2 and R4 have lower SNR in Figure 5, which is also consistent with the stacking weights in Table 4. As shown in Figure 7, for R3 and R7 with higher SNR, the first arrival calculated by the proposed method (red line) is closer to that calculated by the manual picking method (green line). However, for lower SNR R2, R3, the first arrival calculated by the proposed method is in the preceding noise segment of that calculated by the manual picking method.
In general, for a waveform with a low SNR, the true first arrival is contaminated by noise, and that cannot be accurately picked. The position we pick is often after the true first arrival. For waveforms with high SNR, we can pick the first arrival more accurately. It can be explained from the above phenomenon that the proposed method can reduce the influence of the waveform with low SNR on the location, so the first arrival calculated by the proposed method is closer to reality. The traditional stack-based method does not take into account the influence of waveform quality on location, which also explains why the traditional stack-based method has a large error in the location result of the blast event C (see as Appendix A).
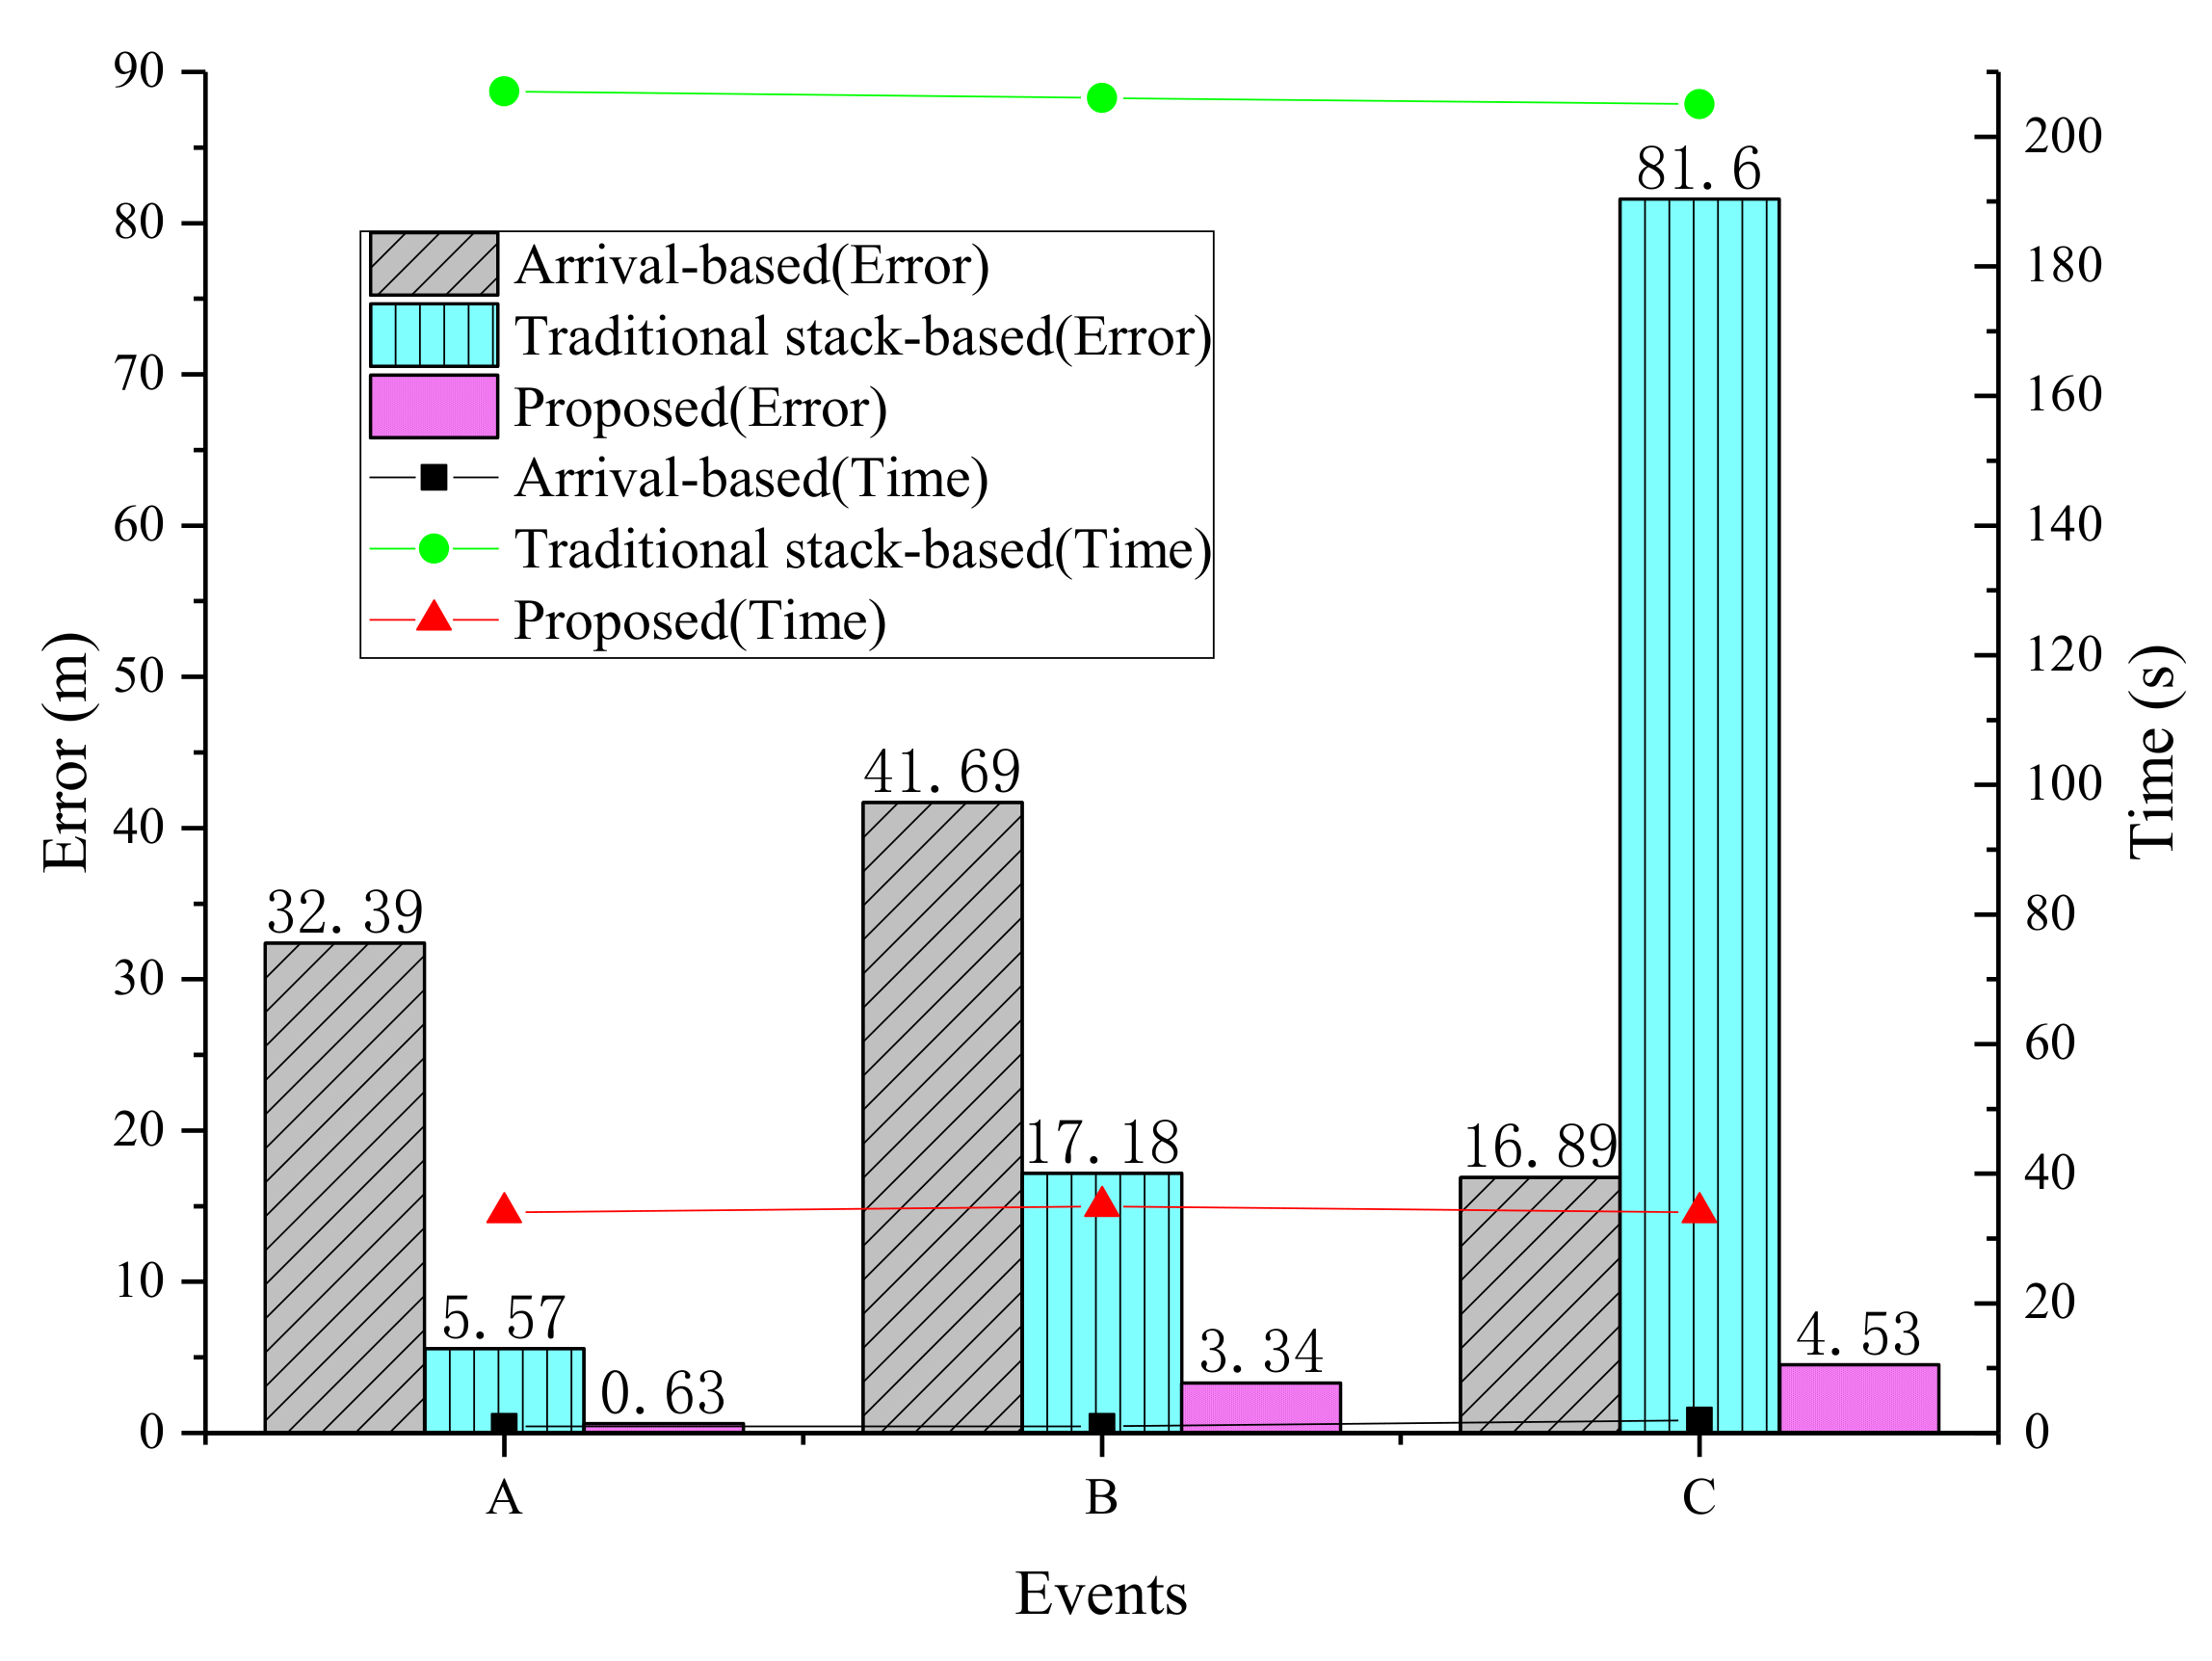
We also use the arrival-based method to locate these three blasting events. The location results are shown in Table 3. Figure 8 shows the spatial location error of these three methods. We can see that the location accuracy of the proposed method is much higher than the other two location methods. Among them, the traditional stack-based method has higher location accuracy for the blasting events A and B than the arrival-based method. Except for the traditional stack-based method for the location of the blasting event C, we can conclude that the proposed method has higher location accuracy than the traditional stack-based method, while the traditional stack-based method is higher than the arrival-based method.
In general, the stack-based method requires more computing time than the arrival-based method. This paper uses WDE algorithm to greatly improve the computing speed of the stack-based method. The computing time of the three location methods is shown in Table 3. It only takes 1 s to locate an event based on the arrival-based method, which takes the least time. The traditional stack-based method takes 206 s to locate an event. We use the WDE algorithm to reduce the computing time to 34 s, which increases the computing speed by six times. The above location process is based on Matlab programming on a 3.6 GHz Intel Core i9-9900k CPU.

4. Application and Discussion

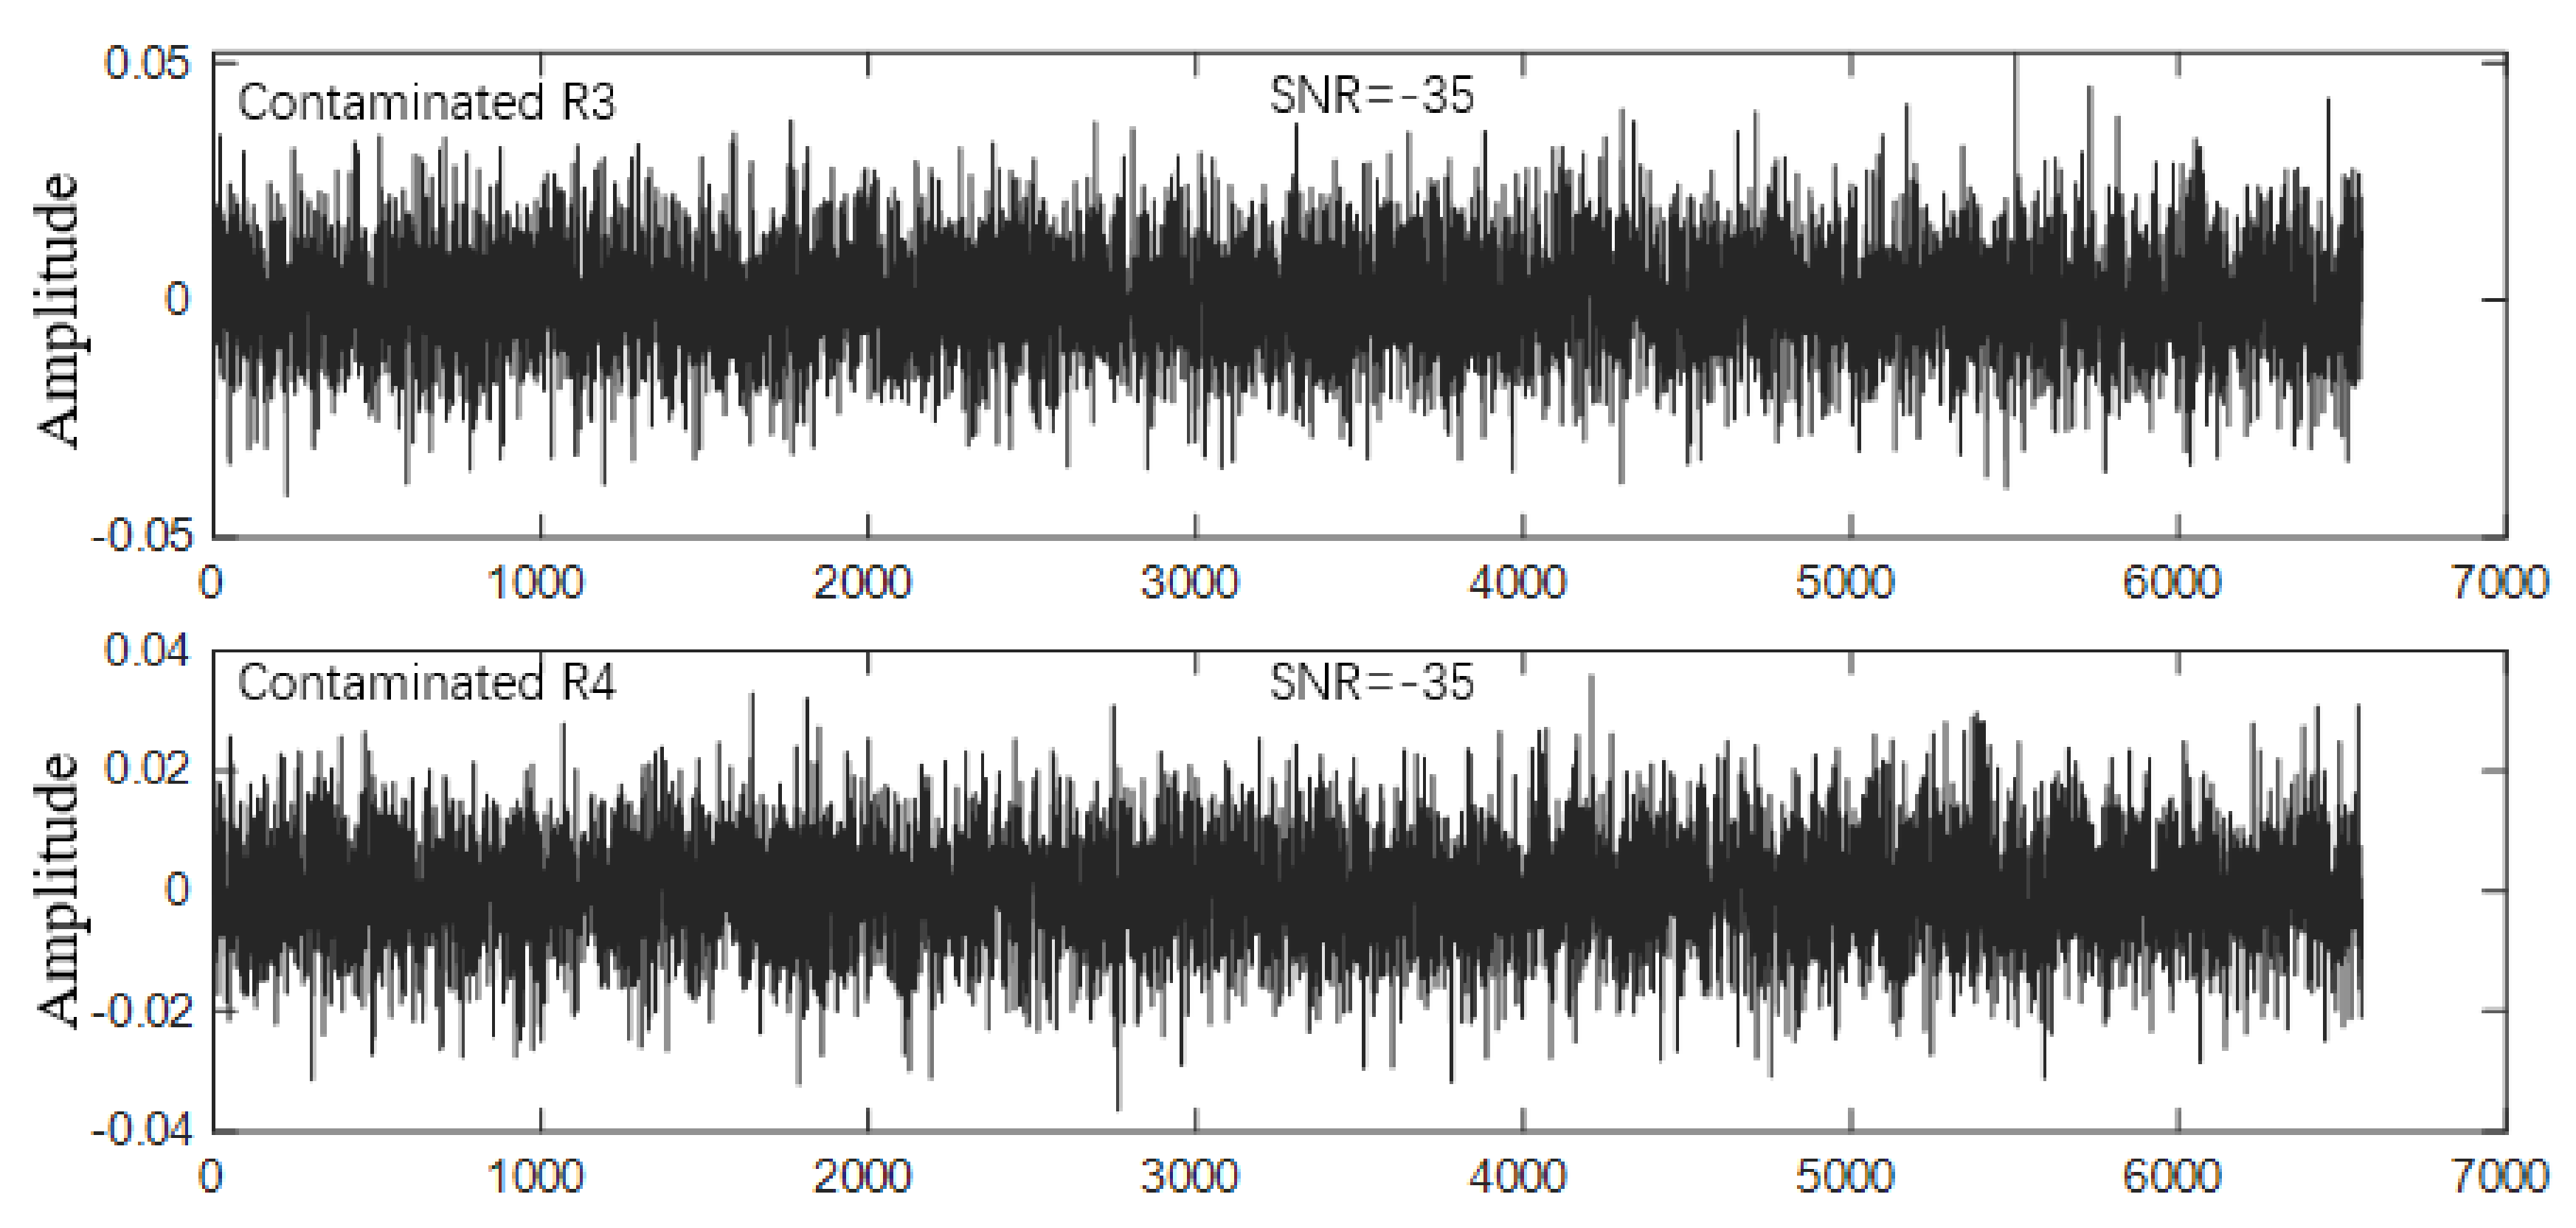
The microseismic monitoring system of the Huangtupo Copper-Zinc Mine began to operate in October 2018. During the data acquisition process, we found that the microseismic signal has low SNR and poor waveforms quality, and some of the channels are completely contaminated by noise. The method proposed in this paper is very suitable for the mine in theory. In order to verify the actual effectiveness, we have done two experiments. In the first experiment, we add the SNR of −30 to the R3 channel of blasting event A. Figure 9 shows the waveform after adding noise. It is very obvious that the channel is completely contaminated. In the second experiment, we add the SNR of −35 to R3 and R4 of the blasting event A. Figure 10 shows the waveforms of the R3 and R4 channels after adding noise.
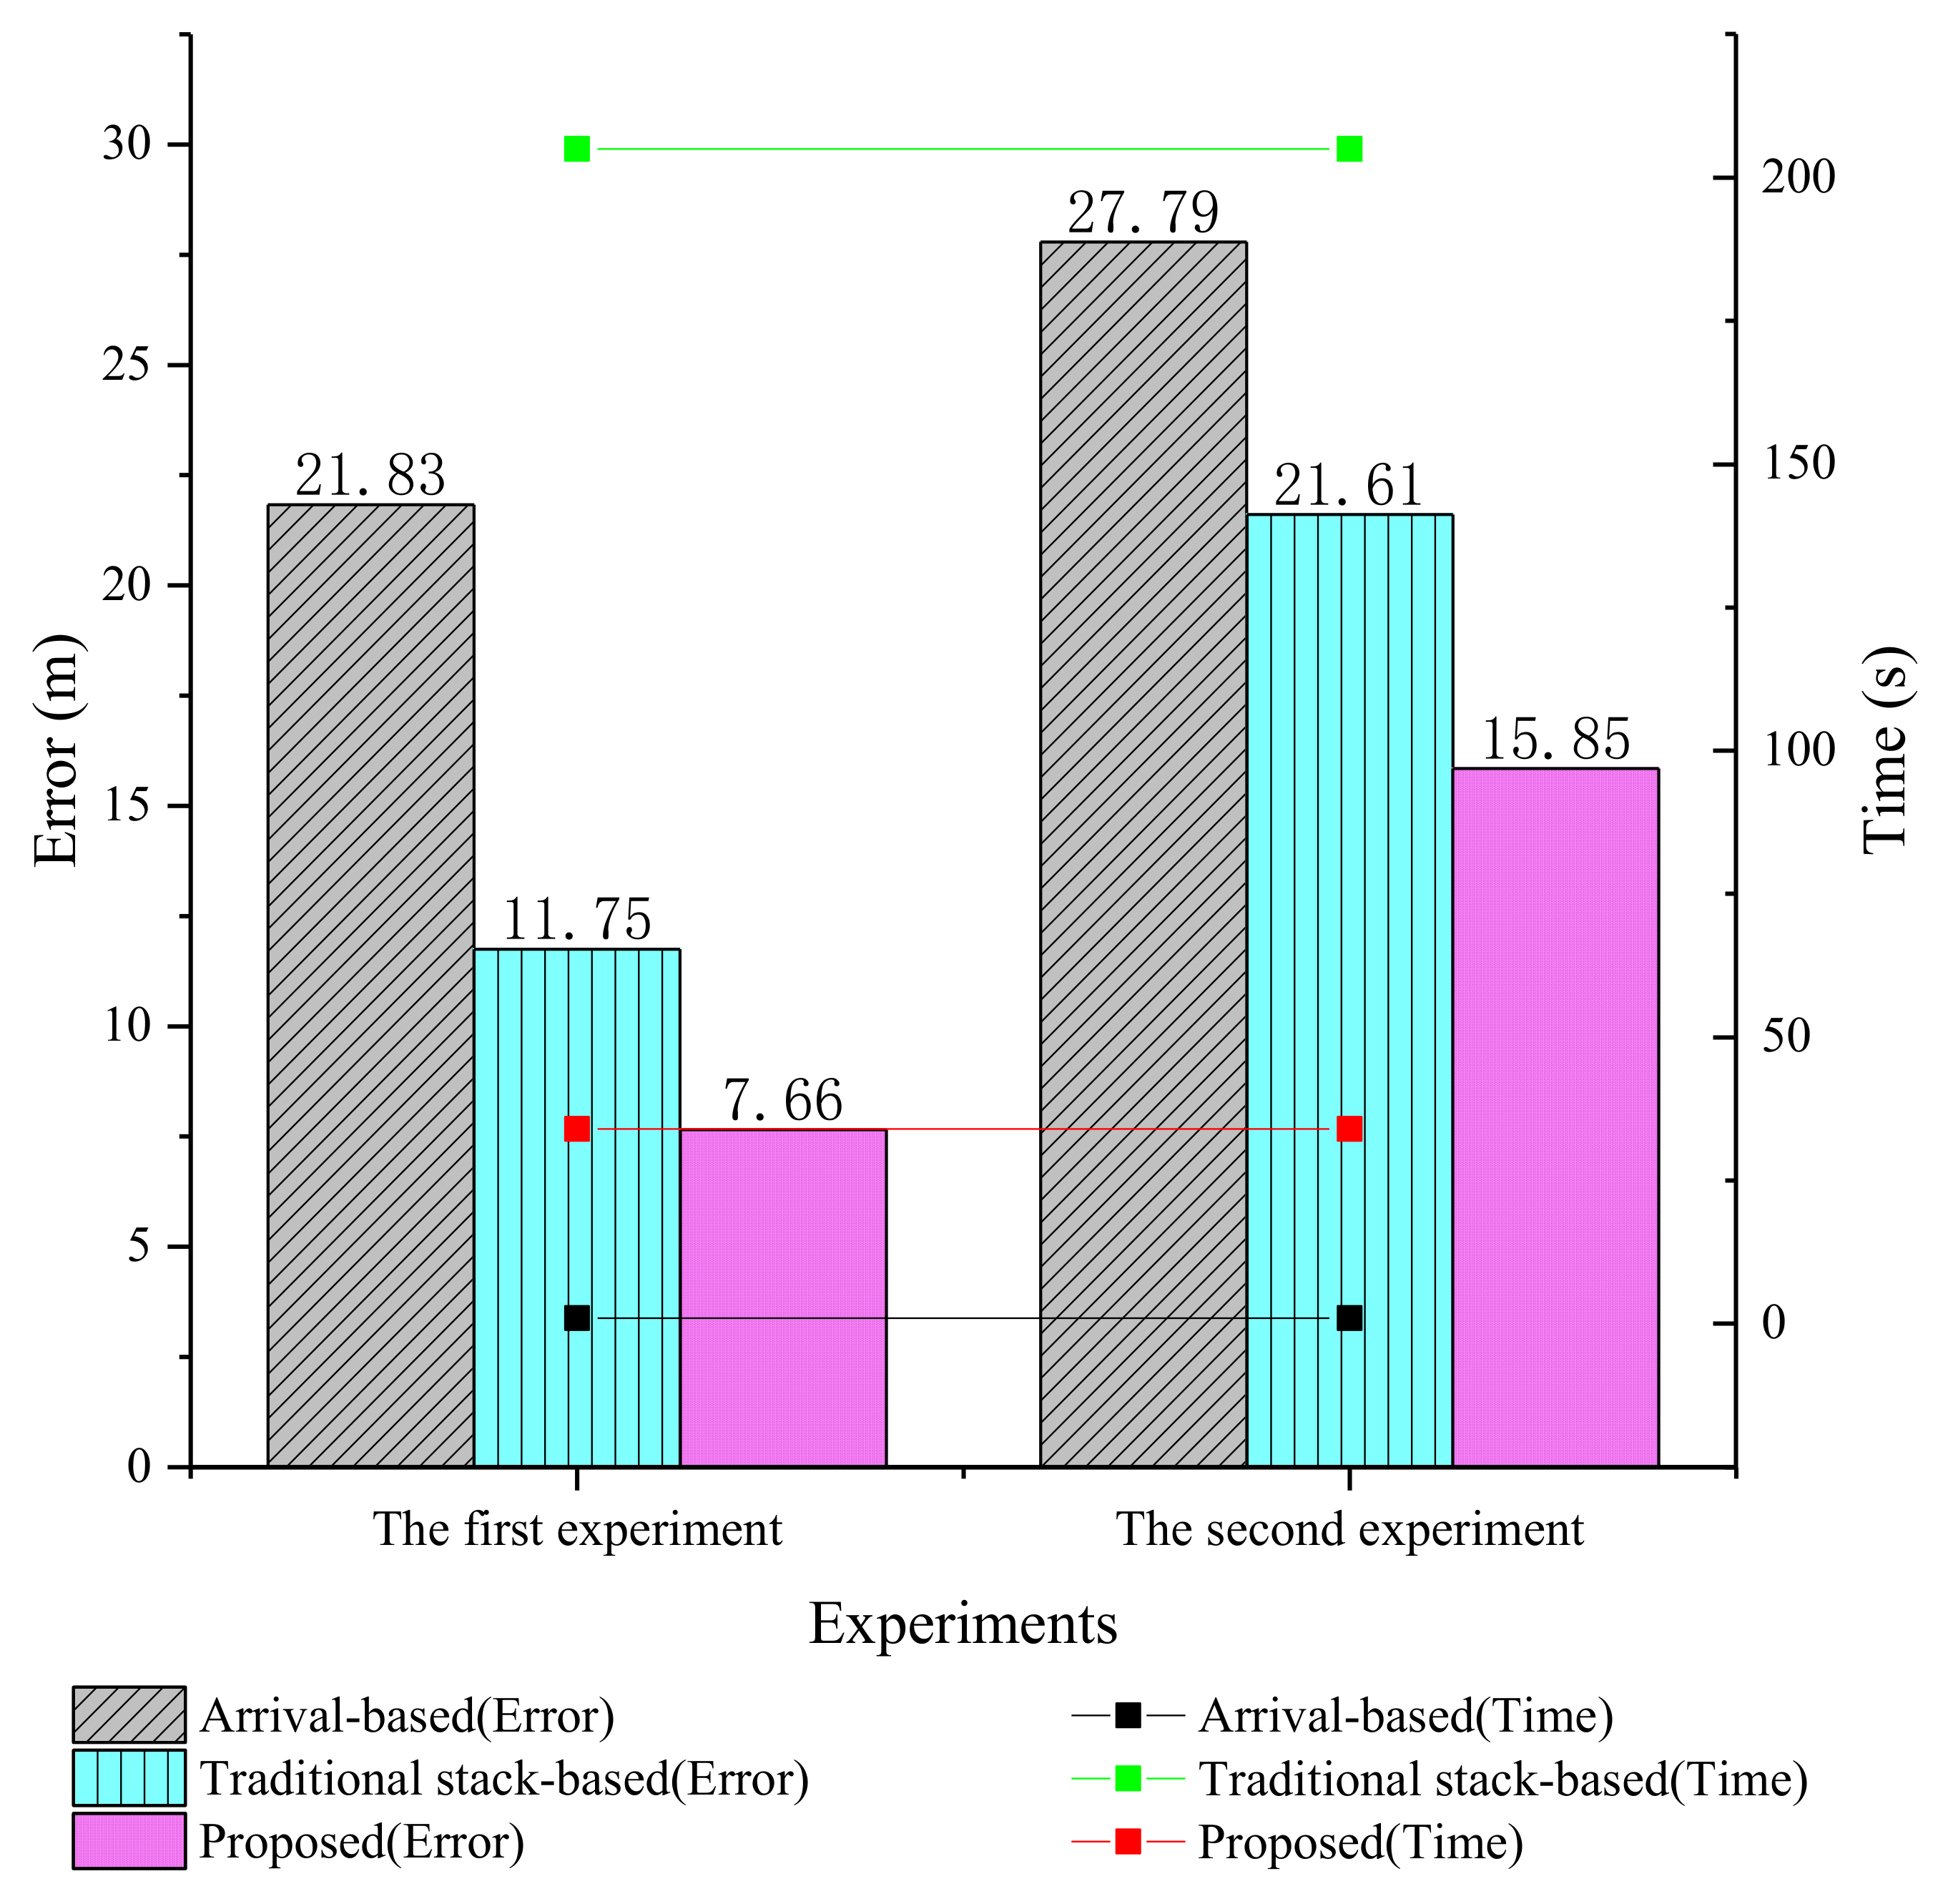
We use the proposed method, the traditional stack-based method, and the arrival-based method to simultaneously locate the two contaminated experiments. Table 5 shows the location results of these two experiments. The spatial location errors are shown in Figure 11. We can see the following phenomena in Figure 8 and Figure 11:
  • Based on the arrival-based method, the spatial location error of blasting event A is 21.83 m (The first experiment using R1, R2, R4–R8) < 27.79 m (the second experiment using R1, R2, R5–R8) <32.39 m (Using R1–R8). The reason is as follows: As seen from Table 5, the R3 stacking weight is 0.53, and the R4 stacking weight is 0.61. The R3 waveform quality is the worst, and the picking error is large, which affects the location accuracy.
  • The spatial location error of the blasting event A based on the traditional stack-based method is 5.57 m (Uncontaminated) <11.75 m (the first experiment) <21.61 m (the second experiment).
  • The spatial location error of the proposed method for blasting event A is 0.63 m (Uncontaminated) <7.66 m (the first experiment) <15.85 m (the second experiment).
  • In summary, the following conclusions can be drawn: 1. In the case of good waveform quality, the location accuracy based on the stack-based method, and the arrival-based method may not be much different. However, when the waveform quality is poor, the arrival-based method is likely to cause a large location error due to inaccurate arrival picking, while the stack-based method is better. 2. The proposed method has higher location accuracy than the traditional stack-based method. 3. The more effective the waveforms, the more accurate the location results of the stack-based method.
It can be seen from the above experiments that the method proposed in this paper can be well applied in mining. The whole location process does not require manual operation. The proposed method automatically deletes the waveforms with poor signal quality according to the evaluation of waveforms quality, reduces its influence on the location result, improves the location accuracy, and realizes full automation of the entire location process. We located 13 microseismic events detected by the microseismic system on 26 October 2018. Figure 4 shows the results of the location of the 13 microseismic events for the arrival-based method and the traditional stack-based method and the proposed method. The red circles indicate the location results of the arrival-based method, and the green circles indicate the location results of the traditional stacked-based method, and the blue circles indicate the location results of the proposed method. From the concentration of events, the proposed method is better than the traditional stack-based method, and the traditional stack-based method is better than the arrival-based method.

5. Conclusions

We propose a new method for microseismic source location based on the stack-based method. The proposed method fully realizes the automatic location. Considering the influence of waveforms quality on the location results, we have modified the original stacking function by three evaluation indicators of waveforms quality. Our method is used in the Huangtupo Copper-Zinc Mine with very low SNR, making full use of the microseismic channels associated with the trigger event as input data. For the heavily polluted channel, we can automatically drop them out by the proposed method. We successfully verified the accuracy of the proposed method through blasting experimental and real data sets. In the process of solving the stacking function optimization, we use the WDE with no parameters to adjust to replace the full grid search method, which increases the computing speed by six times. In summary, the method proposed in this paper includes the following advantages: (1) It is not necessary to identify the phase and pick the first arrival, (2) the location process is fully automated, (3) the invalid waveforms are automatically discarded, and the location accuracy is improved, (4) the method is reckless, also has good performance for low-quality signals, (5) the calculated speed is fast and stable, very practical for engineering.

Author Contributions

Y.J. and P.P. participated in data analysis, participated in the design of the study and drafted the manuscript, carried out the statistical analyses; Z.H. collected field data; L.W. conceived of the study, designed the study, coordinated the study and helped draft the manuscript. All authors have read and agreed to the published version of the manuscript.

Funding

This research was funded by the National Key R&D Program of China, grant number 2017YFC0602905.

Conflicts of Interest

The authors declare no conflict of interest.

Appendix A

Appendix A.1. Waveforms and STA/LTA Traces of Blasting Event A

Figure A1. Waveforms and STA/LTA traces of Blasting event A (R1–R8). The first arrival time of the P wave calculated by the traditional stack-based method (blue line) and the proposed method (red line).
Sustainability 12 03665 g0a1

Appendix A.2. Waveforms and STA/LTA Traces of Blasting Event B

Figure A2. Waveforms and STA/LTA traces of Blasting event B (R1–R8). The first arrival time of the P wave calculated by the traditional stack-based method (blue line) and the proposed method (red line).
Sustainability 12 03665 g0a2

Appendix A.3. Comparison of Location of Blasting Event A

Figure A3. Comparison of location of blasting event A. Location results of the traditional stack-based method (a) and the proposed method (b) (stacking function matrix on XY, YZ, XZ plane).
Sustainability 12 03665 g0a3

Appendix A.4. Comparison of Location of Blasting Event B

Figure A4. Comparison of location of blasting event B. Location result of the traditional stack-based method (a) and the proposed method (b) (stacking function matrix on XY, YZ, XZ plane).
Sustainability 12 03665 g0a4

References

  1. Ghosh, G.K.; Sivakumar, C. Application of underground microseismic monitoring for ground failure and secure longwall coal mining operation: A case study in an Indian mine. J. Appl. Geophys. 2018, 150, 21–39. [Google Scholar] [CrossRef]
  2. Li, Y.; Yang, T.; Liu, H.; Hou, X.; Wang, H. Effect of mining rate on the working face with high-intensity mining based on microseismic monitoring: A case study. J. Geophys. Eng. 2017, 14, 350–358. [Google Scholar] [CrossRef] [Green Version]
  3. Li, Y.; Yang, T.H.; Liu, H.L.; Wang, H.; Hou, X.G.; Zhang, P.H.; Wang, P.T. Real-time microseismic monitoring and its characteristic analysis in working face with high-intensity mining. J. Appl. Geophys. 2016, 132, 152–163. [Google Scholar] [CrossRef]
  4. Kinscher, J.; Bernard, P.; Contrucci, I.; Mangeney, A.; Piguet, J.P.; Bigarre, P. Location of microseismic swarms induced by salt solution mining. Geophys. J. Int. 2015, 200, 337–362. [Google Scholar] [CrossRef] [Green Version]
  5. Peng, P.; Wang, L. Targeted location of microseismic events based on a 3D heterogeneous velocity model in underground mining. PLoS ONE 2019, 14, e0212881. [Google Scholar] [CrossRef] [Green Version]
  6. Viana, Y.; Young, R.J.; Sousa-Lima, R.S.; Duarte, M.H. Mining noise affects Rufous-Collared Sparrow (Zonothichia capensis) vocalizations. J. Acoust. Soc. Am. 2017, 141, 3942. [Google Scholar] [CrossRef]
  7. Plenkers, K.; Ritter, J.R.R.; Schindler, M. Low signal-to-noise event detection based on waveform stacking and cross-correlation: Application to a stimulation experiment. J. Seismol. 2013, 17, 27–49. [Google Scholar] [CrossRef]
  8. Geiger, L. Probability method for the determination of earthquake epicenters from the arrival time only (translated from Geiger’s 1910 German article). Bull. St. Louis Univ. 1921, 8, 56–71. [Google Scholar]
  9. Lee, W.H.K.; Lahr, J.C.; Valdes, C.M. The HYPO71 earthquake location program. Int. Geophys. 2003, 81, 1641–1642. [Google Scholar]
  10. Xu, S.; Liu, J.; Xu, S.; Wei, J.; Huang, W.; Dong, L. Experimental studies on pillar failure characteristics based on acoustic emission location technique. Trans. Nonferrous Met. Soc. China 2012, 22, 2792–2798. [Google Scholar] [CrossRef]
  11. Waldhauser, F.; Ellsworth, W. A Double-Difference Earthquake Location Algorithm: Method and Application to the Northern Hayward Fault, California. Bull. Seismol. Soc. Am. 2000, 90, 1353–1368. [Google Scholar] [CrossRef]
  12. Zhang, H. Double-Difference Tomography: The Method and Its Application to the Hayward Fault, California. Bull. Seismol. Soc. Am. 2003, 93, 1875–1889. [Google Scholar] [CrossRef]
  13. Cheng, J.; Song, G.; Sun, X.; Wen, L.; Li, F. Research Developments and Prospects on Microseismic Source Location in Mines. Engineering 2018, 4, 653–660. [Google Scholar] [CrossRef]
  14. Kao, H.; Shan, S.J. The Source-Scanning Algorithm: Mapping the distribution of seismic sources in time and space. Geophys. J. Int. 2004, 157, 589–594. [Google Scholar] [CrossRef]
  15. Kao, H.; Shan, S.J. Rapid identification of earthquake rupture plane using Source-Scanning Algorithm. Geophys. J. Int. 2007, 168, 1011–1020. [Google Scholar] [CrossRef]
  16. Kan, C.W.; Kao, H.; Ou, G.B.; Chen, R.Y.; Chang, C.H. Delineating the rupture planes of an earthquake doublet using Source-Scanning Algorithm: Application to the 2005 March 3 Ilan Doublet, northeast Taiwan. Geophys. J. Int. 2010, 182, 956–966. [Google Scholar] [CrossRef] [Green Version]
  17. Yu, Y.; Liang, C.; Wu, F.; Wang, X.; Yu, G.; Chu, F. On the accuracy and efficiency of the joint source scanning algorithm for hydraulic fracturing monitoring. Geophysics 2018, 83, KS77–KS85. [Google Scholar] [CrossRef]
  18. Liao, Y.C.; Kao, H.; Rosenberger, A.; Hsu, S.K.; Huang, B.S. Delineating complex spatiotemporal distribution of earthquake aftershocks: An improved Source-Scanning Algorithm. Geophys. J. Int. 2012, 189, 1753–1770. [Google Scholar] [CrossRef] [Green Version]
  19. Gharti, H.N.; Oye, V.; Roth, M.; Kühn, D. Automated microearthquake location using envelope stacking and robust global optimization. Geophysics 2010, 75, MA27–MA46. [Google Scholar] [CrossRef]
  20. Zeng, X.; Zhang, H.; Zhang, X.; Wang, H.; Zhang, Y.; Liu, Q. Surface Microseismic Monitoring of Hydraulic Fracturing of a Shale-Gas Reservoir Using Short-Period and Broadband Seismic Sensors. Seismol. Res. Lett. 2014, 85, 668–677. [Google Scholar] [CrossRef]
  21. Langet, N.; Maggi, A.; Michelini, A.; Brenguier, F. Continuous Kurtosis-Based Migration for Seismic Event Detection and Location, with Application to Piton de la Fournaise Volcano, La Reunion. Bull. Seismol. Soc. Am. 2014, 104, 229–246. [Google Scholar] [CrossRef]
  22. Grigoli, F.; Cesca, S.; Vassallo, M.; Dahm, T. Automated Seismic Event Location by Travel-Time Stacking: An Application to Mining Induced Seismicity. Seismol. Res. Lett. 2013, 84, 666–677. [Google Scholar] [CrossRef]
  23. Drew, J.; White, R.S.; Tilmann, F.; Tarasewicz, J. Coalescence microseismic mapping. Geophys. J. Int. 2013, 195, 1773–1785. [Google Scholar] [CrossRef]
  24. Cesca, S.; Grigoli, F. Full waveform seismological advances for microseismic monitoring. Adv. Geophys. 2015, 56, 169–228. [Google Scholar]
  25. Allen, R. Automatic phase pickers: Their present use and future prospects. Bull. Seismol. Soc. Am. 1982, 72, 225–242. [Google Scholar]
  26. Peng, P.; Wang, L. 3DMRT: A Computer Package for 3D Model-Based Seismic Wave Propagation. Seismol. Res. Lett. 2019, 90, 2039–2045. [Google Scholar] [CrossRef]
  27. Kummerow, J. Using the value of the crosscorrelation coefficient to locate microseismic events. Geophysics 2010, 75, MA47–MA52. [Google Scholar] [CrossRef]
  28. Civicioglu, P.; Besdok, E.; Gunen, M.A.; Atasever, U.H. Weighted differential evolution algorithm for numerical function optimization: A comparative study with cuckoo search, artificial bee colony, adaptive differential evolution, and backtracking search optimization algorithms. Neural Comput. Appl. 2020, 32, 3923–3937. [Google Scholar] [CrossRef]
Figure 1. A noise waveform and results after three preprocessing methods. (a) Original waveform, (b) normalized waveform after absolute processing (Equation (1)), (c) normalized waveform after Hilbert transform (Equation (2)), (d) normalized waveform after STA/LTA processing (Equations (3)–(7)).
Sustainability 12 03665 g001
Figure 2. Four waveforms with different qualities. (a) The waveform of particularly poor quality, (b) the waveform of poor quality, (c) the waveform of general quality, and (d) the waveform of good quality.
Sustainability 12 03665 g002
Figure 3. The flowchart of the proposed method.
Sustainability 12 03665 g003
Figure 4. Network layout (blue lower triangle) and the location results of 13 microseismic events. The results of the arrival-based method are indicated by a red circle. The results of the traditional stack-based method are indicated by a green circle. The results of the proposed method are indicated by a blue circle. (a) The view on XY plane, (b) the view on XZ plane, and (c) the view on YZ plane.
Sustainability 12 03665 g004
Figure 5. Waveforms and STA/LTA traces of Blasting event C (R1–R8). The first arrival time of the P wave calculated by the traditional stack-based method (blue line) and the proposed method (red line).
Sustainability 12 03665 g005
Figure 6. Comparison of location of blasting event C. Location result of the traditional stack-based method (a) and the proposed method (b) (stacking function matrix on XY, YZ, XZ plane).
Sustainability 12 03665 g006
Figure 7. Partially enlarged view of the waveforms of the blasting event C (R2–R4, R7). The first arrival time of the P wave calculated by the traditional stack-based method (blue line), the proposed method (red line), and the manual picking method (green line).
Sustainability 12 03665 g007
Figure 8. The spatial location errors of three methods for blasting events A, B, and C.
Sustainability 12 03665 g008
Figure 9. Add noise with SNR = −30 on the R3 channel of blast event A.
Sustainability 12 03665 g009
Figure 10. Noise with SNR = −35 is added to the R3 and R4 channels of the blast event A.
Sustainability 12 03665 g010
Figure 11. Spatial location errors of two experiments for blasting events A.
Sustainability 12 03665 g011
Table 1. Quality parameters of the four waveforms.
WaveformSNRADSADJW
a0.0550.8080.6980
b4.580.8810.7780.131
c3.260.9090.9220.217
d43.550.9890.9960.926
Table 2. Receiver coordinates.
X (m)Y (m)Z (m)
R131,412,305.054,719,700.62262.33
R231,412,276.884,719,851.50262.81
R331,412,353.564,719,801.24262.64
R431,412,269.134,719,959.10263.30
R531,412,330.524,719,701.52212.85
R631,412,251.404,719,830.41212.82
R731,412,397.384,719,898.55213.62
R831,412,255.824,719,988.82213.78
Table 3. The true positions and the location results of the three blasting events.
EventMethodX (m)Y (m)Z (m)Error (m)Time (s)
ATrue31,412,542.004,719,739.0072.00--
Arrival-based31,412,513.134,719,744.2385.7232.391
Stack-based31,412,536.784,719,738.2170.245.57207
Proposed31,412,542.254,719,739.0971.430.6334
BTrue31,412,518.004,719,840.00162.00--
Arrival-based31,412,477.414,719,841.09171.4341.691
Stack-based31,412,518.544,719,834.69145.6717.18206
Proposed31,412,517.754,719,841.88164.753.3435
CTrue31,412,503.004,719,835.00153.00--
Arrival-based31,412,486.344,719,837.78152.8016.892
Stack-based31,412,493.104,719,823.7872.7981.60205
Proposed31,412,506.914,719,836.65154.604.5334
Table 4. Evaluation indicators of waveforms quality for three blasting events.
BlastingReceiverSNR n a ADS n b ADJ n c WW
AR126.830.600.991.000.951.000.77
R215.860.350.981.000.951.000.59
R317.450.390.910.830.930.830.53
R419.080.420.961.000.931.000.61
R546.181.001.001.000.981.001.00
R627.230.610.991.000.971.000.78
R734.500.770.991.000.971.000.88
R839.140.871.001.000.981.000.93
BR18.370.190.940.970.900.970.34
R29.080.200.930.900.920.900.38
R320.510.460.900.810.920.810.55
R48.530.190.810.450.830.450.12
R519.630.440.961.000.901.000.55
R620.130.450.991.000.951.000.67
R747.341.000.991.000.981.001.00
R834.540.770.991.000.981.000.88
CR115.360.340.971.000.940.960.57
R210.600.240.940.950.920.800.42
R331.210.690.920.900.951.000.79
R410.650.240.961.000.900.670.40
R522.060.490.951.000.930.840.64
R627.170.600.991.000.971.000.78
R748.021.000.991.000.961.001.00
R834.700.770.991.000.981.000.88
Table 5. Location results of these two experiments.
-ProposedStack-BasedArrival-Based
The First ExperimentX (m)31,412,54931,412,552.531,412,522.9
Y (m)4,719,7404,719,738.754,719,738.9
Z (m)74.0677.3782.63
Error (m)7.6611.7521.83
Time (s)342051
The Second ExperimentX (m)31,412,54831,412,542.831,412,564.5
Y (m)4,719,7444,719,745.984,719,737.38
Z (m)85.9292.4488.28
Error (m)15.8521.6127.79
Time (s)342051