1. Introduction
As a fundamental component of the water cycle, groundwater is of paramount importance in supporting human economic and social development. However, due to climate change and the influence of human activities, groundwater resources have been heavily depleted in many parts of the world. For example, in the USA, groundwater meets 75% of the municipal water demand and provides drinking water for more than half of the population [
1]. Due to their arid, semi-arid, and semi-humid climates, seventeen northern provinces in China regularly experience severe water shortages, failing to meet the water demand of industrial and agricultural production and domestic use [
2]. Since the 1970s, groundwater resources in this region have been widely exploited, with annual increases in groundwater withdrawals of 2.5 billion m
3 during the last 30 years. Consequently, over 100 groundwater depression cones have formed across an area of 150,000 km
2. The area of groundwater overdraft approaches 620,000 km
2 and approximately 60 cities have been categorized as seriously over-exploited [
3]. Groundwater overdraft has attracted considerable attention due to its harmful environmental and economic consequences, as well as its beneficial socioeconomic effects [
4]. The negative impacts of groundwater overdraft include uneconomic pumping conditions; water quality degradation via the intrusion of saline or poor-quality groundwater; flow reduction in streams, wetlands, and springs; land subsidence; interference with pre-existing water use and water rights; and a gradual depletion of groundwater storage [
5,
6]. Considering the magnitude of the problem and its consequences, groundwater overdraft issues have been extensively discussed and legal restrictions implemented.
Water governance has emerged as an important topic in the international arena and is acknowledged to be a crucial factor for adequate and sustained progress towards achieving sustainability [
7]. Early in 1980, the Groundwater Management Act resolved legal disputes over rights to groundwater, and established programs to reduce groundwater overdraft and the resulting water level declines in Arizona, which have had mixed success [
8]. Therefore, effective and comprehensive groundwater governance is very important to minimize the social, economic, and environmental effects of the problems derived from the groundwater overdraft. The concept of water governance was discussed and evolved widely and thoroughly in recent years, and it is clear that governance is a prerequisite for improving water management [
9]. Governance can be defined as “the process of decision-making and the process by which decisions are implemented (or not implemented)” [
10]. The World Bank report sets out the definition of good governance as the manner in which power is exercised in the management of a country’s economic and social resources for development [
11]. Jiménez et al. [
7] proposed a sustainable approach and structure of good governance, i.e., “Water governance is a combination of functions, performed with certain attributes, to achieve one or more desired outcomes, all shaped by the values and aspirations of individuals and organizations.” These different components are described in detail to construct an operational framework to improve water governance, achieving environmental, social, and economic goals. Ekardt et al. compared the command and control options with economic policy options, and the most effective policy (or governance) approach is identified in terms of peatlands [
12]. As groundwater always covers large areas, a key problem that cannot be ignored in practical management is the communication and resolution of conflicts between different regions and agents. Social capital is increasingly recognized as the key to both the successes and failures in natural resource management. López-Gunn [
13] focused on the social networks aspect of social capital, which is divided into three categories: bonding, bridging, and linking in groundwater governance of two neighboring aquifers in central Spain. López-Gunn [
13] concluded that careful institutional design can help foster strong ‘positive’ social capital, which, in turn, favors self-governance of groundwater. Focusing on the valuation of environmental services, de Castro Pardo et al. [
14] proposed a 5-stage methodology for multi-criteria analysis to assign priorities to ecosystem services in protected areas in terms of importance and vulnerability. The results show that conservation policies should be primarily directed towards lifecycle maintenance and water conditions. Sophocleous [
15] summarized several innovative management approaches in the eight high plains states of the USA as good examples for emulation in managing groundwater resources. However, fragmented and piecemeal institutional arrangements for managing the supplies and quality of water are inadequate to meet water challenges of the future. The formation of an interstate groundwater commission was recommended.
Current research on groundwater overdraft can be divided into five categories. Research has focused on the environmental, economic, and social impacts of groundwater overdraft. These studies offer solutions and methods to mitigate negative impacts associated with groundwater overdraft. For example, Zektser et al. [
16] compared several American case studies focused on four main impacts of groundwater extraction (streamflow reduction, reduction of vegetation, land subsidence, and seawater intrusion into coastal aquifers), proposing relevant methods to alleviate such impacts. Furthermore, Wolfgang [
17] concluded that lower water tables eventually culminate in environmental and ecological problems.
Secondly, previous studies have evaluated methods to determine the vulnerable degree and spatial distribution of groundwater overdraft. For example, Corwin et al. [
18] used index-based approaches to create maps based on geographic information systems (GIS), which can store, retrieve, organize, analyze, and present geographically referenced spatial data. Gogu et al. [
19] and Zwahlen [
20] present several recent vulnerability mapping methods. Index and overlay methods are based on the assumption that a few major parameters largely control groundwater vulnerability, where these parameters are known and can be evaluated. Furthermore, Basil et al. [
21] established a model to evaluate overdraft vulnerability using five factors (net recharge, pumping rate density, drawdown, aquifer thickness, and aquifer hydraulic conductivity) to analyze the controlling factors with help from GIS techniques.
Thirdly, studies have examined mitigation strategies to reduce groundwater overdraft, including policy-making and artificial recharge. For example, Kulkarni et al. [
22] proposed that governments should manage groundwater as a ”common pool” resource to realize efficient, equitable, and sustainable groundwater management. Research in this category postulates that society should respond to groundwater depletion by augmenting, conserving, and reallocating existing supplies [
23,
24]. Scott et al. [
25] suggested that agricultural electric power supply and electricity price policies are the drivers of groundwater exploitation, concluding that adjustments to these policies can significantly improve overdraft conditions. Furthermore, Cory et al. [
26] used a linear programming model to analyze variations in groundwater consumption and agricultural income to evaluate the performance of policies on restricting over-exploitation in the Phoenix Active Management Area. They found that an agricultural conservation program was of limited use to restore groundwater resources, whereas the abolition of agricultural lands has proven to be highly effective. In addition, Kimrey [
27] introduced a method of artificial groundwater recharge, finding it to be suitable for the management of groundwater overdraft.
The fourth research classification has focused on the development of models to optimize the conjunctive use of groundwater and surface water [
28]. For example, Harou et al. [
29] used a hydro-economic optimization model to study the economic effects and water management actions that accompany the end of overdraft. They illustrated that overdraft solutions often involve the entire water resource system because we must account for lost water supply. They found that the conjunctive use of surface and groundwater was the best strategy to stop overdraft with the least amount of increase in the water-scarcity cost. By contrast, MacEwan et al. [
30] found that the agricultural economy, groundwater, and surface water systems were the critical factors in the sustainable management of groundwater basins.
Research has also focused on socio-economic impacts in regions where groundwater resources have already been over-exploited. Harou et al. [
31] paid special attention to economic influences and proposed corresponding water resources management strategies. Furthermore, Davidsen et al. [
32] used a hydro-economic modeling approach to find cost-optimal sustainable surface water and groundwater allocation strategies for a river basin given an arbitrary initial groundwater level in the aquifer. To date, studies have mainly concentrated on the methods, such as policy-making or modeling, to help alleviate problems caused by groundwater overdraft. However, there is still a lack of knowledge as to whether these methods are actually considered to be successful.
Fifth, groundwater recharge and recovery were evaluated and analyzed by building a model [
33] and using relevant data, such as geo-processed spatial and climatological data [
34]. Scanlon et al. [
35] presented a comprehensive overview of the physical, chemical, and mathematical techniques for recharge estimation and water transfer during the infiltration process. These techniques are classified according to the zone to which they apply (surface, unsaturated, or saturated zone) and to their application scale, both spatial (local or regional scale) and temporal (short- or long-term). Demlie [
36] adopted two commonly applied groundwater recharge estimation techniques, i.e., the soil–water balance (SWB) and chloride mass balance (CMB) methods, to quantify and analyze groundwater recharge in the Akaki catchment, comparing the difference in the results between the two methods. Numerous studies have calculated the recharge rate of groundwater, suggesting that the results of groundwater recharge are significantly affected by precipitation and climate change [
37,
38]. However, studies have suggested that it is no longer appropriate to use a single recharge value for an entire watershed calculated as an assumed fraction of the average annual precipitation or as determined by model calibration [
39].
Considering the serious groundwater overdraft situation in northern China, the Hebei provincial government adopted various measures to comprehensively treat the groundwater over-exploitation situation in 2014 and 2015, mainly focused on two aspects: (1) increasing the supply of surface water by strengthening water conservancy construction projects to reduce the use of groundwater resources; and (2) adjusting the agricultural planting structure and promoting agronomy water-saving techniques to reduce overall water consumption. After these comprehensive treatments, the amplitude of the groundwater levels and the real exploitation volume of the groundwater were the issues of concern for government decision-makers, which were also regulated as the basis to determine the effect that governance has on groundwater. However, it remains that establishing a reasonable, scientific evaluation system is the key problem to be solved.
Compared with previous studies, our evaluation of groundwater overdraft governance measures has the following three characteristics:
- (1)
Data availability is limited. There is no long-term observation data and no observation data from the surrounding area for influential factors, such as rainfall timing, intensity, and quantity; antecedent soil moisture conditions; properties of the soil and sediment; thickness of the unsaturated zone; or types of vegetation. All of these influence the soil moisture content and water table datum.
- (2)
The change in regional groundwater levels is not gradual; rather it is a process of sudden increase due to governmental intervention. Therefore, it is difficult to apply many of the existing models. For example, precipitation is commonly set as an important parameter in many models, but there was no significant change in precipitation that affected the parameters used in this study. Rather, it was administrative measures that caused influential changes in the groundwater levels.
- (3)
The accuracy of our results requires a quantitative analysis and evaluation of the overdraft effect, as opposed to simply calculating a groundwater recharge rate.
Therefore, the common groundwater recharge analysis model was not appropriate for this study. Instead, a field test was designed to facilitate the development of a new quantitative analysis evaluation system based on the available data. This method considers the precipitation process, crop water requirements, water conservancy facilities construction, crop structure adjustments, and other factors, therefore more effectively assessing the effect of governmental overdraft measures. Moreover, based on this analysis of water-saving data, we can offer the potential for the replication of different overdraft governance measures and provide a useful reference for other groundwater overdraft regions.
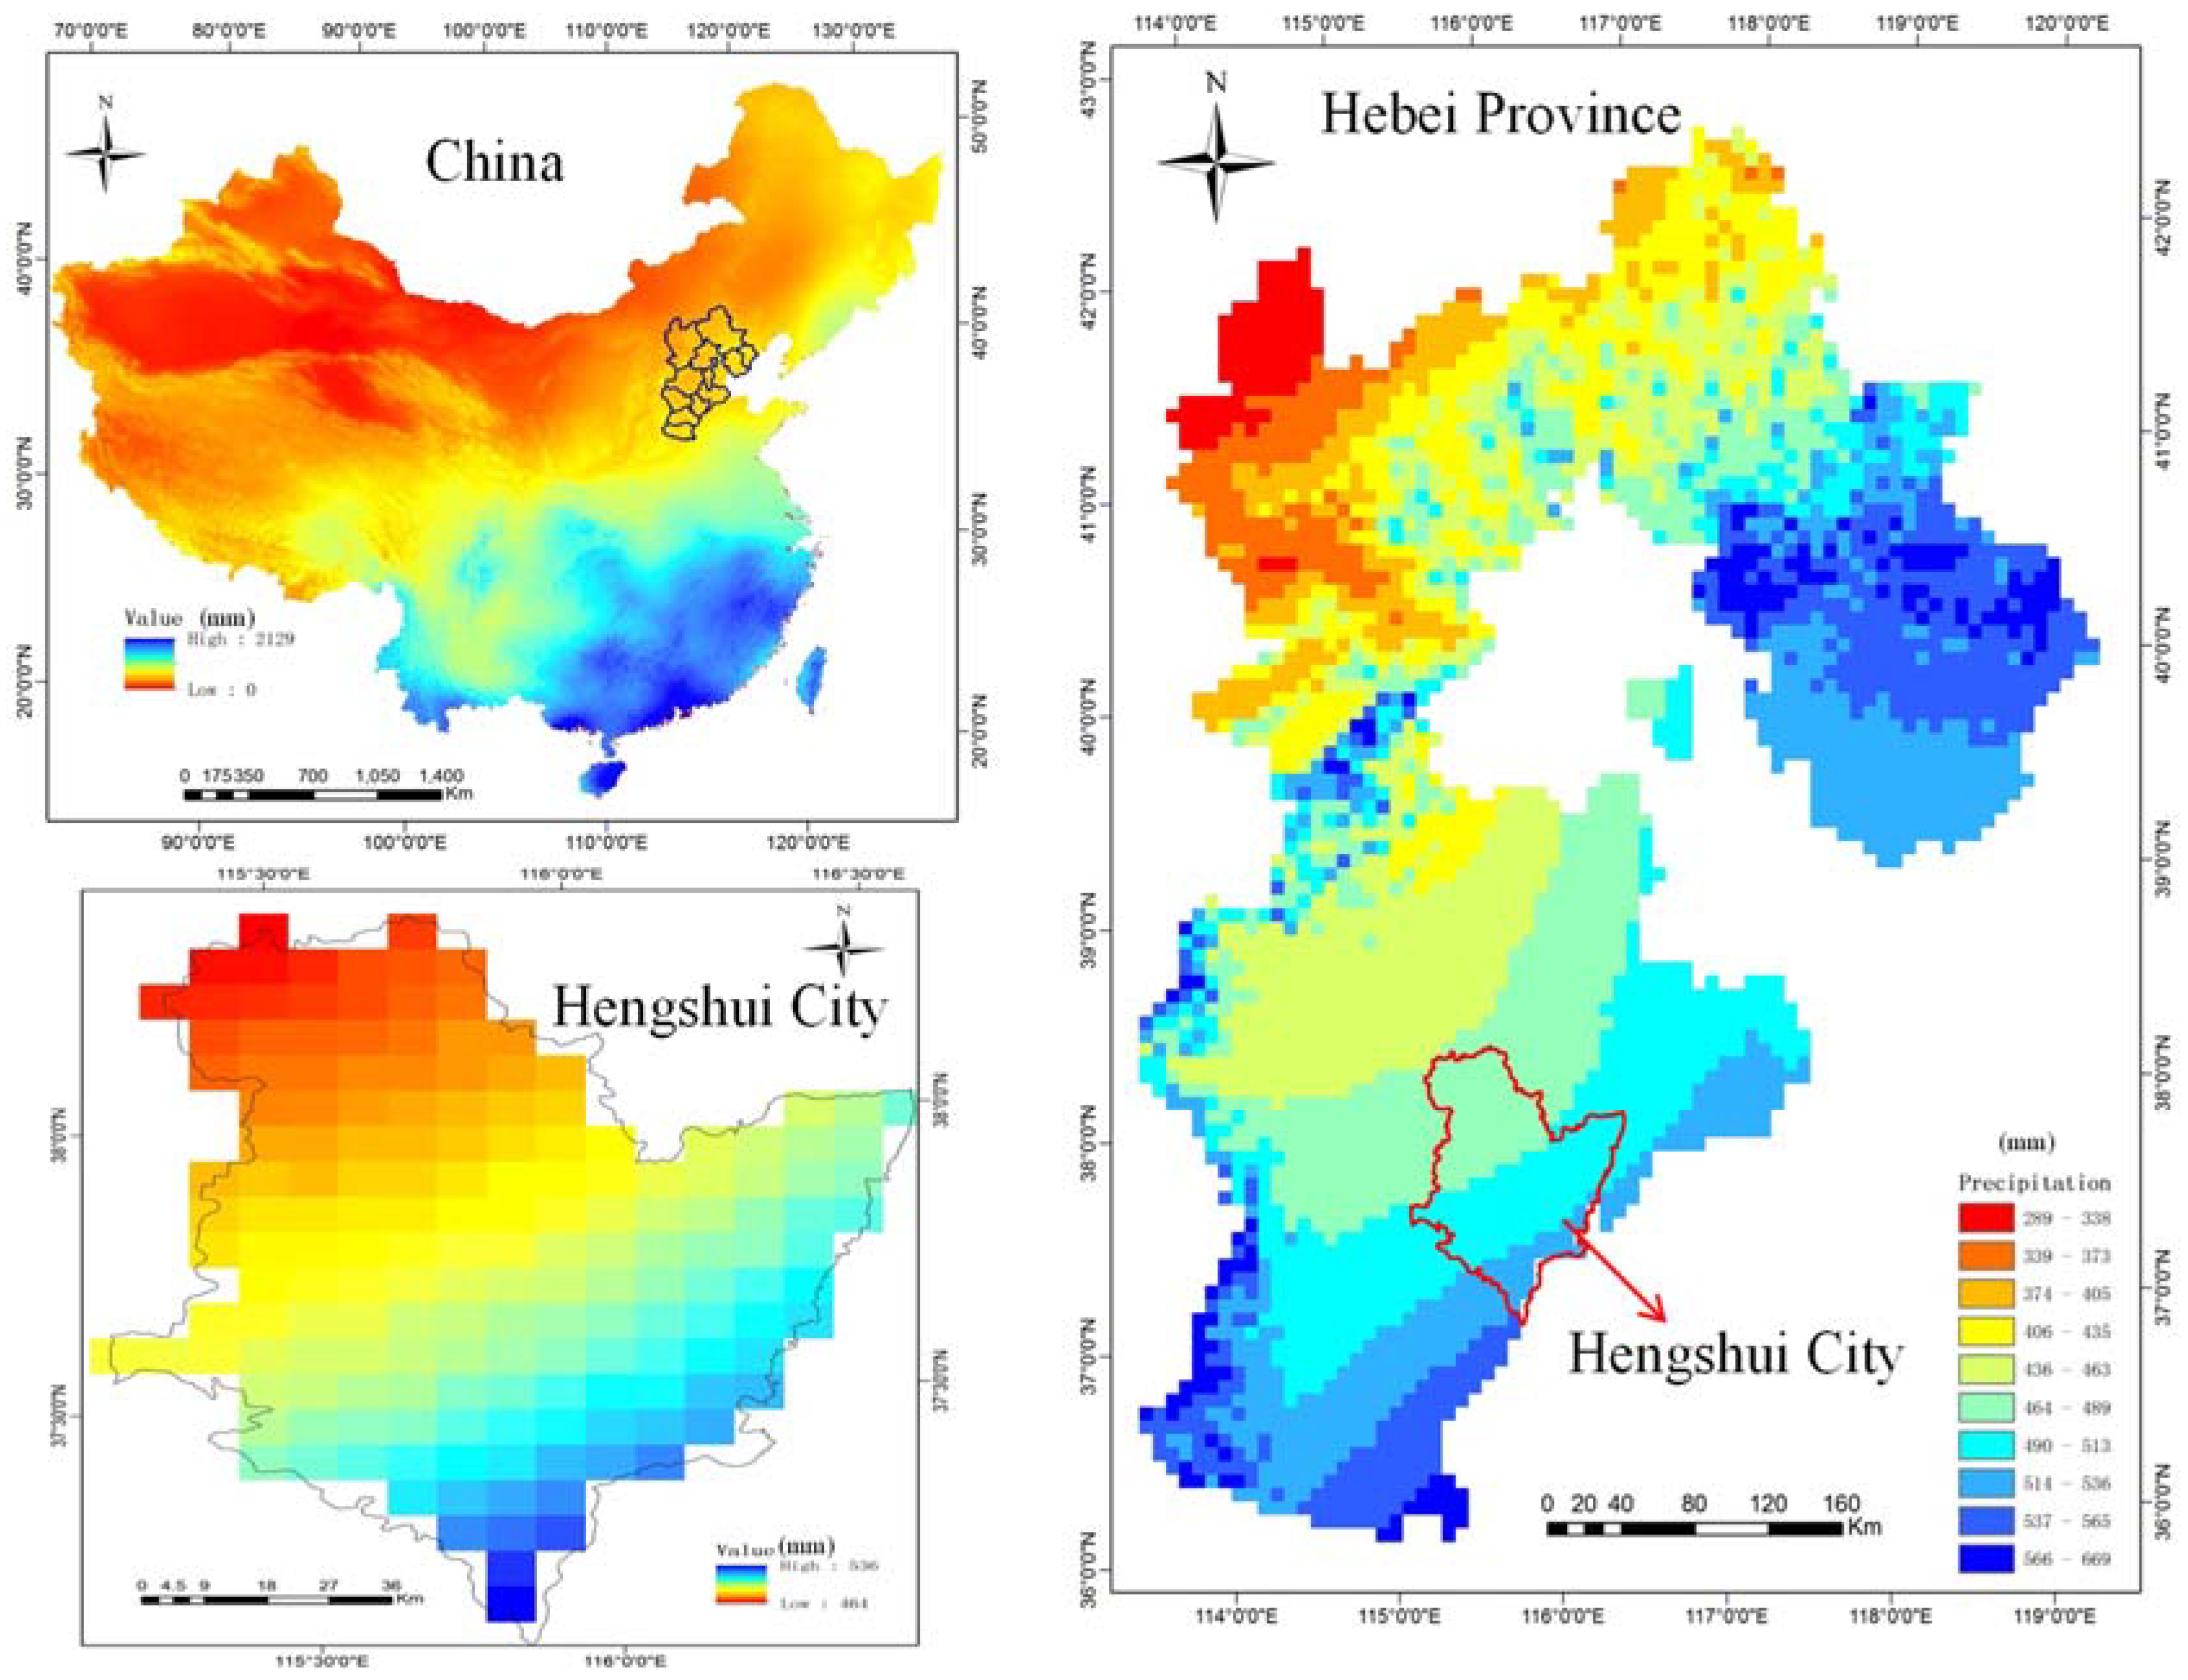
2. Study Area
Situated in the Heilonggang River basin in the Hebei Province, Hengshui City covers an area of 8815 km
2 and has jurisdiction of over 11 counties, 114 towns, and 4994 villages with a total population of 4.5 million (
Figure 1). Critically short of water, the city possesses water resources of 613 million m
3 (148 m
3 per capita or 76 m
3 per “mu,” which is a unit of area in China equal to 0.0667 hectares), whereas the total water consumption reaches 1740 million m
3. Due to natural conditions and increasing socioeconomic water demand, Hengshui City depends heavily on reducing the ecological water demand and over-exploiting groundwater (800 to 1000 million m
3 per year). The city experienced the first regional groundwater depression cone in the North China Plain, the most excessive pumping of groundwater, and the largest area of water over-exploitation (
Figure 2). Following the construction of motor-driven wells in 1969, groundwater overdraft in Hengshui City has occurred for approximately half a century. The ensuing production, lifestyle, and ecological issues can be described as “three drops and one rise,” which indicates ground subsidence followed by a decline in the static water level, decreased water output from motor-driven wells, and increased water cost. In summary, ongoing and large-scale groundwater overdraft in Hengshui City has resulted in a sequence of geological disasters and significant impacts on socioeconomic development and environmental protection. The Number 1 Central Document of 2014 clearly asks for “piloting the rehabilitation of agricultural resources” and points out that pilot projects must be carried out for the comprehensive governance of groundwater overdraft funnel areas throughout the North China Plain. Simultaneously, compensation measures must be implemented to guarantee the overall income level of farmers in these areas.
Based on these policies, the Ministry of Finance has worked with the Ministry of Water Resources, Agriculture and Rural Affairs, and Natural Resources to implement comprehensive governance projects for groundwater overdraft in Hebei Province from 2014. Hengshui City was selected as one of the first pilot cities to carry out these governance projects.
2.1. Governance Measures
Pilot areas in Hengshui City cover eleven districts and counties, including Taocheng District, Jizhou City, Shenzhou City, Raoyang County, Wuqiang County, Fucheng County, Wuyi County, Jing County, Zaoqiang County, and Gucheng County. Considering the actual water use conditions of these districts and counties, three water-saving measures were implemented [
40]:
- (1)
Planting structure adjustments and the promotion of agronomy water-saving techniques. In seriously over-exploited areas, planting structure adjustments and agronomy water-saving techniques were applied to 87,000 mu and 1,870,200 mu, respectively. Additionally, 50,000 mu of farming land was converted into non-agricultural crops. These measures aimed to save 115 million m3 of groundwater annually.
- (2)
Strengthening of hydraulic engineering construction. A series of water conservancy projects from water sources to the field were planned and implemented, including water diversion, extraction, storage, and irrigation projects, to optimize water source structure and effectively use local and external water. The governed irrigation area was 863,200 mu (including 86,800 mu of high-efficiency water-saving irrigation area). These measures were expected to save 69.29 million m3 of groundwater annually.
- (3)
Innovative management mechanisms. Market methods were combined with government regulation to inspire innovation from the public and improve the comprehensive reform of agricultural water pricing, farmland water rights systems, project operation management, and the adoption of policies and regulations.
2.2. Expected Goals
During 2015, planting structure adjustments in pilot areas were expected to decrease groundwater overdraft by 191 million m
3. Through the implementation of the over-exploitation governance plan in the South-North Water Transfer Project, the decrease in groundwater overdraft in terms of industrial and domestic consumption was projected to be 70 million m
3. The overall reduction target was 261 million m
3 (
Table 1). The total area of planting structure adjustments and agronomy water-saving techniques was 2.007 million mu (
Table 2).
Hebei Province proposed that by 2017, with the exception of domestic use, the exploitation of deep confined water must be abolished in surface water coverage areas and fallow lands. Furthermore, by 2020, groundwater extraction and recharge processes should be balanced, such that the central water levels in groundwater funnel regions should experience a significant increase. Simultaneously, there should be significant improvements to the ecological environment of the groundwater system.
As listed in
Table 1, Hengshui City has adopted seven strategies for groundwater overdraft treatment, with a list of the expected outcome for each strategy. We can observe that the strategy that has saved the largest amount of water is the adjusting planting structure and promoting agronomy water-saving techniques. The actual implementation can be divided into five specific strategies, as listed in
Table 2, where the application area for each strategy is clarified.
The high-efficiency use of groundwater, surface water, external water, and slightly brackish water refers to dredging and connecting rivers, constructing high-standard pipe irrigation systems in fields, and prohibiting groundwater exploitation in restricted areas to optimize the water resources structure and reduce the waste of water resources during transportation and storage. Water-saving via management mainly adopts a ladder water price policy to strengthen the water fee collection, thus avoiding waste. Additional urban overdraft governance indicates the use of a South-to-North water diversion and other external water resources to replace the collection of urban water from groundwater.
2.3. Data Sources
Data were collected via reference materials, field surveys, and well testing. Data include field test results in terms of water output per kWh at 79 single wells, groundwater levels in each region, precipitation data from 10 meteorological stations, 2016 planting structure data, monthly electricity consumption data at all irrigation wells during 2016, annual power consumption for agricultural irrigation since 2011, and project plans and their outcomes in pilot districts and counties. These data were provided by the water resources bureau of Hengshui City, except for the field test data.
4. Results
4.1. Implementation of Overdraft Governance Measures
Table 3 lists the outcomes of the overdraft governance measures during 2015. These results show that the expected goals have generally been achieved. The total expected area of agricultural overdraft governance measures is 2.007 million mu while the actual area is 2.0068 million mu, with a completion ratio of 99.99%.
Surface water irrigation projects were mainly comprised of the South-to-North Water Diversion Project and the surface water irrigation project in the Shijin Irrigation District, including the construction of the canal system, field projects, and water storage projects for pits and ponds. The actual governance area for this method was 692,100 mu and the completion ratio reached 100.35%. The scale of high-efficiency water-saving construction projects in well irrigation districts was 75,600 mu. The planned governance result was 5,673,300 m3, where 100% of this goal was achieved.
4.2. Accounting and Conversion Calculation of Actual Agricultural Groundwater Consumption
A total of 79 agricultural motor-driven irrigation wells in 11 counties and districts of Hengshui City were selected for a monthly power consumption analysis, including 64 confined water wells and 15 unconfined water wells (
Figure 6). In the process of selecting the experimental wells, we focused on the existing and working wells with stable crops and reliable electricity consumption data in the past ten years, covering as many areas as possible where groundwater overdraft measures were taken. Confined and unconfined water wells were selected respectively to observe the influence that depth has on single-well output per kWh.
Figure 7 shows the fitted results of the measured values. Groundwater depth is an influential factor that determines the output efficiency of the irrigation wells as output per kWh decreases with groundwater depth. Based on irrigation well output data and crop type,
Table 4 lists the average groundwater consumption per mu in Taocheng District. The results of the other areas are not listed in detail. Specifically, the total water consumption during the growing season of a crop in a typical area can be obtained using the measured amount of groundwater extraction per kWh in a single well and data for irrigation electricity consumption in a typical area, which is then divided by the planting area of such crops in the typical area, such that we can obtain the water consumption per mu of each crop in the typical area. It should be noted here that the irrigation data for each crop refers to the consumption of electricity during the growth period. For example, the consumption of electricity for corn refers to the consumption of electricity from July to September.
4.3. Overdraft Governance Performance
The actual groundwater exploitation in Hengshui City during the pre-governance base year was 532.10 million m
3 while the actual exploitation during the assessment base year was 418.18 million m
3, a decrease of 113.92 million m
3. Groundwater exploitation under normal precipitation conditions was 646.14 and 458.19 million m
3 during 2013 and 2016, respectively. Overdraft governance measures saved 187.95 million m
3, including 100.84 million m
3 (53.7%) in agriculture, 78.45 million m
3 (41.7%) in hydraulic projects, and 8.66 million m
3 (4.6%) in forestry projects (
Table 5 and
Table 6).
One goal of the Hebei Province comprehensive overdraft governance was to supply the industrial and domestic water demand of Hengshui City using the Project of South Water to North, contributing 70 million m3 to the overdraft governance target. However, project delays meant that only the Zaoqiang and Shenzhou districts (23.92 million m3 and 68,000 m3, respectively) were able to use the water from the project to satisfy industrial and domestic water consumption. Hence, overdraft governance resulted in an industrial and domestic groundwater savings of only 23.99 million m3.
As listed in
Table 6, according to the data on the governance capacity per mu, the three overdraft governance measures with the highest efficiency were (1) non-agricultural crops replacement (forestry), (2) planting pattern adjustments, and (3) the integration of water and fertilizer-vegetable. The amount of groundwater saved per mu is the largest of these measures, which can be considered and promoted in future measures. However, considering the area and total governance capacity, spring irrigation of wheat and replacement by surface water are the two most important water-saving measures, which are required to further strengthen the management and implementation effect.
The overdraft governance target of Hengshui City for agriculture was 191 million m3. Actual savings were 187.95 million m3, 98.4% of the expected outcome. Furthermore, the governance target for industrial and domestic consumption was 70 million m3. Actual savings were 23.99 million m3, 34.3% of the expected target.
4.4. Change in Confined Groundwater Levels
The impact that overdraft governance has on groundwater levels can be determined by measuring the depth of confined groundwater in each county.
Table 7 lists the groundwater depth and corresponding changes for nine counties at the end of 2014, 2015, and 2016. Groundwater levels in most counties have risen based on
Table 7. The cumulative average variation in groundwater depth in Hengshui City for this time period was −8.37 m.
4.5. Major Factors Affecting Overdraft Governance Performance
The average annual precipitation in Hengshui City between 1965 and 2013 was 485 mm. During the main wheat irrigation period (March to May), the average precipitation is 62 mm. By contrast, during the corn irrigation period (June to September), which is also the flood season, the average precipitation is 378 mm. During 2013, the annual precipitation (632 mm) was markedly higher as compared to the historical average, such that we consider that this was a wet year. The annual precipitation in 2015 and 2016 was 531 and 536 mm, respectively, both of which are considered to be normal-wet years. These rainfall characteristics were beneficial to the restoration of groundwater levels in 2016.
During 2016, Hengshui City planned to replace 61.80 million m3 of groundwater using surface water for agricultural irrigation. However, the actual diverted volume of surface water used in agriculture was much higher (258.31 million m3). This surface water provided significant support in realizing the overdraft governance target. Furthermore, an estimated 70 million m3 of water from the South-to-North Water Diversion Project was used for urban overdraft governance. However, project delays meant that only 23.99 million m3 of water was drawn from the South-to-North Water Diversion Project, adversely impacting the achievement of the urban overdraft governance target.
Crop planting structure is impacted by fluctuations in agricultural product market prices, especially in non-pilot areas. In recent years, the market prices of wheat and corn have increased while the price of cotton, a drought-tolerant crop with small irrigation demands, has declined sharply. Consequently, farmers have switched their interests to wheat and corn, which have higher irrigation demands. During 2016, the planting area of cotton in the pilot areas of Hengshui City was reduced by 770,000 mu, a decline of 80,000 mu as compared to 2015. This shift resulted in intense pressure on agricultural irrigation. Despite all the water-saving measures introduced in the pilot regions, shifts in the crop planting structure still imparted a negative influence on groundwater overdraft.
5. Discussion and Conclusions
The long-term use of ecological water and groundwater over-exploitation is necessary in Hengshui City to ensure ongoing socioeconomic development. To optimize the use and management of water resources and alleviate the impact of this ongoing overdraft, the region has adopted three major measures: agricultural planting structure adjustments and the promotion of agronomy water-saving techniques, strengthening of hydraulic engineering construction, and innovative management mechanisms. Field surveys showed that all measures were well implemented and that expected outcomes were generally achieved. Using accounting and conversion calculations based on power consumption under normal precipitation conditions, agricultural groundwater exploitation and overdraft governance results were determined. Agricultural groundwater overdraft was reduced by 188 million m3, which was 98.4% of the target goal. Among the groundwater overdraft governance measures, the most efficient three were (1) non-agricultural crops replacement (forestry), (2) planting pattern adjustments, and (3) the integration of water and fertilizer-vegetable. The implementation of these three measures should be enhanced in future governance. However, considering the area and total governance capacity, spring irrigation of wheat and replacement by surface water are the two most important water-saving measures, which are required to further strengthen the management and implementation effect. As compared to 2015, confined groundwater levels around Hengshui City during 2016 tended to rebound, with an average rise of 4.92 m. The largest rebound in groundwater depth occurred at Wuyi County and Jizhou City, where groundwater levels increased by 6.29 and 6.63 m, respectively. As compared to 2014, the average groundwater levels around Hengshui City rose by 8.37 m. These data indicate that there is a general recharge in the confined groundwater in the major parts of the pilot areas.
Ongoing groundwater over-exploitation has resulted in constant declines in groundwater levels, which cannot be restored within a short period. Considering the hysteretic nature of the groundwater response to recharge, groundwater recovery will be a slow process. Declines will likely slow and reach a balanced state, followed by a gradual rebound. This lag period is a natural scientific phenomenon and, therefore, governance and restoration measures will need to be in effect over an extended period to have a lasting impact on groundwater resources.
Pilot areas for overdraft governance comprise only a small part of Hengshui City. Consequently, there is a limited impact in terms of these governance measures on the groundwater levels of the entire city. Groundwater levels in non-pilot areas will be gradually impacted by variations in pilot areas, but their influence will be slight. If over-exploitation continues in non-pilot areas, then groundwater levels in pilot areas may be deleteriously impacted. Therefore, the governance of groundwater overdraft must be performed continuously for a long period.
Based on the measurable success of current governance measures, further groundwater comprehensive governance is warranted. Specific proposals could be as follows: (1) we must pay significantly more attention to the selection of projects that should be easy to implement in practice. During the investigation, we found that micro-sprinkling irrigation and the integration of water and fertilizer were not widely accepted by farmers. (2) At present, the governance measures include one-year effect measures, such as planting pattern adjustments, thirty-year effect measures, such as a surface water replacement project, and long-term institutional mechanisms construction. We suggest that future governance should focus more on long-term benefit projects. (3) We must strengthen the measurement of groundwater consumption, evaluate the performance of different governance measures in different regions, promote the establishment of dual control systems for groundwater levels, and regularly report the impact of these measures to the public. Based on these proposals, the measures are more likely to receive community support. (4) Measures should speed up the replacement of external water sources (such as the use of water from the South-to-North Water Diversion Project) and reduce the amount of groundwater extracted from urban industries and households. (5) Based on ensuring food security, a red line for the planting area of crops with high irrigation demand, such as wheat, should be established to prevent the excessive consumption of water resources.

 ,
, 


