1. Introduction
Although gender equality represents a fundamental human right, many studies show that today women are not treated equally with men in their households, local communities, or at their workplace. Statistics show that, globally, women perform around 30%–35% of the total work hours, yet they receive only around 10% of the world’s total net wages [
1]. Women are underrepresented in power and in decision-making roles. They receive unequal pay for equal work and they continue to be targets of physical and mental abuse.
The UN’s Sustainable Development Goals (SDGs) [
2] underscore women’s empowerment as an important development objective, in and of itself, and highlight the relevance of gender equality to addressing a wide range of global challenges. This report is based on the five main SDG objectives that the 2016 Sustainable Stock Exchanges (SSE) Report on Progress emphasized as being in the area that financial exchanges are capable to influence, and further analyses the contribution that these important entities can bring to the goals of sustainable development: enabling women to fully and effectively participate, and have similar opportunities with men for leadership, in all areas and at all levels where decisions are made, regarding politics, economy, or the public agenda, and other gender-equality targets related to the other sixteen SDGs.
Sustainability (sustainable development) is not a new concept. In Greek and Roman philosophy, there are reflections on the relationship between human activities and ecosystems. But the concept of sustainable development has been gradually built during the last three decades of the twentieth century. Thus, in 1987, the World Commission on Environment and Development (WCED) published the report “Our Common Future” [
3], offering further details regarding what sustainable development includes, referring especially to the items related to people’s relations with the environment and the responsibilities that present generations have to future generations. Knowledge sharing and capacity building are fundamental for the new ecosystem, in order to contribute to economic development. A strategic alignment, both at the macroeconomic and microeconomic level, will offer the convergence necessary for a strategic change.
Environmental, social, and governance (ESG) principles are increasingly used by investors when choosing their investments [
4]. ESG criteria are also found to be helpful for investors that try to stay away from companies that, looking forward, could find themselves in significant financial risk because of a lack of preoccupation with their environmental, governmental, or social impact. Integrating climate, environmental, and social sustainability factors into financial markets and systems requires time, vision, and efforts. It also needs strong contributions from all stakeholders.
Gender diversity is an important part of ESG goals, is relevant for every community, and should be an imperative for each organization and business. For companies, a policy geared towards gender inclusion generates a positive and favorable work environment which facilitates increases in productivity due to better collaboration between employees and supports a climate more prone to innovation, one that fosters better business performance in general.
During the last few years, the public agenda has radically changed, and its main themes are more geared towards the ESG goals. Thus, it has become more relevant for a company to prove its dedication to alleviating gender inequality in the workplace. This reflects also on investors’ agendas, which are increasingly adapted to the priorities of the communities and no longer only focused on optimizing the risk/return relationship. This is why not only employees, but also investors, stakeholders, and regulators, have become interested in how a listed company is performing in relation to global ESG goals, particularly in respect to gender equality aspiration.
In this context, our paper investigates the behavior of returns for three well-diversified gender equality indices in comparison with relevant overall market indices. Our study uses both cross-sectoral indices and financial sector indices, to see whether there are specific characteristics for the gender equality indices that sets them apart from the overall market. We focus mainly on the first two moments of the distribution of returns, namely mean and standard deviation, and on the correlations among indices. In order to do this, we model conditional volatilities and correlations using Exponential Generalized Autoregressive Conditional Heteroskedasticity (EGARCH) and Dynamic Conditional Correlation Multivariate Generalized Autoregressive Conditional Heteroskedasticity (DCC MV GARCH), respectively, and we identify the alternation of volatility regimes using a Markov switching model. We also study correlations/slope coefficients among pairs of indices resulting from quantile regressions at different percentiles and a non-restricted vector autoregressive model.
According to the results that we have obtained from studying the behavior of daily returns for the period 1 January 2017 to 12 March 2020, there are no significant differences among the overall indices and the gender equality indices in what regards the average return and conditional volatility. Also, the dynamic conditional correlations and the slope coefficients at different quantiles are very close to 1, indicating practically a similar evolution for the daily returns of the gender equality indices and the overall indices.
Gender diversity represents a new trend, influencing the literature, research studies, financial markets, investor behavior, and the real economy.
In order to be able to accurately assess how different organizations perform in relation to gender equality, investors should have good access to relevant data. Stock exchanges have the ability to enhance investors’ access to information by improving the reporting requirements for issuers both in terms of quality and quantity, and including more in these requirements data on topics related to gender equality. By enhancing disclosure, the exchanges and the issuers allow investors of all kind, and especially large institutional investors, to manager risk more efficiently and effectively and to be better informed when making decisions regarding their portfolio composition [
1].
Prior to the last 15–20 years, very few authors considered ESG-related information and variables when assessing factors that contribute to the performance and resilience of companies. The classic approach was to rely mainly on financial indicators related to a company’s balance sheet and profit and loss accounts. Such approaches are still valid and useful today, as recent studies show. Valaskova et al. [
5] concluded that such indicators (i.e., return ratios, liquidity ratios, indebtedness, turnover etc.) still represent the most significant predictors of profitability and prosperity for Slovak companies. Also, Kovacova et al. [
6] analyzed the effectiveness of over 100 bankruptcy models developed in Visegrad countries using cluster and correspondence analysis, and argued that such variables continue to have significant explanatory power with regard to the performance of companies (in this case, more specifically, their capacity to avoid failure), despite the fact that the set of most relevant variables might be different from one country to another. In accordance with these findings, Kliestik et al. [
7] propose a new bankruptcy model that takes into account the legal and business particularities of the Slovak economy, arguing that this approach outperforms the conventional tools, having a higher sensitivity to the deterioration of the financial solidity of companies.
During the last couple of decades, many authors have argued that companies’ stances related to gender diversity are relevant for their profitability and, indirectly, for the results of those investing in the securities that they issue, thus significantly expanding the set of variables used in assessing the performance of the companies. As an example, Morgan Stanley have collected data related to this topic from many public companies in different markets, creating a proprietary database and framework that includes more than 1600 listed equities. The results of their research argue that companies that are more gender diverse perform at similar levels with others but show lower volatility, a finding which has important implications for portfolio managers and corporate boards of directors. [
8].
The results from a study using a sample of French firms between 2002 and 2012, listed on the Paris Stock Exchange, show that stock market liquidity is positively and significantly associated with the presence of women directors. It was found that investors’ decisions vary according to their positions in the board: women independent members decrease illiquidity costs, while the presence of female inside directors increases daily trading volume. In addition, inside women increases the firm’s ability to implement better strategies that cope with economic, social, and environmental constraints, which leads investors to react positively. Surprisingly, the presence of female independent directors reduces company involvement in sustainable development projects [
9].
Increasing the representation of women in boardrooms could enhance corporate reputation and increase both financial and social performance [
10,
11]. For instance, Boulouta [
10] and Bear et al. [
12] found a significant and positive effect of women directors on corporate social responsibility (CSR) and CSR ratings. Díaz-García et al. [
13], Galia and Zenou [
14], and Nielsen et al. [
15] also show the positive effect of gender diversity on innovation, even on radical innovations, which are usually perceived as a male-controlled arena.
Gender diversity on boards could be considered as a substitute mechanism for governance in poorly governed firms. One plausible reason is that women directors are tough controllers: they are tempted to set up better monitoring and increase public and private disclosure [
16].
According to some studies, the presence of women in boardrooms could be viewed as a signal made by the firm to investors of better competence, financial and social performance, and career evolution [
17]. Furthermore, women directors most often bring new resources to the firm which may enhance the corporate public image and reputation in the stock market [
18].
Kirkpatrick [
19] emphasizes that the “failures and weaknesses in corporate governance arrangements which did not serve their purpose to safeguard against excessive risk taking in a number of financial services companies were significantly contributing to the financial crisis”.
Taking as a starting point previous studies in governance (e.g., Caprio, Laeven and Levine [
20]), the analysis performed by Adams and Mehran [
21] employ a sample of banking data over 34 years to examine the relationship between banks’ board structure and performance. The results indicate that board independence has no influence on bank performance. Other studies on bank performance (e.g., Hermalin and Weisbach [
22]) emphasize that “board composition does not seem to predict corporate performance, while board size has a negative relationship to performance.”
An inverted relation between bank performance and board size and between the proportion of non-executive directors and performance is found by De Andres and Vallelado [
23]. Their results show that a “bank’s board composition and size are related to directors’ ability to monitor and advise management and that a larger and not excessively independent board might prove more efficient in monitoring and advising functions, and create more value”. The authors also point out that in an environment characterized by limited competition, tight regulation, and higher informational asymmetries, banks’ boards become an important mechanism for corporate governance, as their specialized knowledge of the banking business and specific risks enables them to better design banking business conduct and monitor executive managers.
Pathan and Faff [
24] studied whether specific features of board structure (in terms of the total number of members, the number of independent members, and gender equality) exhibited by large US banks and/or their holding companies are able to determine bank performance. The study concludes that both the total number of board members and the number of independent members are negatively related with bank performance, while better gender diversity is linked with improved financial performance.
Another research paper by Pathan and Skully [
25] that examines the trends of boards of directors (board size, composition, and CEO duality) for a sample of 212 US bank holding companies emphasizes that board size recorded a decreasing trend over the time period considered for large and medium-sized banks, while it remained relatively stable for small banks.
Empirical studies of investors’ reactions to the appointment of women directors are still rare. Lee and James [
26] test stock price reactions to the announcements of female and male CEOs. They conclude that investors’ reactions are significantly more negative to the announcements of female CEOs than those of male CEOs. However, they are more significant and positive when women CEOs have been promoted from within the firm than from outside the firm. Similarly, Bharath et al. [
27] focus on the insider trading behavior of senior corporate executives. Despite both female and male executives making positive profits, female members earn less than their male counterparts. In fact, market responses, in the short term, are driven by the stereotype that female executives are less informed about future corporate performance than males. In addition, gender bias may exist among institutional shareholders and could lead to a decrease in stock price even when gender diversity on boards has no effect on profits. One explanation is that non-block institutional investors may sell stocks of firms with gender-diverse boards (Dobbin and Jung [
28]).
Post-2008 financial crisis research studies are trying to identify the influence of banks’ governance structures on the main indicators related to the capital of the bank, and their contribution to systemic risk through individual risk-taking. Angeloni [
29] mentions that “the relations between capital levels, risk and governance become more complex”. This approach allows for a dynamic analysis of other prudential standards (on liquidity, credit allocation and provisioning, and distribution of resources) whose accomplishment is subordinated to supporting and preserving banks’ solvency, capital being considered a core measure of a bank’s solvency.
By conducting a first panel regression analysis, Boitan and Niţescu [
30] document that larger boards and increased gender diversity negatively contribute to increases in managerial efficiency, although the influence exerted is small. The effect of increasing the number of independent directors appointed to the board and the bank size is positively associated with the managerial efficiency of large banks. The authors challenge the general perception that increased gender diversity contribute to increased managerial efficiency.
As per IFM studies [
31], “just 18 percent of firms globally are led by women, and on average, only 22 percent of board members in OECD countries are women. There is even lower representation in emerging economies, such as India at 13 percent or 8 percent in Brazil. Progress has been slow to say the least”.
Another study conducted by IMF staff analyzes a sample of two million firms geographically dispersed over 34 European countries, and the results show that, in general, a higher level of gender diversity at the level of senior management is linked with better financial performance. More specifically, the IMF study concludes that replacing one male senior management position with a woman at the same level of management is linked with an increase of 8–13 basis points for the return on assets of the company.
Although progress on improving the gender diversity at the workplace is being made, the pace appears to be still very slow, and large gender gaps are still present when analyzing employment and income data. For example, data shows that the participation rate of woman in the workforce is on average 20% lower than the similar rate for men, at a global level. Also, quantitative research on legal systems across countries shows that woman only hold around three quarters of the legal rights that are afforded to men on matters related to, for example, property, inheritance, and access to financial services [
32,
33].
2. Materials and Methods
In this paper, our focus was to investigate whether investors’ behavior in relation to listed companies that promote gender equality was different in comparison with their approach towards the general market. Given the availability of gender equality indices at a cross-sectoral level, and specifically for the financial sector, we included both directions into our research, separately. In our endeavor, we employed different methods and models, trying to distinguish whether the computed performance/risk measures are statistically different for the gender equality indices in comparison with the ones for the overall indices. Because both the overall indices and the gender equality indices are well diversified, we argue that our results can be generalized.
In short, our aim is to study the behavior of gender equality indices’ returns in relation to the main market indices. Thus, we investigated the conditional volatility of the volatility regimes for the 11 indices using EGARCH and Markov regime switching models. We also computed conditional correlations among the relevant indices using a DCC MV GARCH model. Subsequently, we ran unrestricted and quantile regressions where the dependent variables were the gender equality indices and the explanatory variables were the general market indices. We also calibrated an unrestricted vector autoregressive (VAR) model and tested the eventual causal relation between its components.
2.1. Sample
Our study used daily data during the period 1 January 2017–12 March 2020. We collected USD denominated prices for eight MSCI equity indices and three Bloomberg Gender Equality indices, respectively:
MSCI World (MXWO);
MSCI World Financials (MXWO0FN);
MSCI Europe (MXEU);
MSCI Europe Financials (MXEU0FN);
MSCI Asia Pacific (MXAP);
MSCI Asia Financials (MXAP0FN);
MSCI North America (MXNA);
MSCI North America Financials (MXNA0FN);
Bloomberg Gender Equality Index (BGEI);
Bloomberg GEI Financials (BGEIF);
Bloomberg GEI Excluding Financials (BGEIXF).
Thus, we have constructed a database composed of 11 time series of a daily frequency (prices and returns, respectively), each with 834 observations.
All MSCI indices used in our study are free-float weighted, including only companies from developed markets within the specific region for which the index was constructed.
The Bloomberg Gender Equality indices are modified capitalization-weighted indices that measure the price performance for listed global companies, which are recognized for periodically disclosing information and implementing policies and good practices related to gender equality. BGEI is a composite of BGEIF and BGEIXF. We used the 2020 version of the Bloomberg Gender Equality Index, which is composed of 325 companies from 11 sectors of economic activity, with a combined market capitalization of over USD 12 trillion, headquartered in 42 countries and regions. Prior to being included in the index, the companies should disclose specific information within a framework based on five dimensions, and their gender performance is assessed according to them. The five criteria are female leadership and talent pipeline, equal pay and gender pay parity, inclusive culture, pro-women brand, and anti-sexual harassment policies. Only the listed companies with a market capitalization over USD 1 billion that score above a globally established threshold, based on disclosure and best-in-class components, are included in the annual index.
2.2. Research Methodology
Step 1: preliminary data preparation and analysis
At the beginning, we stationarized all the 11 equity indices time series using the logarithmic transformation of prices into (continuously compounded) returns. Subsequently, we tested and confirmed the stationarity of each transformed time series using Augmented Dickey–Fuller and Philips–Perron unit root tests (see
Appendix A,
Table A1). The summary statistics for the time series are presented in
Table A2.
Step 2: estimating conditional volatilities for daily returns
We used our database of 11 time series to compute daily conditional volatilities. We did this for every time series. Because in the financial literature there are many studies confirming the asymmetry of the distributions of daily returns (particularly the negative skewness), we chose to use an EGARCH (1,1) model according with Tsay [
34], described by the equations below:
Subsequently, we tested and confirmed that the coefficients of every EGARCH (1,1) model that we calibrated for each of the 11 time series are significant.
Step 3: estimating conditional correlations for daily returns
Going further in our study, we estimated conditional correlations between MSCI WORLD and all the remaining ten equity indices. In order to do this, we chose a multivariate DCC GARCH model as described by Engle and Sheppard [
35] and Sheppard [
36]:
where Dt is a k × k diagonal matrix containing the time-varying standard deviations estimated using univariate GARCH models, with
found on the
ith diagonal, and
Rt represents the matrix with similar dimension containing the time varying correlations (at time
t).
The log-likelihood for the above estimator can be expressed as presented below:
where ε
t ~ N (0,
Rt) is the time series of the standardized residuals.
By expressing the components of the
Dt matrix as univariate GARCH (P,Q) processes as below, we find that:
According with these results, the structure of our dynamic correlation processes was:
where
represents the unconditional covariance for the time series of the standardized residuals that resulted from the initial estimation. Considering this, we note as
Q*t the diagonal matrix containing the square root of each element situated on the diagonal of the matrix
Qt.
In addition, the elements of Rt represent the values of the time-varying correlations among the pairs of time series of indices returns and can be expressed as: .
As we did previously in step two, described above, we subsequently tested and confirmed that the coefficients of every DCC MV-GARCH model that we estimated are significant.
Step 4: analyzing the volatility regimes of the indices’ daily returns
As previous studies also found (ex. Lupu [
37]), especially during negative shocks, there is a link between the correlation and volatility, as a form of contagion in a narrow definition. We were interested to see the level of intensity at which the gender equality indices exhibit this behavior. In order to do this, we investigated whether the volatility regimes of overall indices and gender equality indices were synchronized. We estimated a Markov Regime Switching model for each time series of indices’ returns, as proposed by Tsay [
34], Hamilton [
38,
39], and Perlin [
40]. The model’s output represents the probabilities of the time series being either in a high-volatility or in a low-volatility regime at each period, and are described by the equation below:
where N
S and N
nS represent the total number of the coefficients that are switching and non-switching, respectively;
is a subset of
and groups the independent variables with coefficients that do not switch;
is a subset grouping the variables with coefficients that switch; P(Φ) indicates the probability density function of the errors; and
Φ is the vector containing the values of the parameters of
P.
Similar to Badea et al. [
41], we labeled the volatility regimes at each period by transforming the time series of probabilities resulting from the model into the time series of volatility regimes. The labels were set as chronological binary values: 1 if the respective equity index was manifesting a high volatility and 0 if the volatility regime was a quiet one. As Badea et al. [
41] propose, the rules that we used to derive the values of 0 and 1 were the following:
- (a)
if the probability of being in a high-volatility regime > the probability of being in a low-volatility regime, the corresponding regime label is 1;
- (b)
if the probability of being in a high-volatility regime < the probability of being in a low-volatility regime, the corresponding regime label is 0.
Step 5: verifying the results from previous stages by two different methods: estimating the slope coefficients of simple linear quantile regressions at different percentiles and using unrestricted VAR models
We analyzed the results obtained according with the methods presented, looking for patterns to confirm whether the evolution of the performance/risk measures of the gender equality indices was different or not from the overall market indices.
Trying to validate our findings regarding the correlation between the gender equality indices and the overall market indices, we used two regression methods. We estimated simple quantile regressions where the dependent variables were the gender equality indices and the explanatory variables were the overall market indices, and we also estimated unrestricted VAR (2) models for the cross-sectoral indices and for the financial sector indices, separately.
As described in the literature on financial econometrics, linear regression describes the average linear relationship between a combination of explanatory variables and a dependent variable relying on the conditional mean expressed as E(y|x). Because this method only offers a partial explanation of the relationship, we were interested to investigate the values of the slope coefficients between the gender equality indices and the overall market indices at several percentiles of the conditional distribution of these series, and the quantile regression is one of the tools available to do this.
In a quantile regression we express the estimator for the quantile
q by minimizing the objective function described below:
In a similar approach with other previous studies (e.g., Hammoudeh et al. [
42] and Dekker et al. [
43]), we investigated the linkages between the gender equality indices and the overall market indices (separately for cross-sectoral and financial sector) using a vector autoregressive model. Because of the nature of our data, we preferred a simple unrestricted
k dimensional VAR(
p) model which can be described by the following equation:
where
is a
vector of endogenous variables,
is a
vector of exogenous variables,
are
matrices of lag coefficients to be estimated,
is a
matrix of exogenous coefficients to be estimated, and
is a
white noise innovation process.
The results of our calculations made according with the methods presented above are described and discussed in the following two sections of our paper.
3. Results
One of the first thing to notice after the initial data preparation performed in step one of our methodology described above was that the overall performance (return) for the entire period (1 January 2017—12 March 2020) for the gender equality indices was mixed and inconclusive in comparison with the MSCI World indices. Still, when studying the first two moments of the distribution of daily returns, we observe that the mean values of the distributions are similar and not statistically different from zero (see
Appendix A,
Table A2). Also, the standard deviation is larger in comparison with the mean, and all the series present significant negative skewness and excess kurtosis. Thus, from this point of view, none of them deviates from the general characteristics of high-frequency equity returns as they were described by Cont [
44]. In addition, we observe that the values of the fifth percentile of the distributions of daily returns (equivalent to 95% confidence level historical Value-at-Risk) are quite similar.
When comparing the distributions of daily conditional volatilities estimated using the EGARCH (1,1) model described in the
second stage of our methodology, we observe, however, some small but relevant differences (see
Figure 1):
the mean and median daily conditional volatility is in general higher for the gender equality indices in comparison with their correspondent overall MSCI Indices. This also holds true for the values of the 0.95 quantile;
the maximum and the minimum values (and, as a result, also the ranges) are comparable;
the gender equality indices exhibit lower skewness and excess kurtosis of the daily conditional volatilities in comparison with their correspondent MSCI indices, their distributions thus being a little closer to the shape of the normal distribution.
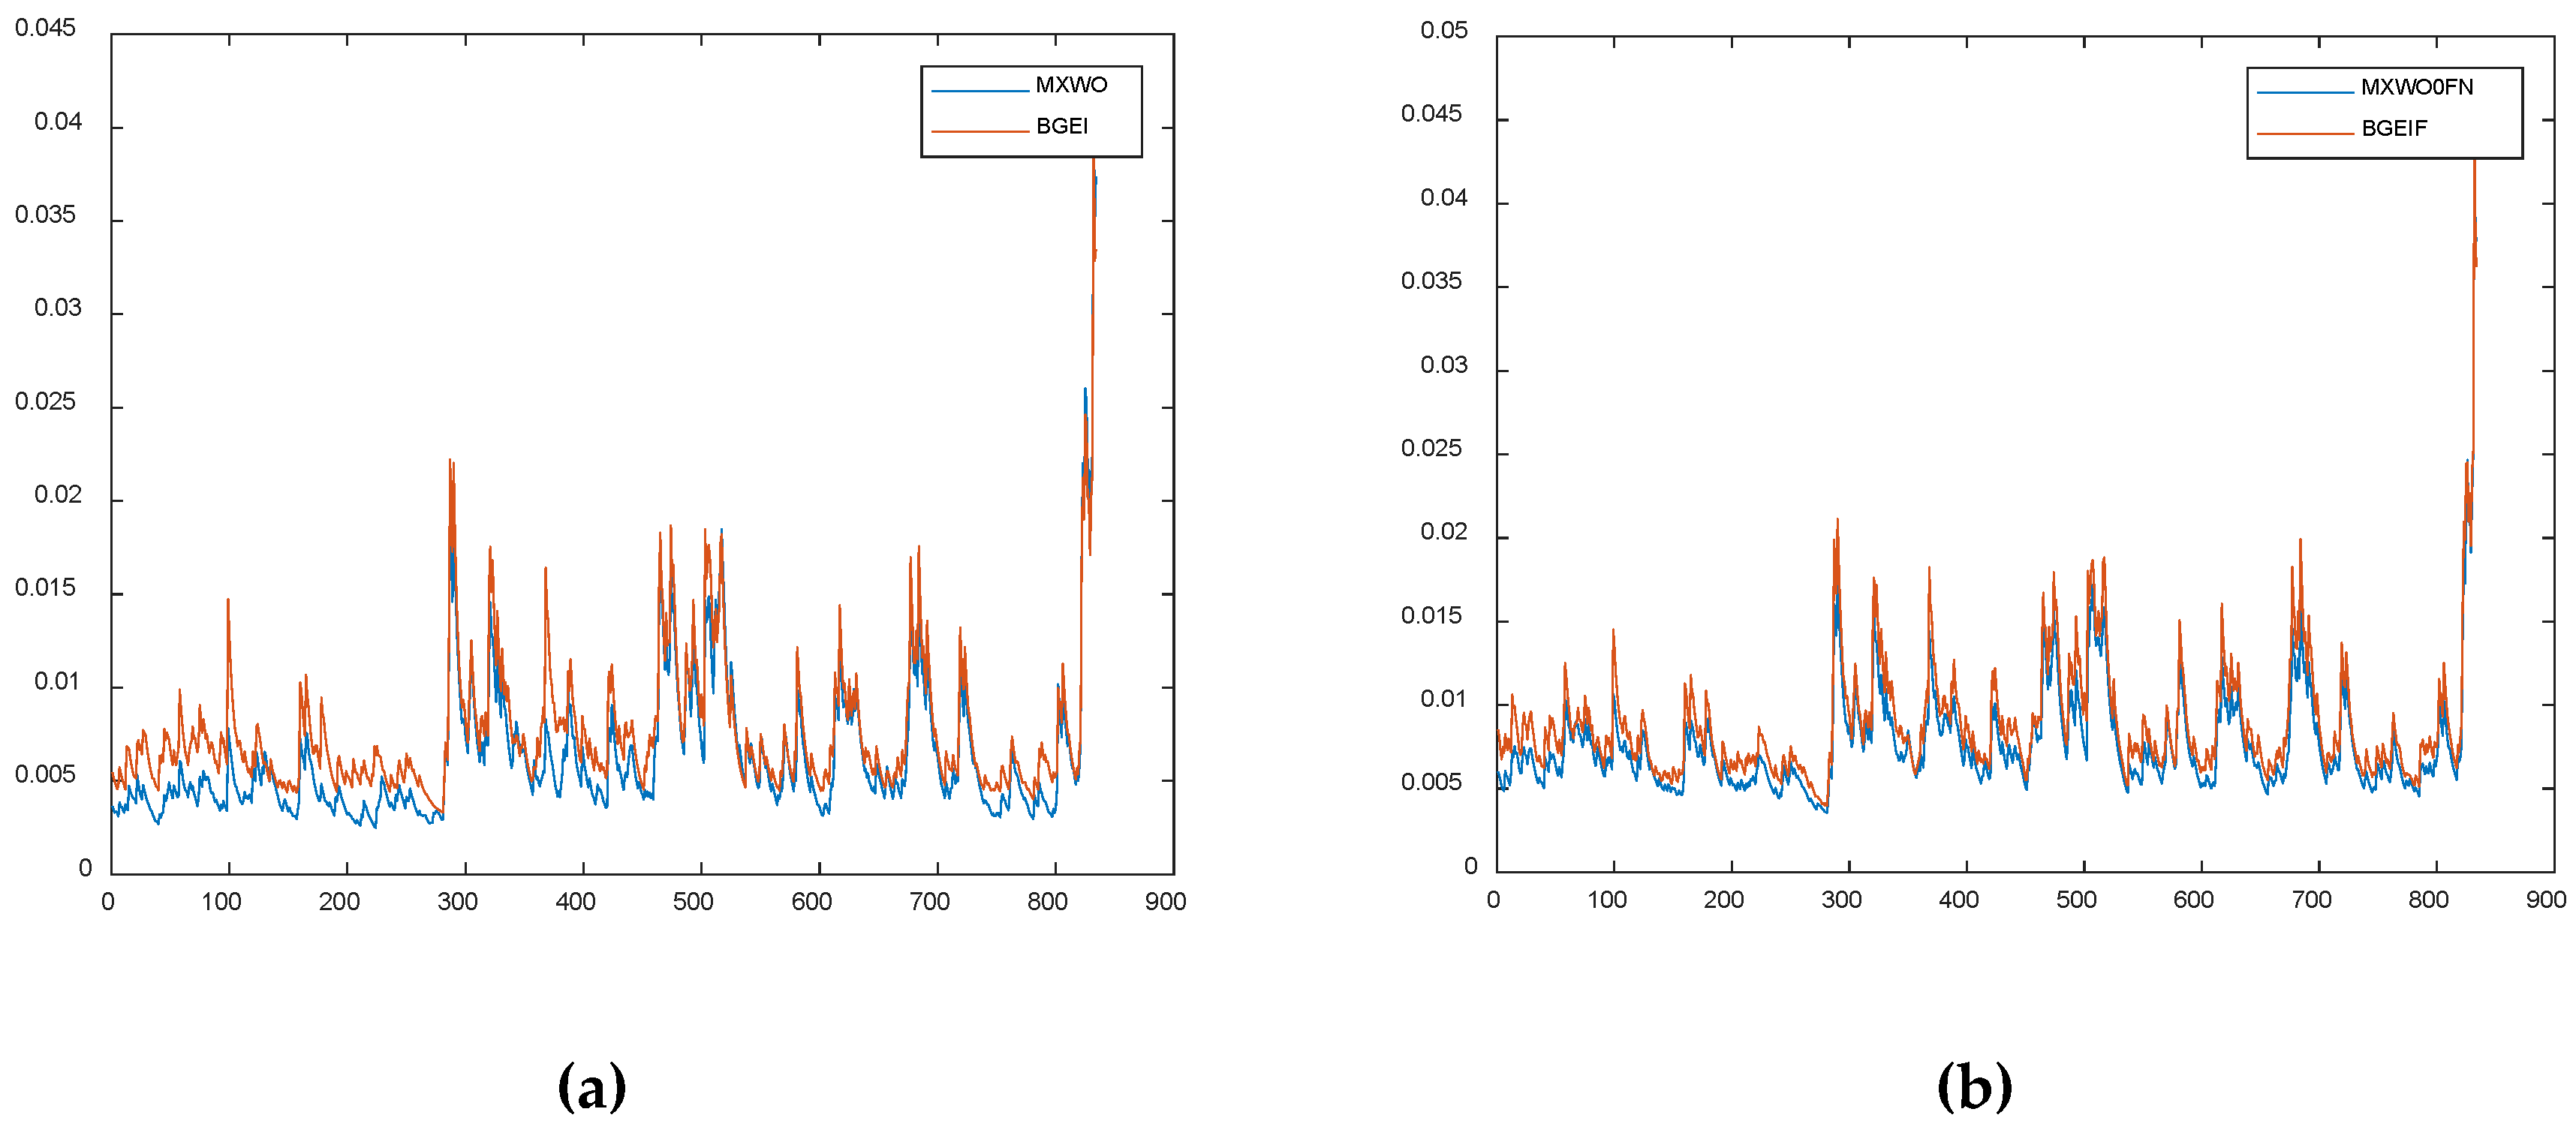
Furthermore, we observe that in general the evolution of daily conditional volatility is highly synchronized between the gender equality indices and their correspondent overall MSCI indices, which already hints a high level of correlation between both the returns series and the volatility regimes, bearing in mind that linear correlation does not necessarily mean causality and spill-over (as we will argue bellow, based on our results from the VAR model). Examining
Figure 2 bellow we can confirm the observation that gender equality indices in general exhibit higher daily conditional volatility (as mentioned above while interpreting the results from
Table 1), and we can also observe the synchronized reaction of the indices to risk events (including the beginning of the Covid-19 pandemic in the right hand part of the charts).
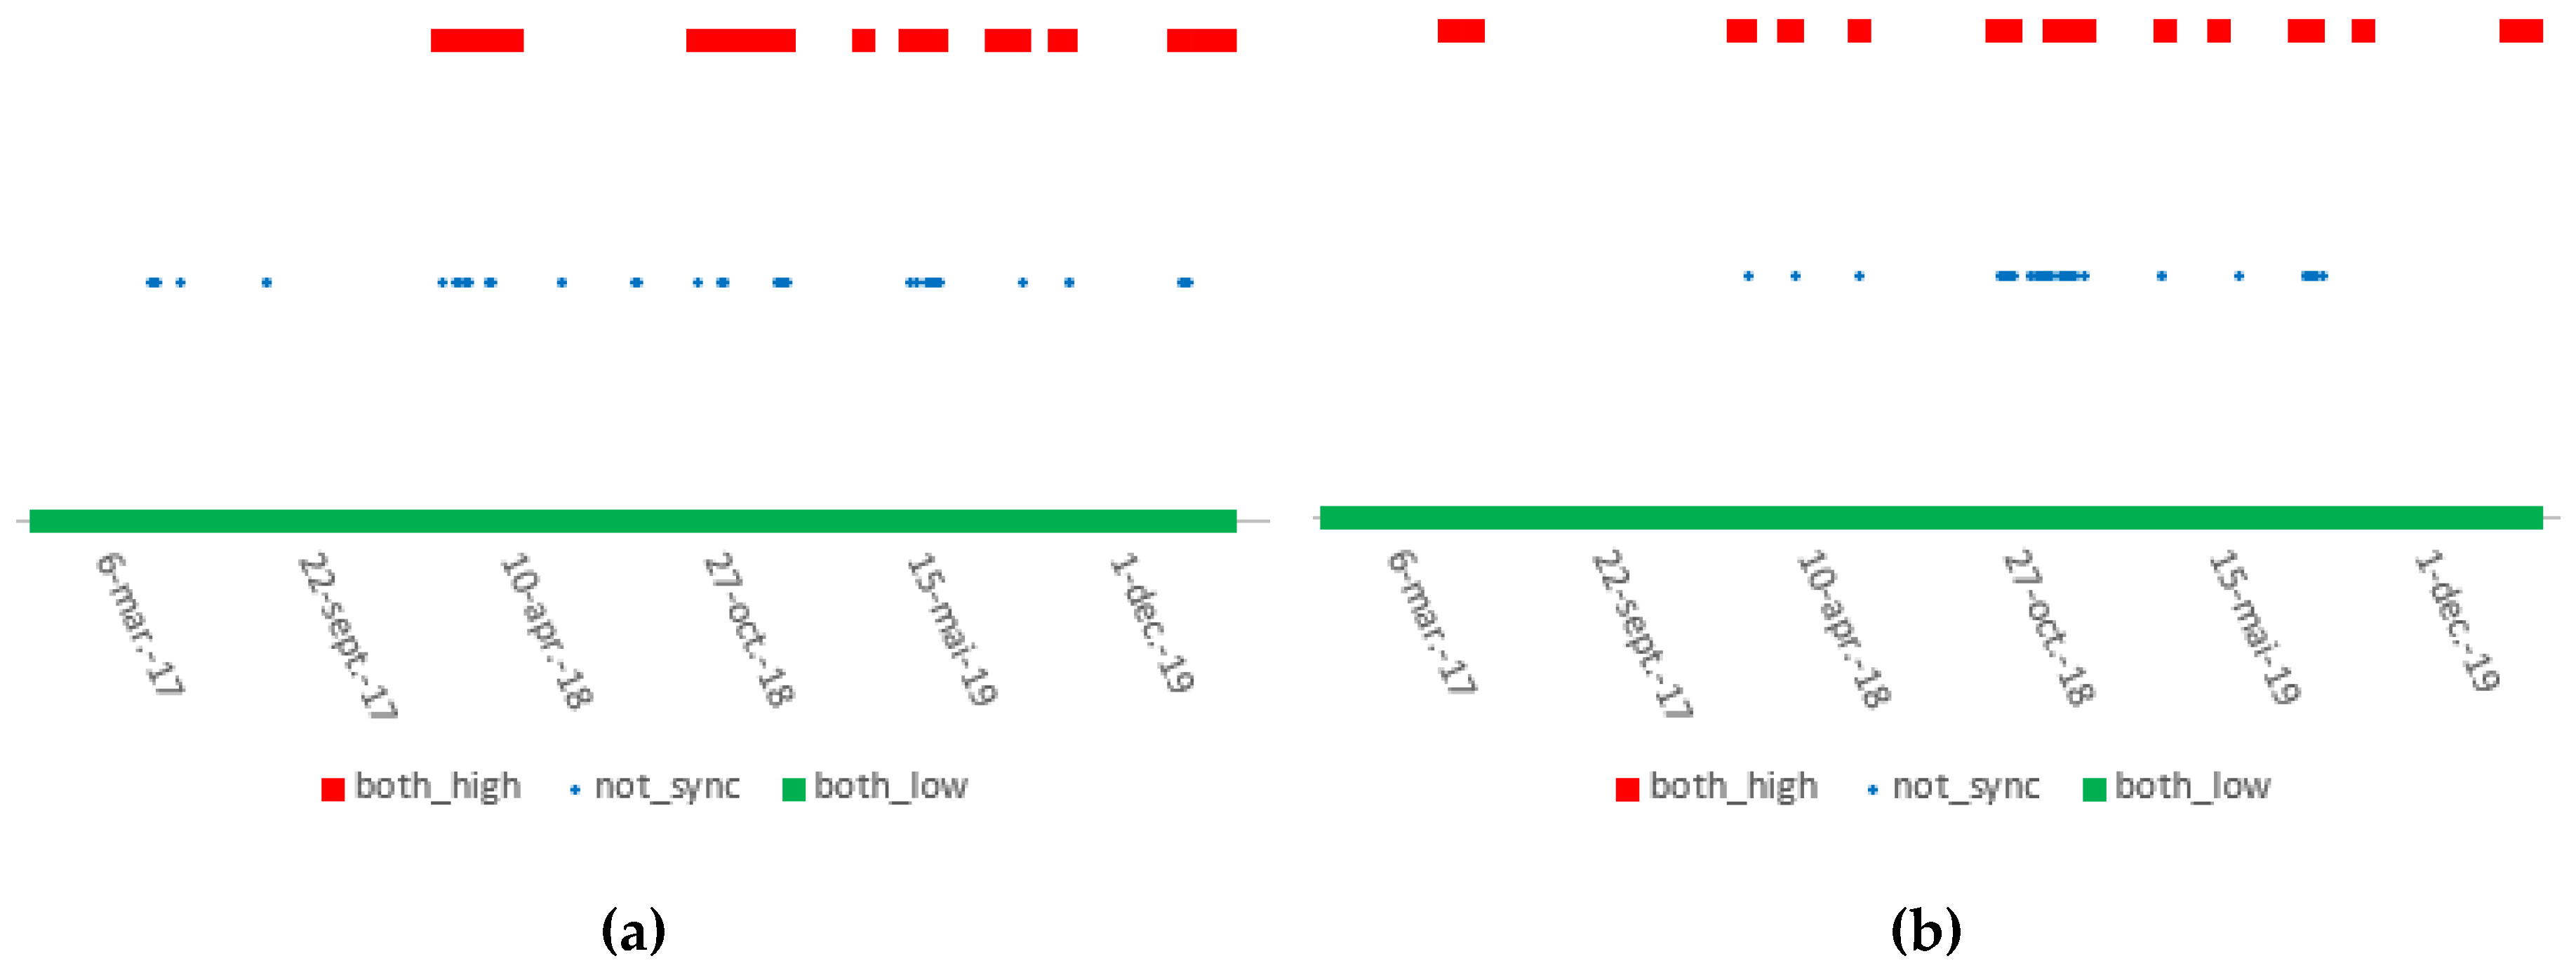
The high level of synchronization of the daily volatility regimes is confirmed by
Figure 3 below, where we present for each observation in our sample whether the volatility regimes of the two biomes of variables (BGEI vs. MXWO and BGEIF vs. MXWO0FN, respectively) were at the same level (both high or both low) or were decoupled. Going into detail, we observe that for only 48 out of 834 observations (that is, 5.76% percent of the time), the volatility regimes of the gender equality indices were not in sync with the overall MSCI indices. As previous studies concluded, the volatility regimes of the cross-sectoral indices were not necessary aligned with the ones of the financial sector indices (confirming the different behaviour of financial sector equity indices, which are more volatile in comparison with cross-sectoral diversified ones).
Our results show not only that volatility and volatility regimes of gender equality indices are corelated with overall MSCI indices, but also with the returns themselves. The value of the Pearson linear correlation coefficient for the entire sample of daily returns is 0.942 for the pairing of MXWO and BGEI and 0.953 for the pair made by MXMO0FN and BGEIF, respectively (see
Appendix A,
Table A3). Furthermore, the study of the daily conditional correlations computed using a DCC MV GARCH (1,1) model as described in
stage three of our methodology confirms that, during the entire period investigated by us, the conditional correlations between the gender equality indices and the overall MSCI indices were very high, indifferent of the volatility regime (see
Figure 4 below). While the correlations among the financial indices appear to be more stable over time in comparison with the correlations among cross-sectoral indices, the conclusion remains that for the entire period the daily returns of the gender equality indices show a high level of linear correlation with the overall MSCI indices.
Going further with our analysis, we were interested to test the above findings using a different method. As described in
stage five of our methodology, we have calibrated simple linear quantile regressions among the equity indices included in our sample, and our results presented in
Appendix A,
Table A4 show that all the slope coefficients (for all quantiles tested) are statistically significant. Regarding the regressions between the gender equality indices and the overall MSCI indices, the values of the slope coefficients are close to 1 and relatively stable in relation with the value of the quantile, as we can observe from
Figure 5 below.
A more in-depth view of the results presented in
Figure 5 and
Appendix A,
Table A4 confirms frequent findings in the financial literature that daily returns for financial sector assets are often more volatile and exhibit more skewness and fatter tails. Specifically, our results show that slope coefficients for simple linear regressions between the cross-sectoral indices are more stable in relation with the value of the quantile, while the slope coefficients for the linear regressions between the financial indices tend to be higher for the left tail quantiles, and tend to decrease for the right tail quantile. This is consistent with studies showing that, especially for financial sector assets, correlations tend to increase during bad times and decrease during good times.
For the last phase of our research, we were interested to see whether the strong link between the gender equality indices and the overall MSCI indices could be (in part) explained by causality or spill-over effects. In order to investigate this, we chose to calibrate vector autoregressive models, as described in
stage five of our methodology, for the cross-sectoral indices and for the financial sector indices separately. The most relevant results returned by the model are presented in
Figure 6.
Based on the results (presented in detail in
Appendix A,
Table A5 and
Table A6), we argue that there is only very little evidence to support any statistically significant causality or spill-over effects from the overall market to the gender equality indices. In our view, this could mean that the high degree of correlation observed from the results of all the different models employed and presented in our study are probably mainly explained by the contemporaneous co-movement of the prices, which supports the hypothesis of the similar behaviour of investors in relation with the gender equality assets vs. the general market (entire universe of assets).
4. Conclusions
In this paper, we aimed to study the relative stock market performance of companies recognized for supporting gender equality policies and practices. In order to do this, we selected three well-diversified equity indices published by Bloomberg that are composed of companies committed to supporting gender equality through policy development, representation, and transparency: one cross-sectoral index, one financial sector index, and one index composed exclusively of non-financial companies. The cross-sectoral gender equality index is a combination of the other two, and gathers 325 companies across 11 sectors, headquarter in 42 countries and regions, with a minimum individual market capitalization of USD 1 billion and a total market capitalization of USD 12 trillion. We compare several performance metrics for these indices with similar ones computed for selected MSCI overall market indices, and especially for the MSCI World and MSCI World Financial Sector indices.
We conducted our research over a sample of 834 daily logarithmic returns from a period of more than three years (1 January 2017—12 March 2020), using several statistical methods to characterize the properties of the distribution of historical returns (mean, standard deviation, skewness, kurtosis) and correlations. We also used several econometric models to study the characteristics of dynamic conditional mean, standard deviation (volatility), correlation, causality, and spill-over effects. Namely we calibrated EGARCH (1,1) models to examine the evolution of conditional volatility, Markov switching models to investigate the synchronization of volatility regimes, DCC MV GARCH (1,1) models to describe the evolution of dynamic conditional correlations, simple linear quantile regression to analyze the values of the slope coefficients in the relations between gender equality indices and overall indices, and, finally, VAR (2) models to test for causality and spill-over effects.
Using the statistical methods described, we could not confirm any particularities for the gender equality indices in comparison with the overall indices. For our sample, the mean values of the distributions were similar and not statistically different from zero, the standard deviation was larger in comparison with the mean, all the series presented significant negative skewness and excess kurtosis, and the values of the fifth percentile of the distributions of daily returns (left tail) were quite similar. Thus, the daily returns of the gender equality indices confirmed the usual stylized facts for general equity returns described by most studies.
When comparing the distributions of daily conditional volatilities estimated using the EGARCH (1,1) model, we observed, however, some relevant differences: mean and median daily conditional volatility were, in general, higher for the gender equality indices in comparison with their correspondent overall MSCI indices. This also held true for the values of the 0.95 quantile. Also, the gender equality indices exhibited lower skewness and excess kurtosis of the daily conditional volatilities in comparison with their correspondent MSCI indices.
Overall, we found in our sample a strong link between the evolution of the gender equality indices in comparison with the overall indices. The values of daily conditional volatility were highly synchronized between the gender equality indices and their correspondent overall MSCI indices, but the gender equality indices exhibited, in general, higher daily conditional volatility.
Thus, the results obtained from our sample point in an opposite direction to the conclusions of the research conducted by Morgan Stanley [
8], a situation which could be explained by the difference in sample size (ours was significantly reduced and composed of aggregated indices, not of individual issuers), sample period, and methods.
The synchronized reaction of the indices to the risk events was confirmed, including during the burst of market risk aversion at the beginning of the Covid-19 pandemic towards the end of our sample. The volatility regimes of BGEI vs. MXWO and BGEIF vs. MXWO0FN, respectively, identified using a Markov switching model, were synchronized more than 94% of the time. Furthermore, the results from the DCC MV GARCH (1,1) model showed that, during the entire period investigated by us, the conditional correlations between the gender equality indices and the overall MSCI indices were very high, with the correlations among the financial indices appearing to be more stable over time in comparison with the correlations among cross-sectoral indices.
We tested these findings using another, different, method: we calibrated simple linear quantile regressions among the equity indices included in our sample. The results obtained showed that, in the case of the regressions between the gender equality indices and the overall MSCI indices, the values of the slope coefficients are close to 1 and relatively stable in relation with the value of the quantile.
Using separate VAR (2) models for the cross-sectoral indices and for the financial sector indices, we found only very little evidence of causality and spill-over effects.
Based on the results of our analysis from several different approaches and using different econometric and statistical methods, we argue that the daily returns of the gender equality indices that we have investigated over the period 1 January 2017—12 March 2020 exhibited very similar characteristics with the daily returns of the overall market indices. Thus, we were not able to confirm the hypotheses proposed by Sanders and Boivia [
17] or Singh and Vinnicombe [
18] that the presence of women in boardrooms brings better perception in the stock market or is more favourably viewed by investors, inducing a different (better) share price performance in comparison with the other companies.
In our interpretation, this could mean that, limited to our sample and methods of investigation, there were no significant differences in investors’ behaviour towards the equity issued by public companies committed to supporting gender equality in comparison with their approach towards listed equity in general. Accordingly, if a large selection of equity issued by companies committed to gender equality would have been included in already large diversified portfolios, it would probably not have modified their overall characteristics and performance. This is somewhat similar to presuming that, in relation with our sample and period investigated, investors were almost neutral towards large diversified portfolio of gender equality listed companies in comparison with their approach towards the overall market. It could also mean that investors do not yet manifest a specific approach in relation to this category of listed equity, or that they do not yet anticipate a significantly different financial performance of companies stemming from their approach towards gender equality.
We consider our results to be relevant for asset managers, market regulators, and supervisors, in an integrated risk based assessment framework, in order to examine how the institutional investors’ strategies oriented towards gender equality ESG objectives might impact the individual and sectoral resilience to market risk.
In our research, we were limited to only a short-term approach using daily returns, because the data that we collected for the gender equality indices was only available from the beginning of 2017. As longer time series will gradually become available, our methods can also be adapted to analyze data at a lower frequency, such as weekly or monthly time series; thus enabling the inclusion of a medium-term approach into the analysis. Future studies using the same methodology could also consider dividends and other relevant corporate events, using total returns indices if available.


