Article

Spatiotemporal Variations of Drought and Their Teleconnections with Large-Scale Climate Indices over the Poyang Lake Basin, China

Jiangxi Provincial Key Laboratory of Hydrology-Water Resources and Water Environment, Nanchang Institute of Technology, Nanchang 330099, China
*
Author to whom correspondence should be addressed.
Sustainability 2020, 12(9), 3526; https://doi.org/10.3390/su12093526
Submission received: 15 March 2020 / Revised: 12 April 2020 / Accepted: 22 April 2020 / Published: 25 April 2020
(This article belongs to the Section Environmental Sustainability and Applications)

Abstract

:
The intensity and frequency of droughts in Poyang Lake Basin have been increasing due to global warming. To properly manage water resources and mitigate drought disasters, it is important to understand the long-term characteristics of drought and its possible link with large-scale climate indices. Based on the monthly meteorological data of 41 meteorological stations in Poyang Lake Basin from 1958 to 2017, the spatiotemporal variations of drought were investigated using the standardized precipitation evapotranspiration index (SPEI). Ensemble empirical mode decomposition (EEMD) methods and the modified Mann–Kendall (MMK) trend test were used to explore the spatiotemporal characteristics and trends of drought. Furthermore, to reveal possible links between drought variations and large-scale climate indices in Poyang Lake Basin, the relationships between SPEI and large-scale climate indices, such as North Atlantic Oscillation (NAO), El Niño–Southern Oscillation (ENSO), Arctic Oscillation (AO), Indian Ocean Dipole (IOD) and Pacific Decadal Oscillation (PDO) were examined using cross-wavelet transform. The results showed that the SPEI in Poyang Lake Basin exhibited relatively stable quasi-periodic oscillation, with approximate quasi-3-year and quasi-6-year periods at the inter-annual scale and quasi-15-year and quasi-30-year periods at the inter-decadal scale from 1958 to 2017. Moreover, the Poyang Lake Basin experienced an insignificantly wetter trend as a whole at the annual and seasonal scales during the period of 1958–2017, except for spring, which had a drought trend. The special characteristics of the trend variations were markedly different in the basin. The areas in which drought was most likely to occur were mainly located in the Poyang Lake region, northwest and south of the basin, respectively. Furthermore, relationships between the drought and six climate indices showed that the drought exhibited a significant temporal correlation with five climate indices at restricted intervals, except for IOD. The dominant influences of the large-scale climate indices on the drought evolutions shifted in the Poyang Lake Basin during 1958–2017, from the NAO, Niño 3.4, and the Southern Oscillation Index (SOI) before the late 1960s and early 1970s, to the AO and PDO during the 1980s, then to the NAO, AO and SOI after the early 2000s. The NAO, AO and SOI exerted a significant influence on the drought events in the basin. The results of this study will benefit regional water resource management, agriculture production, and ecosystem protection in the Poyang Lake Basin.

1. Introduction

Drought, one of the most complex and widespread natural disasters, has serious impacts on water resources, agriculture, natural ecosystems, and socio-economic development [1,2]. According to the Intergovernmental Panel on Climate Change (IPCC)’s fifth assessment report, the global average temperature has risen by about 0.85 °C in the past 120 years, and global warming will continue [3]. Various studies have shown that the intensity and frequency of droughts are increasing in many parts of the world as a result of changes in precipitation patterns and rising temperatures in the context of global warming [4,5,6,7].
To precisely monitor and assess drought for the purpose of risk management, various indices, such as the Palmer Drought Severity Index (PDSI) [8], the Standardized Precipitation Index (SPI) [9], Relative Humidity Index [10], China-Z index [11], prevalence of precipitation anomalies (P) [12], and the Effective Drought Index (EDI) [13], have been developed and applied to explore drought characteristics (e.g., duration, severity, and spatial extent). Among them, the SPI and PSDI are the most widely used. The PSDI, an index based on precipitation, temperature, and soil moisture that considers water supply and demand, has been successful in long-term drought monitoring. However, it is weak at demonstrating the effects of short-term drought and cannot assess the intrinsic multi-scalar nature of drought [14]. The SPI is based solely on precipitation by means of a probabilistic precipitation approach. Due to the simplicity of calculations and multi-scalar characters, the SPI is widely used around the world [15,16,17]. However, one weakness of the SPI is that it only uses precipitation, without considering temperature and evaporation, while the latter two play an increasingly important role in drought in the context of global warming [18,19]. Recently, the Standardized Precipitation Evapotranspiration Index (SPEI) [20] was proposed for drought assessment. The SPEI combines simple calculation and the multi-scale features of the SPI with the sensitivity of the PDSI to changes in evaporation demand caused by temperature fluctuations [20]. Therefore, it is good at detecting, monitoring and exploring the characteristics of drought in the context of climate warming [21]. In recent years, the SPEI has been used frequently to monitor drought under the current climate in different regions. In China, the SPEI has been applied to investigate spatiotemporal variations of droughts in a number of important regions [22,23,24].
Poyang Lake Basin (PLB) is one of the major agricultural areas in the country and plays an indispensable role in national food security as well as water security and ecosystem security for the lower reaches of the Yangtze River [25]. The basin is influenced by the East Asian monsoon, with significant annual and seasonal variations in precipitation [26], which lead to frequent floods and droughts causing severe damage to the agricultural economy and ecosystem [25,27,28]. Thus, to effectively monitor and predict drought occurrences and minimize socio-economic losses, many studies have been conducted on the characteristics of drought in PLB. Min et al. [29] studied the climate evolution characteristics of drought in the Poyang Lake area over the past 1000 years, and found that the Poyang Lake area was currently in a period of frequent drought. Liu et al. [30] systematically analyzed the causes of frequent extreme drought events around the Poyang Lake region in the past 10 years from the perspective of water budget balance. Hong et al. [31] and Wang et al. [32] used the SPI and SPEI to analyze the spatiotemporal characteristics of drought in PLB and its correlation with the water levels in the lake.
Although many previous studies investigated the regional characteristics of drought in PLB, such studies were based on relatively less observation stations (e.g., 13 stations by Liu et al. [20] and Hong et al. [31] and 23 stations by Wang et al. [32]). The limited number of stations used does not provide adequate data to explore the spatial and temporal evolutions of drought, which would make the results of the analysis uncertain and questionable. Additionally, more work is needed to better understand the mechanisms of drought in PLB, especially the possible links between drought and large-scale climate indices, such as the El Niño–Southern Oscillation (ENSO) [33], North Atlantic Oscillation (NAO) [34], and Pacific Decadal Oscillation (PDO) [35]. To our best knowledge, such work has rarely been conducted in the PLB.
Therefore, based on the monthly observed data of 41 meteorological stations in PLB from 1958 to 2017, this study aimed to (1) investigate the spatiotemporal variability characteristics of drought in PLB using the modified Mann–Kendall (MMK) trend test and ensemble empirical mode decomposition (EEMD) and (2) explore the relationships between drought and the large-scale climate indices using cross-wavelet transform (XWT) to identify potential causal factors of drought variation in PLB.

2. Materials and Methods
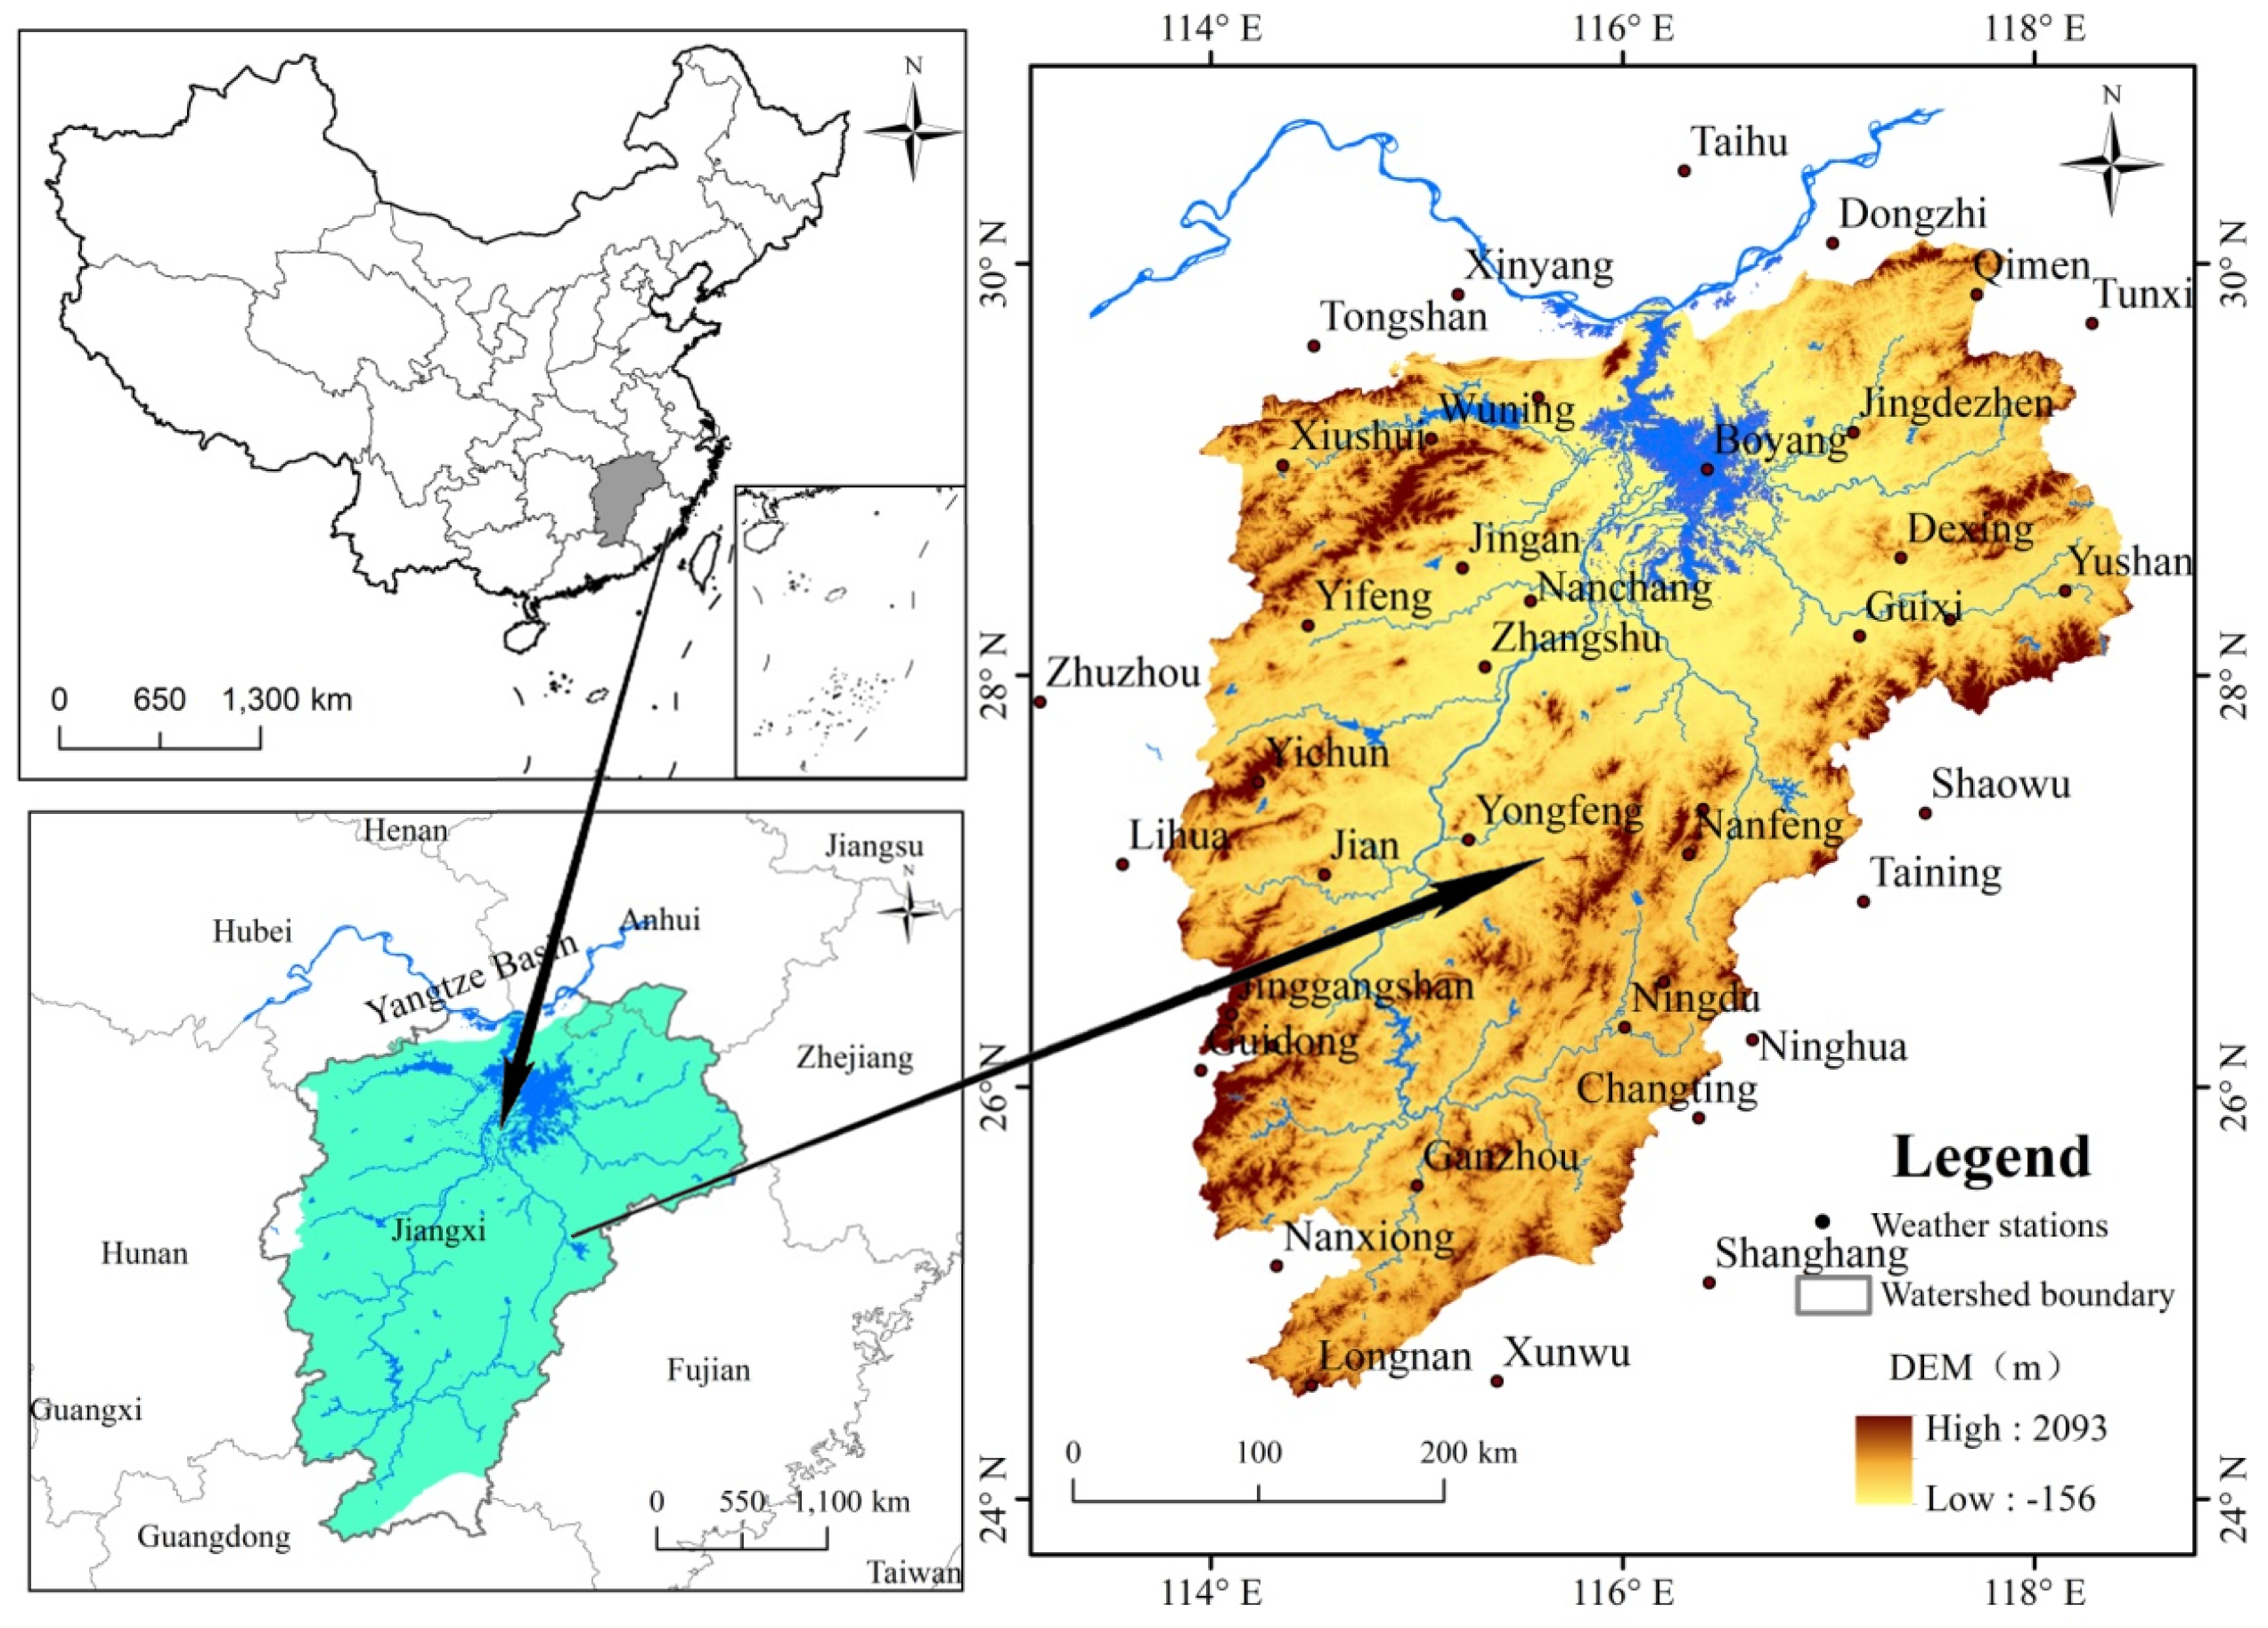
2.1. Study Area

Poyang Lake Basin lies between 24°29′–30°04′ N, 113°34′–118°28′ E on the south bank of the middle and lower reaches of the Yangtze River Basin (YRB) (Figure 1). The five major rivers (Fuhe River, Ganjiang River, Raohe River, Xiushui River, and Xinjiang River) flow into Poyang Lake and are injected into the YRB, forming a relatively complete Poyang Lake water system. The drainage area is 162,200 km2, accounting for nearly 97% of the total area of Jiangxi Province and 9% of YRB [36]. PLB has a subtropical humid climate governed by the East Asian monsoon and South Asian monsoon. The annual average precipitation and temperature from 1958 to 2017 was 1341–1939 mm and 16.2–19.7 °C, respectively. The spatiotemporal distribution of precipitation in PLB is uneven, with 43% of the annual precipitation concentrated in the wet season (April–June), and only about 23.1% of the total precipitation occurring from July to September. As PLB is affected by the subtropical high pressure and high temperature from July to September, it is more vulnerable to drought.

2.2. Data

The daily temperature and precipitation datasets were provided by the National Climate Center (NCC) of the China Meteorological Administration (CMA) from the China Meteorological Service Network (https://data.cma.cn/). The datasets covered the period from 1958 to 2017 and were collected from 41 meteorological stations around PLB. The quality and homogeneity of the datasets from these stations were checked and controlled by CMA. Figure 1 shows the distribution of the meteorological stations, while Table 1 summarizes their geographic information.
The large-scale climate indices used in this study included the Pacific Decadal Oscillation (PDO), the Arctic Oscillation (AO), the North Atlantic Oscillation (NAO), the Indian Ocean Dipole (IOD), and El Niño–Southern Oscillation (ENSO). Here, ENSO was indicated by the Niño3.4 index (5° S–5° N, 170° W–120° W) and the Southern Oscillation Index (SOI), which were obtained from the Earth System Research Laboratory (ESRL) of the United States National Oceanic and Atmospheric Administration (NOAA) (http://www.cpc.ncep.noaa.gov/). The IOD, AO, and NAO were derived from the Climate Prediction Center (CPC) of NOAA. The PDO was taken from the ESRL of NOAA. A detailed description of these indices is available from the NOAA website.

2.3. Methods

2.3.1. Standardized Precipitation Evapotranspiration Index (SPEI)

The SPEI was developed by Vicente-Serrano et al. to assess and quantify drought events [20]. The index mainly used the degree of precipitation to deviate from the average state of the difference in evapotranspiration to indicate drought. The details of the SPEI calculation were as follows:
(1) Firstly, climatological water balance (Di) was calculated as the difference between monthly rainfall and potential evapotranspiration (PET) using the following equations:
D i = P i P E T i
P E T i = 16 × ( N i 12 ) × ( M i 30 ) × ( 10 × T i I ) α
where Pi is the monthly precipitation, Ti is the mean temperature, PETi, Ni, and Mi are the potential evapotranspiration, the sunshine hours, and the number of days for the month i, respectively.
I and α can be calculated as:
α = 1.792 × 10 2 I 7.71 × 10 5 I 2 + 6.75 × 10 7 I 3 + 0.49239
I = m = 1 12 ( T m 5 ) 1.514
(2) The log-logistic probability density function was used to linearly fit the Di sequence. The probability density function of a variable with a log-logistic distribution is expressed as:
f ( x ) = β α ( x γ α ) β 1 [ 1 + ( x γ α ) β ] 2
where α, β and γ are the scale, shape and origin parameters, respectively.
Based on the L-moment procedure, the parameters of the log-logistic distribution can be obtained as [37,38]:
β = 2 ω 1 ω 0 6 ω 1 ω 0 6 ω 2
α = ( ω 0 2 ω 1 ) Γ ( 1 + 1 β ) Γ ( 1 1 β )
γ = ω 0 α Γ ( 1 + 1 β ) ( 1 1 β )
where the s-th probability-weighted moment can be estimated as:
ω s = 1 n l = 1 n ( 1 l 0.35 n ) s X l       ( s = 0 , 1 , 2 ; l = 1 , 2 , 3 , n )
where ω0, ω1 and ω2 are the probability weighted moments (PWMs), Xl and n are an ordered random sample and sample size, respectively.
Thus, the probability distribution function of the D series is shown by:
F ( x ) = 0 x f ( t ) d t = [ 1 + ( a x γ ) β ] 1
(3) Finally, the SPEI can be obtained as the standardized values of F(x) [39]:
S P E I = W 2.515517 + 0.802853 W + 0.010328 W 2 1 + 1.432788 W + 0.189269 W 2 + 0.001308 W 3
where
W = 2 ln ( p )
where p is the probability of exceeding a determined D value. When p > 0.5, p = 1 − F(x); if p ≤ 0.5, p = F(x), the values of the remaining parameters are the same as the SPI calculation process.
In this study, the SPEI values at 3- and 12-month scales were used to investigate the characteristics of drought variations at seasonal and interannual scales, respectively. The 12-month SPEI of December for each year was defined as the annual SPEI, while the seasonal SPEI for spring, summer, autumn, and winter were denoted by the 3-month SPEI of May, August, November, and February of the following year, respectively. In PLB, the seasons were divided as follows: spring (March to May), summer (June to August), autumn (September to November), and winter (December to February of the following year). The drought grade classification, based on SPEI, is shown in Table 2.

2.3.2. Modified Mann–Kendall Trend Test and Sen’s Slope

To analyze the annual and seasonal variation trends of drought, the MMK trend test and Sen’s slope were used. The MK test was a non-parametric statistical test that had been widely used to detect trends in hydro-meteorological time series. This method was based on the assumption that the time series were randomly independent. However, the hydrological variables may usually have serial autocorrelation [40], which would affect the significance of the MK test. Hence, to eliminate the effect of autocorrelation and improve the performance of the MK test, this study used the non-parametric MMK method to identify the existence of a possible tendency towards drought episodes.
In addition, the magnitude of the trend was robustly estimated by Sen’s slope. β can be calculated as follows:
β = M e d i a n ( x j x i j x )    i < j
where xi and xj are the data series values. A positive (negative) value of β indicates an upward (downward) trend.
In this study, Sen’s slope method was applied to quantify the magnitude of trends of SPEI time series in PLB, and the MMK method was used to evaluate the significance at a 5% significance level. The details of the MMK and Sen’s slope methods can be found in Hamed [40] and Sen [41].

2.3.3. Ensemble Empirical Mode Decomposition

As an adaptive time–frequency data analysis method, empirical mode decomposition (EMD) has been commonly used to extract meaningful information from non-linear and non-stationary data series [42]. Using EMD, signals can be decomposed into a few intrinsic mode functions (IMFs) and a residual component (Res), and each IMF represented a simple oscillatory mode with a variable amplitude and frequency over time. However, one of the major drawbacks in the EMD was the mode-mixing problem, which caused EMD to be unable to reflect the characteristics of the original time series [42]. To overcome this issue of the EMD method, EEMD was proposed by Wu and Huang [43]. The basic principle of the EEMD is to calculate the true IMFs by means of an ensemble of trials, while adding white Gaussian noise to the original data to aid the EMD decomposition in each trial. Thus, with the help of white noise, EEMD can eliminate the mode-mixing problem to some extent and can preserve the physical uniqueness of the decomposition. Therefore, it is more stable when decomposing non-linear and non-stationary data series [40]. Based on EEMD, the original time series X(t) can be decomposed as follows:
X ( t ) = k = 1 n I M F k ( t ) + R e s ( t )
where IMFk(t) is the kth IMF of the original data series X(t), Res(t) is the residual of the original data series X(t) and n is the number of the IMFs. The IMFs reveal the oscillation characteristics from a high frequency to a low frequency at different time scales, and Res reflects the trend of the original data series X(t).
In this study, EEMD was adopted to decompose annual and seasonal SPEI time series based on MATLAB for analyzing the multi-scale characteristics of drought in PLB. The number of ensemble members was set to 100 and the optimal standard deviation of the white noise series was selected to be between 0.1 and 0.2 by means of k-fold cross-validation. Furthermore, to examine whether an IMF decomposed by EEMD contained a true signal or just a random noise component, a statistical significance test was conducted [43], which can be calculated as follows:
E k = 1 N j = 1 N | I M F k ( j ) | 2
T k = N N P k
ln E ¯ k + ln ( T ¯ k ) α = 0
where N represents the lengths of IMF, NPk is the number of peaks for each IMF, E ¯ k represents the averaged energy density, Tk is the mean period and α is the significance level (e.g., α = 0.01 or 0.05). However, the actual application may produce a small amount of deviation. Therefore, the confidence limits for the energy spectrum distribution of white noise can be calculated as:
ln E ¯ k = ln ( T ¯ k ) α ± 2 N e ln ( T ¯ k ) α 2
The details of the EEMD method can be found in the study by Wu et al. [43].

2.3.4. Cross-Wavelet Transform

The XWT method, based on continuous wavelet transform, was developed to investigate relationships between two time series in time–frequency space. For two time series: {xn} and {yn}, XWT is defined as:
W n X Y ( s ) = W n X ( s ) W n Y ( s )
where WnX(s) denotes the wavelet transform of time series {xn} at frequency scale s and WnY*(s) represents the complex conjugate of the wavelet transform WnY(s) for time series {yn}. The cross-wavelet power was defined as |WnX(s)|, which showed the covariance of two time series and was used to observe the correlation between the two time series. The complex argument, (WnX(s)), can be interpreted as the local relative phase between the two time series at time n at the frequency scale of s, which can illustrate the phase relationship between the two time series in time–frequency space.
The Morlet wavelet, one of many wavelet functions, has been suggested in previous studies as the most appropriate basis function for its good balance between time and frequency localization [44]. Accordingly, XWT with the Morlet wavelet was used in this study to illustrate the temporal association between SPEI and large-scale climate indices. As the wavelet was not completely localized in time, the cross-wavelet coefficients were subject to edge effects when dealing with finite-length SPEI series, which formed the cone of influence (COI). The results should be ignored beyond the region of the COI. More details about the XWT method can be found in the study by Torrence [45].

3. Results

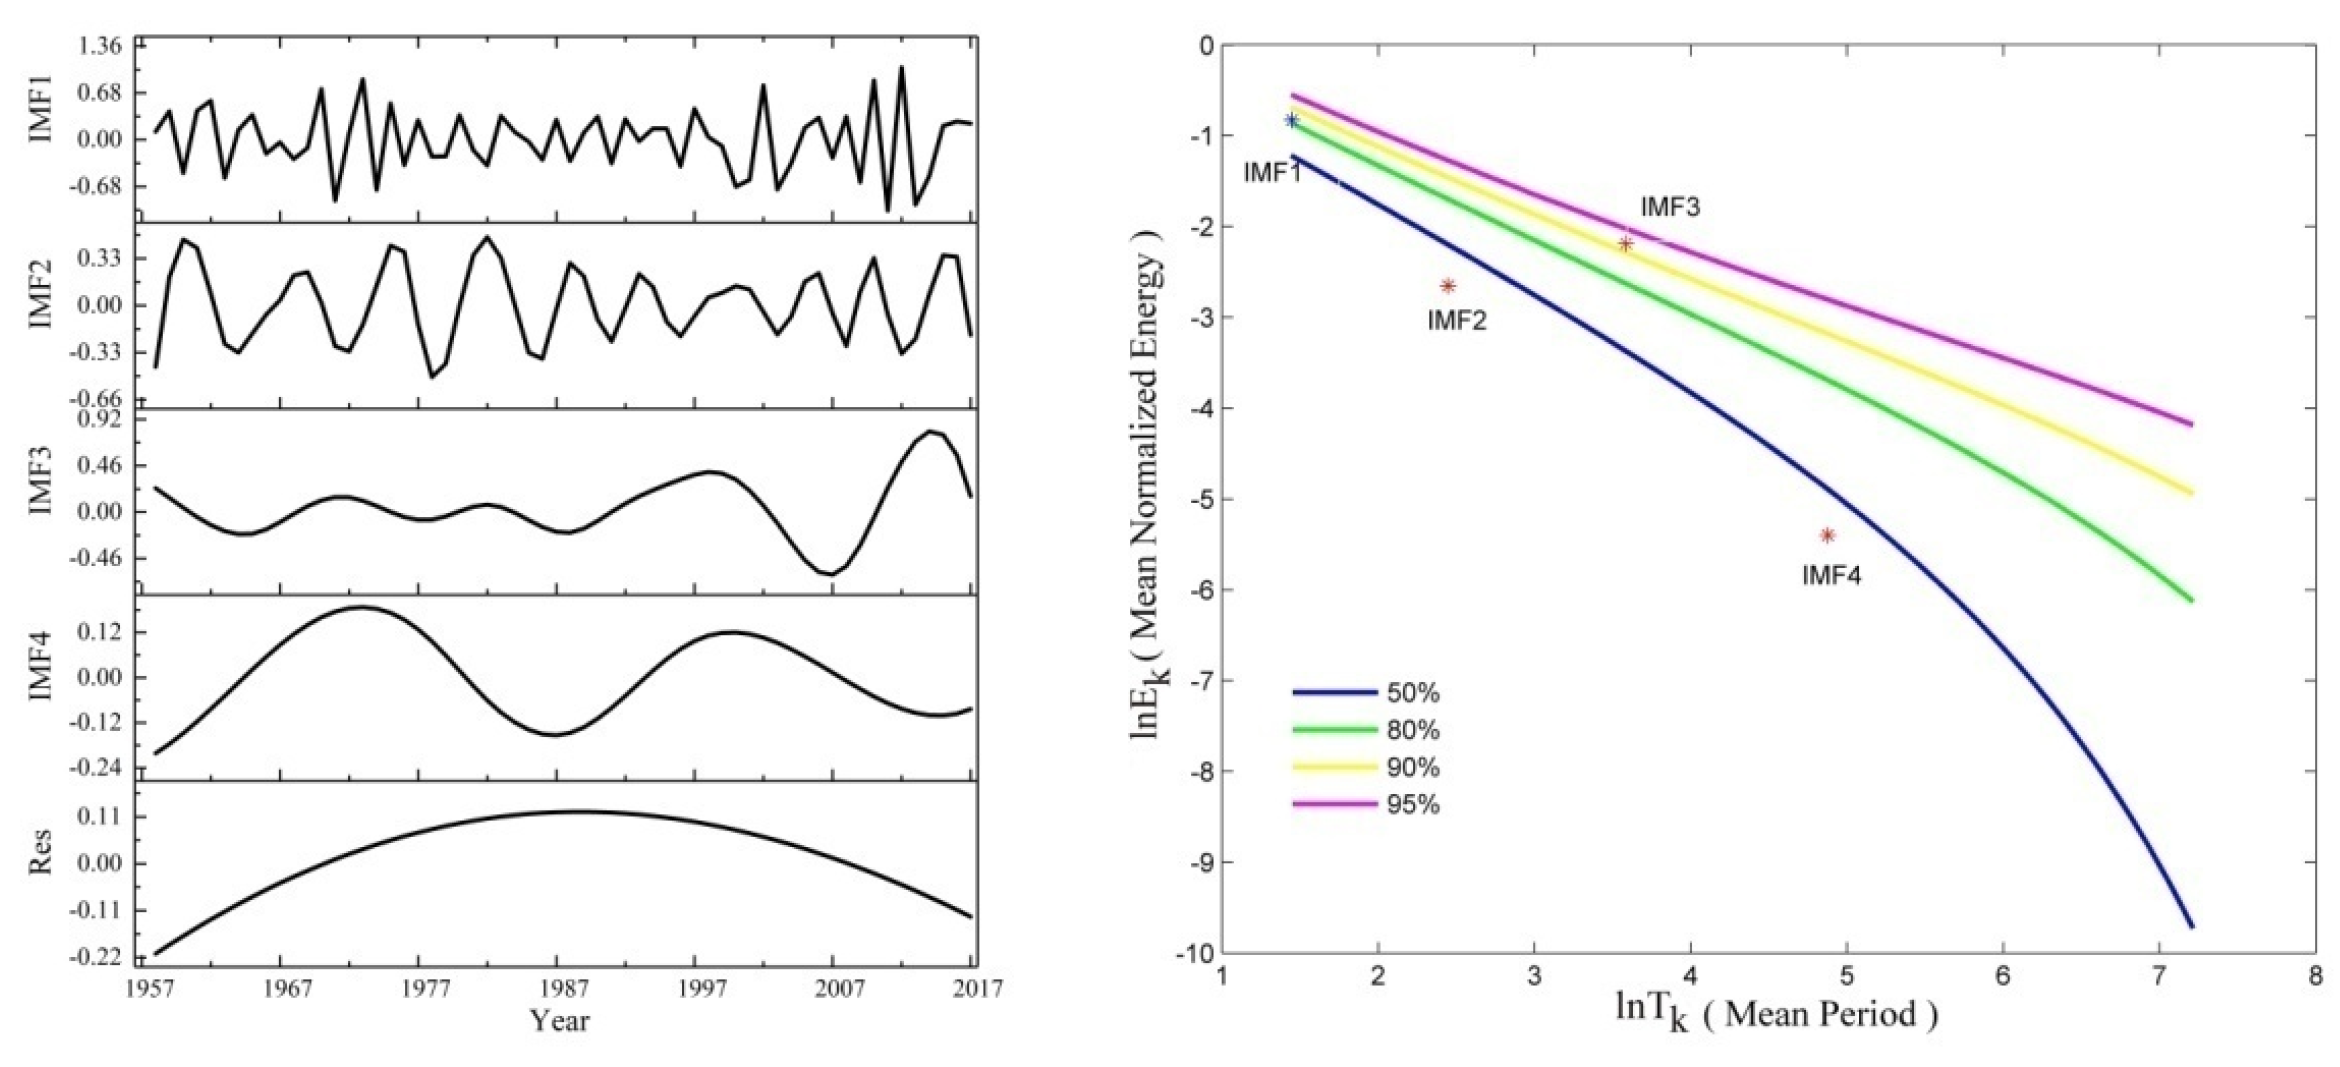
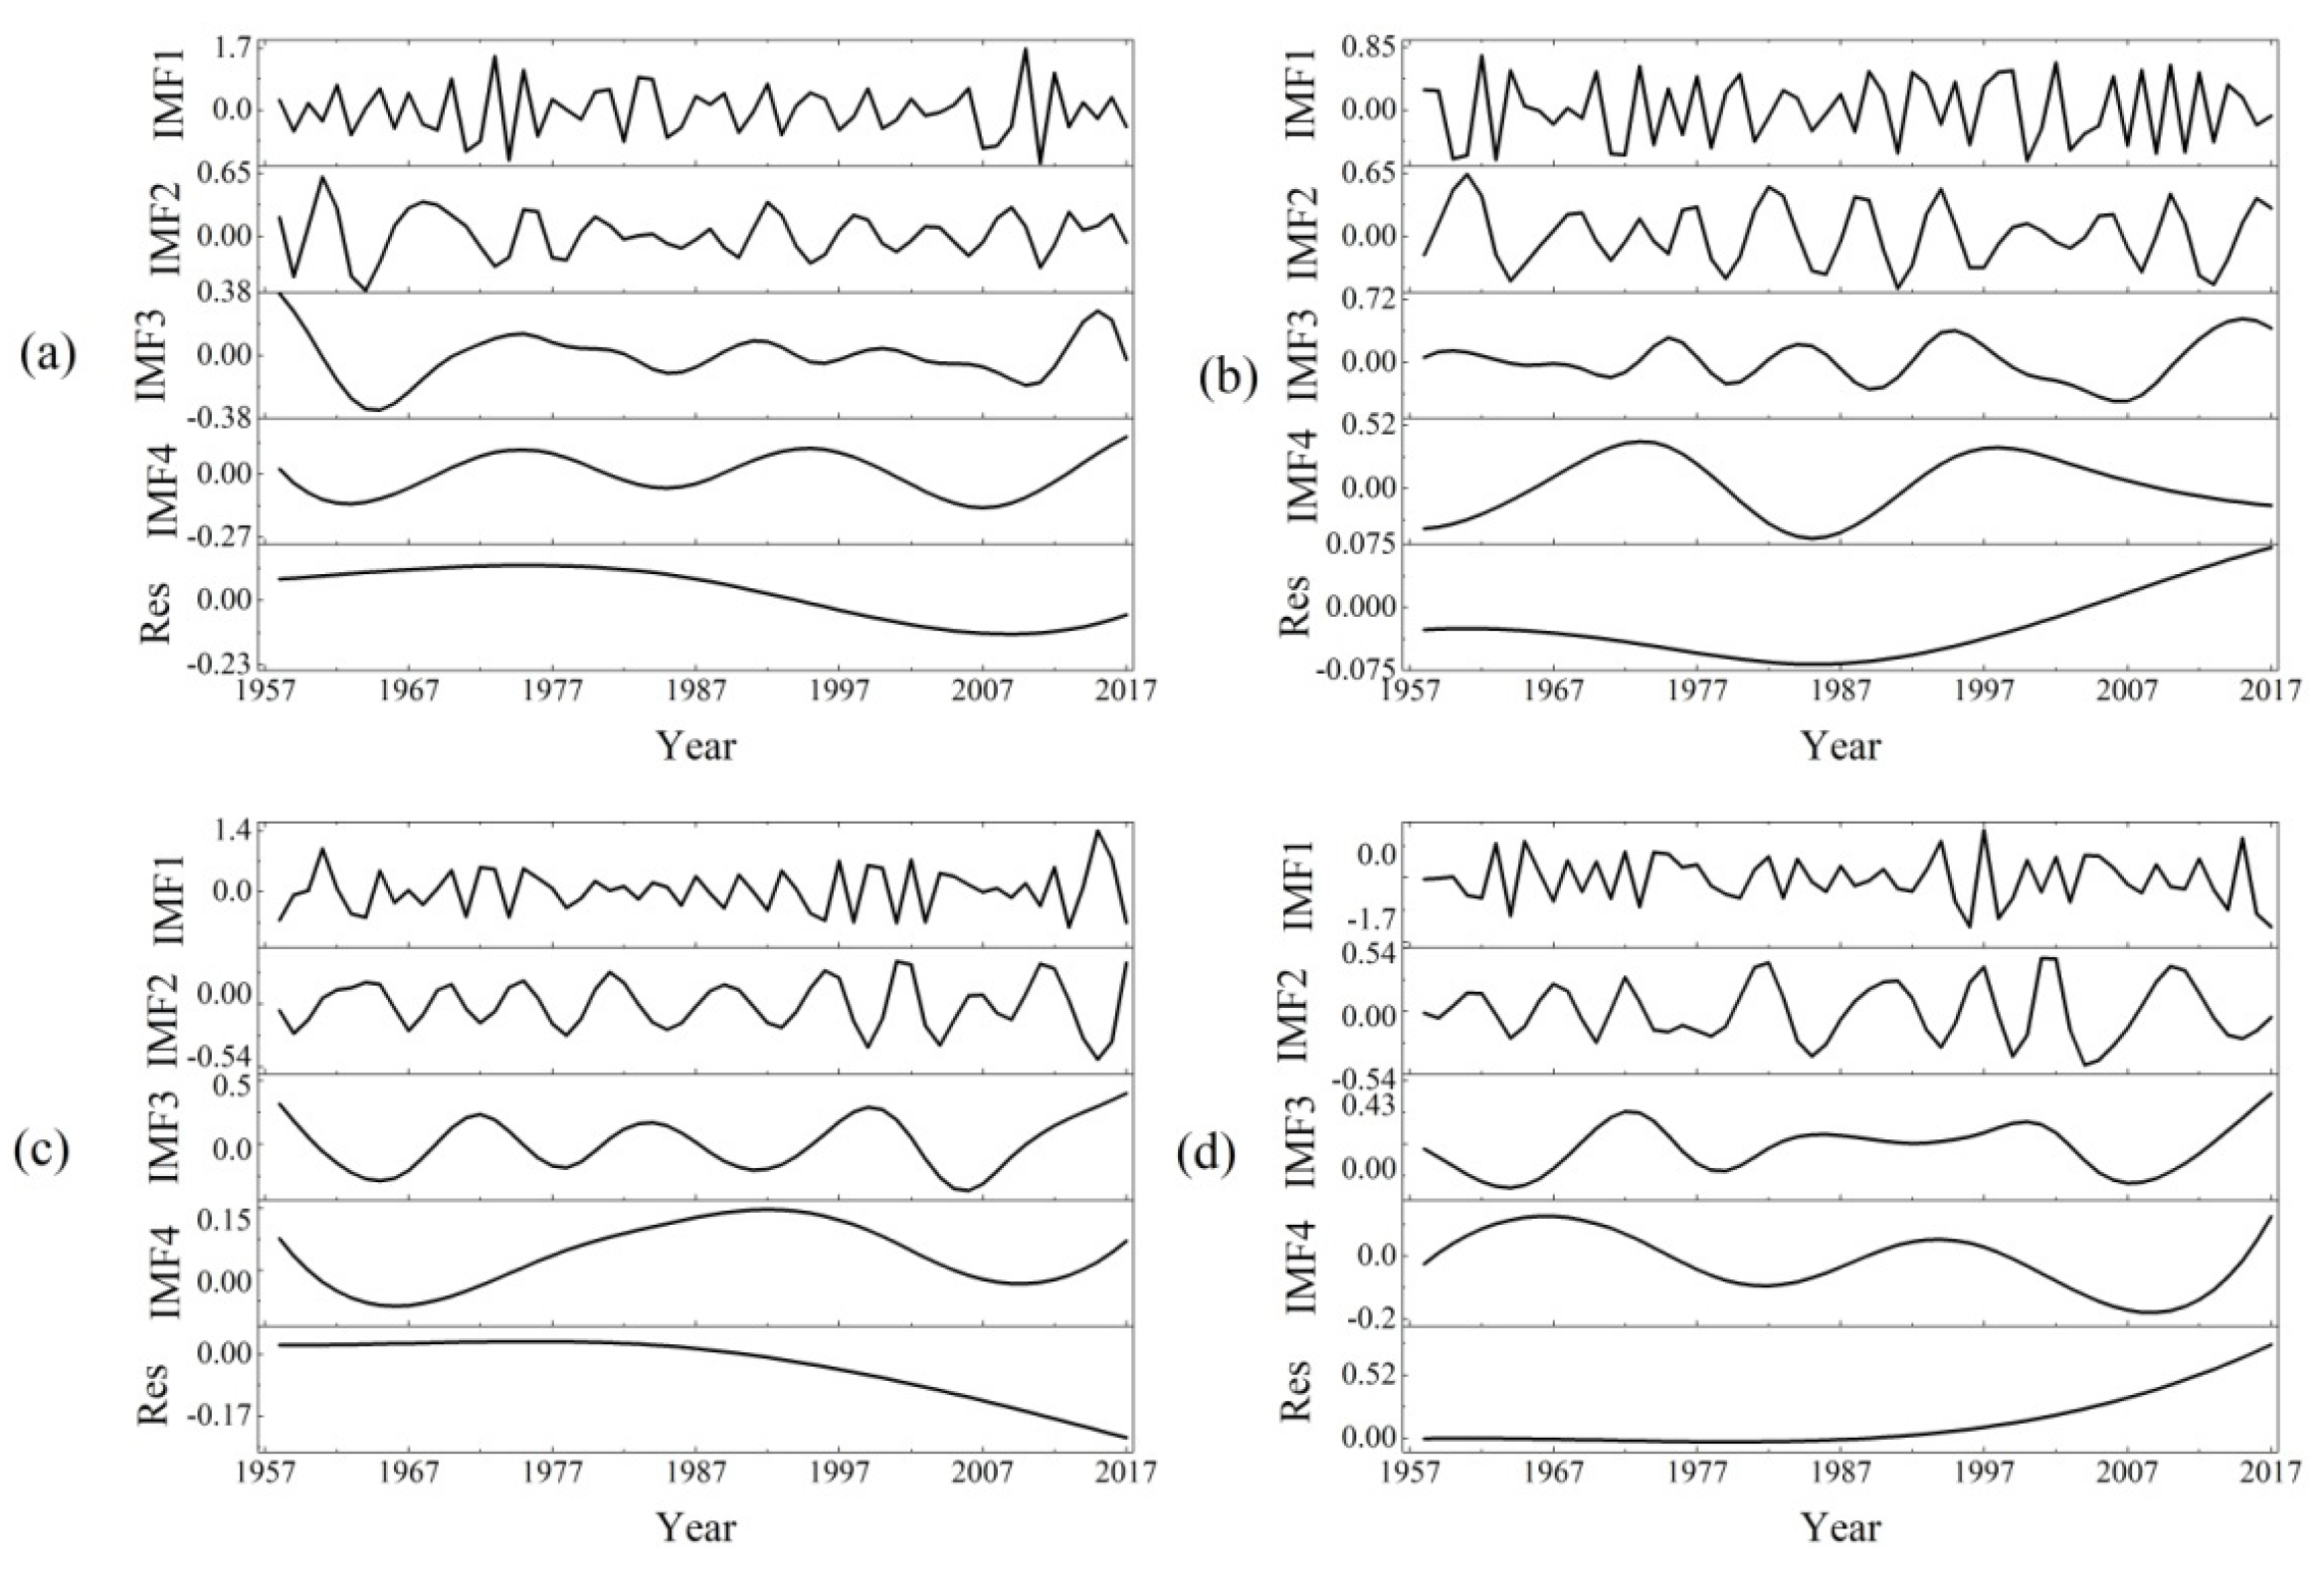
3.1. Multi-Scale Oscillation Characteristics

In this study, the SPEI series in PLB from 1958 to 2017 were decomposed by EEMD to explore the multi-scale oscillations of drought, and four IMFs and a residual component (Res) were obtained. The illustrations of the decomposition are shown in Figure 2 and Figure 3. Here, IMFs (IMF1–4) and the Res contained the periodic changes and nonlinear feedback in the climate system. Furthermore, the significance test results for all the extracted IMFs were performed based on the relationship between the energy and the mean period of each IMF; the results are also plotted in Figure 2. According to the oscillation amplitude and variance contribution of each IMF and Res, the importance and significance level test of each IMF and Res to the original SPEI series were calculated, respectively, and the period of each IMF was also calculated. The results are shown in Table 3.
As shown in Figure 2 and Figure 3, it can be seen that each IMF reflected the characteristics of fluctuation from high frequency to low frequency at different time scales in the original SPEI series. The first IMF (IMF1) had the highest frequency and largest amplitude. As the order number of the mode increased, the frequency and amplitude of the following IMFs decreased. For each IMF from the annual SPEI series, a relatively stable quasi-period appeared, with mean periods of 3 years for IMF1, 6 years for IMF2 at the inter-annual scale, 15 years for IMF3, and 30 years for IMF4 at the inter-decadal scale (Figure 2 and Table 3). From the significance test, it can be found that only the IMF3 fell between a 90% and 95% confidence interval, whereas other components fell below a 90% confidence interval. This indicates that IMF3 was statistically significant at a 90% confidence interval and contained more information with actual physical meaning. As seen in Table 3, the contribution of IMF1 to the original annual SPEI series variance over the quasi-3-year period was the greatest, reaching 56.55%, followed by IMF3 (21.88%), IMF2 (16.30%), and IMF4 (3.08%). The inter-annual timescale components (IMF1 and IMF2) totally explained 72.85% variances of the annual SPEI. Therefore, it can be concluded that the inter-annual signal was the dominant component of the annual SPEI variation in PLB.
The Res can illustrate the general inherent trends of the SPEI series over time. As seen from the Res in Figure 2, the annual SPEI series showed nonlinear variation characteristics during 1958–2017. For the annual SPEI series, the Res generally exhibited an increasing trend in the past 60 years, indicating that PLB experienced an overall wetting condition during 1958–2017. Meanwhile, a gradual decrease from the late 1980s to 2017 was observed in the overall increasing trend of the Res, suggesting that an obvious transition period from wet to dry occurred in the late 1980s. This meant that although the basin exhibited an overall wetting trend during 1958–2017, compared with the whole research period, the drought trend occurred after 1990, which should be taken into consideration in terms of drought monitoring and warning in the past 30 years.
Figure 3 illustrated the four IMFs and Res from the seasonal SPEI series of Poyang Lake Basin. For seasonal SPEI series, the inter-annual signals (IMF1 and IMF2) had similar oscillations as those of the annual SPEI series in the 2–3 year period for IMF1 and 5–8 year period for IMF2 (Table 3). As for decadal scale variation, IMF3 and IMF4 showed inconsistent oscillations with those of the annual SPEI series. In terms of IMF3, the summer and autumn SPEI showed a period of 15 years, which was the same as the annual SPEI; while the periods of spring and winter SPEI were 13 and 24 years, respectively. IMF4 showed a period of 30 years for the seasonal SPEI, which was similar to the annual SPEI, except for the spring and winter SPEI, there are 20-year and 24-year periods, respectively. As seen in Table 3, for the summer SPEI series, IMF1 had the maximum variance contribution (51.47%), followed by IMF3 (22.65%), IMF2 (12.89%), and IMF4 (12.59%), contributions which were similar to those in the annual SPEI series. For other seasonal SPEI series, the variance contribution rate of IMF1 was the greatest among all IMFs, accounting for more than 70% of the total variance, followed by IMF2, contributing to approximately 12% of the variance. The rest of the IMFs (IMF3 and IMF4) contributed up to less than 14% of the variance (13.77% for autumn SPEI series, 6.36% for winter SPEI series and 4.64% for spring SPEI series). With more than a 70% contribution to the variances of seasonal SPEI (74.12% for summer SPEI and over 80% for other seasonal SPEI), the inter-annual timescale components (IMF1 and IMF2) were also the dominant components in PLB, which were similar to the annual SPEI.
As seen from the Res in Figure 3, the seasonal SPEI series also showed a nonlinear and non-stationary characteristic during 1958–2017. For the seasonal SPEI series, the spring Res exhibited an upward trend from 1958 to 1987, and then a down trend afterwards, but in general, it showed a decreasing trend in the past 60 years, which indicates that Poyang Lake Basin experienced an overall drought process in spring from 1958 to 2017. The summer Res appeared to have an increasing nonlinear trend, slowly decreasing to the lowest value shown in the late 1980s, and then increasing. The autumn Res increased slightly before the mid-1970s and then decreased sharply afterwards, generally showing a drought trend in autumn from 1958 to 2017. Comparatively, the trend in the winter Res exhibited exactly the opposite variation. An increasing nonlinear trend was observed, which went down slowly at first and then went up, indicating that there was an overall wetting trend in PLB during winter from 1958 to 2017. These results were basically consistent with the results obtained by Liu et al. [20]. Liu et al. analyzed the dry and wet change from 13 meteorological stations in PLB during 1958–2013 and found that there was a wet trend in PLB at the annual scale as well as the seasonal scales, except for spring and autumn, in which a drying trend was observed.
Overall, the SPEI in PLB exhibited relatively stable quasi-periodic oscillation from 1958 to 2017. During the past 60 years, the SPEI had approximate 3-year (IMF1) and 6-year (IMF2) quasi-periodic fluctuations at the inter-annual scale, and 15-year (IMF3) and 30-year (IMF4) quasi-periodic fluctuations at the inter-decadal scale. Furthermore, the inter-annual variation (3- and 6-year quasi-periods) played leading roles in the drought variation in PLB.

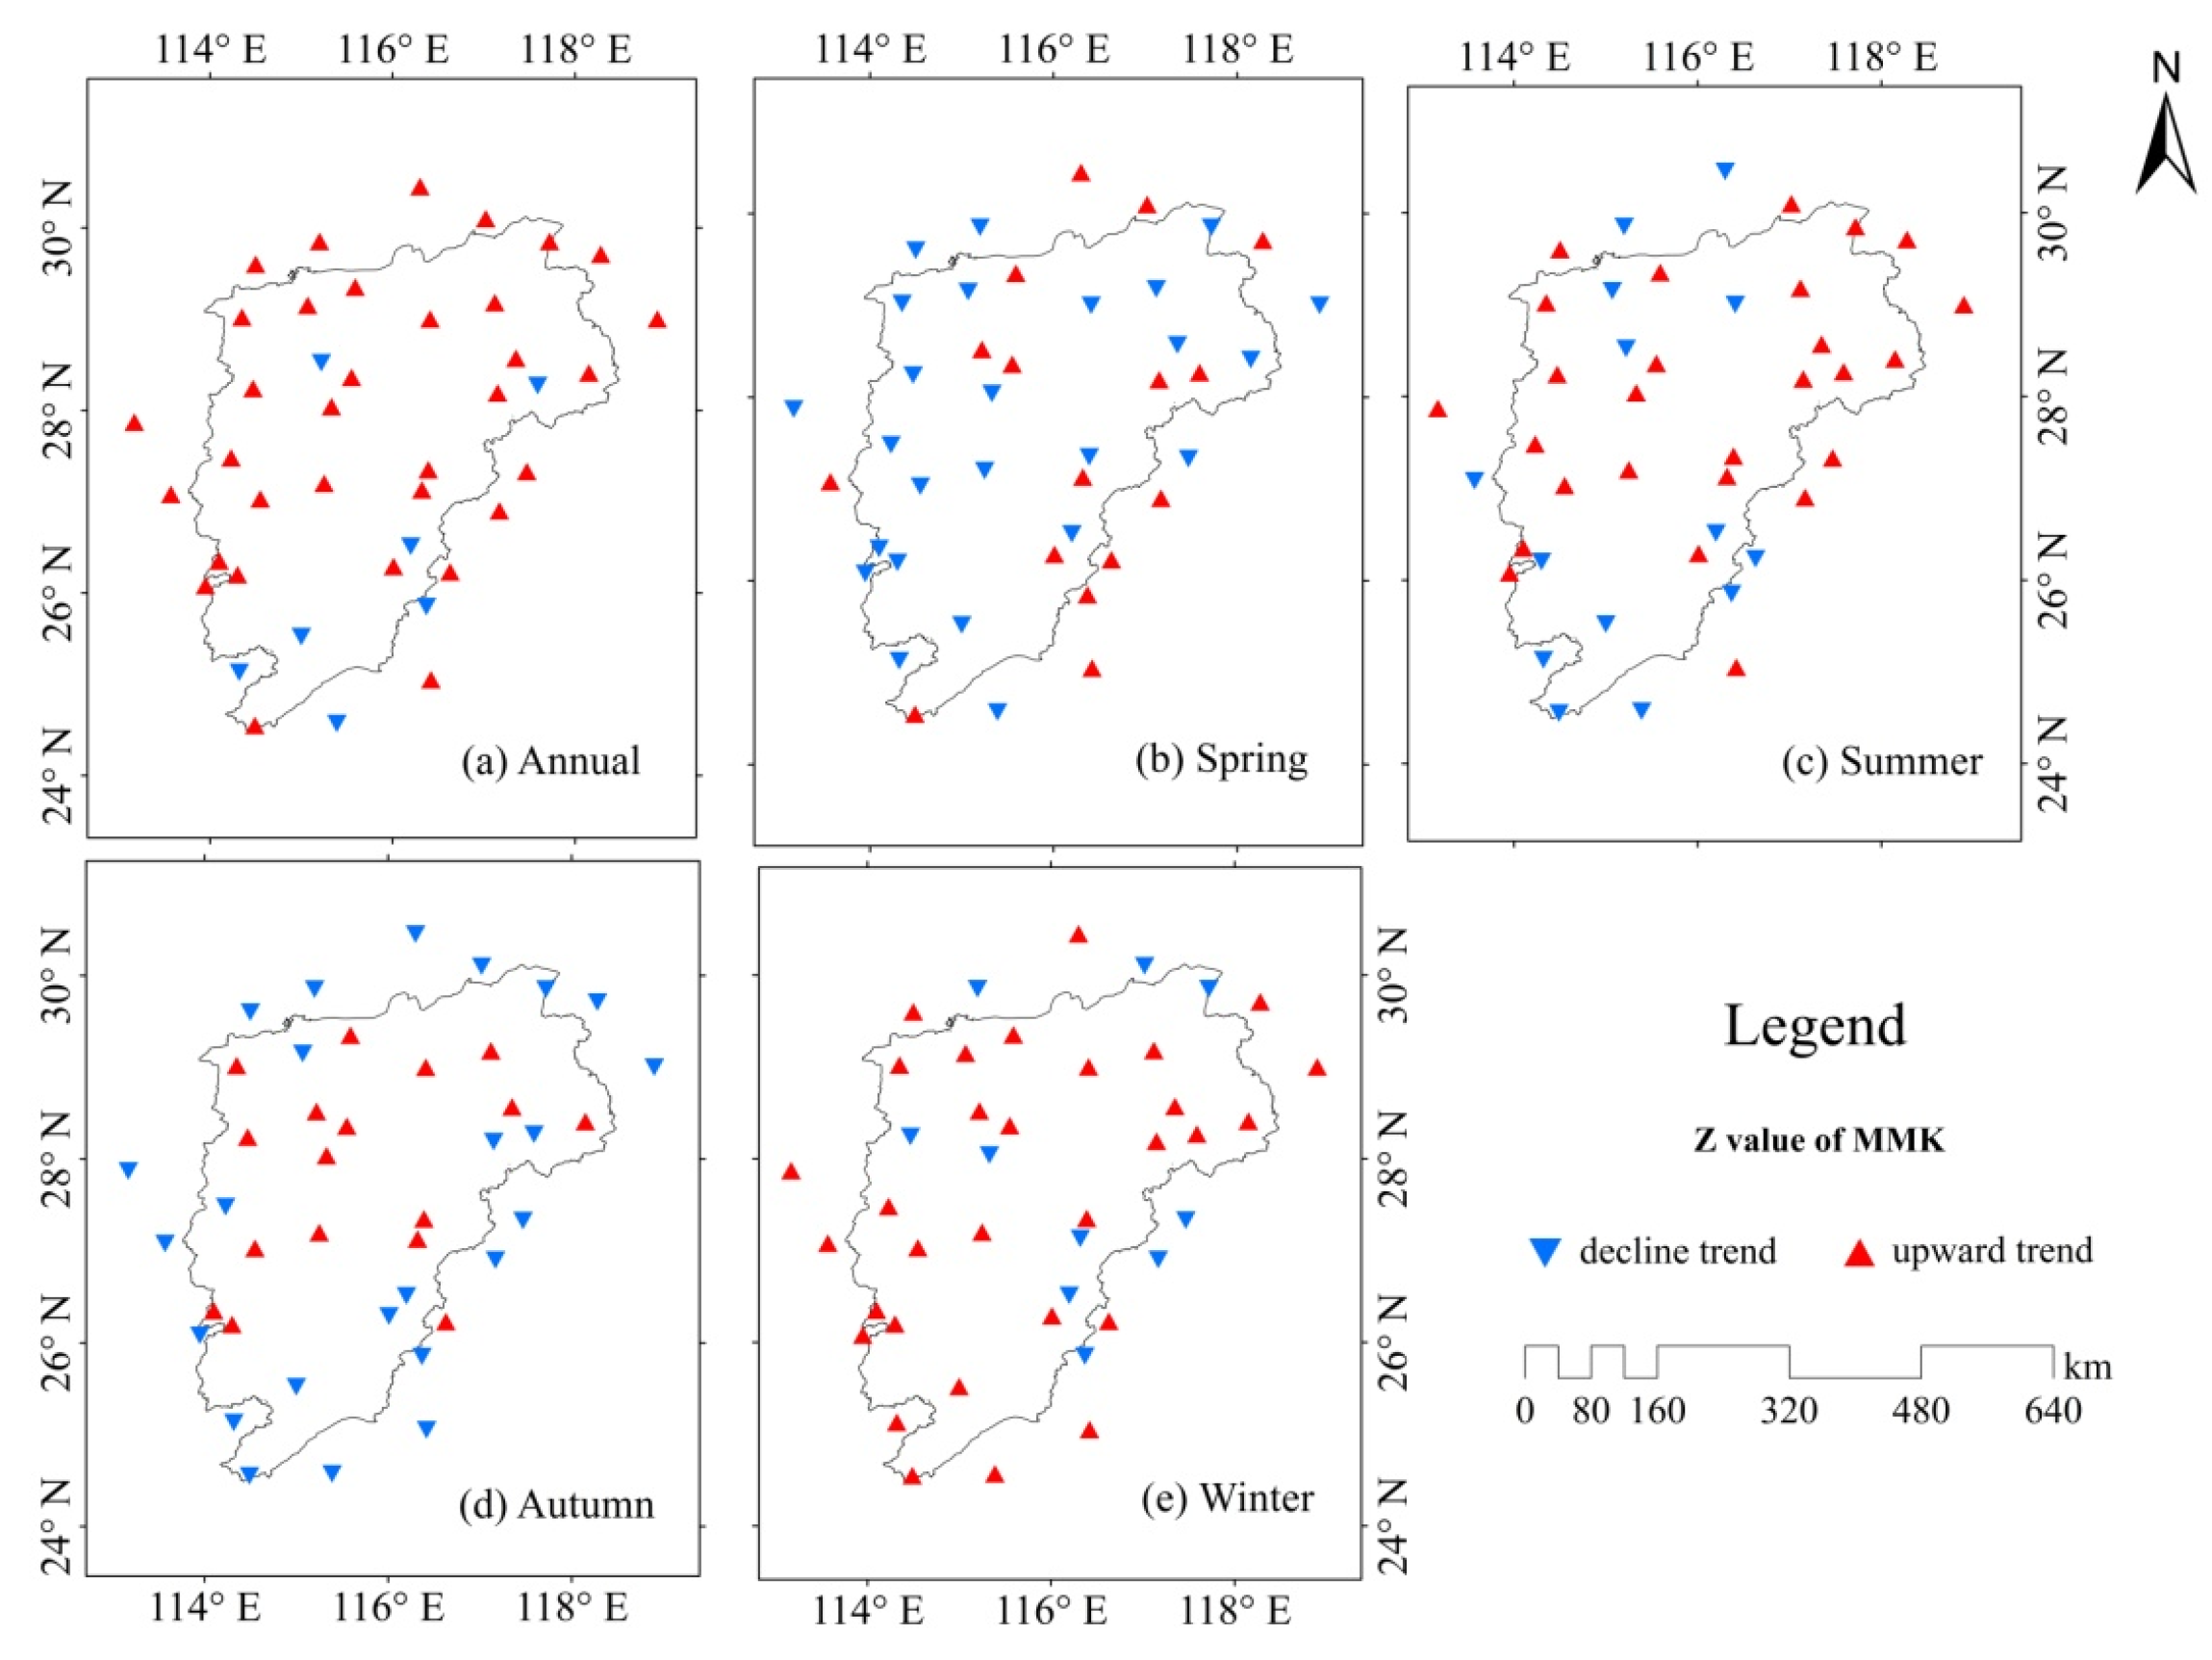
3.2. Spatial Characteristics of Drought

Sen’s slope and the MMK test were employed in this study to detect trend variations in the SPEI series for the individual stations from 1958 to 2017 in Poyang Lake Basin, then an inverse distance weighted (IDW) interpolation method was applied to obtain the spatial variations in the trends. Figure 4 illustrated the spatial distribution of the trends of the annual and seasonal SPEI using IDW within ArcGIS software. Table 4 listed the MMK trends of the SPEI on annual and seasonal scales in PLB.
For the annual SPEI (Table 4), it was found that the annual SPEI showed an upward trend from 1958 to 2017, indicating that Poyang Lake Basin has experienced a wetting process in the past 60 years, which is consistent with the results of the EEMD (Figure 2 and Figure 3). As shown in Figure 4a, 18 out of 23 stations (excluding stations not in the basin, which we continue to do hereafter) in the basin exhibited wetting trends, while only four stations showed a drying trend, which were mainly distributed in the southern part of PLB. However, trends in the annual SPEI series from all stations were not significant (p < 0.05).
At the seasonal scale, the SPEI exhibited upward trends in the summer and winter during the period of 1958–2017, indicating that PLB experienced a wetting condition in these seasons. In contrast, a decline trend was observed in the spring and autumn SPEI series, which illustrated that a drying tendency dominated the whole basin in spring. Figure 4b,d showed that nearly 70% and 40% of the stations in the basin were characterized by drying trends, and 15 and 31 stations showed a wetting trend, which were mainly situated in the Poyang Lake region. On the contrary, the trend in other seasons exhibited the opposite variation in space (Figure 4c,e). Most of the stations in the basin were characterized by upward trends in summer and winter, indicating that a wetting tendency prevailed in the two seasons, while only three to six stations displayed a drying trend within the central areas in the Poyang Lake region, south and northwest of the basin. It should be noted that the SPEI trends in the four seasons in PLB did not pass the 0.05 significance level test, which meant that all trends of seasonal SPEI were not significant (p < 0.05).
Generally, the above results indicate that PLB was undergoing a wetting process at the annual and seasonal scales from 1958 to 2017, except during spring and autumn. A drying tendency dominated the basin in the spring. Meanwhile, the special characteristics of the trend variations were markedly different in the basin. The areas in which drought was most likely to occur were mainly located in the Poyang Lake region, south and northwest of the basin, respectively. However, all trends in the SPI series were not significant.

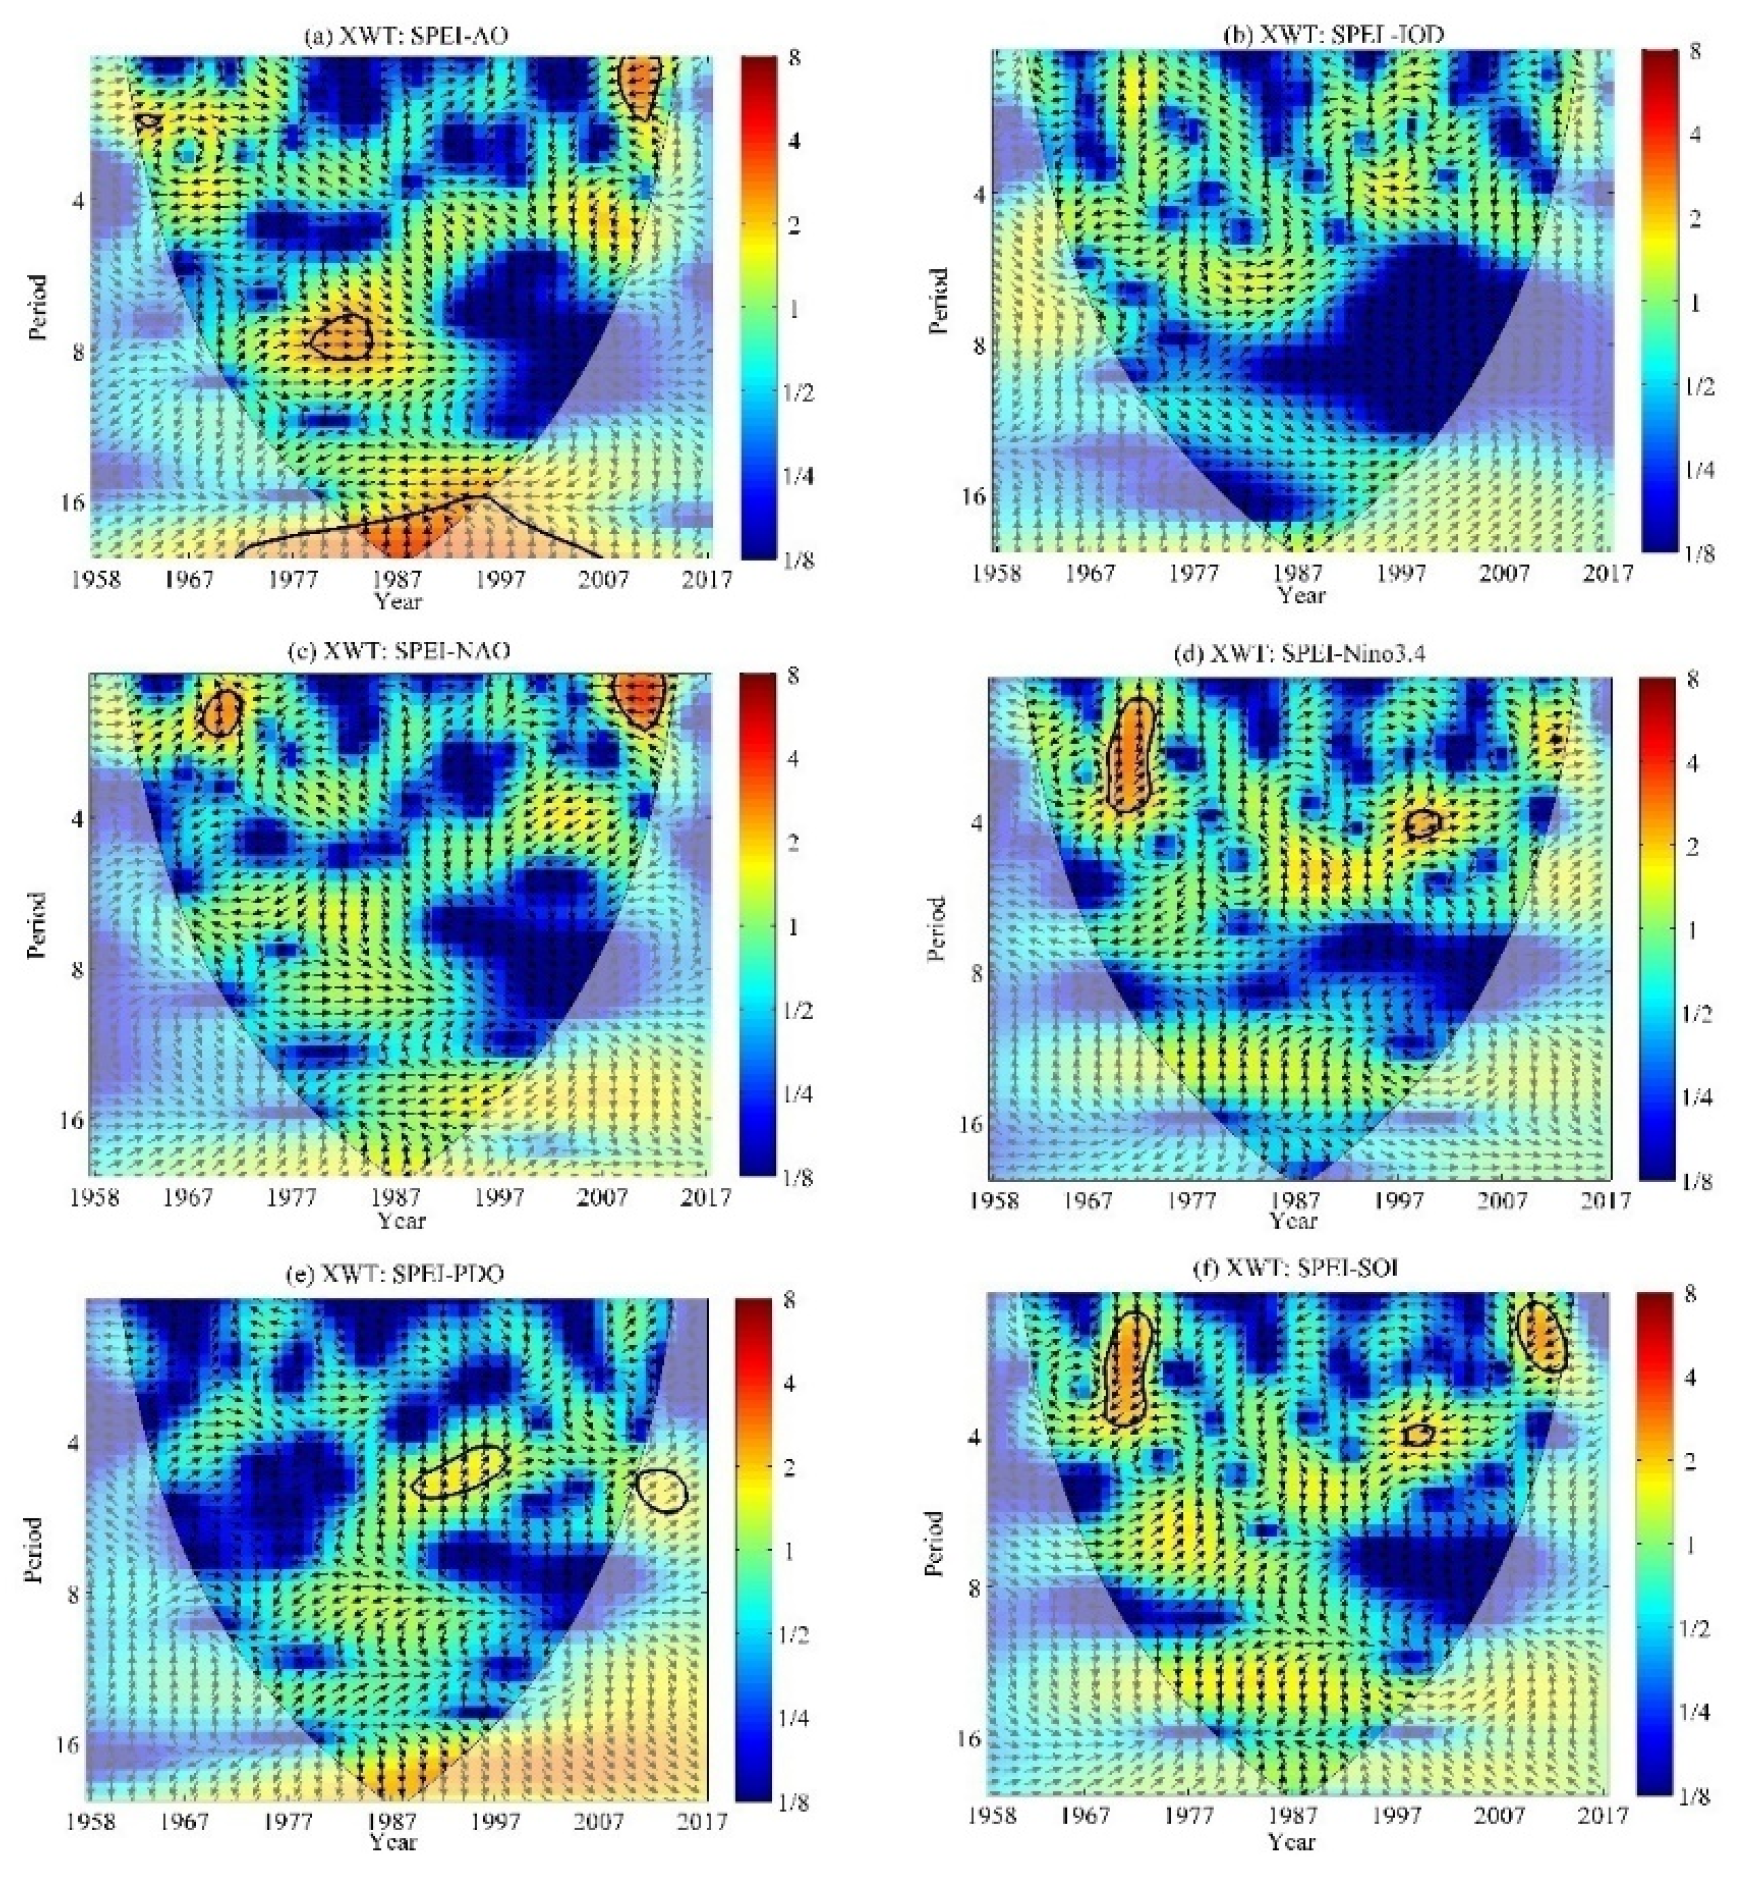
3.3. Links between Drought Variation and Large-Scale Climate Indices

To better understand the mechanisms of droughts in PLB, the relationship between drought and large-scale climate indices was investigated using XWT. Figure 5 presents the cross-wave power spectrum between the SPEI and different climate indices (i.e., AO, IOD, NAO, Niño 3.4, PDO, and SOI) over PLB. The thin black contours display the significant zones with a 5% significance level against the red noise. The colors from blue to red, as shown in the color bar, represent the increasing wavelet power. The relative phase relationships between the SPEI and large-scale climate indices are denoted by arrows. The arrows pointing to the right (left) indicate an in-phase (anti-phase) relationship between the SPEI and climate indices, while vertically upward (downward) arrows illustrate that the climate index led (lagged) the SPEI in phase by 90°.
From the XWT of the SPEI and AO (Figure 5a), it can be found that the SPEI and AO showed significant common power in the 0–3 year band from 2009 to 2012, in the quasi-2-year band from 1962 to 1965, in the 6–9 year band from 1976 to 1984, and in the over 16-year band from 1972 to 2007. At lower time scales (<3 years), arrows in the cross spectrum were observed to point towards both the right and left, which indicates an in-phase (quasi-2-year band from 1962 to 1965) and anti-phase (0–3 years band from 2009 to 2012) relationship between the SPEI and AO, respectively. Comparatively, the common power in the 0–3 year band from 2009 to 2012 was higher than that in the quasi-2-year band from 1962 to 1965, which indicates an obvious anti-phase relationship between the SPEI and AO in the period from 2009 to 2012. In the 6–9 year band, arrows pointed right and in a horizontal direction. At higher time scales (>16 years), arrows were found to point straight up, indicating that AO led the SPEI by 90°, which meant a lag between the SPEI and AO variations.
As shown in Figure 5c, the cross spectrum presented two significant common power zones which the SPEI and NAO shared with the 0–3 year band from 2009 to 2012 and the 2–3 year band from 1962 to 1965. In the 2–3 year band, arrows pointed straight up from 1962 to 1965; this indicates that NAO led the SPEI by 90°—that is, there was a lag between the SPEI and NAO variations. Common powers observed at the 0–3 year band were higher compared to the 2–3 year band. In the 0–3 year band, arrows pointed left and in a horizontal direction from 2009 to 2012, indicating an anti-phase relationship between the SPEI and NAO during this period.
The XWT of the Niño 3.4 and SOI with the SPEI are shown in Figure 5d,f respectively. It can be found that there were clearly common features between the two cross spectra, such as the significant common power in the 1–4 year band from 1969 to 1972 and in the quasi-4-year band from 1999 to 2003. Both cross spectra also had higher power in the 1–4 year band during the period from 1969 to 1972; however, arrows pointed in the opposite direction, implying that the phase relationship between the Niño 3.4 and SOI and the SPEI was reversed. In the 1–4 year band during the period from 1969 to1972, the change in Niño 3.4 was ahead of the SPEI, while the SOI change lagged behind the SPEI by 90°. In addition, another significant common power was still observed in the 1–3 year band from 2008 to 2014 between the SPEI and SOI, with the arrow pointing left. This indicates an anti-phase relationship between the SPEI and SOI during this period.
The XWT analysis of the SPEI and PDO (Figure 5e) showed there also was significant common power in the 5–6 year band from 1989–1999 between the two time series. Arrows in the cross spectrum pointed upward and slightly towards the right, indicating an in-phase relationship between the SPEI and PDO during this period. This led to a lag between the SPEI and PDO variations. For the XWT of the SPEI and IOD (Figure 5b), common powers at different time scales were observed; however, they were not statistically significant, indicating that there was no significant relationship between the SPEI and IOD.
In general, the above analyses clearly demonstrate that the SPEI exhibited a significant temporal correlation with five climate indices (NAO, AO, PDO, SOI, and Niño 3.4) at restricted intervals. The drought had a negative correlation with the NAO, AO, PDO, SOI, and Niño 3.4, whereas it had a positive correlation with the PDO. Comparatively, IOD had an unobvious link with the drought implied by the cross-wavelet spectrum. Moreover, in the whole period of 1958–2017, the dominant influences of the large-scale climate indices on the drought evolutions had been shifted in PLB, from the NAO, Niño 3.4, and SOI before the late 1960s and early 1970s, to the AO and PDO during the 1980s, then to the NAO, AO and SOI after the early 2000s. The NAO, AO and SOI exerted a significant influence on the drought events in the basin.

4. Discussion

Drought due to climate warming has been investigated in numerous regions over the world. Many studies indicated that droughts had become more frequent, and dry areas had extended over many regions of the world due to changes in precipitation patterns and the rising temperature [4,5,6,7]. Influenced by the monsoon climate and the terrain variations, drought is prevalent in China [46,47]. More specifically, since the late 1990s, droughts have become increasingly frequent and severe in China [48,49]. As one of the most sensitive regions of climate change in YRB, the Poyang Lake area is currently in a period of frequent drought [29]. Meanwhile, annual precipitation and temperature in PLB is expected to increase in the future as the results of global warming [50,51] affect the balance of surface water budget and induce more frequent drought events. However, the variations in droughts represent more complicated spatial and temporal patterns in different climatic regions. Therefore, it is essential to understand the spatiotemporal variations of droughts and their mechanisms in PLB for the mitigation and prevention of natural hazards.
This study carried out research on the spatial variation of droughts by full use of the data from 41 meteorological stations in PLB and its surrounding areas (including 23 in the basin and 18 in its surrounding areas), going further than the 13 or 23 meteorological stations in PLB examined in previous studies. Comparatively, a more distinct spatial variability was captured, and reliability problems in terms of the results, caused by the limited number of stations, was avoided to some extent. Our study indicated that the areas in which drought was most likely to occur were mainly located in the Poyang Lake region, south and northwest of the basin.
Additionally, compared with previous studies, this study investigated the characteristics of nonlinear variation and periodicity for the SPEI series in PLB during 1958–2017 by using the EEMD method. On one hand, the nonlinear trends for drought in the basin were observed in the Res by the EEMD method. This was consistent with the results of drought in other regions [52,53,54]. In fact, changes in droughts were demonstrated to be partially affected by nonlinear temporal variations in climatic variables. Therefore, with the influence of climate factors, drought often presents nonlinear and non-stationary complex processes with periodic oscillations [54,55,56]. However, previous research for drought in PLB only investigated linear trends, ignoring the nonlinear responses to climate change, which made them unable to reveal the real variations in droughts at different time periods. Taking annual SPEI as an example, although an overall wetting process during 1958–2017 was detected by both EEMD and traditional trend methods, our study further indicated that the annual SPEI presented apparent non-linear trends, with first a wetting and then a drying trend, suggesting that an obvious transition period from wet to dry occurred in the late 1980s. On the other hand, using the EEMD method, relatively stable quasi-periodic oscillation was also found in the IMFs over PLB from 1958 to 2017, with approximate quasi-3-, quasi-6-, quasi-15- and quasi-30-year periods. All the results indicated that EEMD, as an efficient signal analysis method, showed an excellent ability to precisely reflect the nonlinear characteristics of drought variations by extracting the inter-annual and inter-decadal trends from the SPEI series.
Located in the lower YRB, PLB is mainly dominated by the East Asian Monsoon [57,58]. Meanwhile, the East Asian Monsoon has also been significantly influenced by ENSO, IOD, NAO, and PDO [59,60,61]. Therefore, these also represent possible physical causes of droughts in Poyang Lake Basin. ENSO is one of the most dominant oceanic–atmospheric patterns in the tropical Pacific Ocean region, exhibiting a remarkable impact on the inter-annual variability of the climate in China. ENSO occurred between a warm phase (El Niño, positive index) and a cold phase (La Niña, negative index) on a scale of 2–7 years. As reported by many studies, there was relatively less precipitation in YRB when ENSO appeared in a cold phase [28,58], which may result in a drought. This study showed that the SPEI and ENSO (Niño 3.4) shared a significant common power with the 1–4 year band from 1969 to 1972 and the quasi-4-year band from 1999 to 2003, and ENSO (Niño 3.4) and the SPEI were mostly found in an in-phase relationship. That is, when the Antarctic cold air invaded northward and the sea surface temperature (SST) in the Pacific increased, the SPEI decreased, and PLB exhibited a drought trend.
PDO is another important oceanic–atmospheric pattern found in the North Pacific Ocean, which has a modulation effect on ENSO, thus affecting the precipitation in southern China [58,59]. Similar to ENSO, PDO has also warm and cold phases, with a cycle of around 25–50 years [62]. Our study indicated that the SPEI and PDO showed an in-phase relationship during 1989–1999. Thus, as the PDO decreased, the SPEI decreased and Poyang Lake Basin showed a drought trend; NAO refers to changes in pressure systems in the Atlantic, affecting winter conditions in many parts of the Northern Hemisphere [63]. It has a remarkable impact on the anomalous distribution of summer precipitation over China, especially in the middle and lower reaches of the Yangtze River Basin [58]. The results of our study were consistent with the findings of Wei et al. [64], who found there was less precipitation in the southern Yangtze River regions and southern China regions in NAO’s positive phase year, while in the NAO’s negative phase year, much precipitation occurred in summer in these regions. AO is another main atmospheric mode of the Northern Hemisphere atmospheric circulation [65,66]. The common power in the 0–3 year band from 2009 to 2012 was higher than that in the other bands, which indicated an obvious anti-phase relationship between the SPEI and AO during this period. IOD is a coupled ocean–atmosphere phenomenon, affecting precipitation changes in China [59,67]. In the IOD’s positive phase year, summer precipitation increased in the southern Yangtze River regions, especially the PLB, while in the IOD’s negative phase year, the precipitation in the PLB was less [59,68]. However, our study showed that, although common powers at different time scales were observed, they were not statistically significant, indicating an insignificant relationship between the SPEI and IOD.
Moreover, this study indicated that, in the whole period of 1958–2017, the dominant influences of the large-scale climate indices on the drought evolutions had been shifted in PLB, from the NAO, Niño 3.4, and SOI before the late 1960s and early 1970s, to the AO and PDO during 1980s, then to the NAO, AO and SOI after the early 2000s. The AO, NAO and SOI exerted a significant influence on the drought events in the basin. The above results of this work could provide a better understanding of the relationships between droughts and large-scale climate indices in PLB.

5. Conclusions

In this study, the SPEI was adopted to describe the spatial–temporal variations of droughts in PLB from 1958 to 2017. The multi-scale oscillations of drought were investigated using the EEMD method and the spatial distributions of the trends were analyzed by the MMK and IDW methods. Furthermore, the relationships between the SPEI and large-scale climate indices in PLB were explored through the XWT method. The main conclusions were as follows:
(1) By using the EEMD method, the SPEI over Poyang Lake Basin exhibited relatively stable quasi-periodic oscillation from 1958 to 2017. The oscillation showed approximate quasi-3-year and quasi-6-year periods at the inter-annual scale, while quasi-15-year and quasi-30-year periods were detected at the inter-decadal scale. Moreover, the inter-annual timescale components (IMF1 and IMF2) contributed up to 70% of the variance in the annual and seasonal SPEI, which implied that the inter-annual variation played a leading role in drought variation in PLB.
(2) As estimated by Sen’s slope and MMK methods, PLB as a whole was undergoing a wetting process at the annual and seasonal scales from 1958 to 2017, except for spring and autumn, which showed a drought trend, although all trends in the SPEI series were insignificant. The special characteristics of the trend variations were markedly different in the basin. The areas in which drought was most likely to occur were mainly located in the Poyang Lake region, northwest and south of the basin.
(3) The XWT analysis of the SPEI with different climate indices showed that the SPEI exhibited a significant temporal correlation with five climate indices (NAO, AO, PDO, SOI, and Niño 3.4) at restricted intervals. The drought had a negative correlation with the AO, NAO, Niño 3.4 and SOI, whereas it had a positive correlation with the PDO. Comparatively, IOD had an unobvious link with the drought. In the period of 1958–2017, the dominant influences of the large-scale climate indices on the drought evolutions had been shifted in PLB, from the NAO, Niño 3.4, and SOI before the late 1960s and early 1970s, to the AO and PDO during 1980s, then to the NAO, AO and SOI after the early 2000s. The NAO, AO and SOI exerted a significant influence on the drought events in PLB.

Author Contributions

Conceptualization, W.L. and S.Z.; methodology, W.L. and S.Z.; software, Y.H. and Y.W.; validation, S.Z. and B.W.; formal analysis, S.Z. and L.L.; investigation, S.Z.; resources, W.L.; data curation, W.L. and S.Z.; writing-original draft preparation, W.L. and S.Z.; writing—review and editing, Y.H. and L.L.; visualization, S.Z.; supervision, W.L.; project administration, W.L. and S.Z.; funding acquisition, W.L. All authors have read and agreed to the published version of the manuscript.

Funding

This research was funded by National Natural Science Foundation of China (41761058, 51309130), The Science and Technology Research Program of Jiangxi Education Department (GJJ170980), the Superiority Science and Technology Innovation Team Construction Plan of Jiangxi Province (20171BCB24012), Jiangxi Science and Technology Department Science and Technology Plan Project (20192BAB206047), Nanchang Institute of Technology Graduate Innovation Plan Project (YJSCX20180006). The APC was funded by all of them.

Acknowledgments

The authors are grateful to the anonymous reviewers for their insightful and helpful comments to improve the manuscript.

Conflicts of Interest

The authors declare no conflict of interest.

References

  1. Sahoo, A.K.; Sheffield, J.; Pan, M.; Wood, E.F. Evaluation of the Tropical Rainfall Measuring Mission Multi-Satellite Precipitation Analysis (TMPA) for assessment of large-scale meteorological drought. Remote Sens. Environ. 2015, 159, 181–193. [Google Scholar] [CrossRef]
  2. Sternberg, T. Regional drought has a global impact. Nature 2011, 472, 169. [Google Scholar] [CrossRef] [PubMed]
  3. Ofipcc, W.G.I. Climate Change 2013: The Physical Science Basis. Contrib. Work. 2013, 43, 866–871. [Google Scholar]
  4. Giannakopoulos, C.; Sager, P.L.; Bindi, M.; Moriondo, M.; Kostopoulou, E.; Goodess, C.M. Climatic changes and associated impacts in the Mediterranean resulting from a 2 °C global warming. Glob. Planet. Chang. 2009, 68, 209–224. [Google Scholar] [CrossRef]
  5. Barriopedro, D.; Gouveia, C.M.; Trigo, R.M.; Wang, L. The 2009/10 Drought in China: Possible Causes and Impacts on Vegetation. J. Hydrometeorol. 2012, 13, 1251–1267. [Google Scholar] [CrossRef] [Green Version]
  6. Gao, X.; Zhao, Q.; Zhao, X.; Wu, P.; Pan, W.; Gao, X.; Sun, M. Temporal and spatial evolution of the standardized precipitation evapotranspiration index (SPEI) in the Loess Plateau under climate change from 2001 to 2050. Sci. Total Environ. 2017, 595, 191–200. [Google Scholar] [CrossRef]
  7. Spinoni, J.; Naumann, G.; Vogt, J.; Barbosa, P. European drought climatologies and trends based on a multi-indicator approach. Glob. Planet. Chang. 2015, 127, 50–57. [Google Scholar] [CrossRef]
  8. Palmer, W.C. Meteorological Drought; Weather Bureau US Department of Commerce: Washington, DC, USA, 1965; Volume 30.
  9. McKee, T.B.; Doesken, N.J.; Kleist, J. The Relationship of Drought Frequency and Duration to Time Scales. In Proceedings of 8th Conference on Applied Climatology, Anaheim, CA, USA, 17–22 January 1993; pp. 179–184. [Google Scholar]
  10. Hanson, A.D.; Nelsen, C.E.; Everson, E.H. Evaluation of Free Proline Accumulation as an Index of Drought Resistance Using Two Contrasting Barley Cultivars 1. Crop Sci. 1977, 17, 720–726. [Google Scholar] [CrossRef]
  11. Hong, W.; Hayes, M.J.; Weiss, A.; Qi, H. An Evaluation the Standardized Precipitation Index, the China-Z Index and the Statistical Z-Score. Int. J. Climatol. 2001, 21, 745–758. [Google Scholar]
  12. Bandyopadhyay, N.; Saha, A.K. Analysing Meteorological and Vegetative Drought in Gujarat In Climate Change and Biodiversity, Proceedings of IGU Rohtak Conference, Volume 1. Springer Japan. 2014. Available online: https://www.springer.com/gp/book/9784431548379 (accessed on 24 April 2020).
  13. Park, J.H.; Kim, K.B.; Chang, H.Y. Statistical properties of effective drought index (EDI) for Seoul, Busan, Daegu, Mokpo in South Korea. Asia-Pacific J. Atmos. Sci. 2014, 50, 453–458. [Google Scholar] [CrossRef]
  14. Park, S.; Im, J.; Jang, E.; Rhee, J. Drought assessment and monitoring through blending of multi-sensor indices using machine learning approaches for different climate regions. Agric. For. Meteorol. 2016, 216, 157–169. [Google Scholar] [CrossRef]
  15. Jiang, S.; Yang, R.; Cui, N.; Zhao, L.; Liang, C. Analysis of Drought Vulnerability Characteristics and Risk Assessment Based on Information Distribution and Diffusion in Southwest China. Atmosphere 2018, 9, 239. [Google Scholar] [CrossRef] [Green Version]
  16. Yeh, H.-F.; Hsu, H.-L. Stochastic Model for Drought Forecasting in the Southern Taiwan Basin. Water 2019, 11, 2041. [Google Scholar] [CrossRef] [Green Version]
  17. Zhu, Y.; Chang, J.; Huang, S.; Huang, Q. Characteristics of integrated droughts based on a nonparametric standardized drought index in the Yellow River Basin, China. Hydrol. Res. 2015, 47, 454–467. [Google Scholar] [CrossRef]
  18. Guo, H.; Bao, A.; Liu, T.; Jiapaer, G.; Ndayisaba, F.; Jiang, L.; Kurban, A.; De Maeyer, P. Spatial and temporal characteristics of droughts in Central Asia during 1966–2015. Sci. Total Environ. 2018, 624, 1523–1538. [Google Scholar] [CrossRef]
  19. Yoon, J.H.; Mo, K.; Wood, E.F. Dynamic-Model-Based Seasonal Prediction of Meteorological Drought over the Contiguous United States. J. Hydrometeorol. 2012, 13, 463–482. [Google Scholar] [CrossRef]
  20. Vicenteserrano, S.M.; Beguería, S.; Lópezmoreno, J.I. A Multiscalar Drought Index Sensitive to Global Warming: The Standardized Precipitation Evapotranspiration Index. J. Clim. 2010, 23, 1696–1718. [Google Scholar] [CrossRef] [Green Version]
  21. Zhuang, S.; Zuo, H.; Ren, P.; Xiong, G.; Li, B.; Dong, W.; Wang, L. Application of standardized precipitation evaporation index in China. Clim. Environ. Res. 2013, 18, 617–625. [Google Scholar]
  22. Jin, L.; Zhang, J.; Wang, R.; Zhang, M.; Bao, Y.; Guo, E.; Wang, Y. Analysis for Spatio-Temporal Variation Characteristics of Droughts in Different Climatic Regions of the Mongolian Plateau Based on SPEI. Sustainability 2019, 11, 5767. [Google Scholar] [CrossRef] [Green Version]
  23. Cao, B.; Zhang, B.; Ma, B.; Tang, M.; Wang, G.; Wu, Q.; Jia, Y. Temporal and Spatial Characteristics of Drought in the Middle and Lower Reaches of the Yangtze River Based on SPEI Index. J. Ecol. 2018, 38, 280–289. [Google Scholar]
  24. Wang, Z.; Huang, Z.; Li, J.; Zhong, R.; Huang, W. Temporal and spatial evolution of meteorological drought and vegetation distribution in China basin based on SPEI and NDVI. Trans. China Soc. Agric. Eng. 2016, 32, 177–186. [Google Scholar]
  25. Li, X.; Zhang, Q.; Ye, X. Dry/Wet Conditions Monitoring Based on TRMM Rainfall Data and Its Reliability Validation over Poyang Lake Basin, China. Water 2013, 5, 1848–1864. [Google Scholar] [CrossRef]
  26. Min, S.; Yan, M.; Liu, J. Study on Characteristics of Arid Climate in Poyang Lake Basin. J. Lake Sci. 2013, 25, 65–72. [Google Scholar]
  27. Zhang, Q.; Xiao, M.; Singh, V.P.; Chen, Y.D. Max-stable based evaluation of impacts of climate indices on extreme precipitation processes across the Poyang Lake basin, China. Glob. Planet. Chang. 2014, 122, 271–281. [Google Scholar]
  28. Gu, C.; Mu, X.; Zhao, G.; Gao, P.; Sun, W.; Yu, Q. Changes in Stream Flow and Their Relationships with Climatic Variations and Anthropogenic Activities in the Poyang Lake Basin, China. Water 2016, 8, 564. [Google Scholar] [CrossRef] [Green Version]
  29. Min, Q.; Min, D. Characteristics of Drought Evolution and Countermeasures for Hydrological Drought Prevention in Poyang Lake Area. J. China Hydrol. 2010, 30, 84–88. [Google Scholar]
  30. Liu, Y.; Zhao, X.; Wu, G. A preliminary analysis of the causes of the frequent occurrence of extreme drought events in the Poyang Lake area in the past decade. Resour. Environ. Yangtze Basin 2014, 23, 131–138. [Google Scholar]
  31. Hong, X.; Guo, S.; Ma, H.; Liu, D. Temporal and Spatial Evolution Characteristics of Drought in Poyang Lake Basin Based on SPI and Its Correlation with Lake Water Level. J. China Hydrol. 2014, 34, 25–31. [Google Scholar]
  32. Wang, R.; Peng, W.; Liu, X.; Wu, W.; Chen, X.; Zhang, S. Responses of Water Level in China’s Largest Freshwater Lake to the Meteorological Drought Index (SPEI) in the Past Five Decades. Water 2018, 10, 137. [Google Scholar] [CrossRef] [Green Version]
  33. Mishra, A.K.; Singh, V.P. A review of drought concepts. J. Hydrol. 2010, 391, 202–216. [Google Scholar] [CrossRef]
  34. Zhang, Y.; Hao, Z.; Wang, Y.; Li, M.; Chen, E.; Li, F.; Zhang, Y. Multiscale Characteristics of Drought Based on SPEI and SPI in Association with Climate Index in Taiyuan. Ecol. Environ. Sci. 2014, 9, 7. [Google Scholar]
  35. Sun, Y.; Liu, X.; Ren, Z.; Li, S. Multi-scale drought characteristics and influencing factors in the Loess Plateau from 1960 to 2016. Geogr. Res. 2019, 7, 13. [Google Scholar]
  36. Liu, W.; Liu, L. Analysis of Dry/Wet Variations in the Poyang Lake Basin Using Standardized Precipitation Evapotranspiration Index Based on Two Potential Evapotranspiration Algorithms. Water 2019, 11, 1380. [Google Scholar] [CrossRef] [Green Version]
  37. Ahmad, M.I.; Sinclair, C.D.; Werritty, A. Log-logistic flood frequency analysis. J. Hydrol. 1998, 98, 205–224. [Google Scholar] [CrossRef]
  38. Singh, V.P.; Guo, H.; Yu, F.X. Parameter estimation for 3-parameter log-logistic distribution (LLD3) by Pome. Stoch. Hydrol. Hydraul. 1993, 7, 163–177. [Google Scholar] [CrossRef]
  39. Abramowitz, M.; Stegun, I.A. Handbook of Mathematical Functions; Dover Publications: New York, NY, USA, 1965. [Google Scholar]
  40. Hamed, K.H.; Rao, A.R. A modified Mann-Kendall trend test for autocorrelated data. J. Hydrol. 1998, 204, 182–196. [Google Scholar] [CrossRef]
  41. Sen, P.K. Estimates of the Regression Coefficient Based on Kendall’s Tau. J. Am. Stat. Assoc. 1968, 63, 1379–1389. [Google Scholar] [CrossRef]
  42. Huang, N.E.; Shen, Z.; Long, S.R. The empirical mode decomposition and the Hilbert spectrum for nonlinear and non-stationary time series analysis. Proc. Math. Phys. Eng. Sci. 1998, 454, 903–905. [Google Scholar] [CrossRef]
  43. Wu, Z.; Huang, N. Ensemble empirical mode decomposition: A noise-assisted data analysis method. Adv. Adapt. Data Anal. 2009, 1, 1–41. [Google Scholar] [CrossRef]
  44. Torrence, C.; Compo, G.P. A Practical Guide to Wavelet Analysis. Bull. Am. Meteorol. Soc. 1998, 79, 61–78. [Google Scholar] [CrossRef] [Green Version]
  45. Grinsted, A.; Moore, J.C.; Jevrejeva, S. Application of the cross wavelet transform and wavelet coherence to geophysical time series. Nonlinear Process. Geophys. 2004, 11, 561–566. [Google Scholar] [CrossRef]
  46. Xu, K.; Yang, D.; Yang, H.; Li, Z.; Qin, Y.; Shen, Y. Spatio-temporal variation of drought in China during 1961–2012: A climatic perspective. J. Hydrol. 2015, 526, 253–264. [Google Scholar] [CrossRef]
  47. Li, Y.; Wang, Z.; Zhang, Y.; Li, X.; Huang, W. Drought variability at various timescales over Yunnan Province, China: 1961–2015. Theor. Appl. Climatol. 2019, 138, 743–757. [Google Scholar] [CrossRef]
  48. Chen, H.; Sun, J. Changes in drought characteristics over China using the standardized precipitation evapotranspiration index. J. Clim. 2015, 28, 5430–5447. [Google Scholar] [CrossRef]
  49. Yu, M.; Li, Q.; Hayes, M.J.; Svoboda, M.D.; Heim, R.R. Are droughts becoming more frequent or severe in China based on the standardized precipitation evapotranspiration index: 1951–2010? Int. J. Climatol. 2014, 34, 545–558. [Google Scholar] [CrossRef]
  50. Ye, X.; Zhang, Q.; Bai, L.; Hu, Q. A modeling study of catchment discharge to Poyang Lake under future climate in China. Quat. Int. 2011, 244, 221–229. [Google Scholar] [CrossRef]
  51. Tao, H.; Fraedrich, K.; Menz, C.; Zhai, J. Trends in extreme temperature indices in the Poyang Lake Basin, China. Stoch. Environ. Res. Risk Assess. 2014, 28, 1543–1553. [Google Scholar] [CrossRef]
  52. Li, H.; Liu, L.; Shan, B.; Xu, Z.; Niu, Q.; Cheng, L.; Xu, Z. Spatiotemporal Variation of Drought and Associated Multi-Scale Response to Climate Change over the Yarlung Zangbo River Basin of Qinghai–Tibet Plateau, China. Remote Sens. 2019, 11, 1596. [Google Scholar] [CrossRef] [Green Version]
  53. Hu, Z.; Chen, X.; Chen, D.; Li, J.; Wang, S.; Zhou, Q.; Guo, M. “Dry gets drier, wet gets wetter”: A case study over the arid regions of central Asia. Int. J. Climatol. 2019, 39, 1072–1091. [Google Scholar] [CrossRef]
  54. Wu, M.; Li, Y.; Hu, W.; Yao, N.; Li, L.; Liu, D. Spatiotemporal variability of standardized precipitation evapotranspiration index in mainland China over 1961–2016. Int. J. Climatol. 2020. [Google Scholar] [CrossRef]
  55. Yang, J.; Chang, J.X.; Wang, Y.M.; Li, Y.Y.; Hu, H.; Chen, Y.T.; Huang, Q.; Yao, J. Comprehensive drought characteristics analysis based on a nonlinear multivariate drought index. J. Hydrol. 2018, 557, 651–667. [Google Scholar]
  56. Lin, P.; Zhong Wei, Y.; Hui, Y. Relationship between Drought and Flood Patterns in Eastern China and Pacific Decadal Oscillation in the Past 400 Years. Chin. Sci. Bull. 2014, 60, 97–108. (In Chinese) [Google Scholar]
  57. Zhang, Q.; Xiao, M.; Singh, V.P.; Wang, Y. Spatiotemporal variations of temperature and precipitation extremes in the Poyang Lake basin, China. Theor. Appl. Climatol. 2016, 124, 855–864. [Google Scholar] [CrossRef]
  58. Shao, J.; Wang, J.; Lv, S.; Bing, J. Spatial and temporal variability of seasonal precipitation in Poyang Lake basin and possible links with climate indices. Hydrol. Res. 2016, 47, 51–68. [Google Scholar] [CrossRef]
  59. Chen, W.; Feng, J.; Wu, R. Roles of ENSO and PDO in the link of the East Asian winter monsoon to the following summer monsoon. J. Clim. 2013, 26, 622–635. [Google Scholar] [CrossRef]
  60. Xiao, M.; Zhang, Q.; Singh, V.P. Influences of ENSO, NAO, IOD and PDO on seasonal precipitation regimes in the Yangtze River basin, China. Int. J. Climatol. 2015, 35, 3556–3567. [Google Scholar] [CrossRef]
  61. Linderholm, H.W.; Ou, T.; Jeong, J.H.; Folland, C.K.; Gong, D.; Liu, H.; Chen, D. Interannual teleconnections between the summer North Atlantic Oscillation and the East Asian summer monsoon. J. Geophys. Res. Atmos. 2011, 116. [Google Scholar] [CrossRef]
  62. Tamaddun, K.A.; Kalra, A.; Ahmad, S. Wavelet analyses of western US streamflow with ENSO and PDO. J. Water Clim. Chang. 2017, 8, 26–39. [Google Scholar] [CrossRef] [Green Version]
  63. Hurrell, J.W. Decadal trends in the north atlantic oscillation: Regional temperatures and precipitation. Science 1995, 269, 676–679. [Google Scholar] [CrossRef] [PubMed] [Green Version]
  64. Feng, L.; Wei, F.Y. A predictive model for summer precipitation over China based on upper tropospheric temperature and North Atlantic Oscillation in the preceding spring. Chin. J. Atmos. Sci. 2011, 35, 963–976. (In Chinese) [Google Scholar]
  65. Li, S.; Yang, S.; Liu, X. Temporal and Spatial Variation Characteristics of Precipitation and Its Influencing Factors in the Arctic End of the Qinling-Huaihe River from 1960 to 2013. Progress Geogr. 2015, 34, 354–363. [Google Scholar]
  66. Gong, D.Y.; Wang, S.W. Influence of Arctic Oscillation on winter climate over China. Acta Geogr. Sin. 2003, 58, 559–568. [Google Scholar]
  67. Yan, X.; Zhang, M. Numerical Simulation of the Influence of the Indian Ocean Dipole on the East Asian Monsoon Region during the SST Anomaly over the Eastern Equatorial Pacific. J. Trop. Meteorol. 2004, 20, 375–382. [Google Scholar]
  68. Yuan, H.Z. The Indian Ocean Dipole and Its Relationship with Precipitation over China; Nanjing University of Information Science & Technology: Nanjing, China, 2006. (In Chinese) [Google Scholar]
Figure 1. Spatial distribution of meteorological stations in the study area.
Sustainability 12 03526 g001
Figure 2. The intrinsic mode functions (IMFs) and residual components (Res) of the annual SPEI in PLB from 1958 to 2017 by ensemble empirical mode decomposition (EEMD) and their significance tests.
Sustainability 12 03526 g002
Figure 3. The IMF and Res of the seasonal SPEI in Poyang Lake Basin (PLB) from 1958 to 2017 by EEMD: (a) spring, (b) summer, (c) autumn, and (d) winter.
Sustainability 12 03526 g003
Figure 4. Spatial distribution of annual and seasonal SPEI trends during 1958–2017: (a) Annual, (b) spring, (c) summer, (d) autumn, and (e) winter.
Sustainability 12 03526 g004
Figure 5. Cross-wavelet power spectrum between the SPEI and large-scale climate indices: (a) Arctic Oscillation (AO), (b) Indian Ocean Dipole (IOD), (c) North Atlantic Oscillation (NAO), (d) El Niño–Southern Oscillation (ENSO), (e) Pacific Decadal Oscillation (PDO) Niño 3.4 (f) Southern Oscillation Index (SOI)). (The thin black contour line displays the 95% confidence level against the red noise, and the red and blue colors indicate stronger and weaker wavelet power, respectively.)
Sustainability 12 03526 g005
Table 1. Geographic information of meteorological stations surrounding the Poyang Lake Basin.
NumberIDStationsLongitude
(E°)
Latitude
(N°)
Elevation
(m)
157595Tongshan114.5029.6076.1
257598Xiushui114.3529.02146.8
359696Yifeng114.4728.2491.7
457780Zhuzhou113.1727.8774.6
557789Lihua113.5727.08194.5
657793Yichun114.2327.48131.3
757799Ji’an114.5527.0371.2
857889Guidong113.9526.08835.9
957894Jinggangshan114.1026.35843
1057896Suichuan114.3026.20126.1
1157993Ganzhou115.0025.52137.5
1257996Nanxiong114.3225.13133.8
1358414Taihu116.3030.4571
1458419Dongzhi117.0230.1017.6
1558500Xinyang115.2029.8545.8
1658506Lushan115.5929.351164.5
1758507Wuning115.0729.15116
1858519Boyang116.4129.0040.1
1958520Qimen117.7229.85140.4
2058527Jingdezhen117.1229.1880.9
2158531Tunxi118.2829.71142.7
2258600Jing’an115.2228.5278.9
2358606Nanchang115.5528.3646.9
2458608Zhangshu115.3328.0430.4
2558622Dexing117.3528.5788.5
2658626Guixi117.1528.1960.8
2758633Quzhou118.9029.0082.4
2858634Yushan118.1528.41116.3
2958637Shangrao117.5928.27118.2
3058705Yongfeng115.2527.2085.7
3158715Nancheng116.3927.3580.8
3258718Nanfeng116.3227.13111.5
3358725Shaowu117.4727.33218
3458806Ningdu116.0126.29209.1
3558813Guangchang116.2026.51143.8
3658818Ninghua116.6326.23358.9
3758820Taining117.1726.90342.9
3858911Changting116.3725.85310
3958918Shanghang116.4225.05198
4059092Longnan114.4924.55206.3
4159102Xunwu115.3924.57303.9
Table 2. Classification of dry conditions based on the Standardized Precipitation Evapotranspiration Index (SPEI).
CategoriesMild DroughtModerate DroughtSevere DroughtExtreme Drought
SPEI Values(−1.0, −0.5](−1.5, −1.0](−2.0, −1.5]≤−2.0
Table 3. Period and variance contribution of components of SPEI series in PLB during 1958–2017.
TimescaleStatistics IndexIMF1IMF2IMF3IMF4Res
Annual Period (year)3.1661530
Contribution rate (%)56.5516.321.883.082.18
Correlation coefficient0.742 **0.479 **0.426 **0.1310.079
Spring Period (year)2.905.21320
Contribution rate (%)84.509.293.371.271.56
Correlation coefficient0.905 **0.394 **0.282 *0.261 *0.168
Summer Period (year)2.905.711530
Contribution rate (%)51.4722.6512.8912.590.40
Correlation coefficient0.705 **0.460 **0.419 **0.284 *0.134
Autumn Period (year)3.166.321530
Contribution rate (%)71.6412.5412.061.712.06
Correlation coefficient0.832 **0.1540.401 **0.1650.014
Winter Period (year)3.167.52424
Contribution rate (%)73.0211.194.721.649.44
Correlation coefficient0.836 **0.292 *0.199−0.0060.154
Note: *, ** indicate that the results are significant at 0.05 and 0.01 probability levels, respectively.
Table 4. Modified Mann–Kendall (MK) trends of SPEI on annual and seasonal scales in PLB during 1958–2017.
TimeAnnualSpringSummerAutumnWinter
Z0.1636−0.02930.1202−0.00210.0337
Trend0.0006−0.00010.0002−0.00010.0004

