Article

The Pattern of Non-Roundtrip Travel on Urban Rail and Its Application in Transit Improvement

1
School of Civil Engineering, Beijing Jiaotong University, Beijing 100044, China
2
College of Business Administration, Capital University of Economics and Business, Beijing 100070, China
3
Beijing Urban Construction Design & Development Group Co., Ltd., Beijing 100071, China
*
Author to whom correspondence should be addressed.
Sustainability 2020, 12(9), 3525; https://doi.org/10.3390/su12093525
Submission received: 4 March 2020 / Revised: 17 April 2020 / Accepted: 22 April 2020 / Published: 25 April 2020

Abstract

:
Transit smart card records detail travel information of passengers, which provides abundant data for analyzing public travel patterns. Regular travelers’ information extracted from smart card data (SCD) have been extensively analyzed. However, rare studies have been devoted to non-roundtrips, which account for a relatively large portion of the overall transit ridership, especially in metropolises such as Beijing. This study aimed to reveal the non-roundtrip pattern using the passenger travel data obtained from SCD. Weekly non-roundtrip SCD were used to analyze the spatiotemporal distribution patterns of overall and typical non-roundtrips’ origins and destinations (ODs). Also, subway data and bus data were combined and visualized in geographic information system (GIS). The reasons for frequent non-roundtrips generated in the metropolitan city were inferred. The results demonstrate some detected spatiotemporal patterns of non-roundtrips. It is not surprising that a large proportion of non-roundtrips serve as a rail access to intercity, but there are still many trips of this kind showing a commuting pattern. Merging SCD with bus data, the results also reveal that passengers may choose other modes as a substitute return transportation option due to rail fare or overcrowding problem. This study focused on irregular trips normally neglected in the literature and found that the number of these trips is too large to be ignored in a diversified city like Beijing. Meanwhile, the travel patterns of non-roundtrips extracted can be used to direct the operation strategies for both rail and bus. The research framework raised here could be applied in other cities and comparative analysis could be done in the future.

1. Introduction

In recent decades, China’s economy has developed rapidly, but at the same time, the disease of big cities is becoming more and more serious in Beijing and other metropolises. The number of motor vehicles in cities is huge, and urban roads are saturated. The air quality is also getting worse [1]; city managers and researchers have been looking for many different ways to solve these problems. Urban public transport, especially subway, with its characteristics of punctuality, large traffic volume, energy conservation, and environmental protection, has been strongly supported and rapidly constructed by the government in big cities. In order to improve the operation efficiency of urban public transport, many scholars have established different methods and perspectives to explore the travel patterns in smart card data [2,3,4,5,6], and gave reasonable and practical suggestions for the transport agencies to improve public transport planning and formulate appropriate operation strategies. The essential of better planning and operation is the operation data generated by public transport. The traditional research used questionnaire or census data as data sources, which were expensive to gather, insufficient, and maybe unreliable. Compared with traditional methods, the smart card automatic fare collection system can obtain larger samples and analyze travel behavior in a longer term [6]; it provides an ideal method for daily urban public transport data collection; the use of urban public transport automatic fare collection systems is becoming more and more common worldwide [7]. As Pelletier predicted [8], smart card has become the most widely used payment method of public transportation. At present, more and more researchers are committed to utilizing urban public transport big data in various fields, including urban public transport studies.
The research of Song and other scholars shows that although individual travel history is different, individual travel follows a simple and repeatable mode [9,10,11], and has a high predictability [12], which also provides a scientific basis for applying smart card data into analysis. By using smart card data mining, different travel modes can be analyzed: commuting, shopping, visiting relatives, spring outing, outing, etc. At present, the research mainly focuses on commuting trips, passengers making roundtrips per day, but neglects single trips.
In our study, we define a “roundtrip” by subway as passengers choosing both leaving and returning travels by subway in a roundtrip. Passengers who only ride the subway once a day clearly do not make a roundtrip in the subway network. Thus, we call this type of trip “non-roundtrip”. Through the analysis of one week’s data from the Beijing subway, it is found that the proportion of non-return travel in working days is the same as that of taking the subway twice a day (most of which are commuters). Moreover, there are few studies focusing on this field. So, we suppose a study of this kind of non-roundtrip will be a novel and interesting topic.
This study analyzes the travel behaviors of specific irregular passengers through travel rules based on smart card data (SCD) and summarizes the regularity of various events from time and space perspectives. The contributions of this study are summarized as follows:
  • Combined with the bus data, this research infers the possible reasons for repetitive non-return travel, and might raise suggestions for the optimization and integration of the public transport in Beijing;
  • Unlike previous research, that has typically focused on regular commuting trips, this study reveals hidden patterns of non-roundtrips that may shift the focus of smart card data-based research from regular commuting trips to those trips of not so typical commuters, but its number is too large to be ignored.
The remainder of this work is as follows: The existing literature is summarized in Section 2. Section 3 describes the analysis process, dataset, and preliminary statistics. Section 4 presents the analysis on the travel patterns of all non-roundtrip travels. Section 5 describes further pattern recognition of typical origins and destinations (ODs) and the analysis combined with bus data. Finally, Section 6 summarizes the concluding remarks.

2. Literature Review

Spatiotemporal pattern analysis has always been an important method for studying urban mobility and traffic characteristics. These patterns could be applied in transport planning, design, and operation. The constant development of public transit had emphasized the importance of forecasting travel demands, which has led to studies on the relationship between different land uses, and the spatiotemporal patterns have become more important [13,14,15]. Nowadays, we can analyze spatial and temporal travel patterns at the micro scale with SCD for more accurate and meaningful guidance of urban traffic planning.
Previous studies extracted travel patterns from transit data, including trip chains, urban mobility, and the spatiotemporal patterns of trips. Spatiotemporal travel behavior at the network level is easy to determine by dynamic visualization [16]. Li et al. constructed a model to study the influence of congestion price and reward strategy on morning commute mode conversion decision-making of car travelers [17]. Some studies used simple statistics to reveal many patterns. With a long data period (e.g., one month), simple analysis of variations in trip patterns could help understand how passengers’ daily travel patterns or trip frequency vary temporally and spatially [18]. Long and Thill [19] combined bus SCD for a one-week period with a one-day household travel survey and a parcel-level land use map to identify job–housing locations and commuting trip routes in Beijing. They obtained solid identification results based on features extracted from existing surveys or censuses. In addition to the study on the travel mode of residents in big cities, Hu and other scholars [20] also investigated the one-week travel mode of residents in a small city in China, and proposed suggestions on optimizing land use for the future planning and transformation of the travel mode of small cities into non-motor vehicle travel. Some scholars have also analyzed the factors that may affect commuters’ travel by constructing structural equation models, logit models [21], multiple logit models [22], etc., which mainly include: income, weather, distance between OD (origin–destination), gender, age, and built environment [23,24].
In order to analyze the temporal and spatial patterns of passenger travel, passengers are usually divided into different clusters according to their different travel characteristics. Several clustering algorithms have been applied to detect the historical travel patterns of transit riders. The K-means++ clustering algorithm has been used to cluster and classify travel pattern regularities, and the results revealed significant connections between the demographic attributes of users and activity patterns [25,26]. Cheng’s study aimed to understand travel behavior in small underdeveloped cities in China and his results showed that the K-means clustering method can effectively capture the heterogeneity of public bus users [27]. Some researchers have applied a generative model-based clustering approach to discover groups [28,29]. Inspired by the previous studies, Briand et al. [30,31] presented a mixture model clustering approach that they called a two-level generative model, combining the topic and Gaussian mixture models. Their results demonstrated the efficiency of the proposed approach, and a five-year longitudinal analysis showed the relative stability of public transport usage.
A review of other research showed that the use of SCD is quite comprehensive because of the smart cards record numerous boarding and alighting details, including the card ID, the timestamp of the boarding and the alighting, and technical details related to the ticketing machine [32]. Many researchers concentrated on commuting trips or roundtrips because there are more regularities that can be found in roundtrips. There are some seemingly abnormal trips that also have underlying patterns and imply travel rules. Scholars have also analyzed some strange travel patterns and the corresponding characteristics from unique aspects. A zero-inflated ordered probit model and a Cox proportional hazards model were estimated by Cheng [33] based on the Nanjing Travel Survey data to investigate how the built environment affects active travel behavior. Some studies analyzed the reasons why some passengers often travel in excess [34]. Long et al. [35] combined SCD with a household travel survey to focus on the travel patterns of four types of extreme transit behaviors: early birds, night owls, and tireless and recurring itinerants. Their results would help guide urban governance and planning. This study focuses on the non-roundtrip, which has not been studied by smart card data mining. We constructed a framework to analyze such trips by integrating subway and bus card data in order to obtain their temporal and spatial characteristics. We also analyzed possible reasons for generating such trips, which could help the decision-making process for transportation management departments.

3. Methodology and Datasets
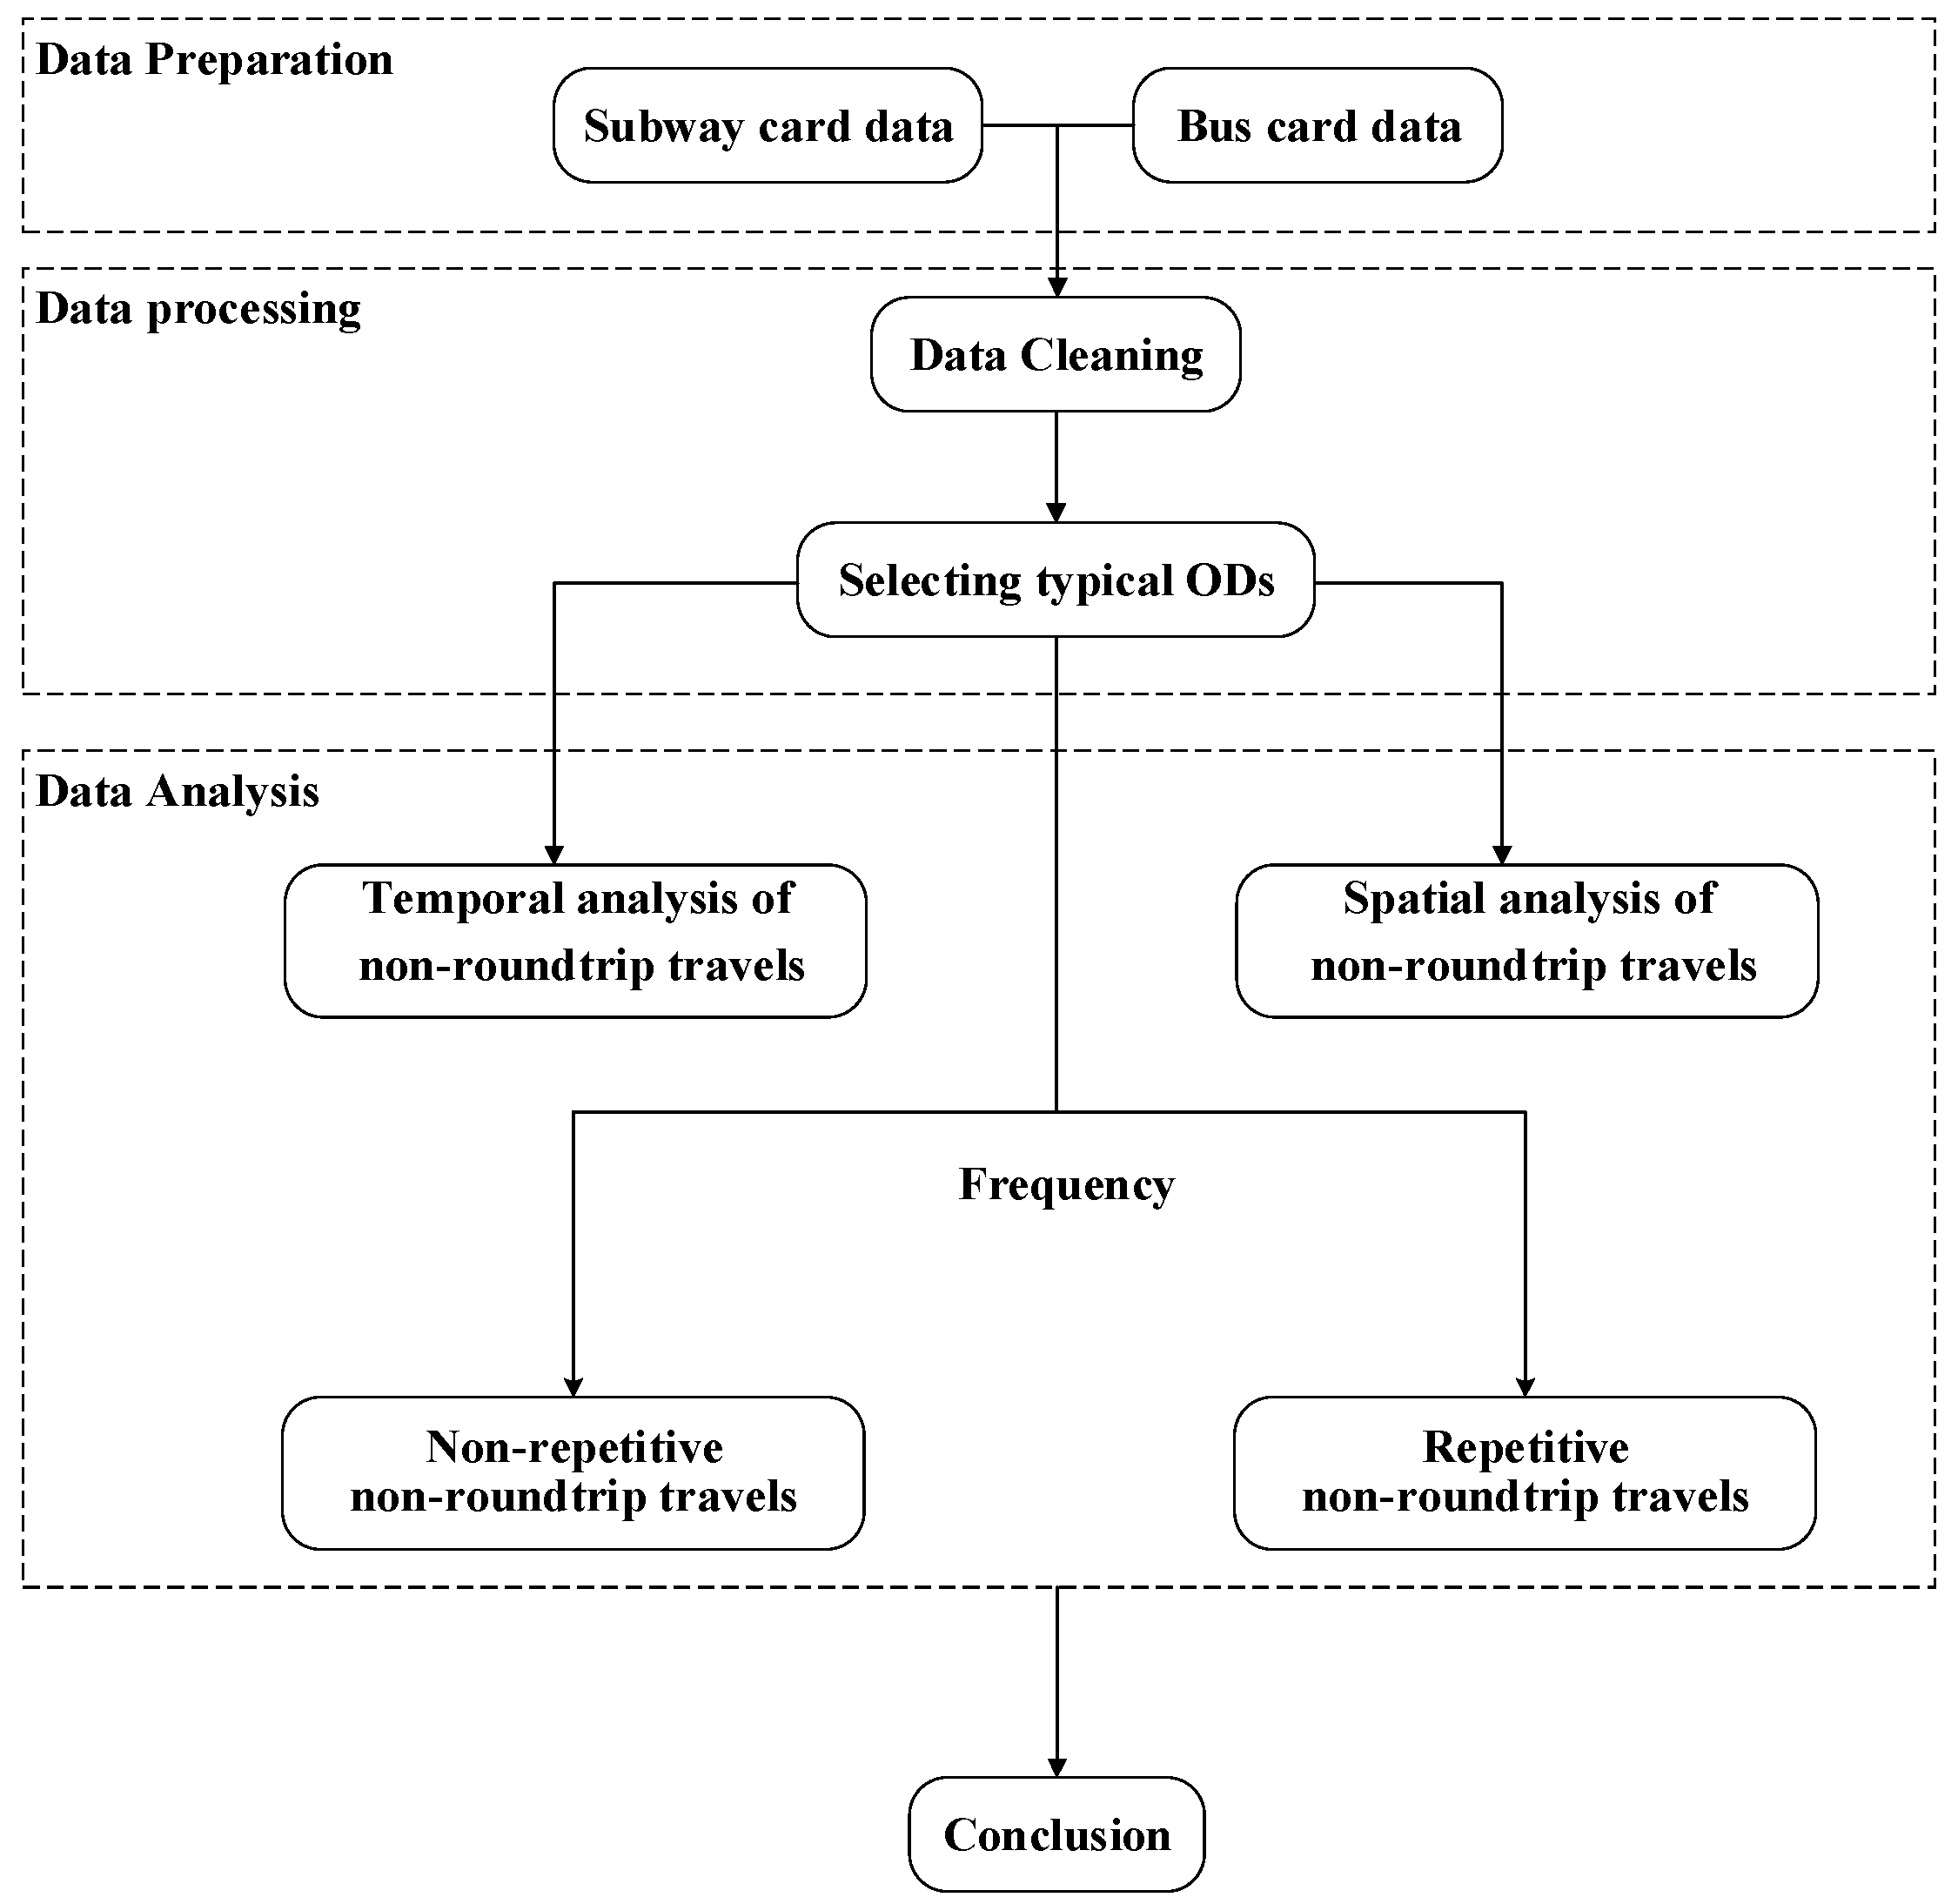
This study used one week of SCD, including subway and corresponding bus data, as well as geocoded transit network data. Data cleaning was performed to analyze the trip frequency with statistical tools. We defined the trip as when the passenger only takes the subway once a day as non-roundtrip travel, as mentioned. Non-roundtrip travels were categorized into two groups: frequent group and occasional group, based on the non-roundtrip travel frequency in a week. Then, each trip recorded in the SCD was used to analyze the spatiotemporal patterns for both the frequent and occasional categories according to the boarding and alighting time and location. Frequent non-roundtrip travels were merged into a new dataset to explore travel patterns. Then, the OD list was derived from the line and station code tags in the new dataset were sorted by trip numbers. Typical ODs were selected for further classification by temporal patterns and used to generate trip chains to evaluate the traffic service level combined with bus data. Finally, we visualized the spatiotemporal patterns using geographic information system.

3.1. Study Protocol

3.1.1. Research Framework

The technical route of this study is shown in Figure 1.

3.1.2. Methodology

The methods used in this study are quite straight forward. For trip extraction from the very big dataset and metro-bus data fusion, we used Structured Query language (SQL) programming in Oracle environment. As for the visualization of the spatial pattern of the non-roundtrip, the GIS tool could be used. In the smart card dataset, all the rail lines and stations are coded, and so is the rail network data in GIS. According to the unique code, the two datasets could be merged and thus the ODs and passenger volume could be visualized in GIS to help find the travel pattern.
In order to analyze the hidden reasons of non-roundtrips, the K-means algorithm, which can better capture heterogeneity [27], was used in this study to classify these trips into different categories. First published in 1955, the K-means method is a kind of iterative clustering analysis algorithm [36], in which k objects are randomly selected as the initial clustering center, then the distance between each object and each clustering center is calculated, and each object is allocated to the nearest clustering center. The cluster centers and the objects are assigned to them, representing a cluster, and for each sample assigned, the cluster centers are recalculated based on the existing objects in the cluster. This process will be repeated until some termination condition is met. What we adopted was the local minimum of the sum of squared errors. In this study, the temporal characteristics of the non-roundtrips were used to generate different clusters.

3.2. Datasets

3.2.1. Geocoded Transit Network Data

As a mega city with more than 20 million inhabitants, Beijing has a large public transit system, with 1020 bus lines, 19 subway lines, and 345 stations (repeated counts for interchange stations) at the end of 2016. The total length of the Beijing subway reaches 574 km, which carries more than 10 million passengers daily on average. In order to facilitate management and simplify operations, the Beijing subway and public transport imported the Automatic Fare Collection (AFC) system in 2008 to achieve a “one-card pass” and intra-mode barrier-free transfer. Today, almost 85% of passengers in Beijing use a smart card [37], which provided enough data for this study to extract information to find out the travel patterns of Beijing residents.

3.2.2. SCD Datasets

In this study, anonymous subway SCD for seven days in a week, from Monday to Sunday between 29 February and 6 March 2016, were used. In this dataset more than 5 million validations were made by about 3 million cardholders, which were combined with the required bus data for the same time span.
We clustered passengers in terms of different travel demands represented by daily trip frequencies in order to extract the travel patterns. Table 1 displays the passenger distribution with various daily trip frequencies for the whole week. Passengers who traveled twice a day accounted for over 40% of the ridership on both weekdays and the weekend, ranking first except for Sunday. This result indicates that most of the subway rides were roundtrips. This ratio slightly declined on the weekend compared with weekdays. That is because roundtrips are mostly generated by the commuters. Unexpectedly, passengers who traveled only once a day had the second-highest share of the ridership, and the percentage was close to roundtrip proportion. This result shows that the non-roundtrips take a big part of the total trips, and it is meaningful to further analyze their characteristics.
The trip frequency varied on different days in a week of the same cardholder. We classified cards used in the observed week into five groups according to the trip frequency in one day: no travel, once, twice, three times, and more than three times. We obtained the travel frequency shift pattern of passengers between groups during the week, as shown in Figure 2.
Passengers who traveled twice accounted for the highest proportion of travelers. They represented the group with fixed demands (e.g., commuting, going to school) and tended to always make roundtrips during weekdays. For passengers traveling once a day with flexible travel demands (e.g., shopping, visiting friends, arriving or leaving the city), around 50% made no trip on the next day, and the proportion approached 70% on weekends. Irregular information represents the disorder of their travels, which were recognized as accidental travel demand. On weekdays, about 20% of these passengers shifted to the group that traveled twice a day on the next day. Besides this, there were generally no regularities of the group traveling three or more times in a given day; this group accounted for a smaller share and made random trips.

4. Spatiotemporal Patterns of Non-Roundtrip Travels

As discussed above, passengers who made only one trip a day in the subway system accounted for a significant part of the total daily demand. However, why did so many people make such non-roundtrip travel? Closer observation of continuous trip frequency and spatiotemporal patterns of non-roundtrip travel could help understand and explain this phenomenon.

4.1. Frequency of the Next Trip after the Non-Roundtrip Travel

Demand for non-roundtrip travels was uncertain. Passengers who traveled once in a day were observed. We set Monday as the observation start point and observed the passengers’ next trip and frequency. If the observed person traveled on the following days, we did not try to find them on the subway system and took them out of the dataset. Figure 3 shows the results. Only about half of the passengers showed up on Tuesday, and just a few took trips on the following days. In total, 78.2% of passengers traveled once on Monday and appeared in the following days, in which 61.3% still traveled once a day later in the week. This figure shows that non-roundtrip travelers travel randomly on the following days and proves that this kind of travel was mostly accidental, which is why few studies have focused on these travelers, but through spatial-temporal analysis, we tried to find some implied patterns.

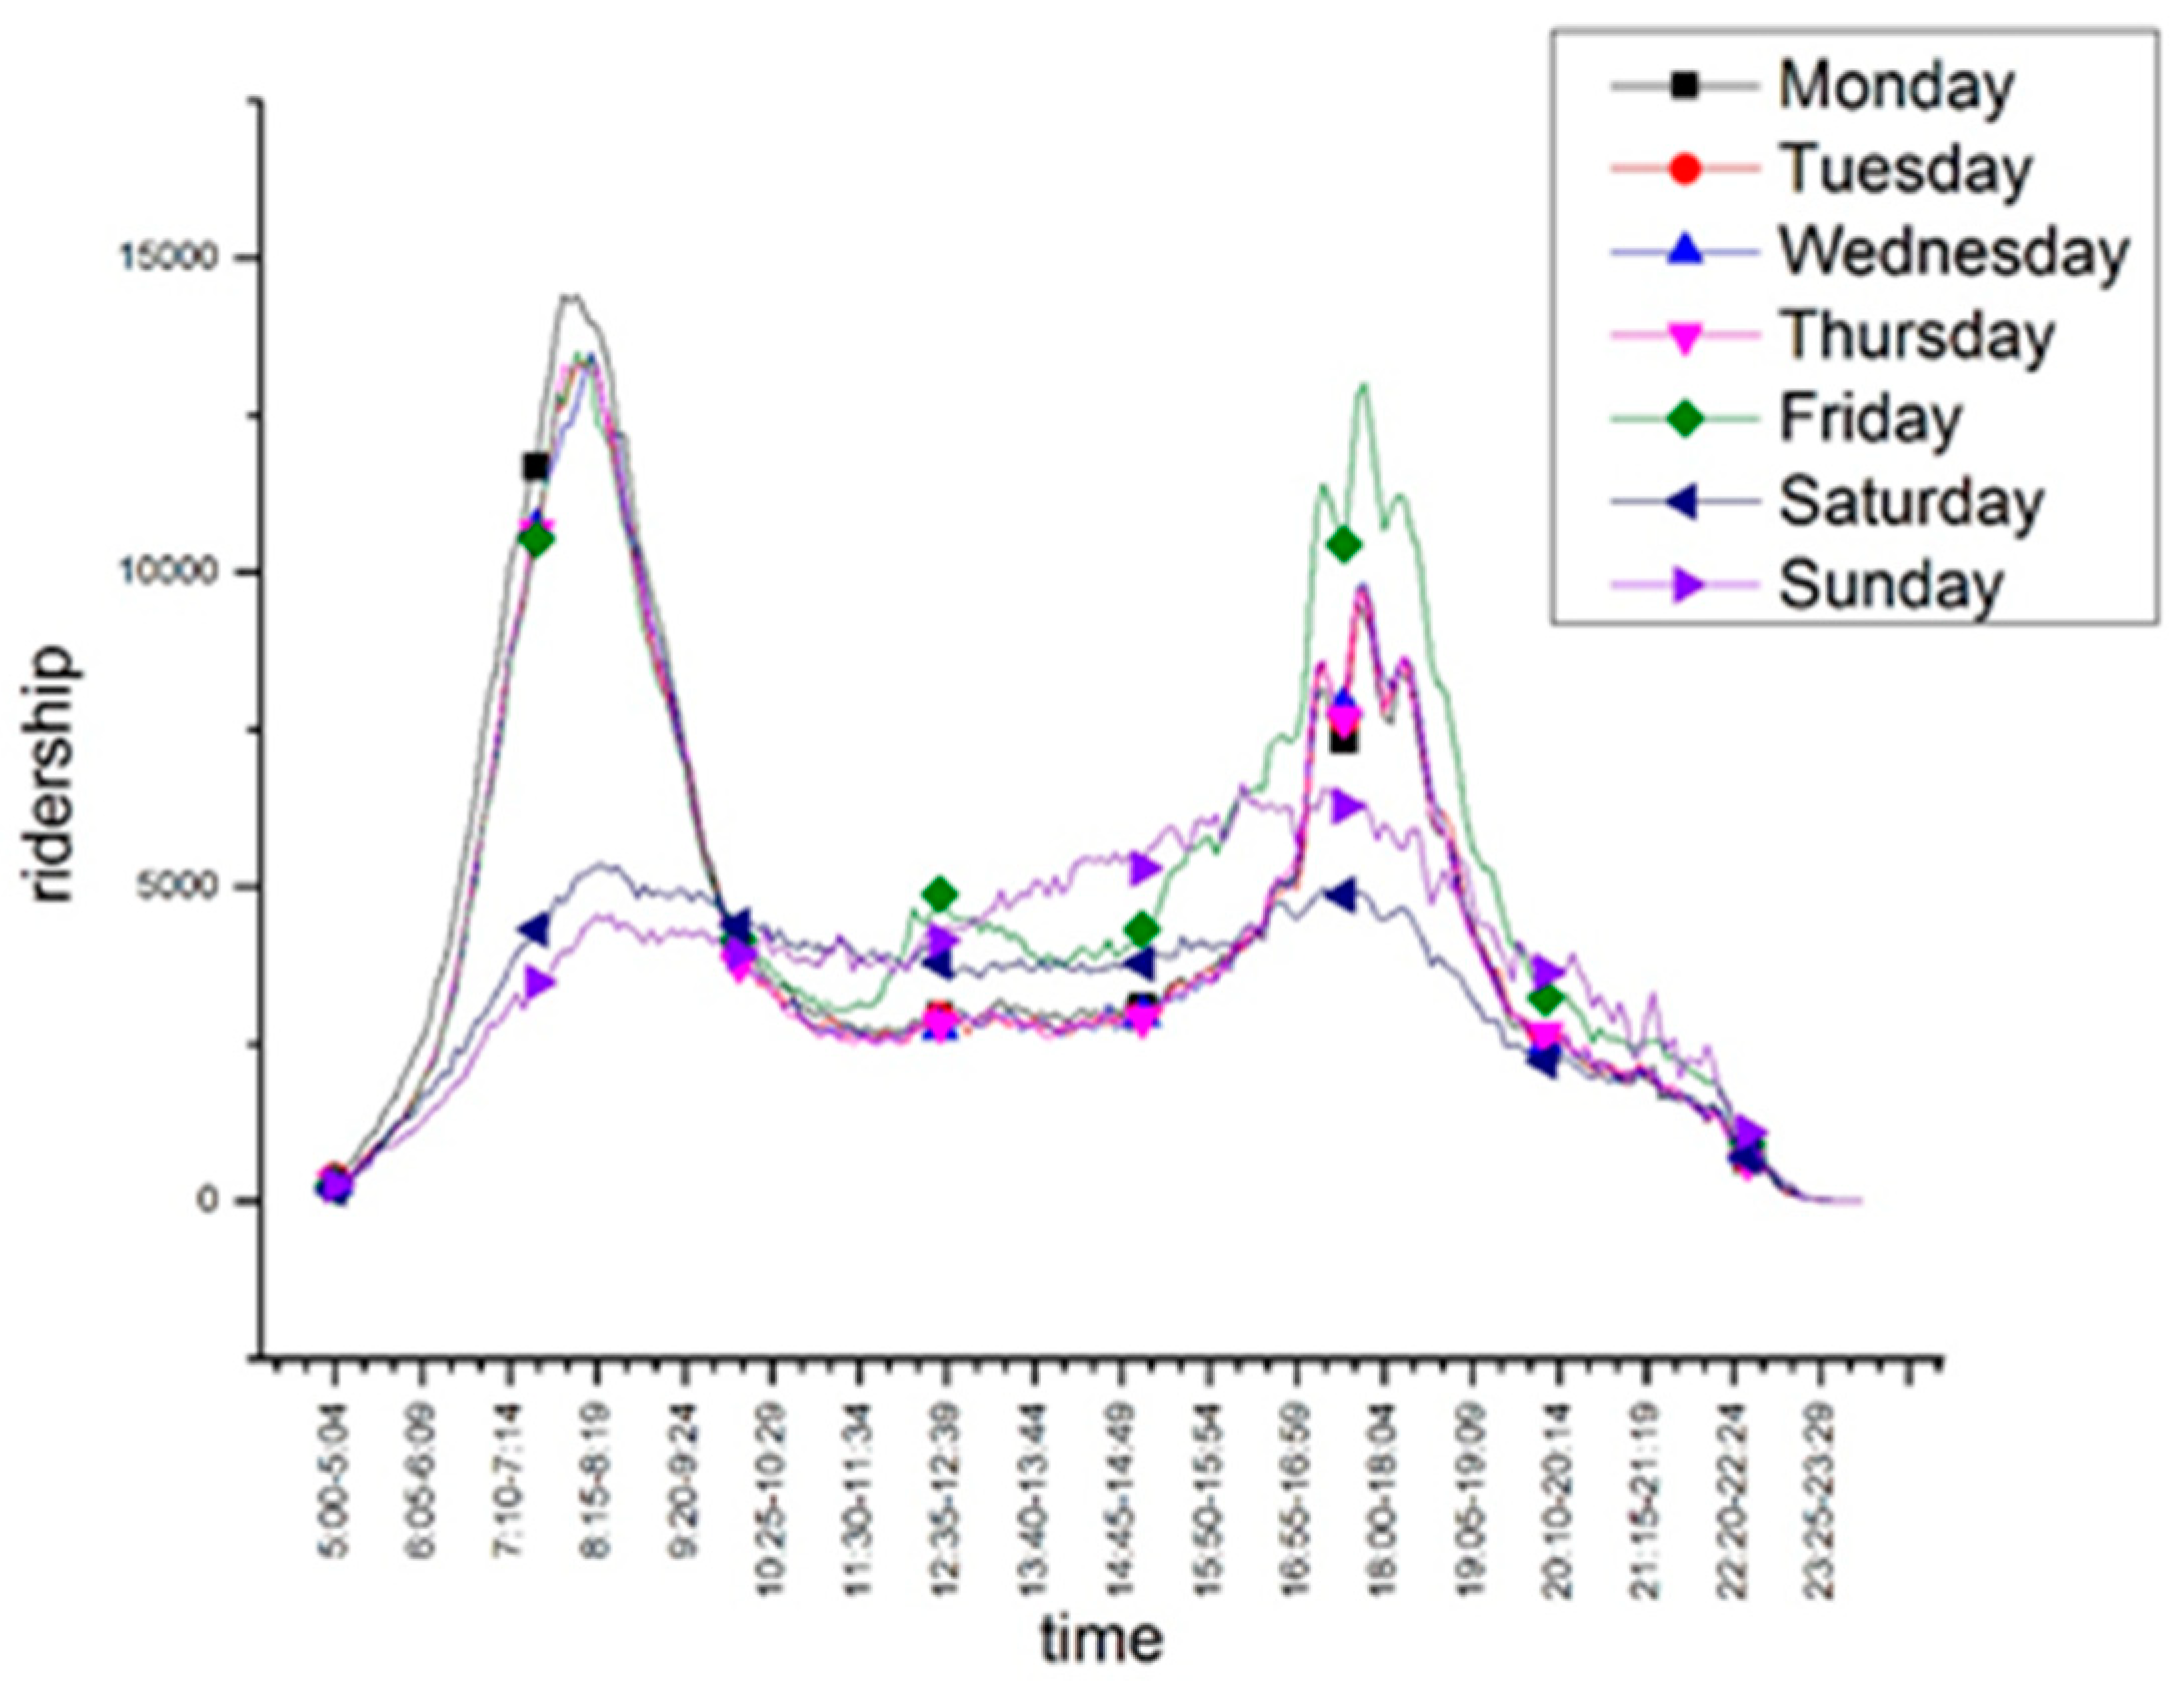
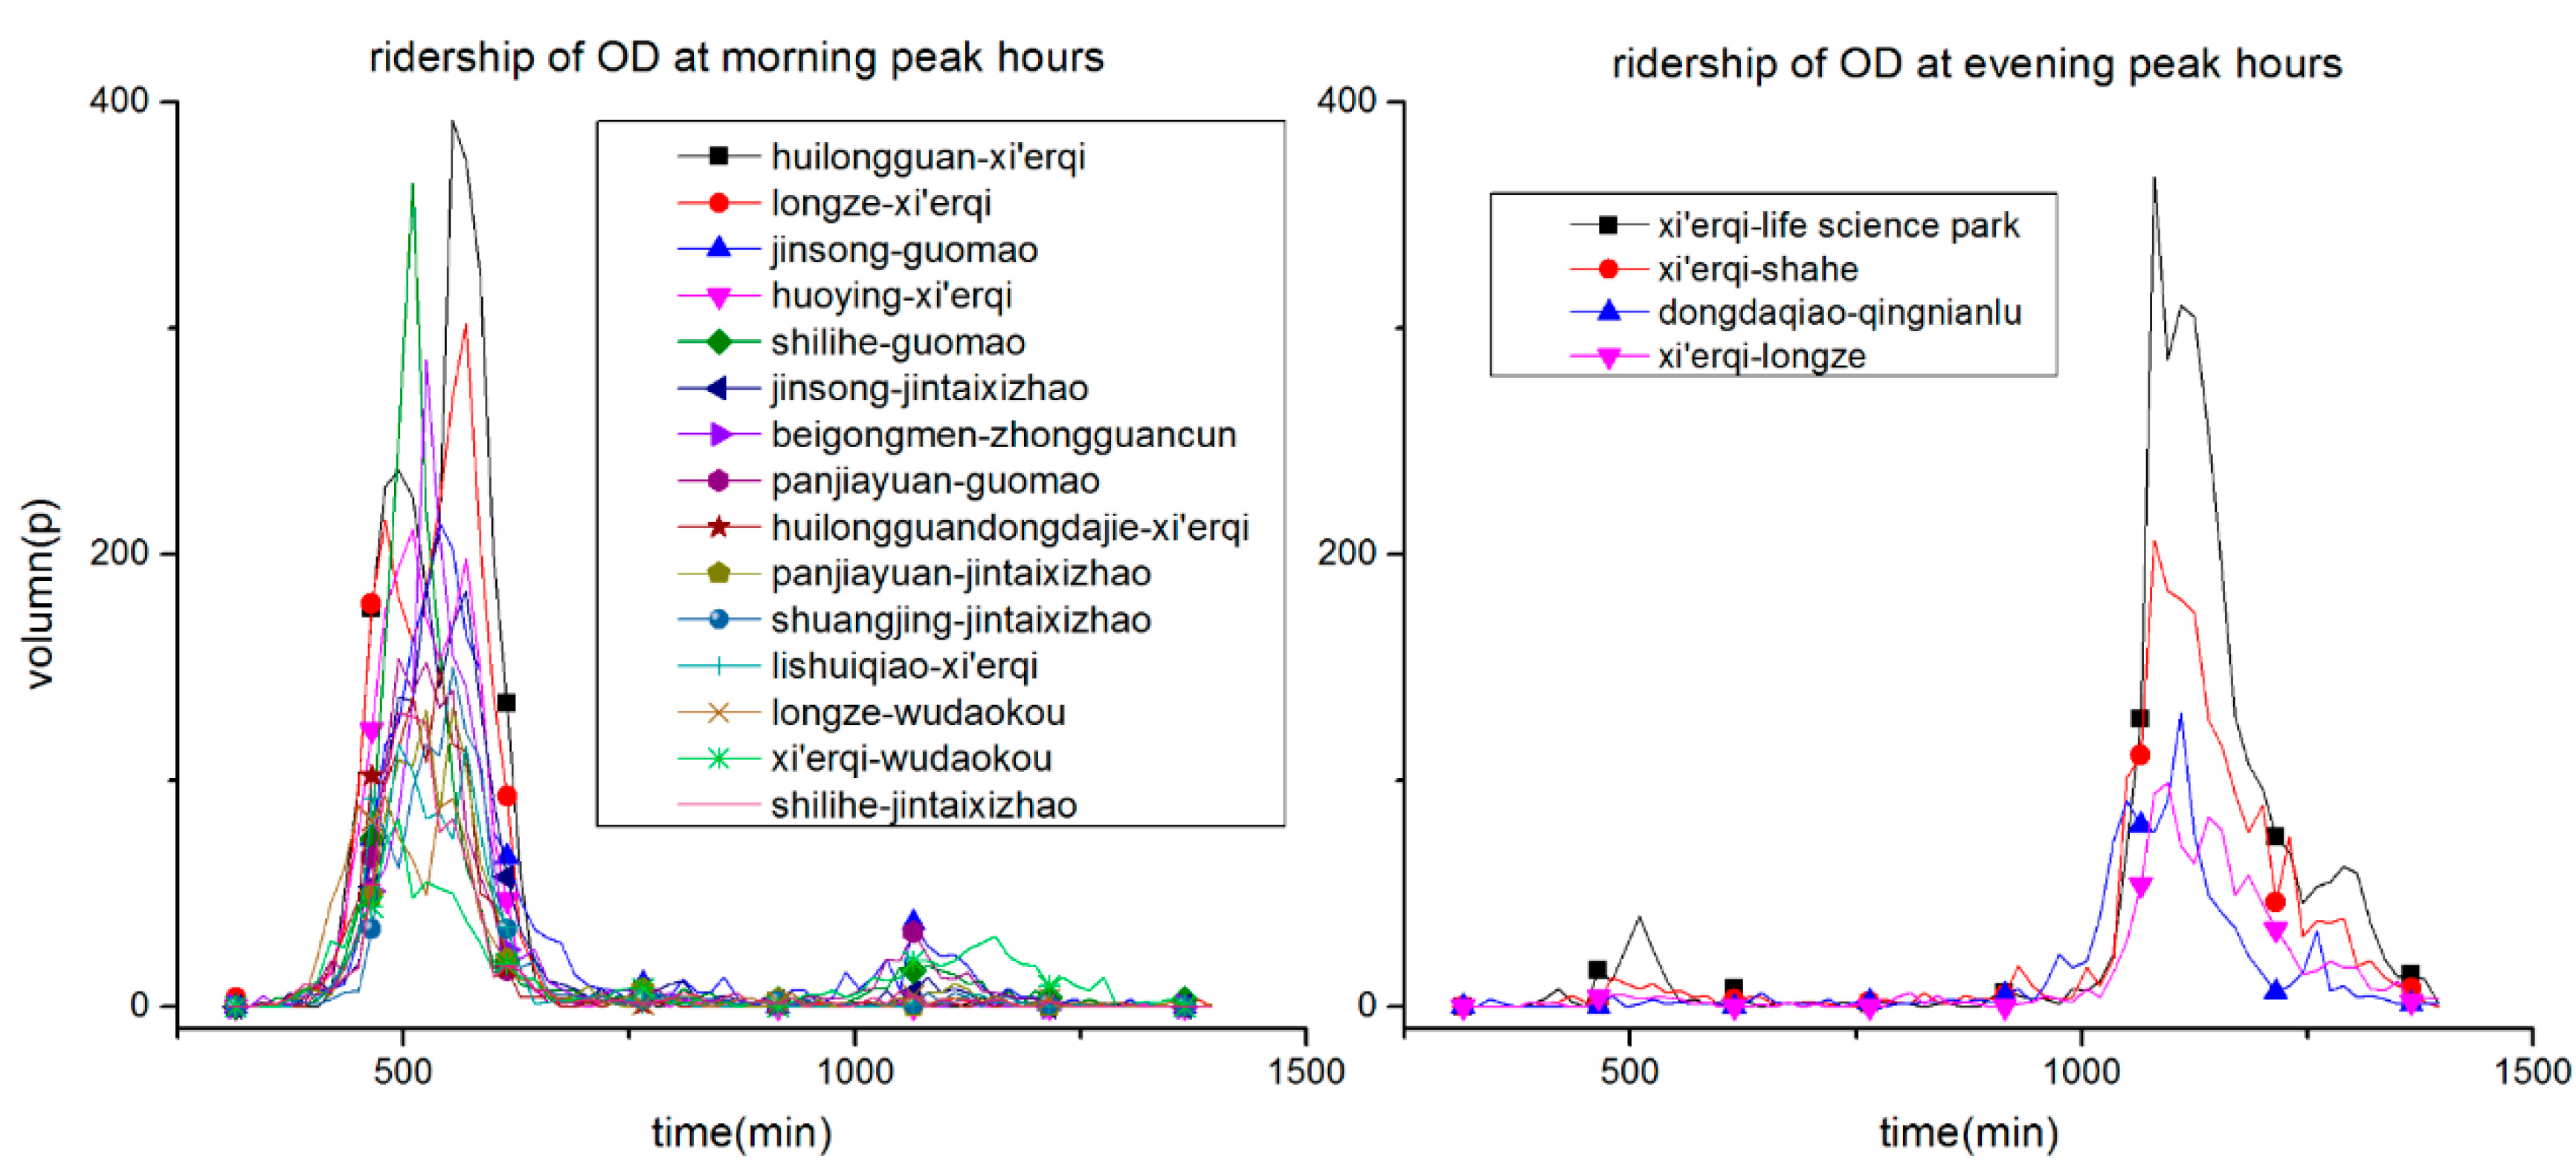
4.2. Temporal Patterns

Temporal patterns could be extracted by using the passengers’ boarding time recorded in the SCD. Previous research revealed that the temporal patterns of passengers’ boarding time had two peaks because the majority of these travels were commuting trips. The passengers’ boarding time distribution of non-roundtrip travels was quite similar, as shown in Figure 4. There were morning and evening rush hours on weekdays, with slightly more passengers in the morning. There were also two small peaks on weekends. Based on the differences in peaks on weekdays, there was an obvious passenger increase on Monday morning and Friday evening due to weekend activities, which is consistent with the general rule of residents in the traffic survey. Because of personal demands, people choose to alter routine trips after work on Friday and go back to work on Monday morning. Short breaks on the weekend increased the number of non-roundtrip travels that made up the overall demand.

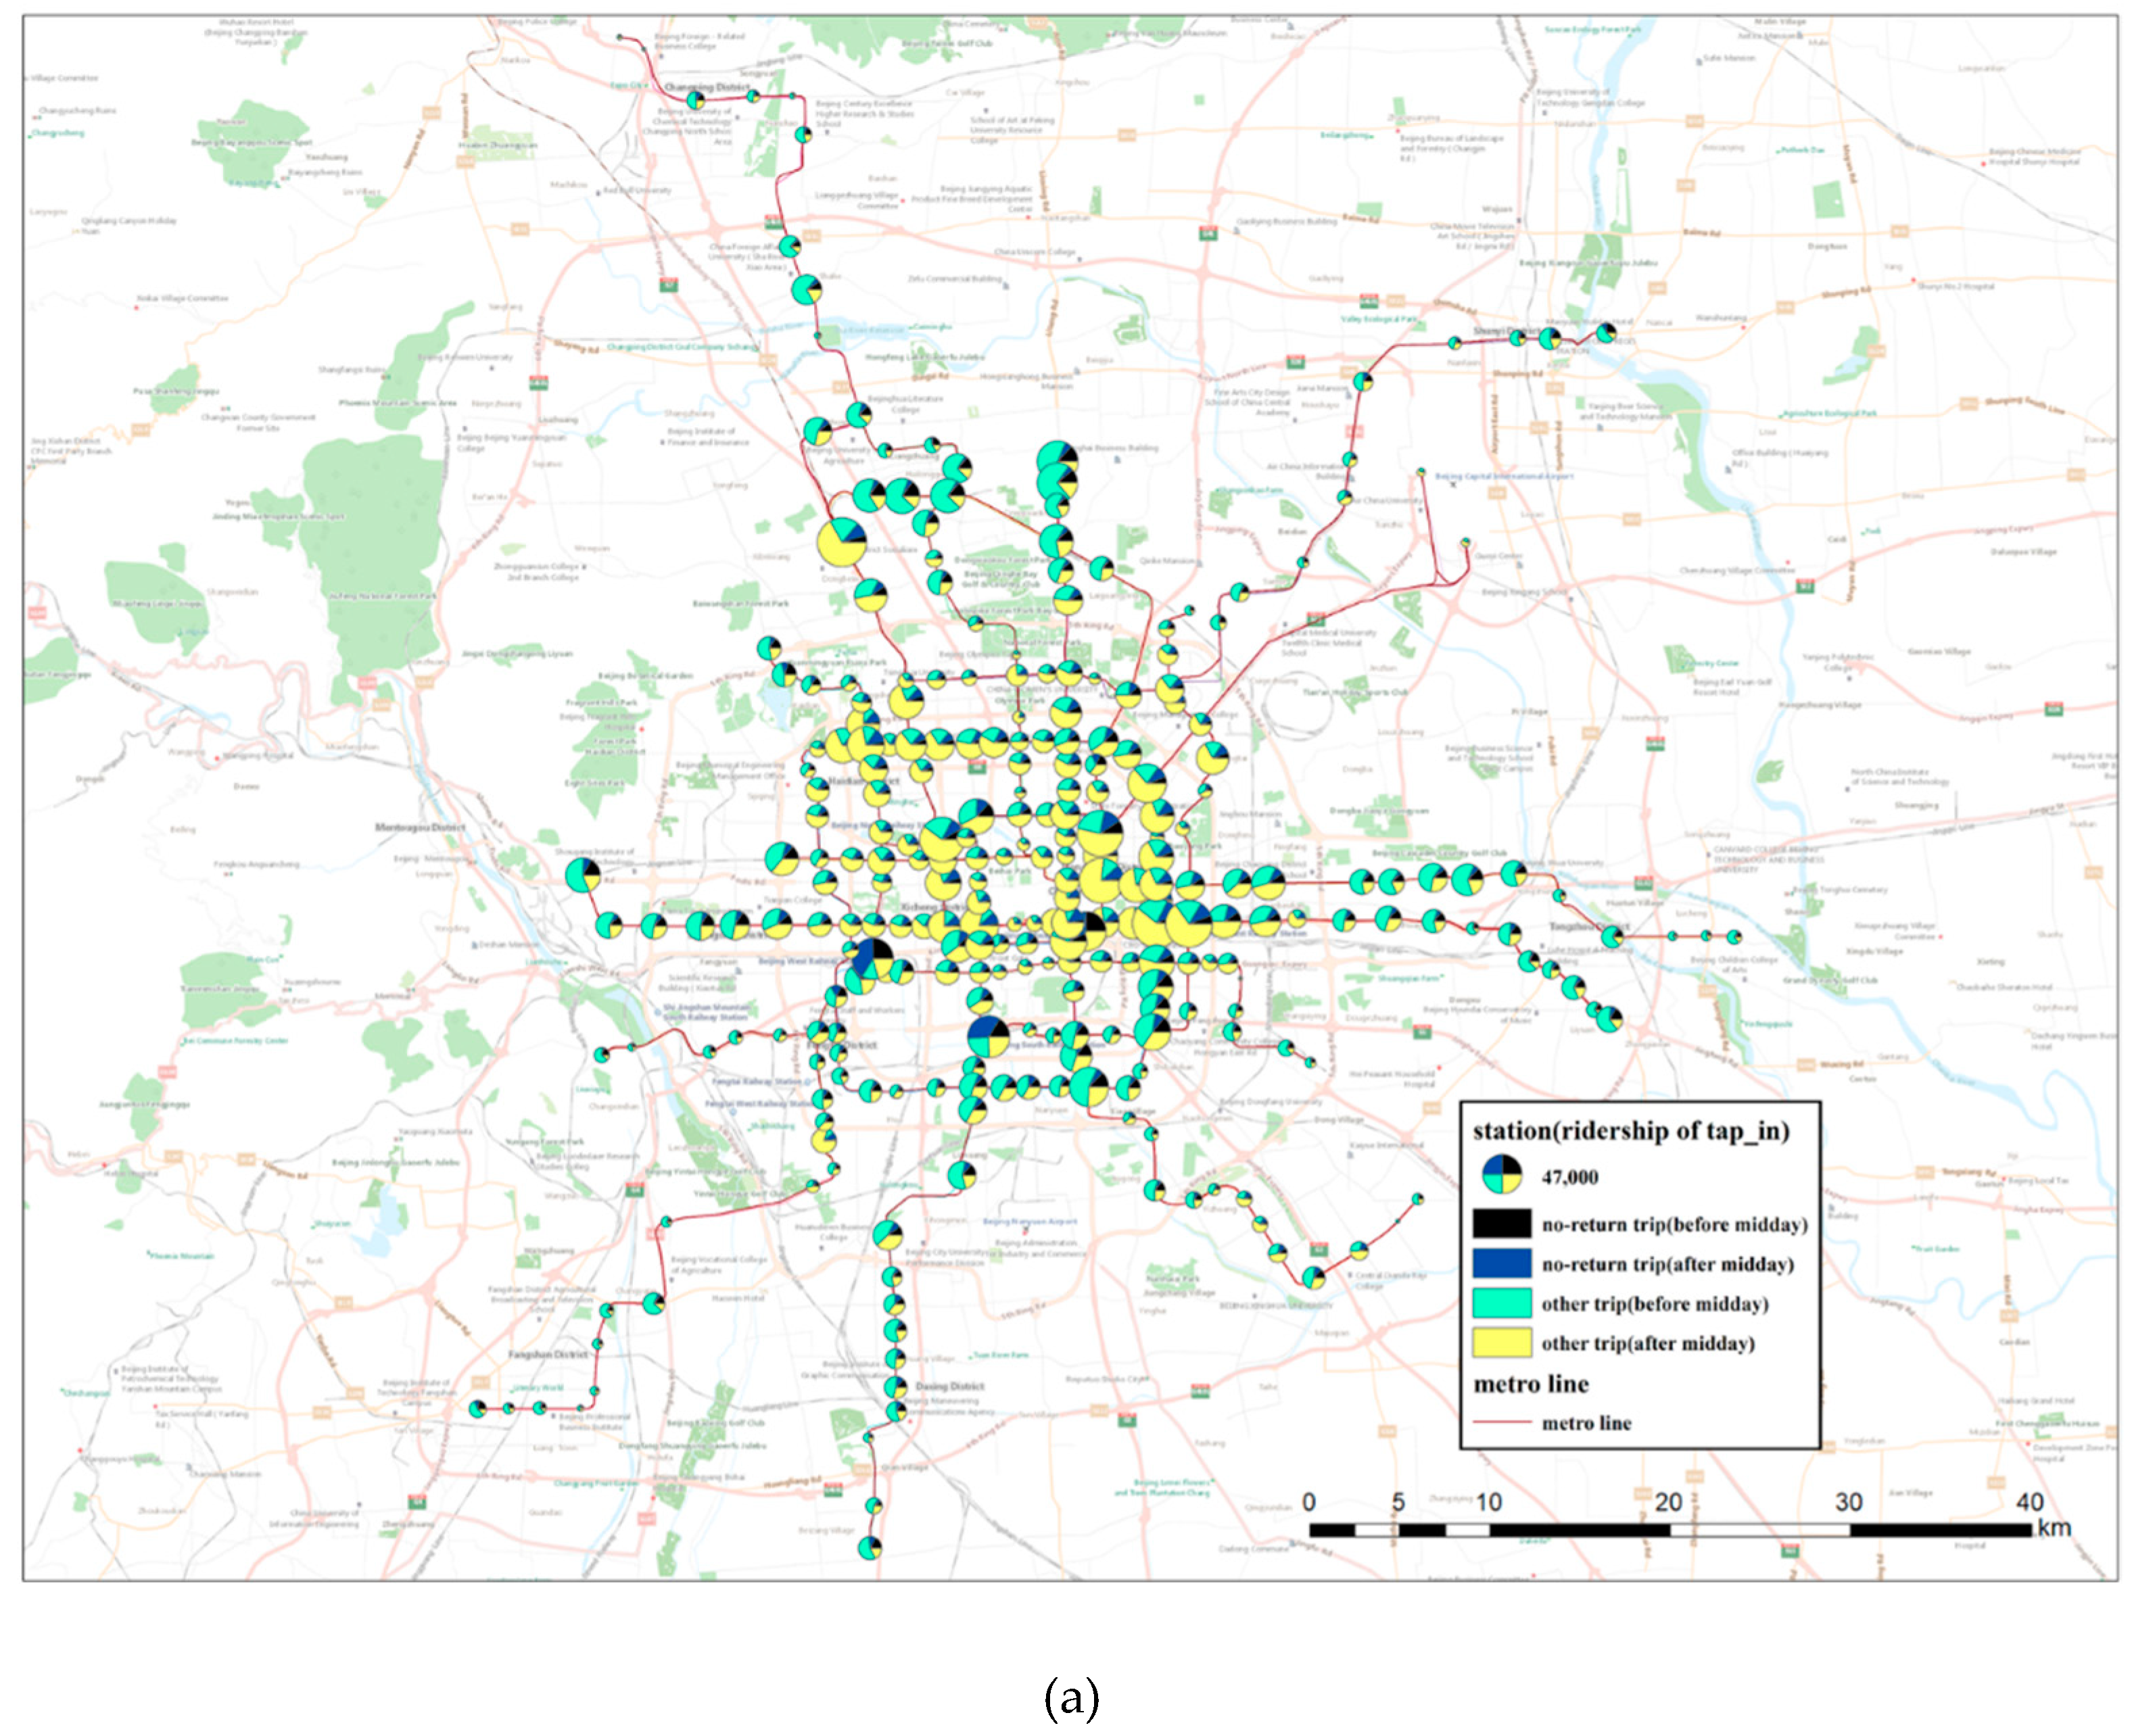
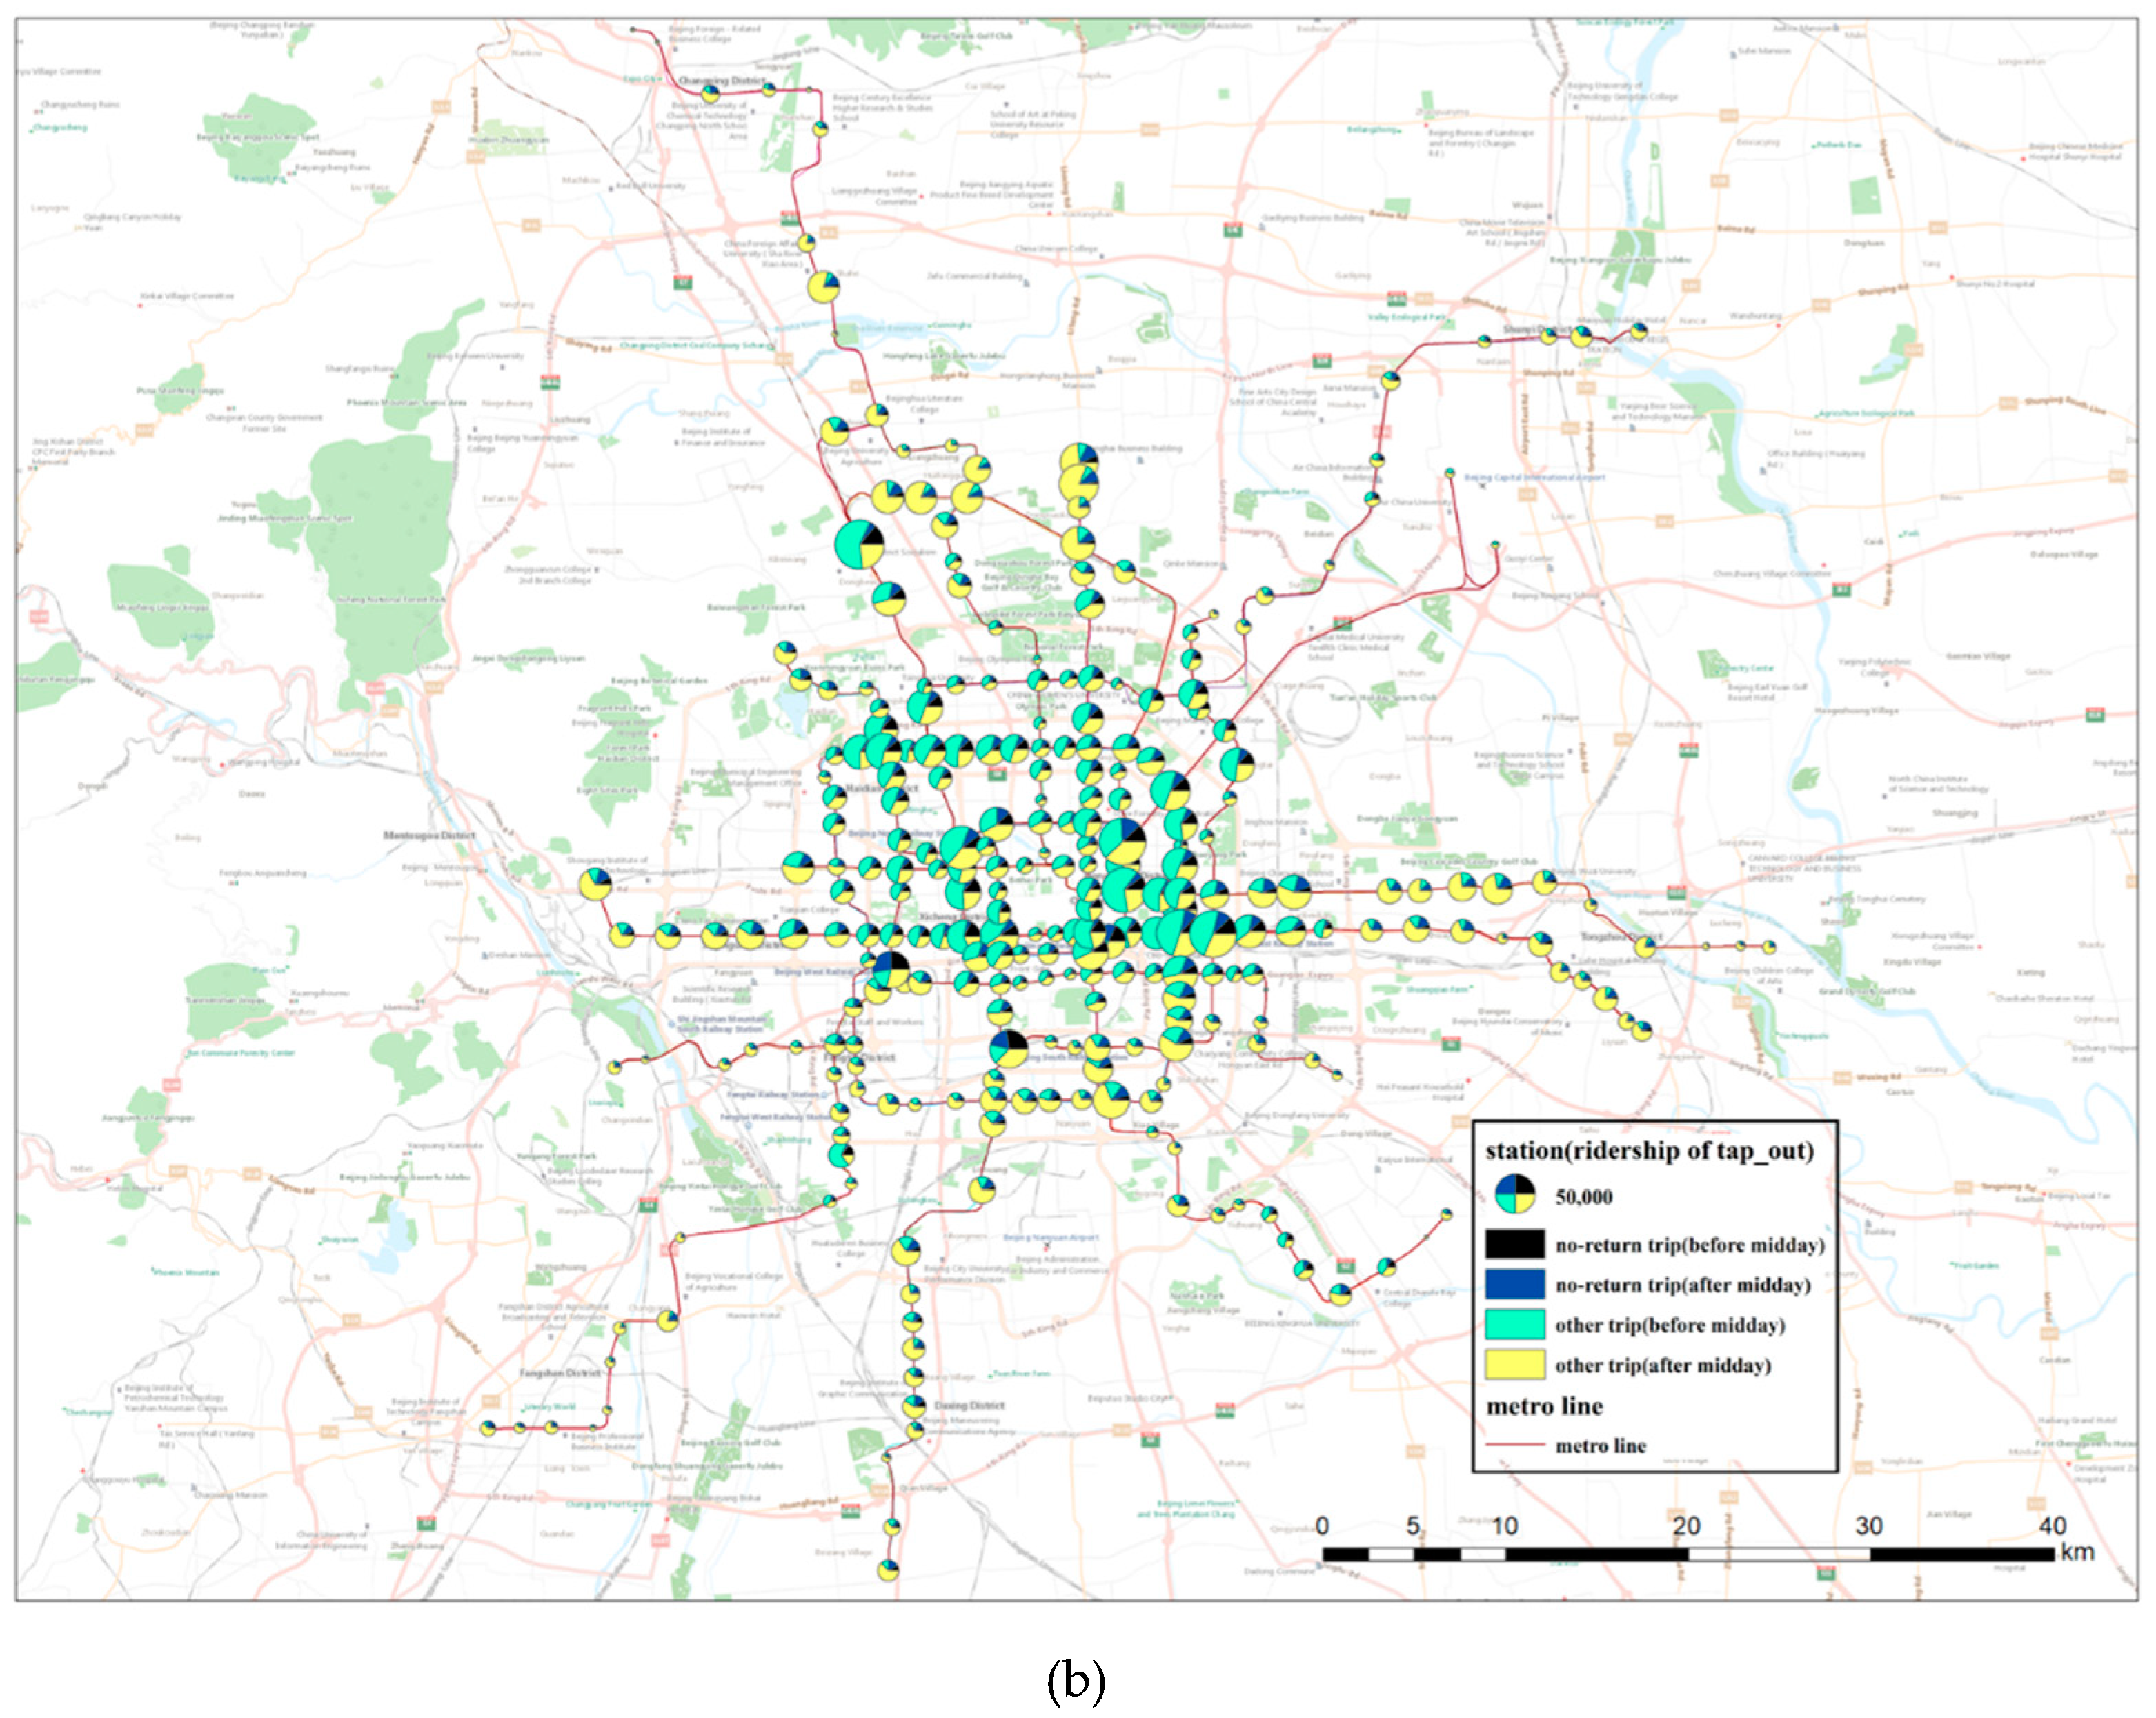
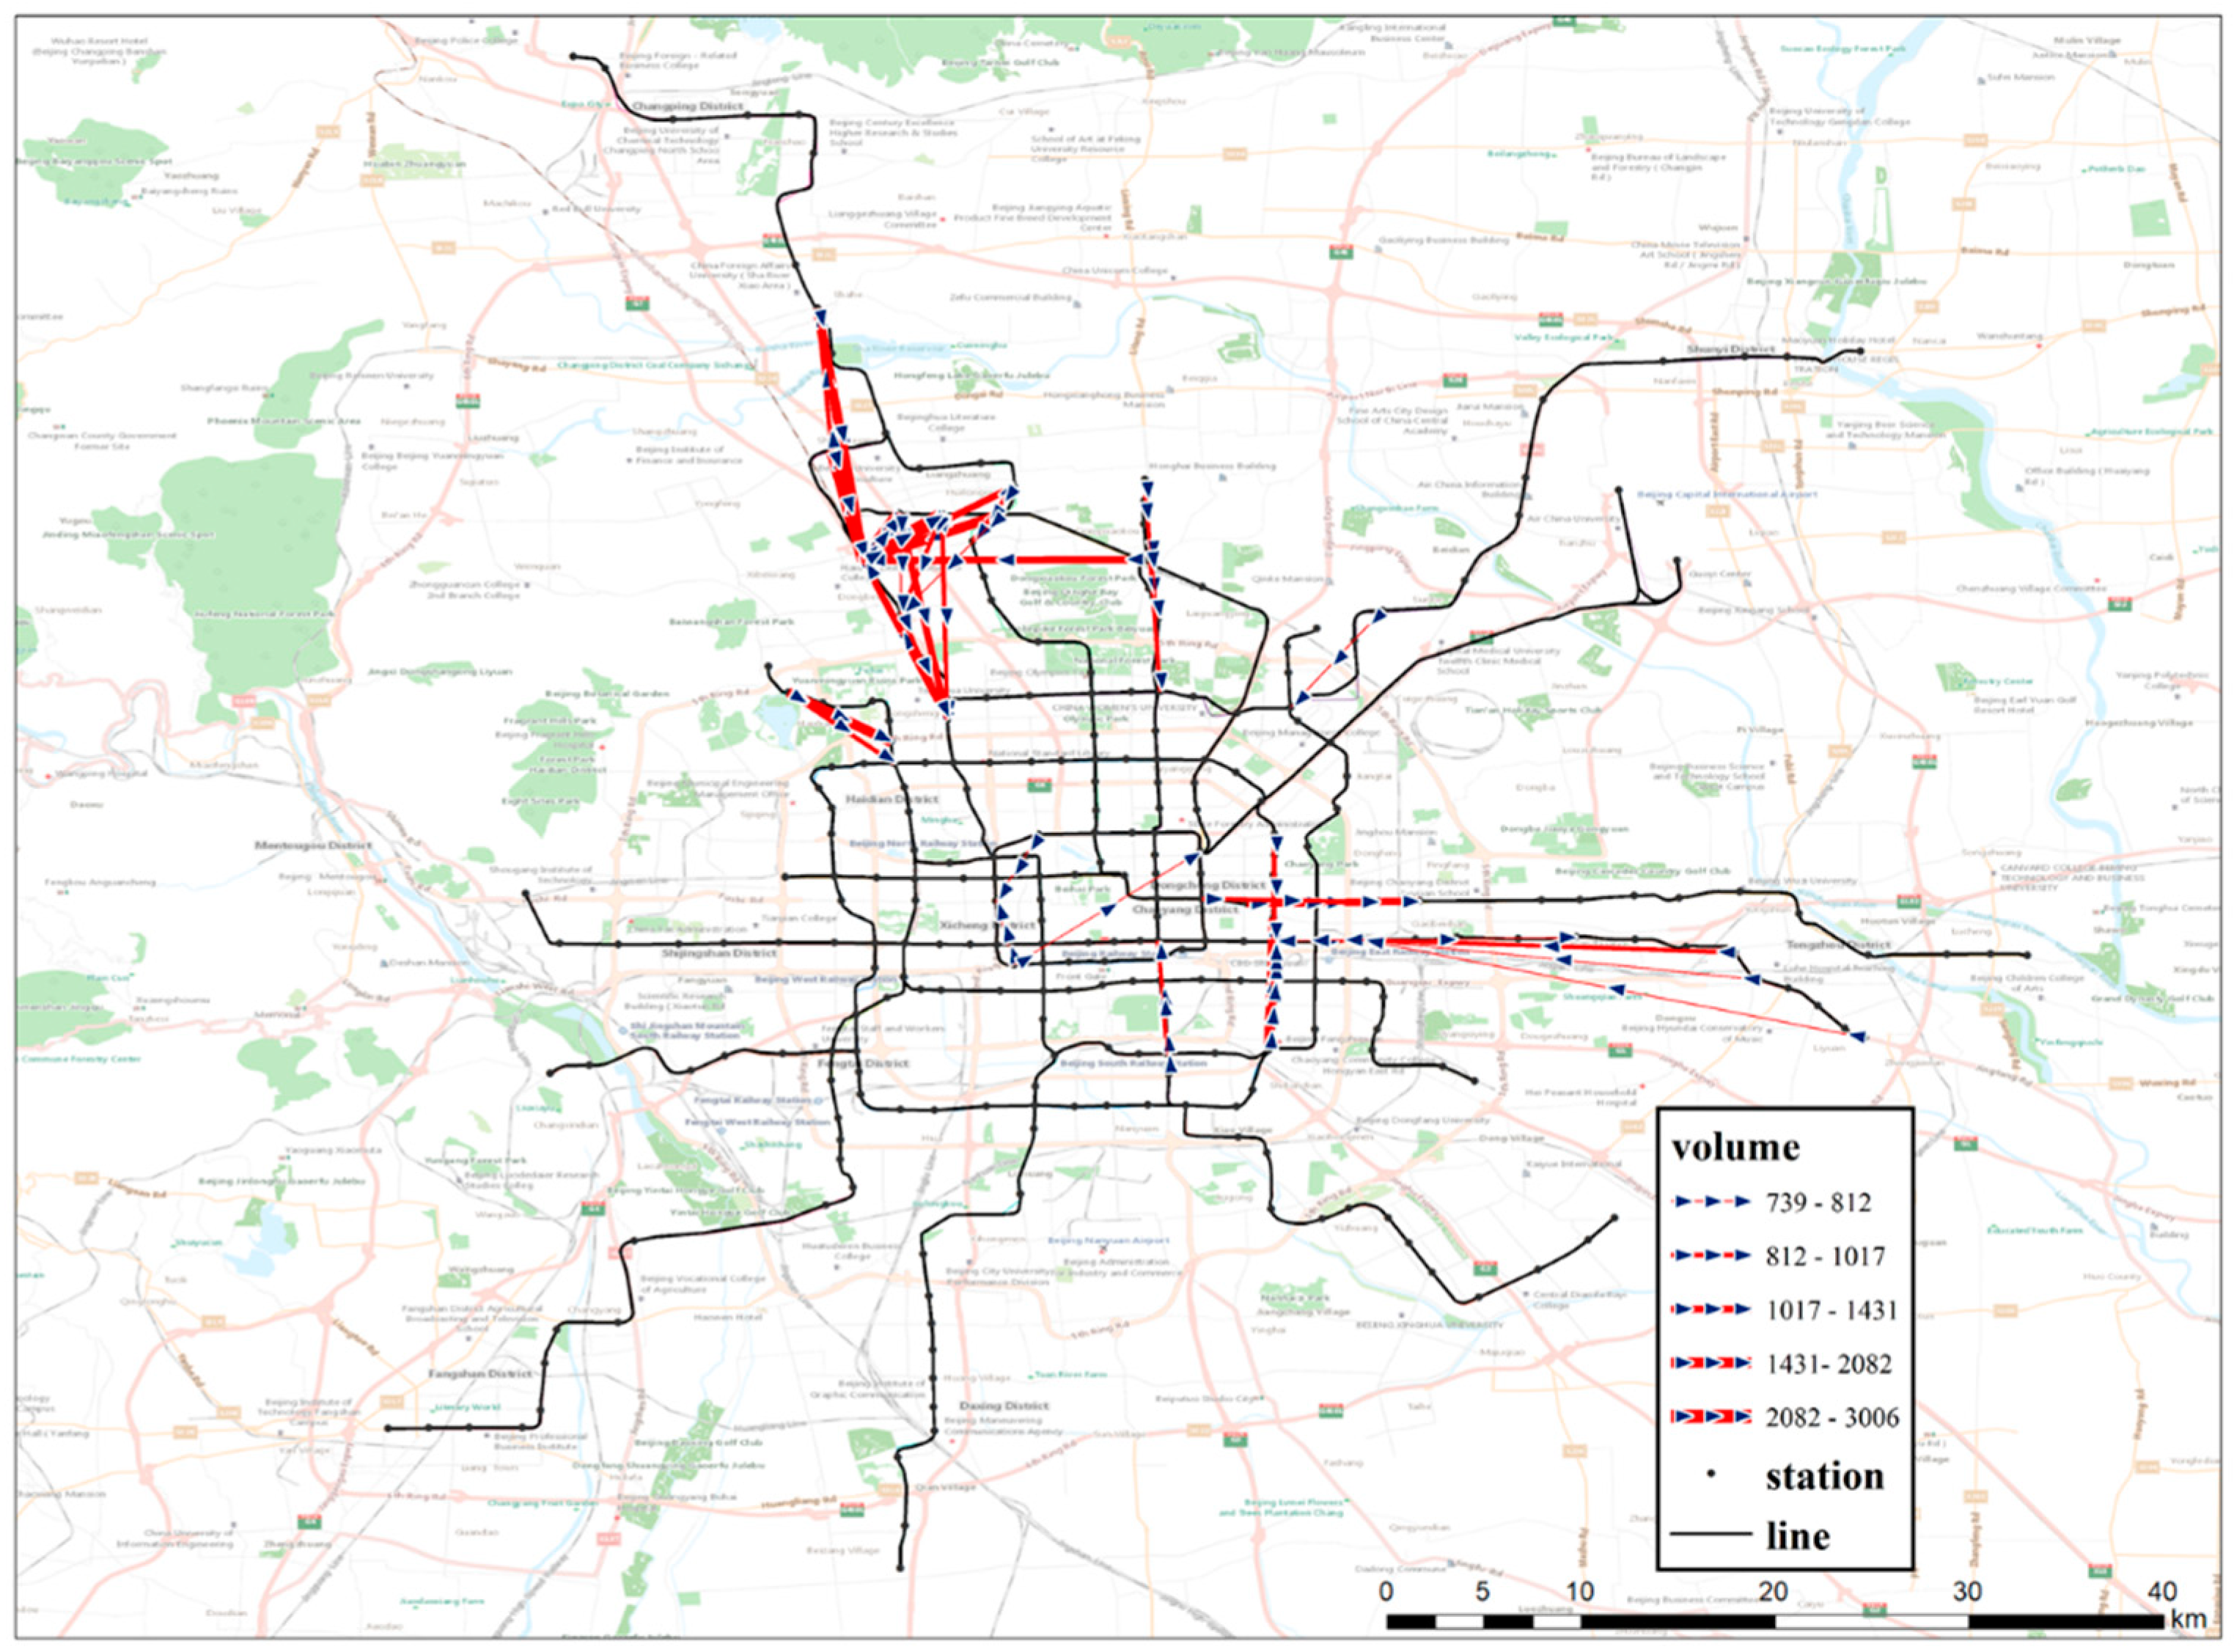
4.3. Spatial Patterns

Spatial pattern analysis of the OD location data indicates the geographical distribution of non-roundtrip travels, as shown in Figure 5. Take Monday trips for instance, Figure 5a illustrates the distribution of boarding locations, while Figure 5b presents the alighting locations. Pie graphs are used to show the total ridership during a day in different Beijing subway stations. Two time spans were considered to differentiate travel demands of the morning (before 12:00 p.m.) and evening (after 12:00 p.m.) peak passengers. In each pie chart, the non-roundtrip travel is in dark colors and other trips are represented in light colors to visualize the proportion of each trip type.
As a general overview of the spatial distribution of the ridership, non-roundtrip travels were occurred at huge transportation hubs like Beijing West Railway Station, Beijing South Railway Station, Beijing Railway Station, Xizhimen (Beijing North Railway Station), and Dongzhimen (connect station to the Airport Express Line). A majority of the passengers who travelled once in a day arrived or left the city via these transportation hubs, which led to the special travel demands.
Other subway stations except for the transportation hubs showed a noticeable demand. Non-roundtrip travels mainly originated at typical stations in dense residential districts southeast of the third ring road before 12:00 p.m., which was close to downtown and facilitated with advanced roadway public transit. Both subway and bus could serve as commuting modes, and the commuting times was very similar. After 12:00 p.m., frequent non-roundtrip travel stations were located in working areas such as Guomao (central business district), Beijing Financial Street, Zhongguancun District and Xi’erqi (also belongs to the residential district mentioned above). The spatial distribution pattern of the non-roundtrip travel was similar to that of all trips, which indicated that passengers who rode the subway only once a day included many commuters. Their commuting roundtrip might contain more than one mode for special reasons, which were discussed in the next section.

5. Distribution Pattern of Repetitive Non-Roundtrip Travels

As discussed in the above sections, the proportion of non-roundtrip travel is large, and the spatiotemporal pattern of non-roundtrip travel is basically consistent with all travel patterns. However, it is difficult to acquire more detailed features because of the large variation. In this section, we discuss the temporal and spatial patterns of repeating non-roundtrip travels.
First, the weekly trip frequency of non-roundtrip travel was extracted from the dataset. Table 2 illustrates the results. More than two-thirds of the passengers appeared only once in the observed week. Passengers with non-roundtrip travel for three or more days accounted for about 10% of the overall ridership.

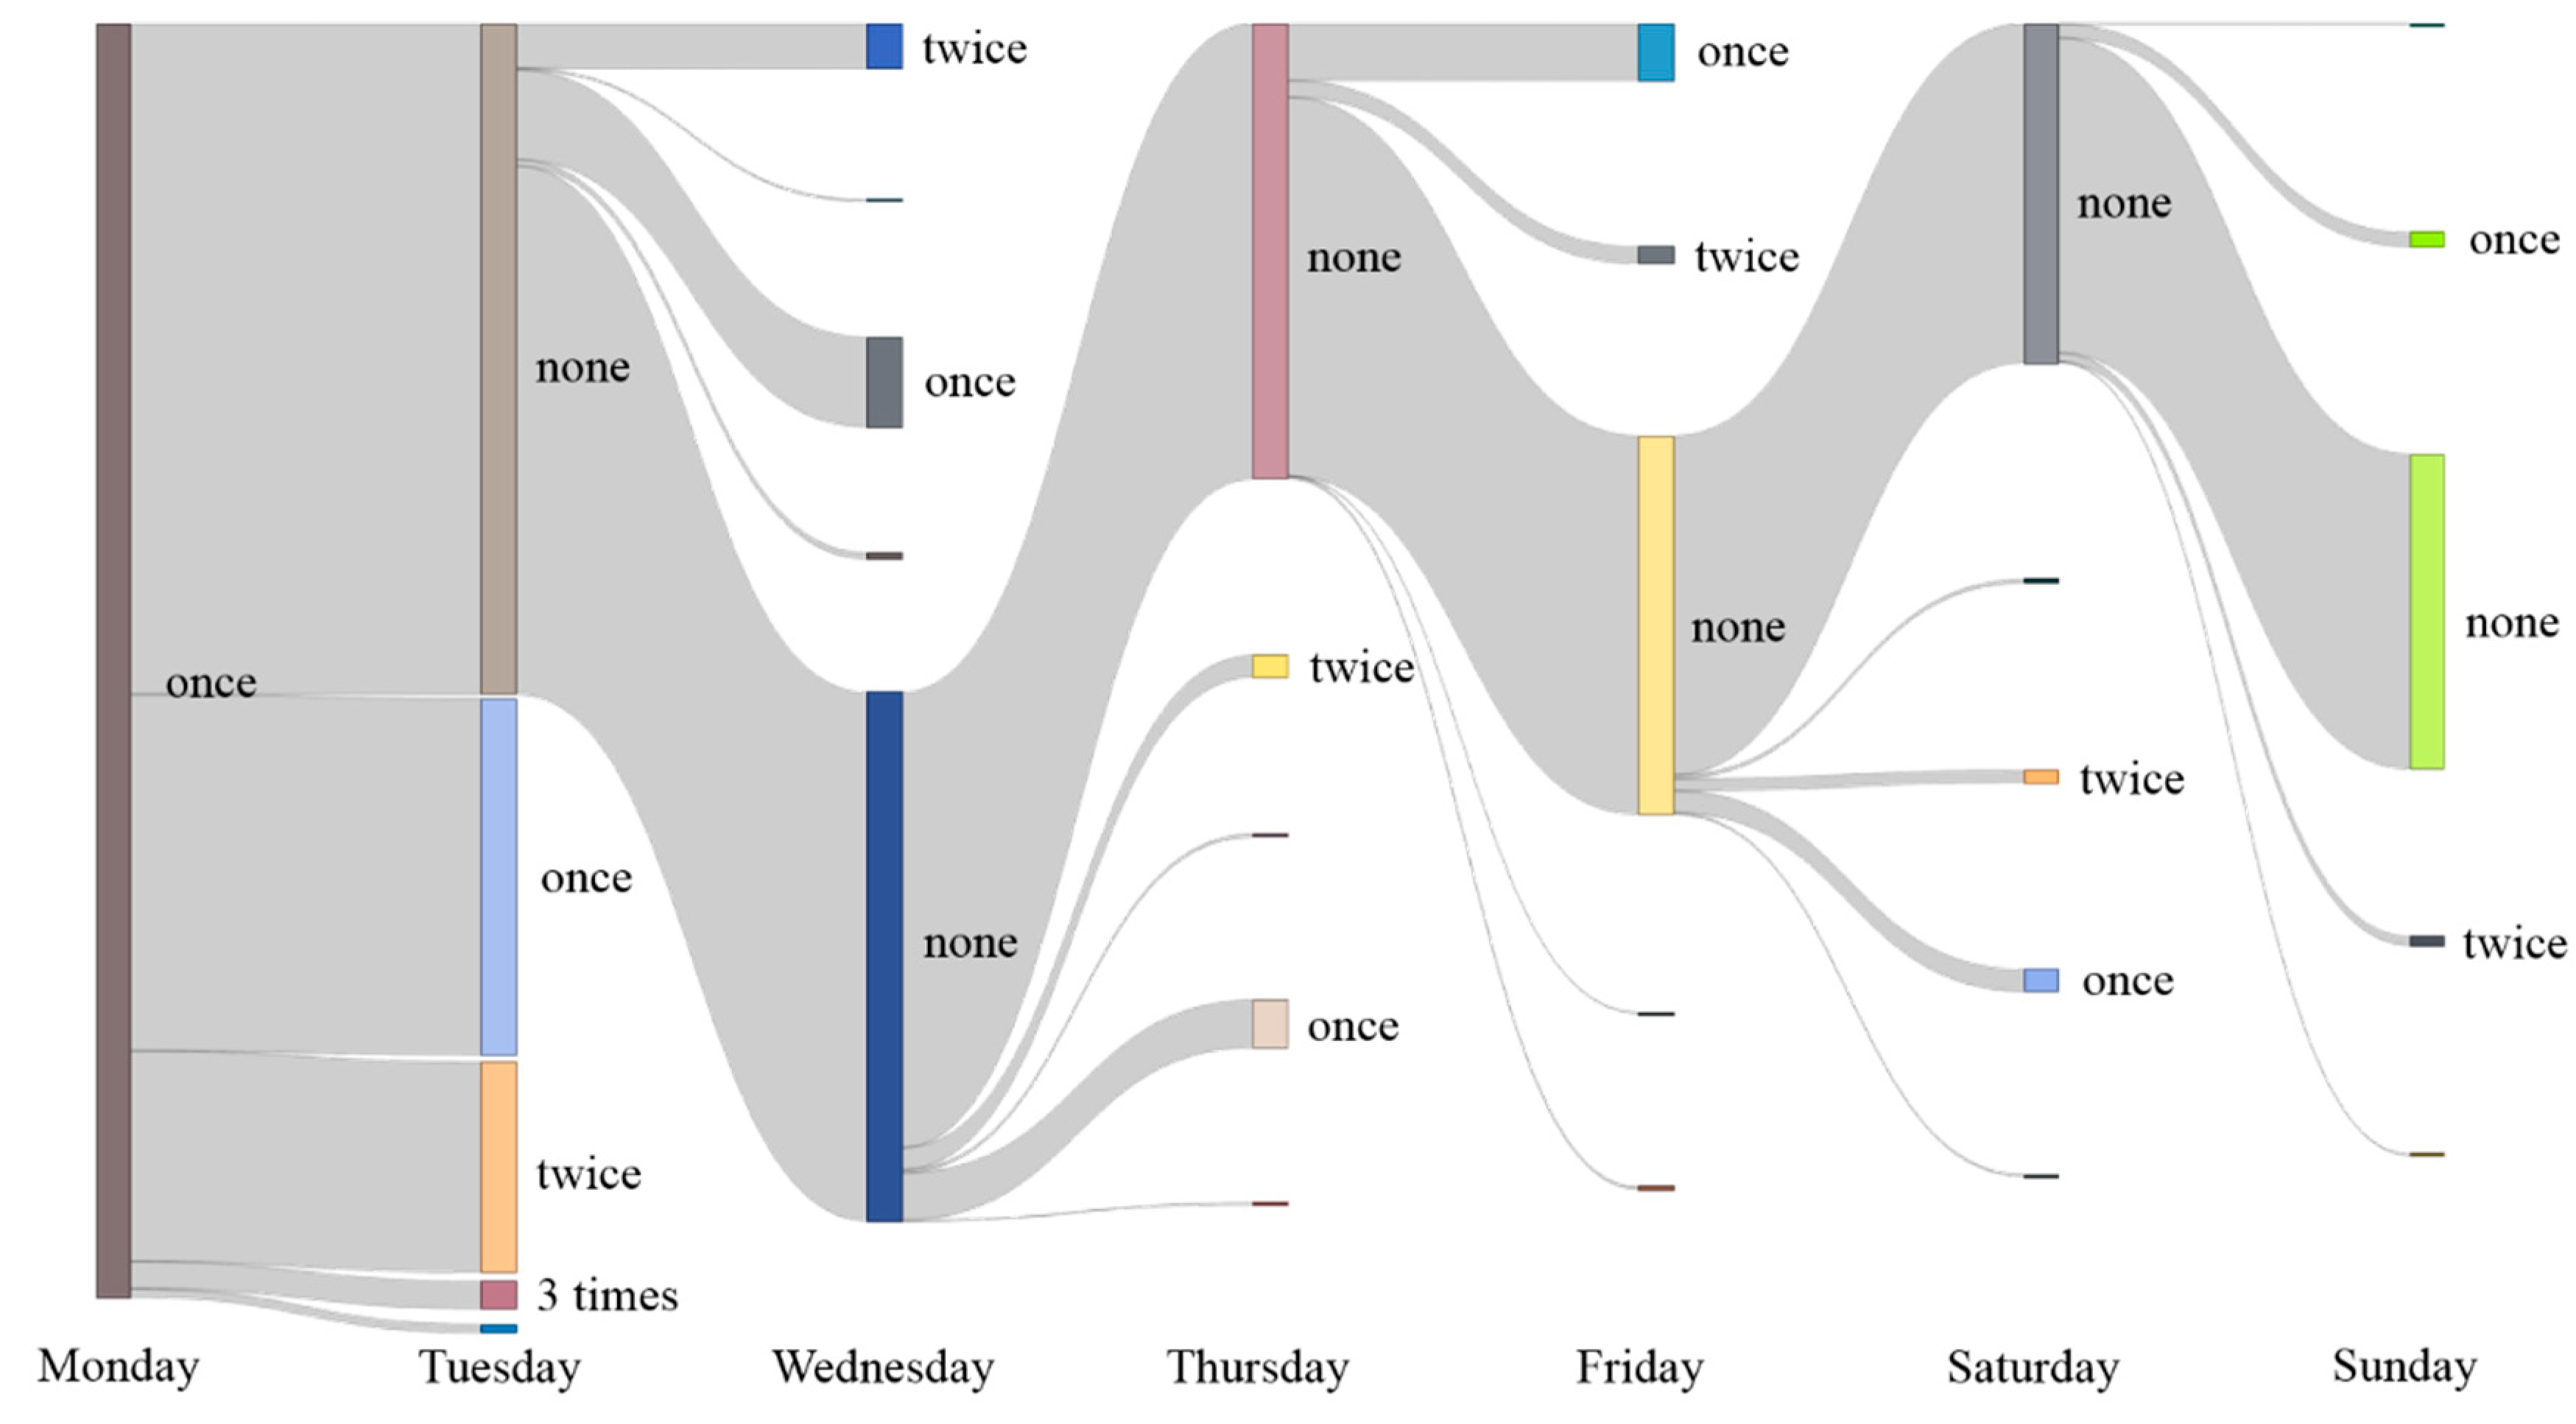
5.1. Non-Repetitive Non-Roundtrip Travel

Non-roundtrips generated by the intercity travel passengers were random and lacked OD regularity. We conducted a quantitative statistical analysis on the ODs of non-roundtrip travels that occurred just once in the week, as given in Table 3. As expected, high-ranking ODs with a large volume were linked to intercity transport hubs, such as railway stations, the transfer station to railway stations, airport rail lines, and coach stations. Obviously, these travels were usually non-roundtrips. As an international metropolis and the capital city of China, Beijing has very tight connection to other cities through the development of high-speed rail, which has led to high intercity mobility. In addition, Beijing plays a lead role as a transport hub city in China, which results in many passengers transferring from Beijing to other cities. The ODs with the largest demand were associated with railway stations. The ODs with the second largest demand were associated with Dongzhimen station, which is the departure subway station of the airport rail line to Beijing Capital International Airport.

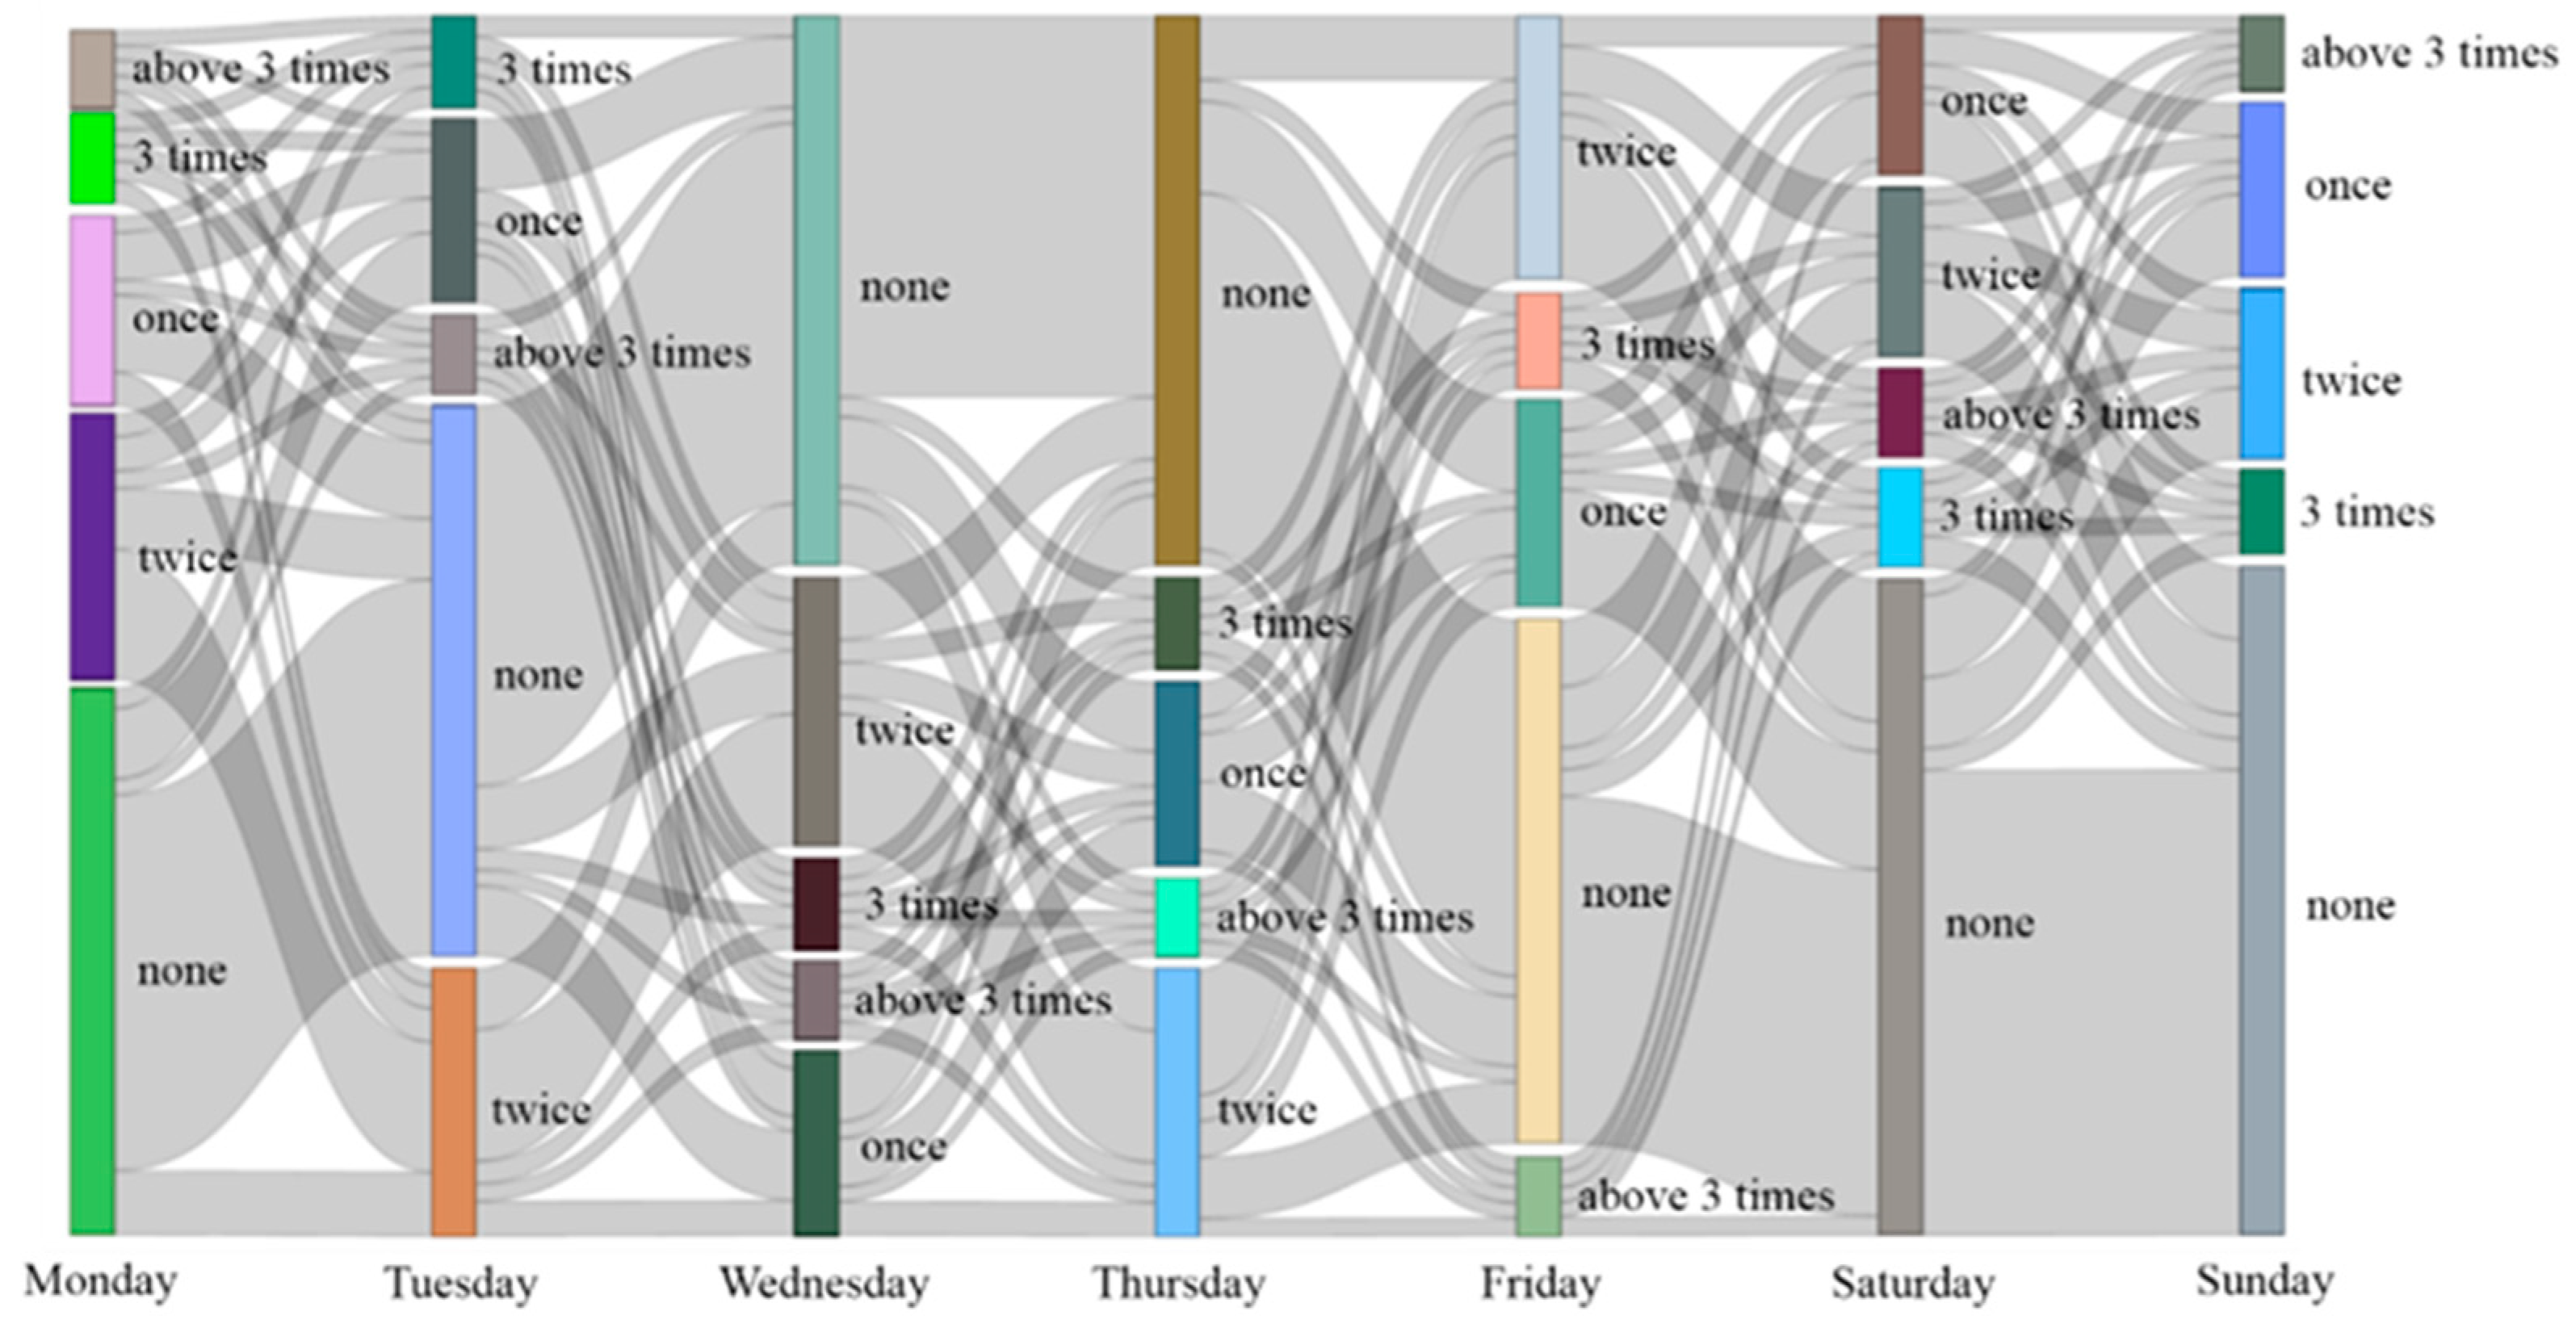
5.2. Repetitive Non-Roundtrip Travel During the Week

To distinguish the highly random non-roundtrips and those with some kind of regularity, passengers needed to be grouped by their non-roundtrip frequency in a week, which helped to filter out passengers coming to or leaving from Beijing.
We extracted the non-roundtrips made at least two times by one card holder between one specific OD pair. Table 4 demonstrates the top three ranking OD pairs at different repeating levels. They were still related to transportation hubs like Beijing Railway Station, which indicates that such passengers probably make frequent business trips. This could be evidence of the integration of Jing-Jin-Ji mega city region. However, passengers with three or more repeated non-roundtrips in the week showed no correlation with the transport hubs, so they could be regarded as an indicator of regular urban mobility. For closer observation, we extracted the detailed card records of the typical ODs and merged them into a new dataset, bus data of the same days, for further analysis.
The above analysis indicates that the temporal patterns of the non-roundtrip were similar to the entire dataset’s temporal patterns, so the OD volume distribution similarly varied, along with time. Identifying the temporal patterns of the ODs through clustering would help to clearly understand mobility of passengers. Clustering algorithms were widely used in diverse fields. The same principle could be applied to clustering ODs with similar temporal patterns based on their ridership for a specific time interval series. In this study, the first 20 OD pairs with large passengers were selected. Passenger flow of each OD pair at 15 min intervals was counted as the characteristics of OD pair, and normalization was carried out according to the total passenger flow.
Based on the temporal features, we used K-means clustering algorithm to divide the top 20 ODs into two groups: the morning peak-oriented cluster and the evening peak-oriented cluster, demonstrated in Figure 6. The horizontal axis represents the total 1440 min for each day. Sixteen ODs clearly belonged to the morning rush hour, while the remaining ODs belonged to the evening rush hour. These trips are not totally random. They show a commuting pattern, rather than as rail access or egress of intercity transport hubs to finish an intercity trip.
Because of its higher reliability and faster speed, some commuters choose to take the subway to work in the morning rush hour to be punctual for work instead of taking ground modes, such as buses. Compared with bus fare, the subway fare is relatively expensive, so they might change travel modes when returning home after work. This might be why most non-roundtrip travels occurred in the morning rush hour.
Table 5 lists detailed information of typical ODs, including path and distance. All ODs had one attribute in common. The origins and destinations of these ODs were located on the same subway line and close to each other, within about five stations. We selected the top 50 ODs based on their volume and visualized them on a GIS map using flow lines, as shown in Figure 7. The red lines are the connections between origins and destinations. The thickness of the line in the figure indicates the volume of the passenger flow, the thicker the line, the greater the volume of the passenger flow is. Arrows indicate the directions of the trips. Non-roundtrips mainly took place in two typical districts: the science and technology industry area, centered on Xi’erqi Station, and the CBD (Central Business District), centered on Guomao Station and Hujialou Station.
The more important question is why such a large number of people make repeated non-roundtrips by subway. A short OD distance means other transportation modes, such as buses, taxis, or shared bikes. Thus, a detailed study is needed with extensive data resources from the Global Positioning System (GPS) and smartphones to establish a complete trip chain, which is defined as a series of trips made by a traveler on a daily basis. Because of the limited data sources, bus data were incorporated into the subway data to further reveal the possible reasons for such trip pattern. Using the data of passengers making non-roundtrips on Wednesday, we generated trip chains by utilizing the spatiotemporal relationships between the subway and bus data.
Based on the SCD and trip chain analysis, 73.4% of passengers making non-roundtrips with the OD from Shilihe to Guomao during the morning rush hours took several special bus lines after 16:00 p.m. with a similar OD to the morning non-roundtrip on rail. In the morning, most of the passengers normally get off from the No. 638 bus (Figure 8a) and then enter Shilihe subway station, because the No. 638 bus cannot arrive at their destination in the CBD. For their return trips, however, they tend to choose the No. 28 or 976 bus, which runs along the same route as the subway, to return to their origins directly. This phenomenon reflects deficiencies of the No. 976 and No. 28 buses, such as a long departure interval, lack of punctuality, and insufficient capacity, which is consistent with field survey.
Another case worth mentioning is the trip from Xi’erqi Station to Life Science Park Station (Figure 8b). As high as 94.5% of the non-roundtrip passengers during the evening peak actually took the bus during the morning. Obviously, these passengers return home by subway in the evening, while they went to work in the morning by bus, especially the No. 112 and 205 buses. These two lines cover the same route between the ODs of non-roundtrips. Although the distance between the origin and destination is one long rail segment, the bus lines have seven stops. The difference in travel time between the subway and the bus makes the former have higher priority. However, in the morning peak, the high loading factor of rail vehicles (the highest in Beijing, up to 138% with a standing density of nine persons per m2) from Life Science Park Station to Xi’erqi Station results in severe measures to limit entrance. Passengers might be held at the station entrance for 1 h before boarding. Thus, some passenger choose the bus to finish their trip, although rail’s in-vehicle time is shorter. In the evening, passengers’ boarding time is not so concentrated and the crowding level in rail vehicles is acceptable, so people shift to rail to finish their return trip.
Combined with bus data, the hidden reasons of non-roundtrips were inferred, and problems of the present urban transport could be detected. The following reasons led to the regular demand of non-roundtrips:
(1)
Defects of buses: insufficient capacity, long detour routes, poor punctuality, etc.;
(2)
Defect of the subway: excessive overcrowding of vehicles and stations;
(3)
Personal travel demands: comprehensive consideration of the punctuality, service level, transit fare, etc.
With regard to typical ODs and the corresponding practical problems, several suggestions for improving transit integration could be proposed. For example, the route planning of subway lines could be optimized to increase subway service coverage at the non-overcrowding part of the rail network, so buses could serve as a feeding mode. For the very crowding rail lines, bus lines that overlap with the rail lines or linking the rail ODs with very large ridership, such as the No. 638 bus line, could be provided. A shuttle bus could serve seriously overcrowded segments of subway lines, running back and forth, as an alternative for the rail service.

6. Concluding Remarks and Recommendations

The passenger trips happening in a day are a significant indicator of travel patterns. Analyzing the number of trips per day could provide evidence for classifying passengers in terms of travel behavior. Unlike the majority of existing research, focusing on the roundtrips or regular commuting trips, this study was devoted to passengers with seemingly non-roundtrips on the urban rail system on the same day. Such trips account for a very large proportion of the overall daily trips in many cities’ rail systems worldwide. One week of SCD in the Beijing subway system was used to investigate the spatial and temporal patterns of non-roundtrips. In contrast to the existing studies, our main contributions are as follows:
(1).
Unlike the previous research, that has typically focused on typical regular trips, this study was devoted to non-roundtrips, which are normally regarded as irregular trips and can be neglected. We developed a framework to identify and investigate trips of this kind from multi-day transit card data, and revealed the hidden patterns of non-roundtrips. This work attracts some attention of smart card data-based research, from regular commuting trips to those trips of not so typical commuters, but its number is too large to be ignored;
(2).
According to the case study, by visualizing the temporal and spatial patterns of non-round metro trips, and combined with the bus data by the data fusion method, this paper inferred the possible reasons of repetitive non-return travel, and could help to raise suggestions for the optimization and integration of the public transport network in Beijing, and other cities as well.
Some conclusions are drawn below and might help understand urban rail riders’ travel behavior and provide some suggestions for government and subway operation companies to develop an effective and efficient demand management method.
(1).
Many non-roundtrips on the rail system in Beijing and probably other metropolitan cities are actually access or egress to transportation hubs. People make such inner-city trips to accomplish intercity trips. As in the case of this work, OD pairs with a large ridership generally have at least one end connecting to the intercity transport hubs. These trips are impacted by the intercity journeys and may generate a burst of ridership when trains arrive. The operating department of the subway system and the transport agencies can improve the service level by increasing interchange facilities in subway hub stations to improve the transfer efficiency for these intercity passengers;
(2).
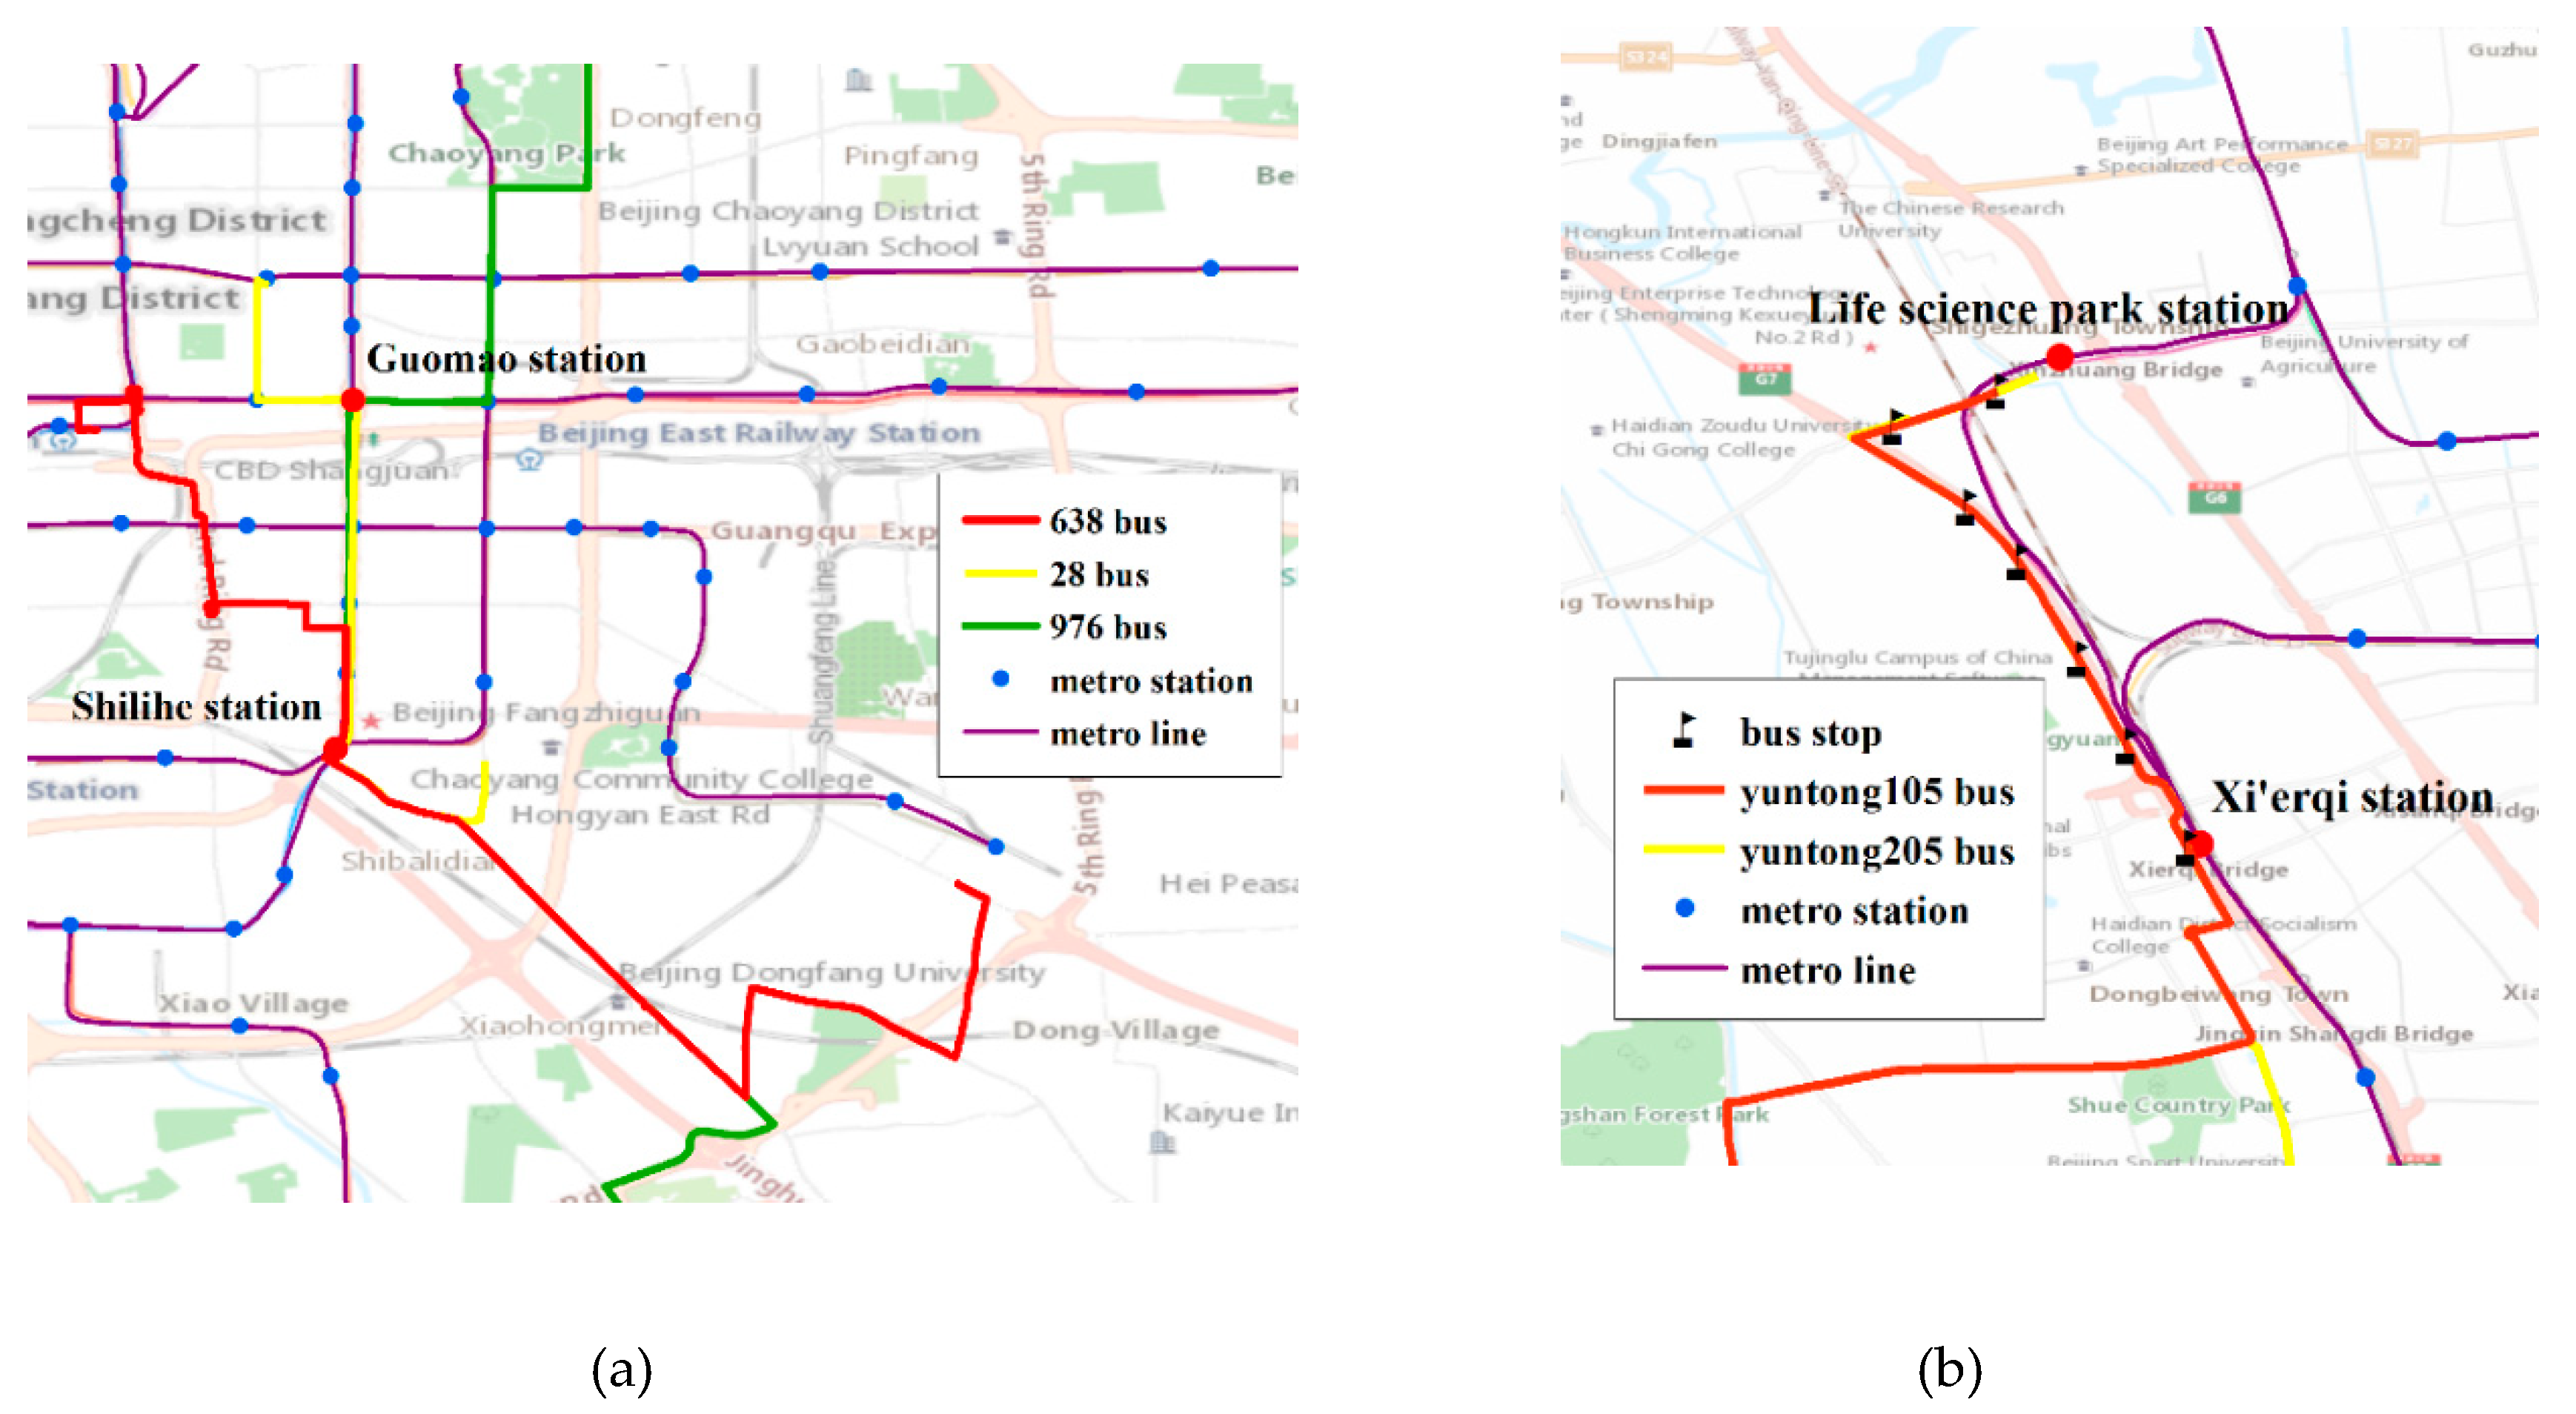
Closer observation of the consecutive multi-day non-roundtrip travels showed some interesting results. The origins or destinations of these trips were located at stations in specific areas. Merging with bus card data, we found that passengers’ regular non-roundtrips could be ascribed to various reasons, such as poor punctuality of buses, serious overcrowding in rail vehicles or stations, or network defects of bus or rail. To address these problems, the transport agency can optimize bus routes and boost the cooperation between bus and rail, such as running short shuttle buses or provide overlap service for rail lines with extraordinary crowding levels in rush hours, so that passengers may choose to travel by bus or subway according to their ODs and the overcrowding situations of the two modes. Passengers can have more choices, so as to make the trip more balanced and reduce the congestion of subway stations;
(3).
The results also demonstrate that irregular demand such as non-roundtrips actually accounts for a large share of the total ridership in Beijing, a diversified metropolitan city. These trips are generated by different people in contrast with normal commuters, but seldom addressed in the existing literature. This initial work provides a new topic. More attention should be paid to it so as to draw a whole picture rather than a part of urban mobility.
SCD only has a part of the whole trip chain and limited information about passengers’ socioeconomic states. Travel patterns can be observed from SCD but many explanations for them are actually inferred at best. It is more so for non-roundtrip studies. In the future, multi-source data, including field survey data, could be collected to carry out more detailed research.

Author Contributions

Conceptualization, Z.W. and W.W.; Data curation, Z.W. and H.T.; Formal analysis, W.W.; Methodology, Z.W. and Y.X.; Project administration, W.W.; Software, Y.X. and H.T; Validation, H.T.; Writing—original draft, H.T. and Y.X.; Writing—review and editing, Z.W., H.T. and W.W. All authors have read and agreed to the published version of the manuscript.

Funding

The authors acknowledge the fund support of The General projects of National Natural Science Foundation of China [Grant No.51978044], The National Social Science Fund of China [Grant No.16CGL001] and Fund Program—Research subject for Integrated Military and Civilian Development of Hebei province [Grant No.HB19JMRH022].

Acknowledgments

The authors acknowledge the data support from Beijing Municipal Commission of Transport.

Conflicts of Interest

The authors declare there is no conflicts of interest regarding the publication of this paper.

References

  1. Tang, J.; Heinimann, H.R. A resilience-oriented approach for quantitatively assessing recurrent spatial-temporal congestion on urban roads. PLoS ONE 2018, 13, e0190616. [Google Scholar] [CrossRef] [PubMed] [Green Version]
  2. Kusakabe, T.; Asakura, Y. Behavioural data mining of transit smart card data: A data fusion approach. Transp. Res. Part C Emerg. Technol. 2014, 46, 179–191. [Google Scholar] [CrossRef]
  3. Wan, L.; Gao, S.; Wu, C.; Jin, Y.; Mao, M.; Yang, L. Big data and urban system model-substitutes or complements? A case study of modelling commuting patterns in beijing. Comput. Environ. Urban Syst. 2018, 68, 64–77. [Google Scholar] [CrossRef]
  4. Morency, C.; Trepanier, M.; Agard, B. Measuring transit use variability with smart-card data. Transp. Policy 2007, 14, 193–203. [Google Scholar] [CrossRef]
  5. Agard, B.; Morency, C.; Trépanier, M. Mining public transport user behaviour from smart card data. IFAC Proc. Vol. 2006, 39, 399–404. [Google Scholar] [CrossRef]
  6. Bagchi, M.; White, P.R. The potential of public transport smart card data. Transp. Policy 2005, 12, 464–474. [Google Scholar] [CrossRef]
  7. Jang, W. Travel time and transfer analysis using transit smart card data. Transp. Res. Rec. 2010, 2144, 142–149. [Google Scholar] [CrossRef]
  8. Pelletier, M.; Trépanier, M.; Morency, C. Smart card data use in public transit: A literature review. Transp. Res. Part C Emerg. Technol. 2011, 19, 557–568. [Google Scholar] [CrossRef]
  9. Brockmann, D.; Hufnagel, L.; Geisel, T. The scaling laws of human travel. Nature 2006, 439, 462–465. [Google Scholar] [CrossRef]
  10. González, M.C.; Hidalgo, C.A.; Barabási, A.-L. Understanding individual human mobility patterns. Nature 2008, 453, 779–782. [Google Scholar] [CrossRef]
  11. Sun, L.; Axhausen, K.W.; Lee, D.H.; Huang, X. Understanding metropolitan patterns of daily encounters. Proc. Natl. Acad. Sci. USA 2013, 110, 13774–13779. [Google Scholar] [CrossRef] [PubMed] [Green Version]
  12. Song, C.; Qu, Z.; Blumm, N.; Barabási, A.-L. Limits of predictability in human mobility. Science 2010, 327, 1018–1021. [Google Scholar] [CrossRef] [PubMed] [Green Version]
  13. Lee, S.; Hickman, M.; Tong, D. Development of a temporal and spatial linkage between transit demand and land-use patterns. J. Transp. Land Use 2013, 6, 33. [Google Scholar] [CrossRef] [Green Version]
  14. Aljoufie, M.; Zuidgeest, M.; Brussel, M.; van Maarseveen, M. Spatial–temporal analysis of urban growth and transportation in Jeddah City, Saudi Arabia. Cities 2013, 31, 57–68. [Google Scholar] [CrossRef]
  15. Shaw, S.; Xin, X. Integrated land use and transportation interaction: A temporal GIS exploratory data analysis approach. J. Transp. Geogr. 2003, 11, 103–115. [Google Scholar] [CrossRef]
  16. Tao, S.; Rohde, D.; Corcoran, J. Examining the spatial–temporal dynamics of bus passenger travel behaviour using smart card data and the flow-comap. J. Transp. Geogr. 2014, 41, 21–36. [Google Scholar] [CrossRef]
  17. Li, Y.; Guo, Y.; Lu, J.; Peeta, S. Impacts of congestion pricing and reward strategies on automobile travelers’ morning commute mode shift decisions. Transp. Res. Part A Policy Pract. 2019, 125, 72–88. [Google Scholar] [CrossRef]
  18. Nishiuchi, H.; King, J.; Todoroki, T. Spatial-Temporal Daily Frequent Trip Pattern of Public Transport Passengers Using Smart Card Data. Int. J. Intell. Transp. Syst. Res. 2013, 11, 1–10. [Google Scholar] [CrossRef]
  19. Long, Y.; Thill, J.-C. Combining smart card data and household travel survey to analyze jobs–housing relationships in Beijing. Comput. Environ. Urban Syst. 2015, 53, 19–35. [Google Scholar] [CrossRef] [Green Version]
  20. Hu, H.; Xu, J.; Shen, Q.; Shi, F.; Chen, Y. Travel mode choices in small cities of China: A case study of Changting. Transp. Res. Part D Transp. Environ. 2018, 59, 361–374. [Google Scholar] [CrossRef]
  21. Liu, X.; Gao, L.; Ni, A.; Ye, N. Understanding Better the Influential Factors of Commuters’ Multi-Day Travel Behavior: Evidence from Shanghai, China. Sustainability 2020, 12, 376. [Google Scholar] [CrossRef] [Green Version]
  22. Guo, Y.; Wang, J.; Peeta, S.; Anastasopoulos, P.C. Personal and societal impacts of motorcycle ban policy on motorcyclists’ home-to-work morning commute in China. Travel Behav. Soc. 2020, 19, 137–150. [Google Scholar] [CrossRef]
  23. Guo, Y.; Wang, J.; Peeta, S.; Anastasopoulos, P.C. Impacts of internal migration, household registration system, and family planning policy on travel mode choice in China. Travel Behav. Soc. 2018, 13, 128–143. [Google Scholar] [CrossRef]
  24. Liu, Y.; Ji, Y.; Shi, Z.; He, B.; Liu, Q. Investigating the effect of the spatial relationship between home, workplace and school on parental chauffeurs’ daily travel mode choice. Transp. Policy 2018, 69, 78–87. [Google Scholar] [CrossRef] [Green Version]
  25. Ma, X.; Wu, Y.; Wang, Y.; Chen, F.; Liu, J. Mining smart card data for transit riders’ travel patterns. Transp. Res. Part C Emerg. Technol. 2013, 36, 1–12. [Google Scholar] [CrossRef]
  26. Goulet-Langlois, G.; Koutsopoulos, H.N.; Zhao, J. Inferring patterns in the multi-week activity sequences of public transport users. Transp. Res. Part C Emerg. Technol. 2016, 64, 1–16. [Google Scholar] [CrossRef] [Green Version]
  27. Cheng, G.; Zhao, S.; Li, J. The Effects of Latent Attitudinal Variables and Sociodemographic Differences on Travel Behavior in Two Small, Underdeveloped Cities in China. Sustainability 2019, 11, 1306. [Google Scholar] [CrossRef] [Green Version]
  28. El Mahrsi, M.K.; Come, E.; Oukhellou, L.; Verleysen, M. Clustering Smart Card Data for Urban Mobility Analysis. IEEE Trans. Intell. Transp. Syst. 2017, 18, 712–728. [Google Scholar] [CrossRef]
  29. Mahrsi, M.K.E.; Côme, E.; Baro, J.; Oukhellou, L. Understanding Passenger Patterns in Public Transit Through Smart Card and Socioeconomic Data: A case study in Rennes, France. In Proceedings of the 3rd International Workshop on Urban Computing (UrbComp 2014), New York, NY, USA, 24 August 2014. [Google Scholar]
  30. Briand, A.; Côme, E.; Trépanier, M.; Oukhellou, L.; Briand, A. A mixture model clustering approach for temporal passenger pattern characterization in public transport. Int. J. Data Sci. Anal. 2016, 1, 37–50. [Google Scholar] [CrossRef] [Green Version]
  31. Briand, A.; Côme, E.; Trépanier, M.; Oukhellou, L. Analyzing year-to-year changes in public transport passenger behaviour using smart card data. Transp. Res. Part C Emerg. Technol. 2017, 79, 274–289. [Google Scholar] [CrossRef]
  32. Kandt, J.; Leak, A. Examining inclusive mobility through smart card data: What shall we make of senior citizens’ declining bus patronage in the West Midlands? J. Transp. Geogr. 2019, 79, 102474. [Google Scholar] [CrossRef]
  33. Cheng, L.; Chen, X.; Yang, S.; Cao, Z.; De Vos, J.; Witlox, F. Active travel for active ageing in China: The role of built environment. J. Transp. Geogr. 2019, 76, 142–152. [Google Scholar] [CrossRef]
  34. Barr, S.; Fraszczyk, A.; Mulley, C. Excess travelling—What does it mean? New definition and a case study of excess commuters in Tyne and Wear, UK. Eur. Transp. Res. Rev. 2010, 2, 69–83. [Google Scholar] [CrossRef] [Green Version]
  35. Long, Y.; Liu, X.; Zhou, J.; Chai, Y. Early birds, night owls, and tireless/recurring itinerants: An exploratory analysis of extreme transit behaviors in Beijing, China. Habitat Int. 2016, 57, 223–232. [Google Scholar] [CrossRef] [Green Version]
  36. Jain, A.K. Data clustering: 50 years beyond K-means. Pattern Recognit. Lett. 2010, 31, 651–666. [Google Scholar] [CrossRef]
  37. Wang, Z.; Chen, F.; Wang, B.; Huang, J.-L. Passengers’ Response to Transit Fare Change: An Ex Post Appraisal Using Smart Card Data. Transportation 2017, 45, 1559–1578. [Google Scholar] [CrossRef]
Figure 1. The research process of this study.
Sustainability 12 03525 g001
Figure 2. Daily trip frequency shift patterns during a week.
Sustainability 12 03525 g002
Figure 3. Trip frequency shifts after non-roundtrip travel on Monday.
Sustainability 12 03525 g003
Figure 4. Temporal patterns of boarding.
Sustainability 12 03525 g004
Figure 5. Spatial patterns of non-roundtrip travels: (a) boarding and (b) alighting distributions.
Sustainability 12 03525 g005aSustainability 12 03525 g005b
Figure 6. Clustering results.
Sustainability 12 03525 g006
Figure 7. OD distribution of most repetitive non-roundtrip travels.
Sustainability 12 03525 g007
Figure 8. Relationship between a subway line and bus route: typical Origin–destination (OD) in (a) the science and technology industry area and (b) the Central Business District (CBD).
Sustainability 12 03525 g008
Table 1. Distribution of passengers with various trip frequencies.
DateOnceTwice3 Times4 TimesAbove 4 TimesSum
2/29995,0161,623,571169,20655,87414,7932,858,460
34.81%56.80%5.92%1.95%0.52%100.00%
3/1946,2591,640,926175,88957,17514,9112,835,160
33.38%57.88%6.20%2.02%0.53%100.00%
3/2947,0521,647,651180,05857,35514,7972,846,913
33.27%57.88%6.32%2.01%0.52%100.00%
3/3944,3911,642,546176,77557,50914,8602,836,081
33.30%57.92%6.23%2.03%0.52%100.00%
3/41,142,1721,606,050220,09062,93117,1563,048,399
37.47%52.69%7.22%2.06%0.56%100.00%
3/5736,695824,372242,870103,53743,1891,950,663
37.77%42.26%12.45%5.31%2.21%100.00%
3/6859,522834,592119,99630,81274081,852,330
46.40%45.06%6.48%1.66%0.40%100.00%
Average938,730
36.63%
1,402,815
52.93%
183,555
7.26%
60,742
2.43%
18,159
0.75%
2,604,001
100%
Table 2. Non-roundtrip travel frequencies of one card in a week.
Trip FrequencyRidershipRatio
12,196,13367.26%
2659,40020.19%
3236,8787.25%
4115,7473.53%
557,7471.77%
Table 3. Origin–destination (OD) volume of non-roundtrip travel that occur 1 day of the week.
No.OriginDestinationVolume
1Beijing railway stationDongzhimen5284
2DongzhimenBeijing railway station2785
3Beijing west railway stationDongzhimen2764
4Beijing west railway stationDawanglu2690
Table 4. OD volumes of non-roundtrip travels that occurred several days a week.
No.Non-Roundtrip FrequencySerial NumberOriginDestinationVolume
121HuilongguanXi’erqi1217
22Beijing railway stationDongzhimen1027
33Xi’erqiLife Science Park913
431HuilongguanXi’erqi1106
52Xi’erqiLife Science Park894
63LongzeXi’erqi830
741HuilongguanXi’erqi992
82Xi’erqiLife Science Park941
93LongzeXi’erqi842
1051Xi’erqiLife Science Park1171
112HuilongguanXi’erqi868
123LongzeXi’erqi755
Table 5. Clustering results of typical ODs with detailed information.
ClusteringMorning PeakEvening Peak
Serial Number2346715
OriginHuilongguanLongzeJinsongHuoyingShiliheXi’erqiXi’erqi
DestinationXi’erqiXi’erqiGuomaoXi’erqiGuomaoLife Science ParkShahe
PathLine 13Line 13Line10Line 13Line 10Changping line
Distance (stations)2123414

