1. Introduction
Considered by many specialists as a goal and by others as an instrument, sustainability reporting has been integrated into the business model of companies due to its positive impact on stakeholder relations, measuring and communicating progress, and favoring better positions in the markets where they act [
1,
2,
3,
4]. As financial and non-financial challenges become more interdependent, sustainability reporting provides greater transparency and accountability, allowing for better information and reliable and realistic decisions. Companies must ensure that the environmental, social, and governmental practices are adapted and updated as required by customers and investors [
5,
6,
7].
Most investors consider that sustainability is a long-term goal that will establish a viable business model and will be assessed by other competitors from an environmental point of view [
8]. Viability is the way to obtain a competitive advantage on the current global market. In other words, sustainability reporting is (1) an important factor to improve the company’s environmental initiatives, as well as its dealings with customers and investors; and (2) a necessary trump card to certify and guarantee new investors by ensuring responsibility and transparency of the provided information [
9,
10,
11].
The implementation of European legislation on sustainable development and sustainability reporting is carried out in Romania through the approval of Order No. 1938/2016 regarding the modification and completion of some accounting regulations. This document has been applied since 2017 for companies that on the balance sheet date exceeded an average of 500 employees during the financial year and required the inclusion in the manager’s report (as part of the balance sheet) of a report called a non-financial statement or sustainability report [
12]. This information includes environmental, social, and personnel aspects, respect for human rights, and the fight against corruption and bribery, and it is necessary to understand the development, performance, and position of companies, including the impact of their activities.
The report also includes information such as
- (a)
a brief description of the business model of the company;
- (b)
a description of the company’s policies regarding these issues and the results of those policies;
- (c)
the main risks related to aspects of the company’s operations and risk management; and
- (d)
key non-financial performance indicators relevant to the company’s specific activity [
13].
In order to provide this information, the companies covered by Directive 2014/95/EU may take into account European Union frameworks such as EMAS (Environmental Management and Audit System) or international frameworks such as the Organisation for Economic Co-operation and Development, United Nations Global Compact; Guiding Principles for Business and Human Rights: Implementing the United Nations Protect, Respect and Remedy Framework; ISO 26000—Social Responsibility; Tripartite Declaration of Principles Concerning Multinational Enterprises and Social Policy; Global Reporting Initiative (GRI); or other recognized international frameworks [
14,
15,
16].
Since the launch of the European Directive regarding Non-Financial Reporting Standards 2014/95/EU, the interest of Romanian companies in developing sustainability reports has grown. Considering the recent economic data regarding the GDP (Gross Domestic Product) (2015: 3.9%, 2016: 4.8%, 2018: 6.9%), the Romanian economy qualifies as an emerging one; as such, one of the biggest challenges is reaching sustainability [
17]. Additionally, in recent years, Romania has faced such major problems as an excessive bureaucracy, a degrading fiscal system, an unstable consumer economic environment, a corrupt political environment, rudimentary infrastructure, and excessive labor migration [
18].
This paradox is possible given the fact that there are many top companies in the Romanian market. Regardless of the challenges in the economic environment facing sales growth, improved profitability, timely payment of salaries and fees, etc., and the fields of activity in which they operate, they have achieved a remarkable performance. These benefits are enjoyed by both the shareholders of the companies and the entire Romanian community. These companies have become the largest employers in the country, the largest contributors to the state budget, and the largest investors in the Romanian market. Furthermore, they support and raise the Romanian economy, contributing more than half of Romania’s GDP and generating annual profits exceeding RON 100 million [
17]. The outstanding performance of these companies is due to the efficient use of natural, financial, and human resources, professional management and well-qualified employees, and premium products that have conquered both national and international markets.
This study focused on the benefits of sustainability reporting by building strong and long-lasting relationships between stakeholders and top companies in Romania, a country that has transitioned to a market economy in the last three decades. Regarding impact, the decision-making issue delineated in the research aimed to address the questions: Does the sustainability strategy have to necessarily be consistent with the specific sustainability objectives? In this context, what are the benefits of sustainability reporting by companies and how could they help to increase their success in the market? In this sense, the research purpose was to identify and analyze the real benefits obtained by large companies in Romania following the utilization of sustainability reports, contributing in particular to the positive economic growth of the companies and in general to building a sustainable economy. The results demonstrated the involvement of companies in the reconciliation of shareholders’ interests with particular attention to clients, investors, financial groups, regulators and sustainability organizations, competitors, the press and media, business partners, governments and their agencies, non-governmental organizations, and the local communities in which they operate in order to ensure sustainable development through social responsibility policies. Moreover, this study could serve as a specific resource for companies in measuring and communicating progress, and in establishing better positions in the markets where they act.
The main objectives of the research purpose were to
- (1)
identify a correlation at the company’s strategic management level between the sustainability strategy and sustainability reporting;
- (2)
understand the importance given to the opinion of the interested groups in the decision to reconsolidate sustainability reporting at the level of the Romanian companies;
- (3)
learn the priority objectives specific to the sustainability reporting considered by each company;
- (4)
designate the responsible group at the company level to reflect the sustainable strategy through the sustainability report;
- (5)
establish the group responsible for preparing the company’s sustainability report; and
- (6)
perceive the internal and external benefits provided to the company on the basis of the sustainability report.
These objectives are important as most studies [
19,
20,
21,
22,
23] have tended to focus on developed economies and have not analyzed the challenges of sustainability reporting in an emerging market economy like that of the Romanian economy.
The results demonstrated the involvement of companies in the reconciliation of shareholders’ interests, with particular attention to clients, investors, financial groups, regulators and sustainability organizations, competitors, the press and media, business partners, governments and their agencies, non-governmental organizations, and the local communities in which they operate in order to ensure sustainable development through social responsibility policies. Finally, our findings are relevant in order to identify the specific actions needed as part of companies’ involvement in the sustainability report of the EU Directive.
The novelty elements of this research covered some gaps existing in the literature by highlighting aspects related to the correlation of sustainability strategy with sustainability reporting, knowing how sustainable development goals contribute to improving all processes included in the integrated company management system, and identifying the opinions of company managers on the internal and external benefits obtained on the basis of sustainability reporting and the formation of an overall picture of the current state of sustainability reporting by the top companies in Romania.
The rest of the article is structured in accordance with the purpose and objectives proposed, with a brief presentation of the literature in
Section 2, a presentation of the research methodology and data sources in
Section 3;
Section 4 presents the empirical results, which are discussed in
Section 5. Finally, the conclusions and recommendations for future research are presented in
Section 6.
3. Research Methodology
This research was based on the assumption that the top companies in a country contribute greatly through their economic and social success models to developing and promoting sustainable economic growth for business and society. The participation of top companies in this joint action consists of, among others,
- (1)
promoting new business development models that no longer rely on the competitive advantage of cheap labor, but on building a modern, sustainable, and inclusive economy, producing added value, and having as the main pillars R&D, technology, and innovation;
- (2)
using advanced technologies to create new products and improve existing ones; expanding digital techniques in developing and integrating development programs and projects to optimize decisions on prioritization and the rational allocation of financial resources on the basis of cost-effectiveness and competitiveness; developing and integrating green products and services into their own national and local activities;
- (3)
the efficient use of energy resources by reducing greenhouse gas emissions, increasing the share of energy from renewable sources, using energy crops from desert reclamation, and using alternative and/or biomass fuels;
- (4)
the phased implementation of integrated water management programs and risk management; the development of green infrastructure and the use of services provided by natural ecosystems through the efficient management of excess water, a substantial increase in the efficiency of water use in industrial, commercial, and agricultural activities; expanding the rational reuse of treated and recycled water in order to achieve the objectives of the circular economy; and
- (5)
making greenfield (from scratch) or brownfield (on disused or contaminated industrial land) public investment for the development of new units in the manufacturing industry, subject to the legal requirements of protecting and preserving the environment.
To understand the relevance of sustainability reporting, quantitative marketing research was carried out among the managers of the most valuable companies in Romania. The necessary information for marketing research came from external sources that have subsequently been retrieved and processed. Annually, the National Trade Register Office, in collaboration with the editors of
Capital magazine, produces a list of the top most valuable companies in Romania [
42]. This institution provided the Capital Review with information on the 5750 companies considered to be the top companies in Romania that comes from protocol-based data from the Ministry of Public Finance. The evaluation of the companies by the editors of
Capital magazine was made on 31 December 2018.
The methodology used to determine the value of the top companies took into account the valuation multiples provided by PwC Romania using Capital IQ data. The companies’ ratings were based on data provided by PwC Romania and tracked indicators such as turnover, profit/loss, and average number of employees. From a methodological point of view for the listed companies, market capitalization was taken into account, and for the non-listed companies, the EBIT (earnings before interest and taxes)/EBITDA (earnings before interest, taxes, depreciation, and amortization) provided by PricewaterhouseCoopers Romania (PwC Romania) and/or the direct capitalization of the company’s normalized profit were considered. On 1 August 2018, based on the evaluation methodology, a list of the most valuable companies in Romania (5750 companies) was built, all having more than 100 employees and a turnover of over ROM 100 million.
The research method that underpinned this quantitative study was a telephone survey. According to the research program, between 15 September and 15 October 2018, the stage of collecting the necessary data and information started. In the telephone survey, the collection of primary data by the 24 operators was carried out on the basis of a printed questionnaire. All interviews took place at a single location that was especially arranged for this purpose in Bucharest. This location made it possible to conduct interviews quickly and in a short period. With the necessary equipment for conducting interviews, each professional operator was assigned to an average of 16 companies from Bucharest as well as 34 other counties across Romania. To both increase the quality of the information resulting from the research and reduce the impact of errors due to lack of personal characteristics and deliberate distortion, the 24 interviewers were prepared in advance and received all the necessary instructions for conducting research in optimal conditions.
The selection of companies was based on the following criteria: the county of origin, the field of activity, the size of the turnover, the size of the profit/loss, and the number of employees. Starting from the five categories identified in relation to the chosen criteria, the layers were constructed by selecting a number of components in proportion to the weight of the layers in the total of the collectivity investigated. This was possible because the list of the top companies in Romania provided information for building the proportions associated with each category defined in relation to the sampling criteria. Finally, the structure of the research sample was a faithful reproduction of the structure of the reference population, and the share of the companies in each layer of the sample remained proportionate to that of the subjects in the layers of the total collectivity.
A probabilistic sampling method was used to construct a sample characterized by a high degree of economic representation and high accuracy in marketing research. A sampling base was defined and built that included the top companies in Romania involved at the time of the descriptive research.
The sample included 384 sampling units (384 companies) and is detailed in
Appendix A (
Table A1). If, in the first step, proportional sub-samples were extracted from each layer using the layered/proportional sampling method, in the second step, the selection was made using simple random sampling. Thus, from the nominal list of the top companies in Romania, 384 companies were selected using the simple random selection in the Excel method. Because the purpose of the marketing research targeted the companies, interviewers communicated by phone with managers and/or their representatives. The main advantages of this type of telephone survey were the rapid capture of the managers’ attention, the facilitation of cooperation and communication in conditions where most companies were in remote counties of the country, the speed of data collection, the final high response rate, and the limited duration of the interview for up to 15 minutes.
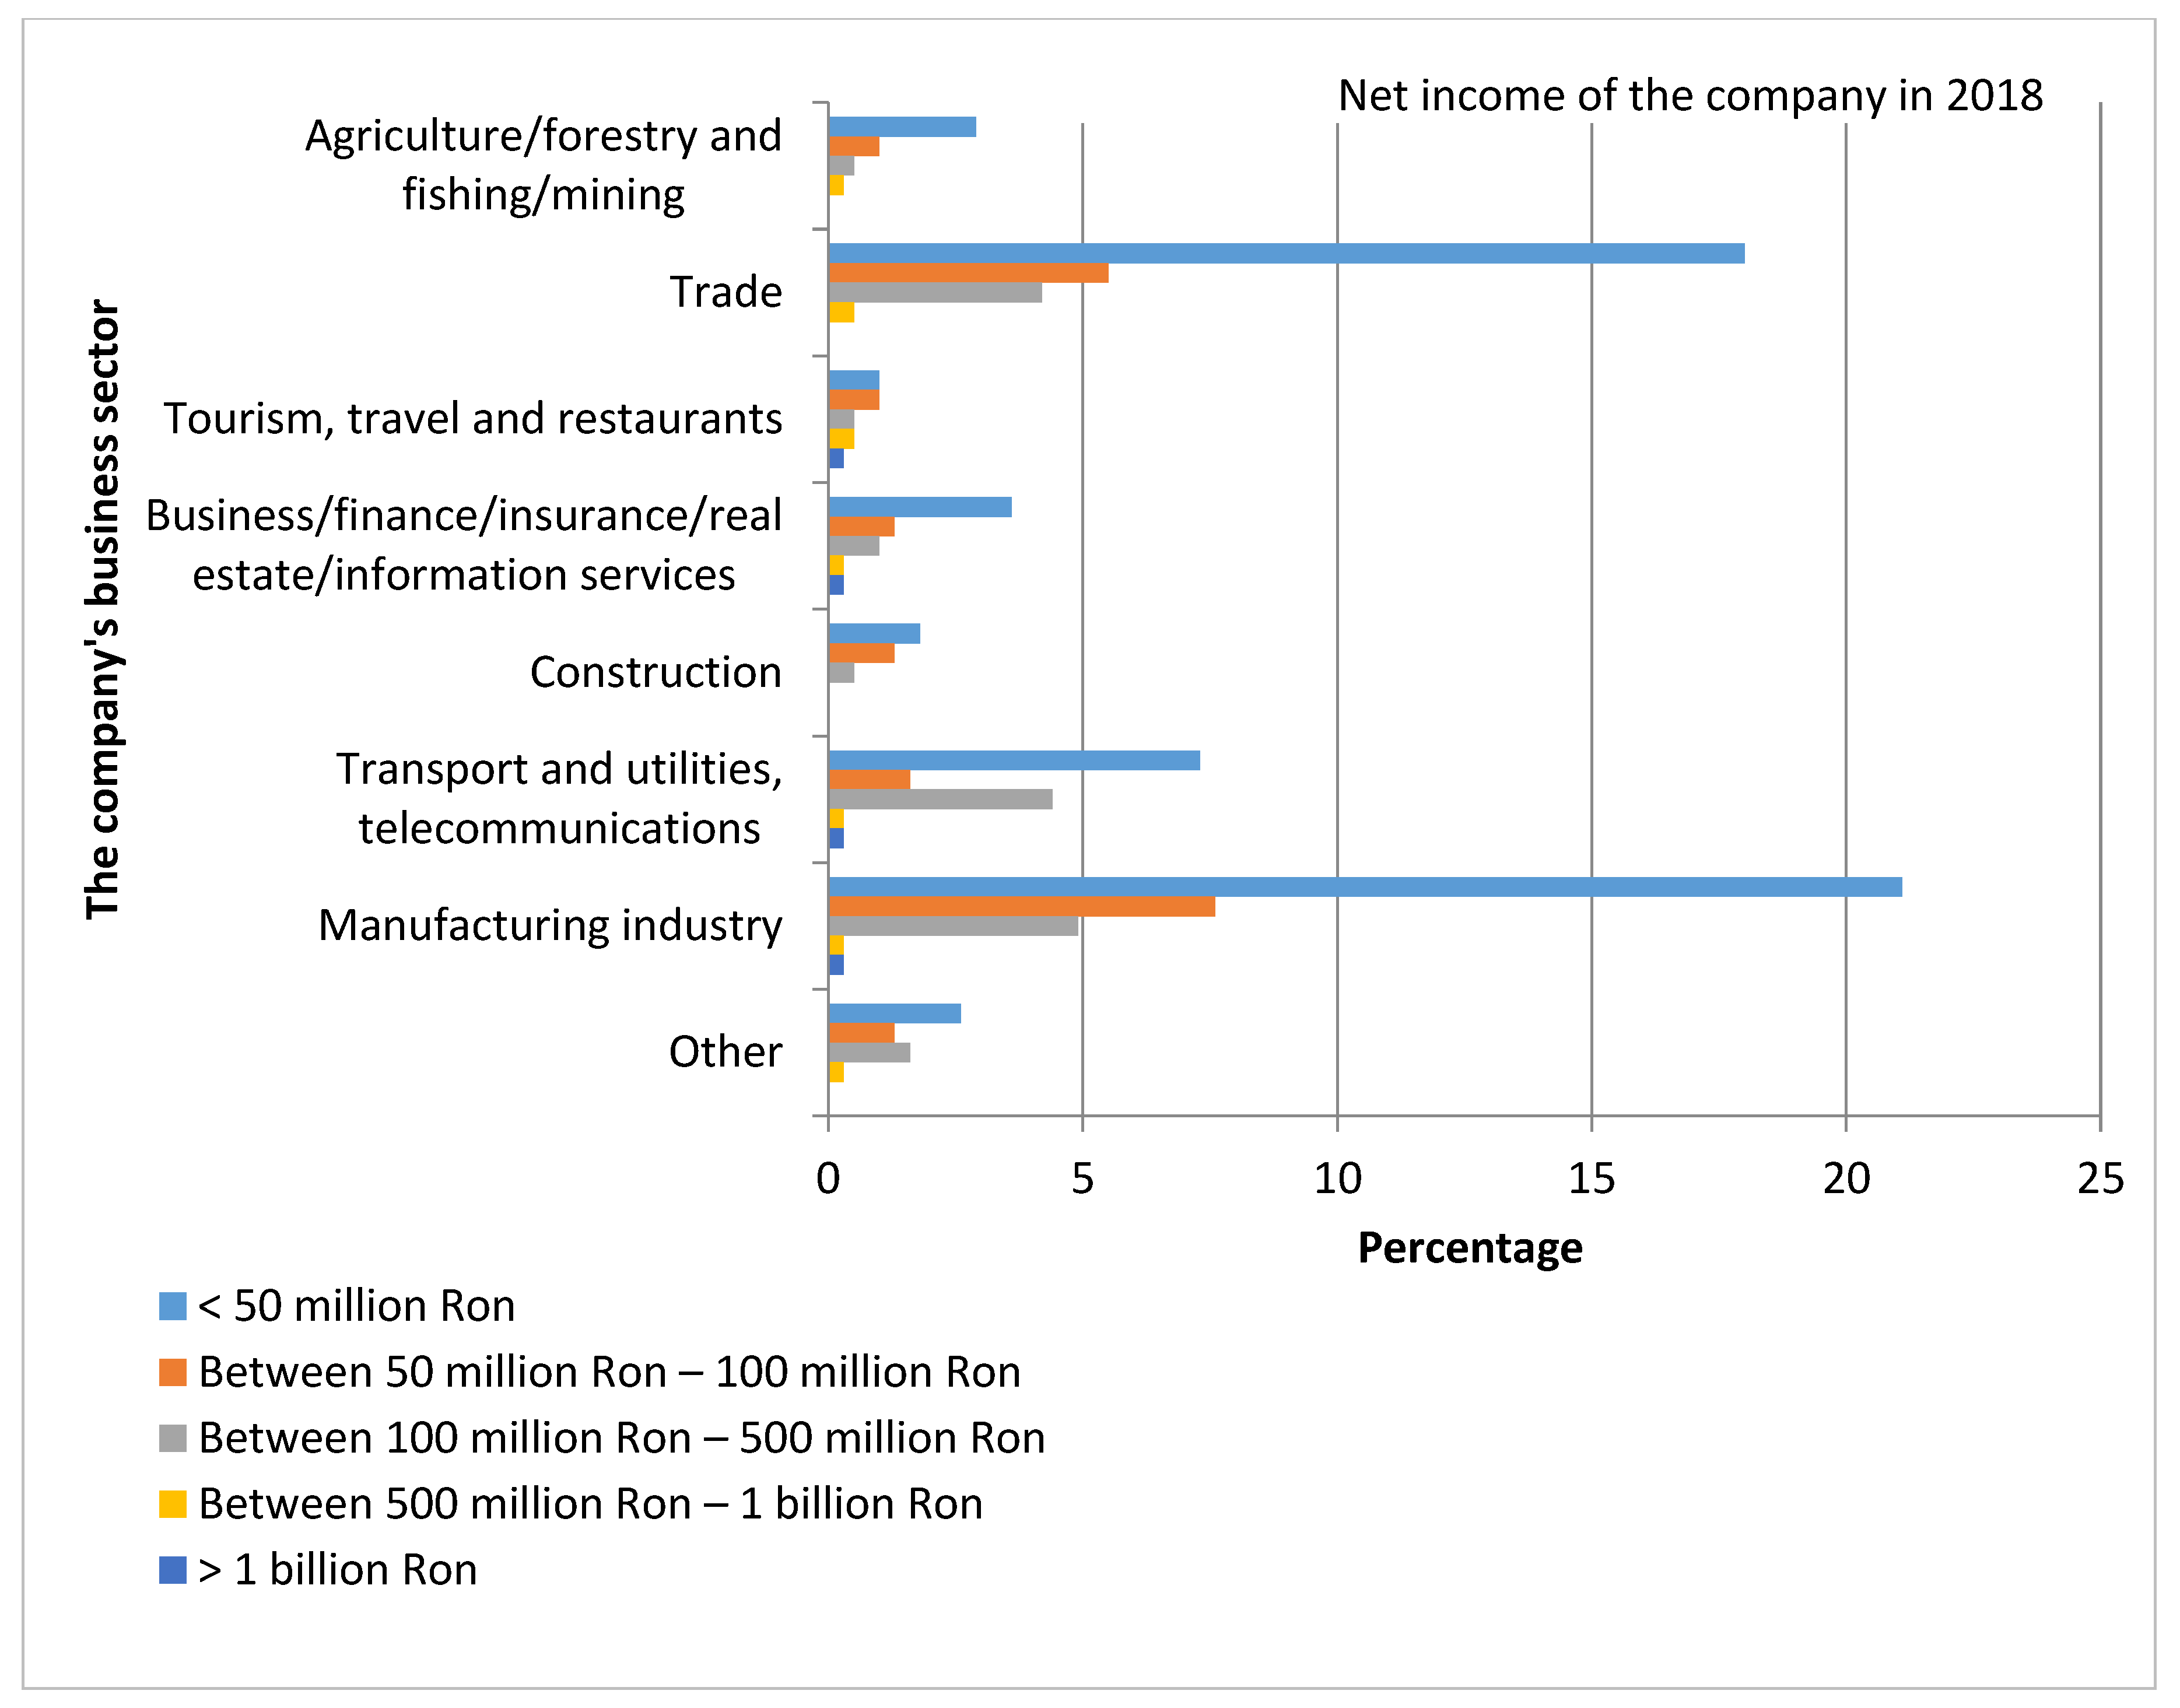
The best performing sectors in Romania [
42] are Construction, Business/Finance/Insurance/Real Estate/Information Services, Transport and Utilities/Telecommunications, and Tourism, Travel, and Restaurants, represented by four companies that in 2018 achieved net profits exceeding RON 1 billion. These were followed by other important sectors such as Trade and Agriculture/Forestry and Fishing/Mining, where 46 companies had net profits of between RON 50 million and 1 billion [
42].
More than 176 Romanian companies earned net profits of up to RON 50 million during 2018, mainly operating in sectors such as Manufacturing (21.1%), Trade (18%), and Transport and Utilities/Telecommunications (7.3%) (
Figure 1).
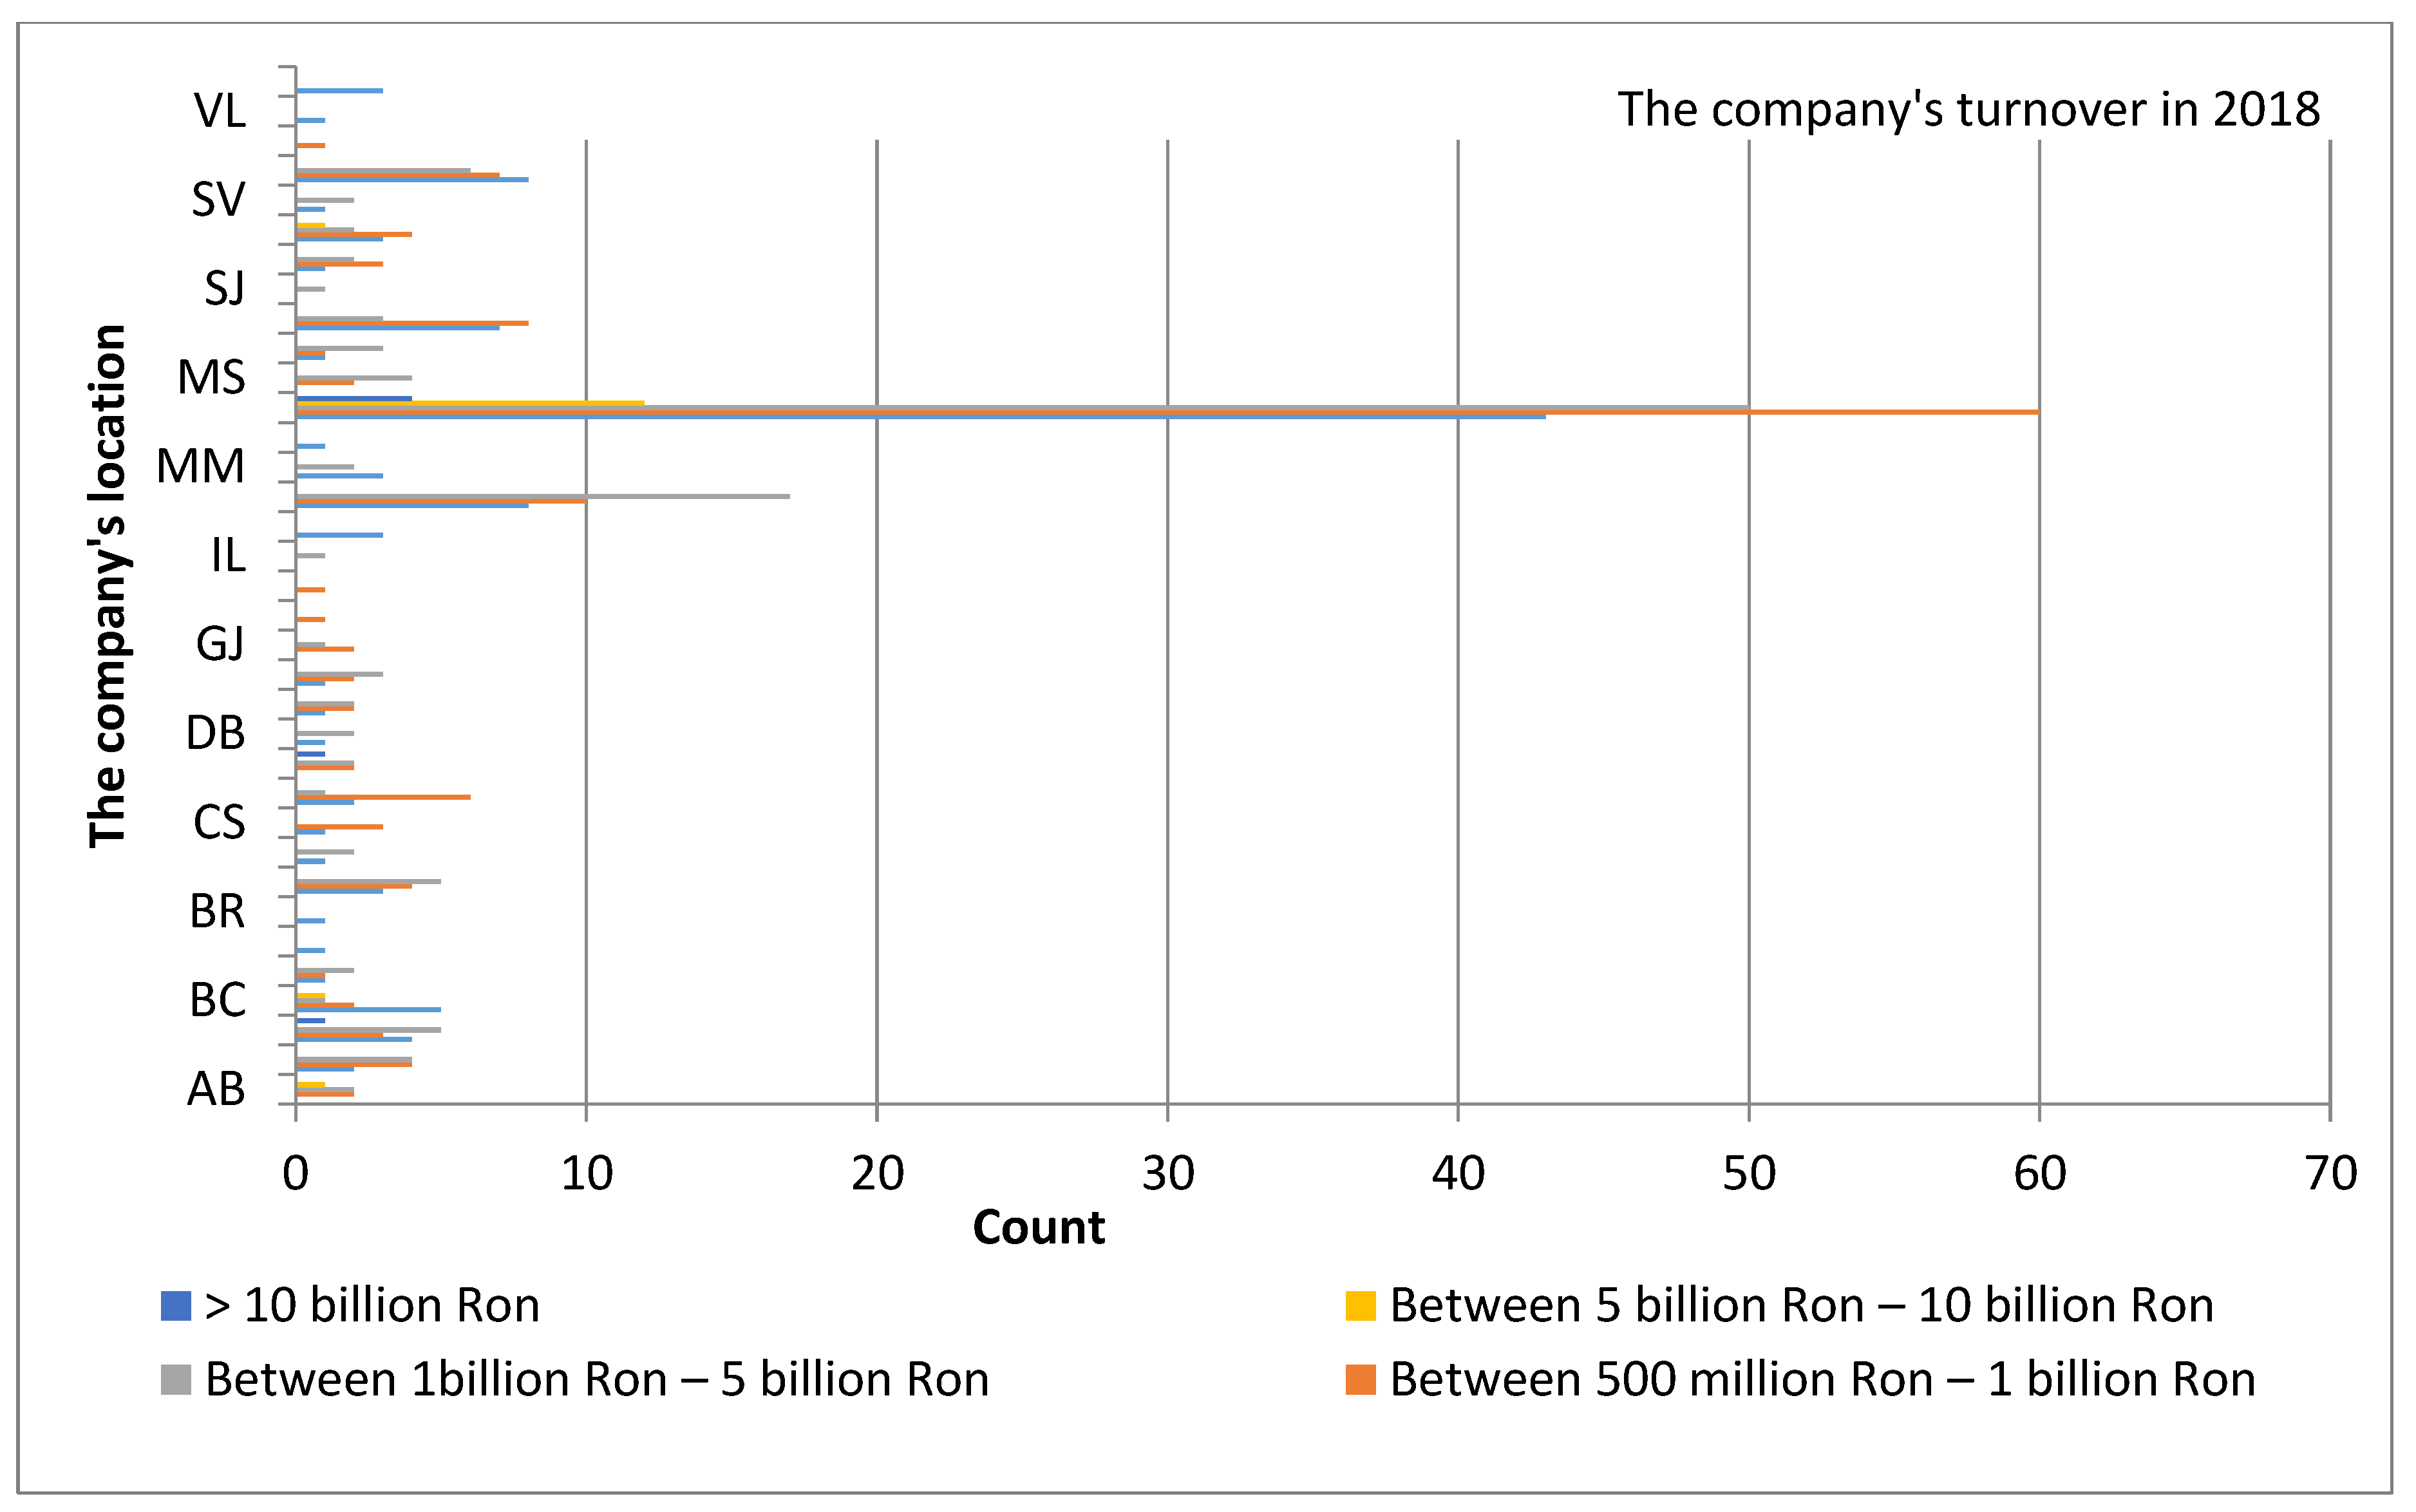
The top six companies in Romania had a turnover of over RON 10 billion and mainly came from three counties: Bucharest (four companies), Constanta (one company), and Arges (one company). The turnover of the 363 companies surveyed in the sample was between RON 500 million and 10 billion. Most of these companies came from different counties of the country, such as [
42] Bucharest (165), Ilfov (IF) (35), Timisoara (TM) (21), Prahova (PH) (18), Arges (AG) (12), Brasov (BV) (12), Arad (AR) (10), Sibiu (SB) (10), Bacau (BC) (9), Cluj (CJ) (9), Galati (GL) (6), Mures (MS) (6), Satu Mare (SM) (6), Alba (AB) (5), Constanta (CT) (4), Dolj (DJ) (5), Maramures (MM) (5), Olt (OT) (5), Bihor (BH) (4), Caras Severin (CS) (4), Buzau (BZ) (3), Dambovita (DB) (3), Gorj (GJ) (3), Iasi (IS) (3), Suceava (SV) (3), Vrancea (VN) (3), Botasani (BT) (1), Braila (BR) (1), Harghita (HR) (1), Hinedoara (HD) (1), Ialomita (IL) (1), Mehedinti (MH) (1), Salaj (SJ) (1), Tulcea (TL) (1), and Valcea (VL) (1) (
Figure 2 and
Table A1, which includes county abbreviation key).
The pretest was performed on a very small sample of respondents (eight companies) using four of the best interviewers and practiced the proposed methodology for the actual research. The results of pretesting contributed to increasing the quality of content, type, formulation, order, and precoding of questions. Given the limited duration and type of information, the questionnaire used to interview the business managers by telephone was highly structured, preferring closed questions with simple and multiple choice answers. Information processing was based on the responses received from company managers, and their compilation was performed in relation to the consistency and convergence of the research objectives. Tables and graphs were generated in SPSS after processing the questionnaire responses.
4. Results
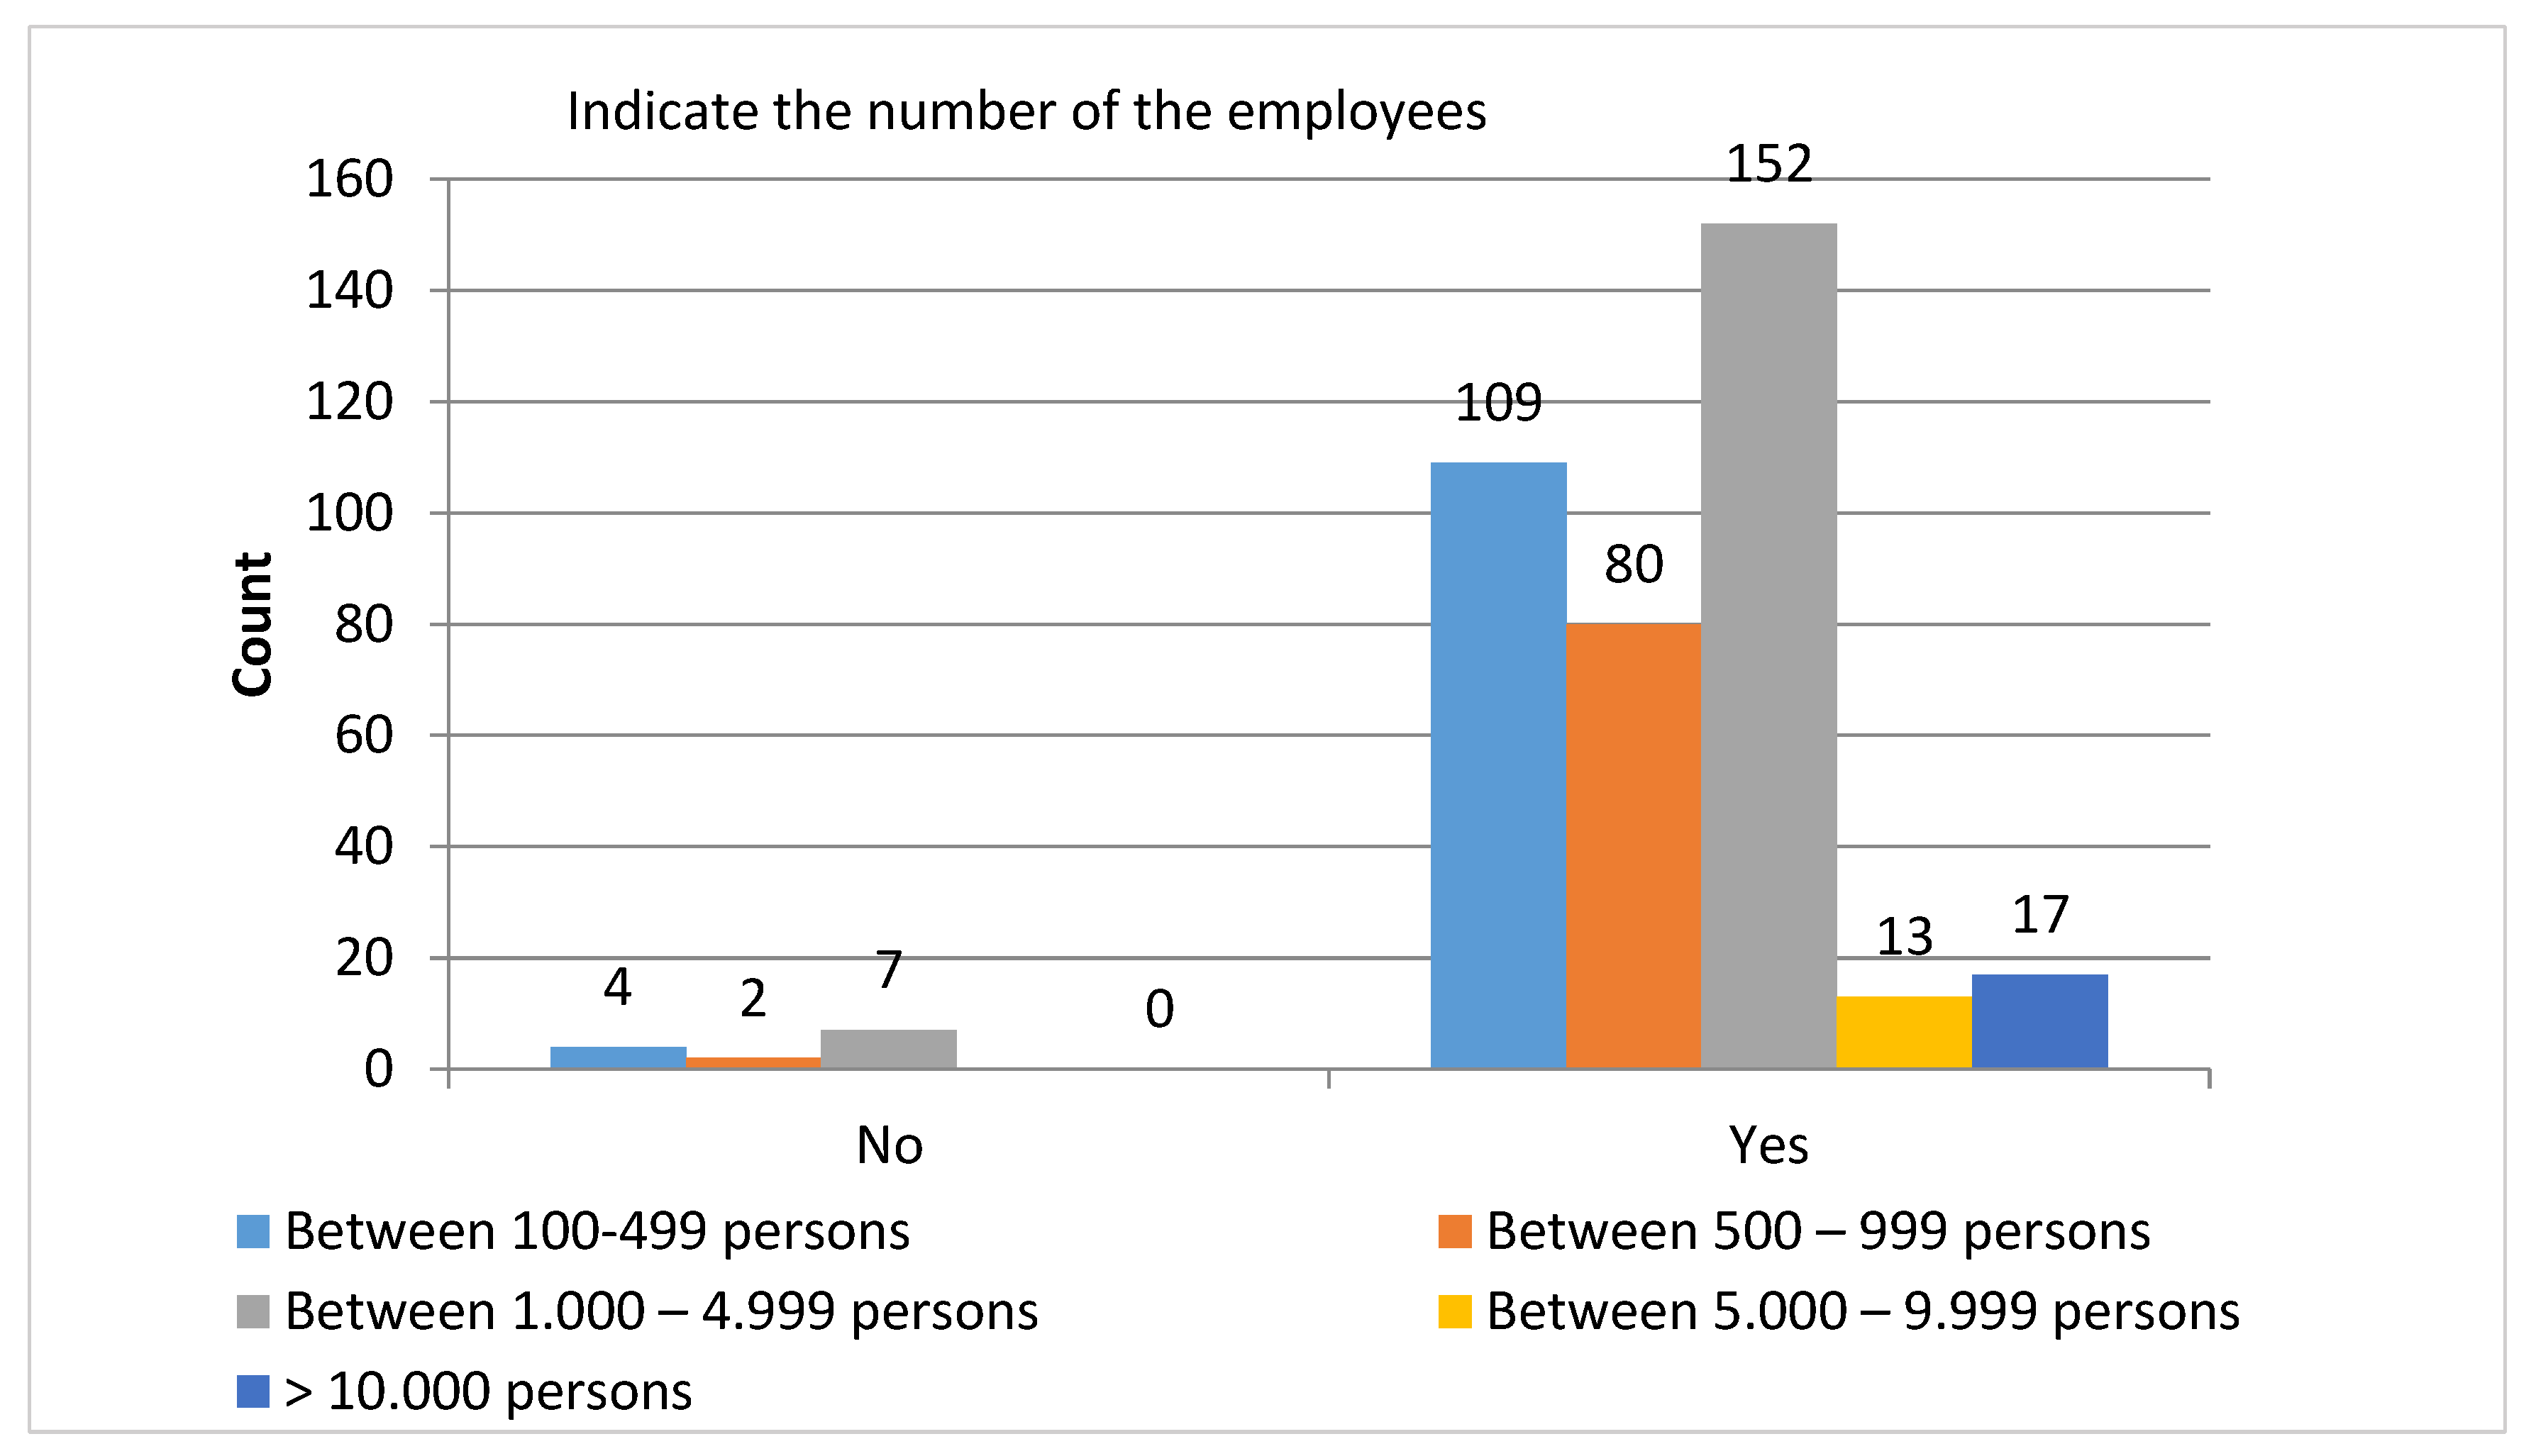
The first question was related to the aspect of sustainability strategy correlation with sustainability reporting at the company level. Out of the 384 respondents, 371 correlated the sustainability strategy with the sustainability report, and the rest responded negatively.
Table 1a,b shows the distribution of companies that correlated the sustainability strategy with the sustainability report, based on the average number of employees. In all five categories, the number of correlating companies was as follows: 152 (95.6%) companies had 1000–5000 employees, 109 (96.5%) companies had up to 499 employees, and 17 (100%) of companies had over 10,000 employees.
From the data presented in
Table 1c, it appears that the shares of companies that did not correlate the strategy with the sustainability report were as follows: 53.8% of the companies having 1000–4999 employees, 30.8% of the companies having 100–499 employees, and 15.4% of companies having 500–999 employees. Out of a total of 371 companies that correlated the strategy with the sustainability report, 41.0% of companies had between 1000 and 4999 employees, 29.4% of companies had between 100 and 499 employees, 21.6% of companies had between 500 and 999 employees, 3.5% of companies had between 5000 and 9999 employees, and 4.5% of companies had more than 10,000 employees (
Table 1c).
The main reasons invoked by 3.4% of the largest companies’ managers (13 companies), who did not correlate strategy with the sustainability report, were: (a) it was not anticipated that the activity of their own companies could become unsustainable; (b) joining financial data and other important components such as society and the environment did not carry out integrated financial reporting; (c) they had not thought of using it as a tool for exchanging information to increase consumer and investor confidence; and (d) they did not use framework models in financial reporting to integrate information related to company mission and vision, development strategy, CSR strategic role, corporate CSR actions, challenges and outcomes, progress, monitored indicators, and ways to involve stakeholders.
Instead, 96.6% of the analyzed companies (371 companies) that correlated the strategy with the sustainability report understood that the major components of the sustainability strategy needed to be constantly upgraded. The proposed missions of 51% of companies with 100–999 employees included sustainable issues such as offering new goods and continuously upgrading them, understanding and meeting current consumer needs, high-tech and quality services, supporting the development of a sustainable community, contributing to raising living standards, and accessibility to the technology process (
Table 1c).
The fundamental objectives of 92.0% of the companies with 1 to 4999 employees were to become sustainable by increasing the frequency of social objectives compared to economic ones (profit rate, turnover, labor productivity, etc.). Their managers acknowledged that their current concerns included new social objectives such as improving the wages and working conditions of employees, ensuring gender equality and respecting trade union rights, establishing permanency of suppliers in order to provide high quality services without harming natural resources, strengthening the dialogue between the company and the local community, and/or undertaking actions aimed at protecting and developing it.
Furthermore, 62.6% of companies with 500 to 4999 employees paid special attention to environmental objectives, another key component of the sustainability strategy. Managers’ concerns were geared toward reducing soil, water, and air pollution, using sustainable or recycled building materials, protecting biodiversity, reducing waste, and using renewable energy sources, etc. (
Table 1c).
The strategic options of 49% of the companies with over 1000 employees had become sustainable, with major implications for their activities. Among the strategic approaches mentioned by the analyzed companies were equipment upgrading, the development of sustainable integrated management systems, the diversification of production, the assimilation of new sustainable products, the formation of joint ventures with other foreign partners, the combination of production, the modernization of the organization, and the computerization of their activities (
Figure 3 and
Table 1c).
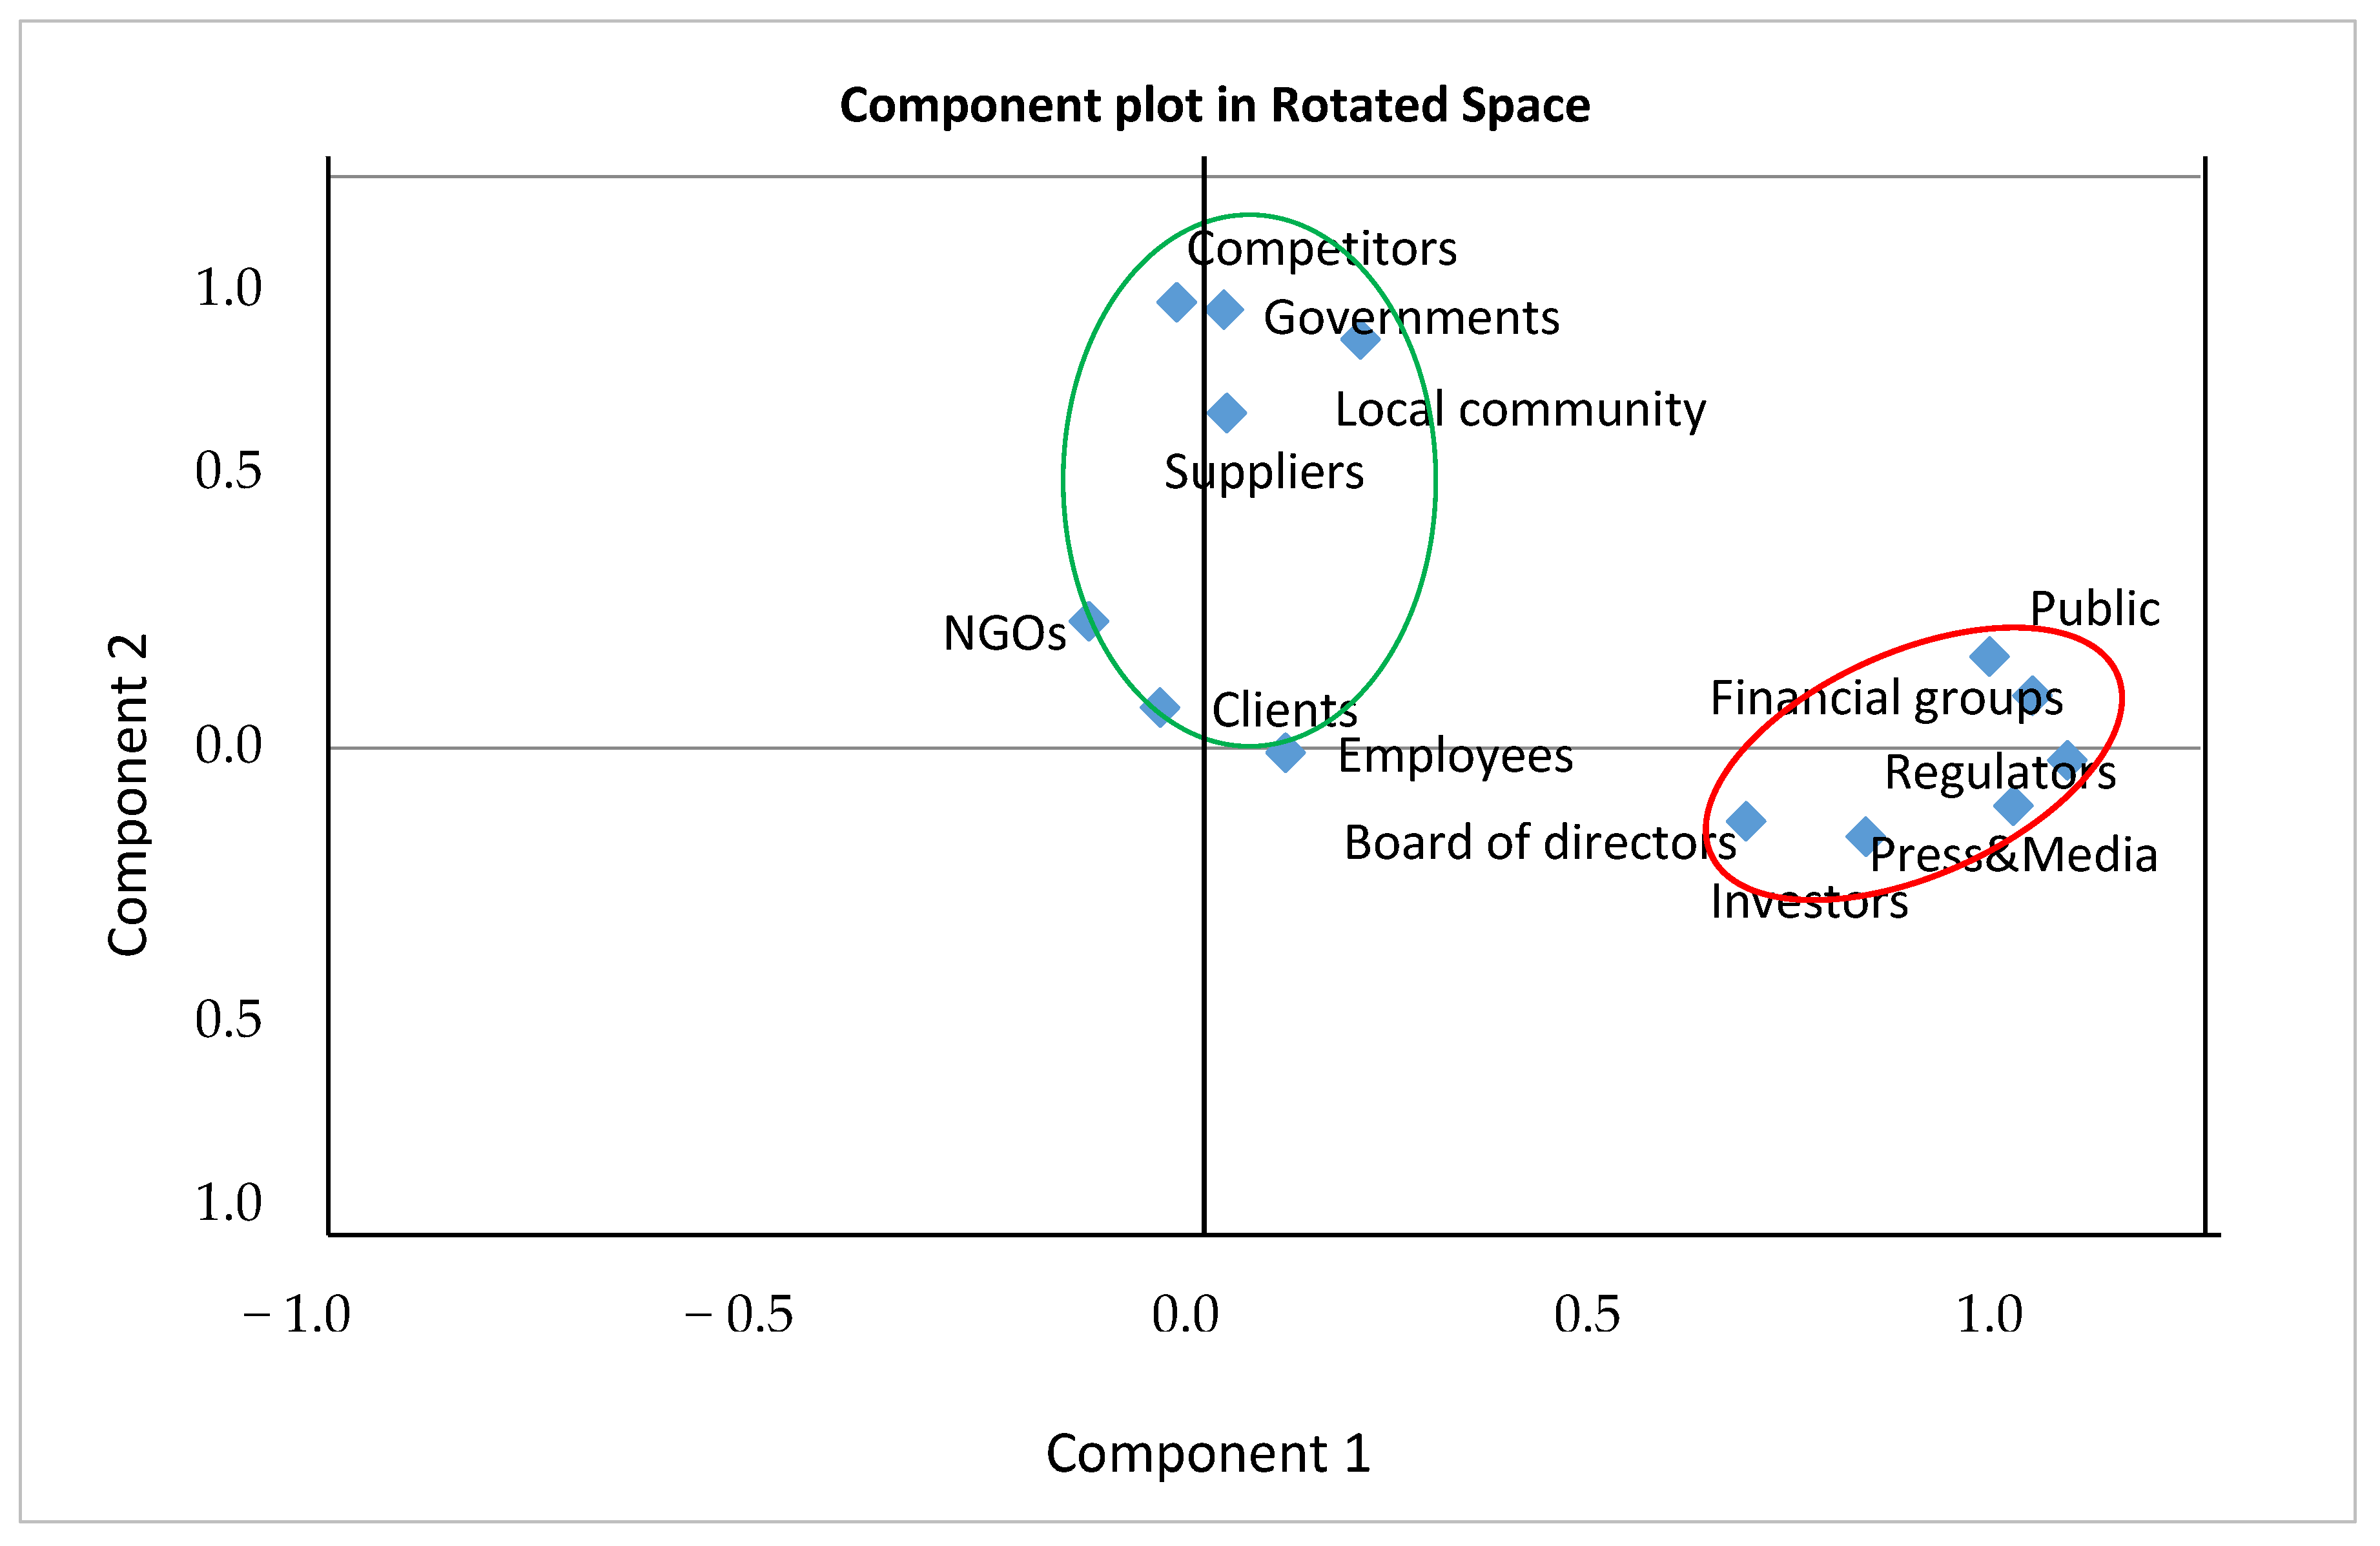
The second question concerned the appreciation of the importance of the opinions of the interested groups regarding the decision to reconsolidate sustainability reporting at the company level. Using the main component method, we determined the interdependencies among several variables, on the basis of which the managers of the top companies in Romania appreciated the importance of the opinions of the interested groups on the decision to reconsolidate the sustainability reporting. The variables were measured based on numerical scale ranges, each with five levels, from 5 = very important to 1 = very minor. The interested groups that were evaluated were Suppliers/Business partners, Clients/Consumers, Competitors, Financial groups, Press and Media, Governments and their agencies, Local community, Public, Employees, Board of Directors, Investors, NGOs, and Regulators and Sustainability Organizations (
Table 2).
In
Table 3, there is a relatively high correlation between the assessments of the importance of the opinions of the Public and those of the Financial groups (0.843), as well as between the importance of the opinions of Regulators and Sustainability Organizations and Financial groups (0.709). Few correlations were found between assessments of the importance of the opinions of Employees and those of the Suppliers/Business Partners (0.002), as well as the importance of the opinions of Clients/Consumers and those of the NGOs (0.003).
Table 4 shows that assessments of the importance of the opinions of Regulatory and Sustainability Organizations (0.867), Financial Groups (0.834), Press and Media (0.811), and the Public (0.792) were strongly correlated with the first component. At the same time, the assessments regarding the importance of the opinions of Competitors (0.780), Government and other agencies (0.766), Local community (0.712), and Suppliers/Business Partners (0.586) were strongly correlated with the second component.
Table 5 shows that the values of the correlation coefficients between the variables analyzed and the two main components obtained following the rotation of the axes, according to the Varimax method, did not undergo substantial changes. This Varimax method actually aims to maximize the coefficients of the variables strongly correlated with the main components [
43].
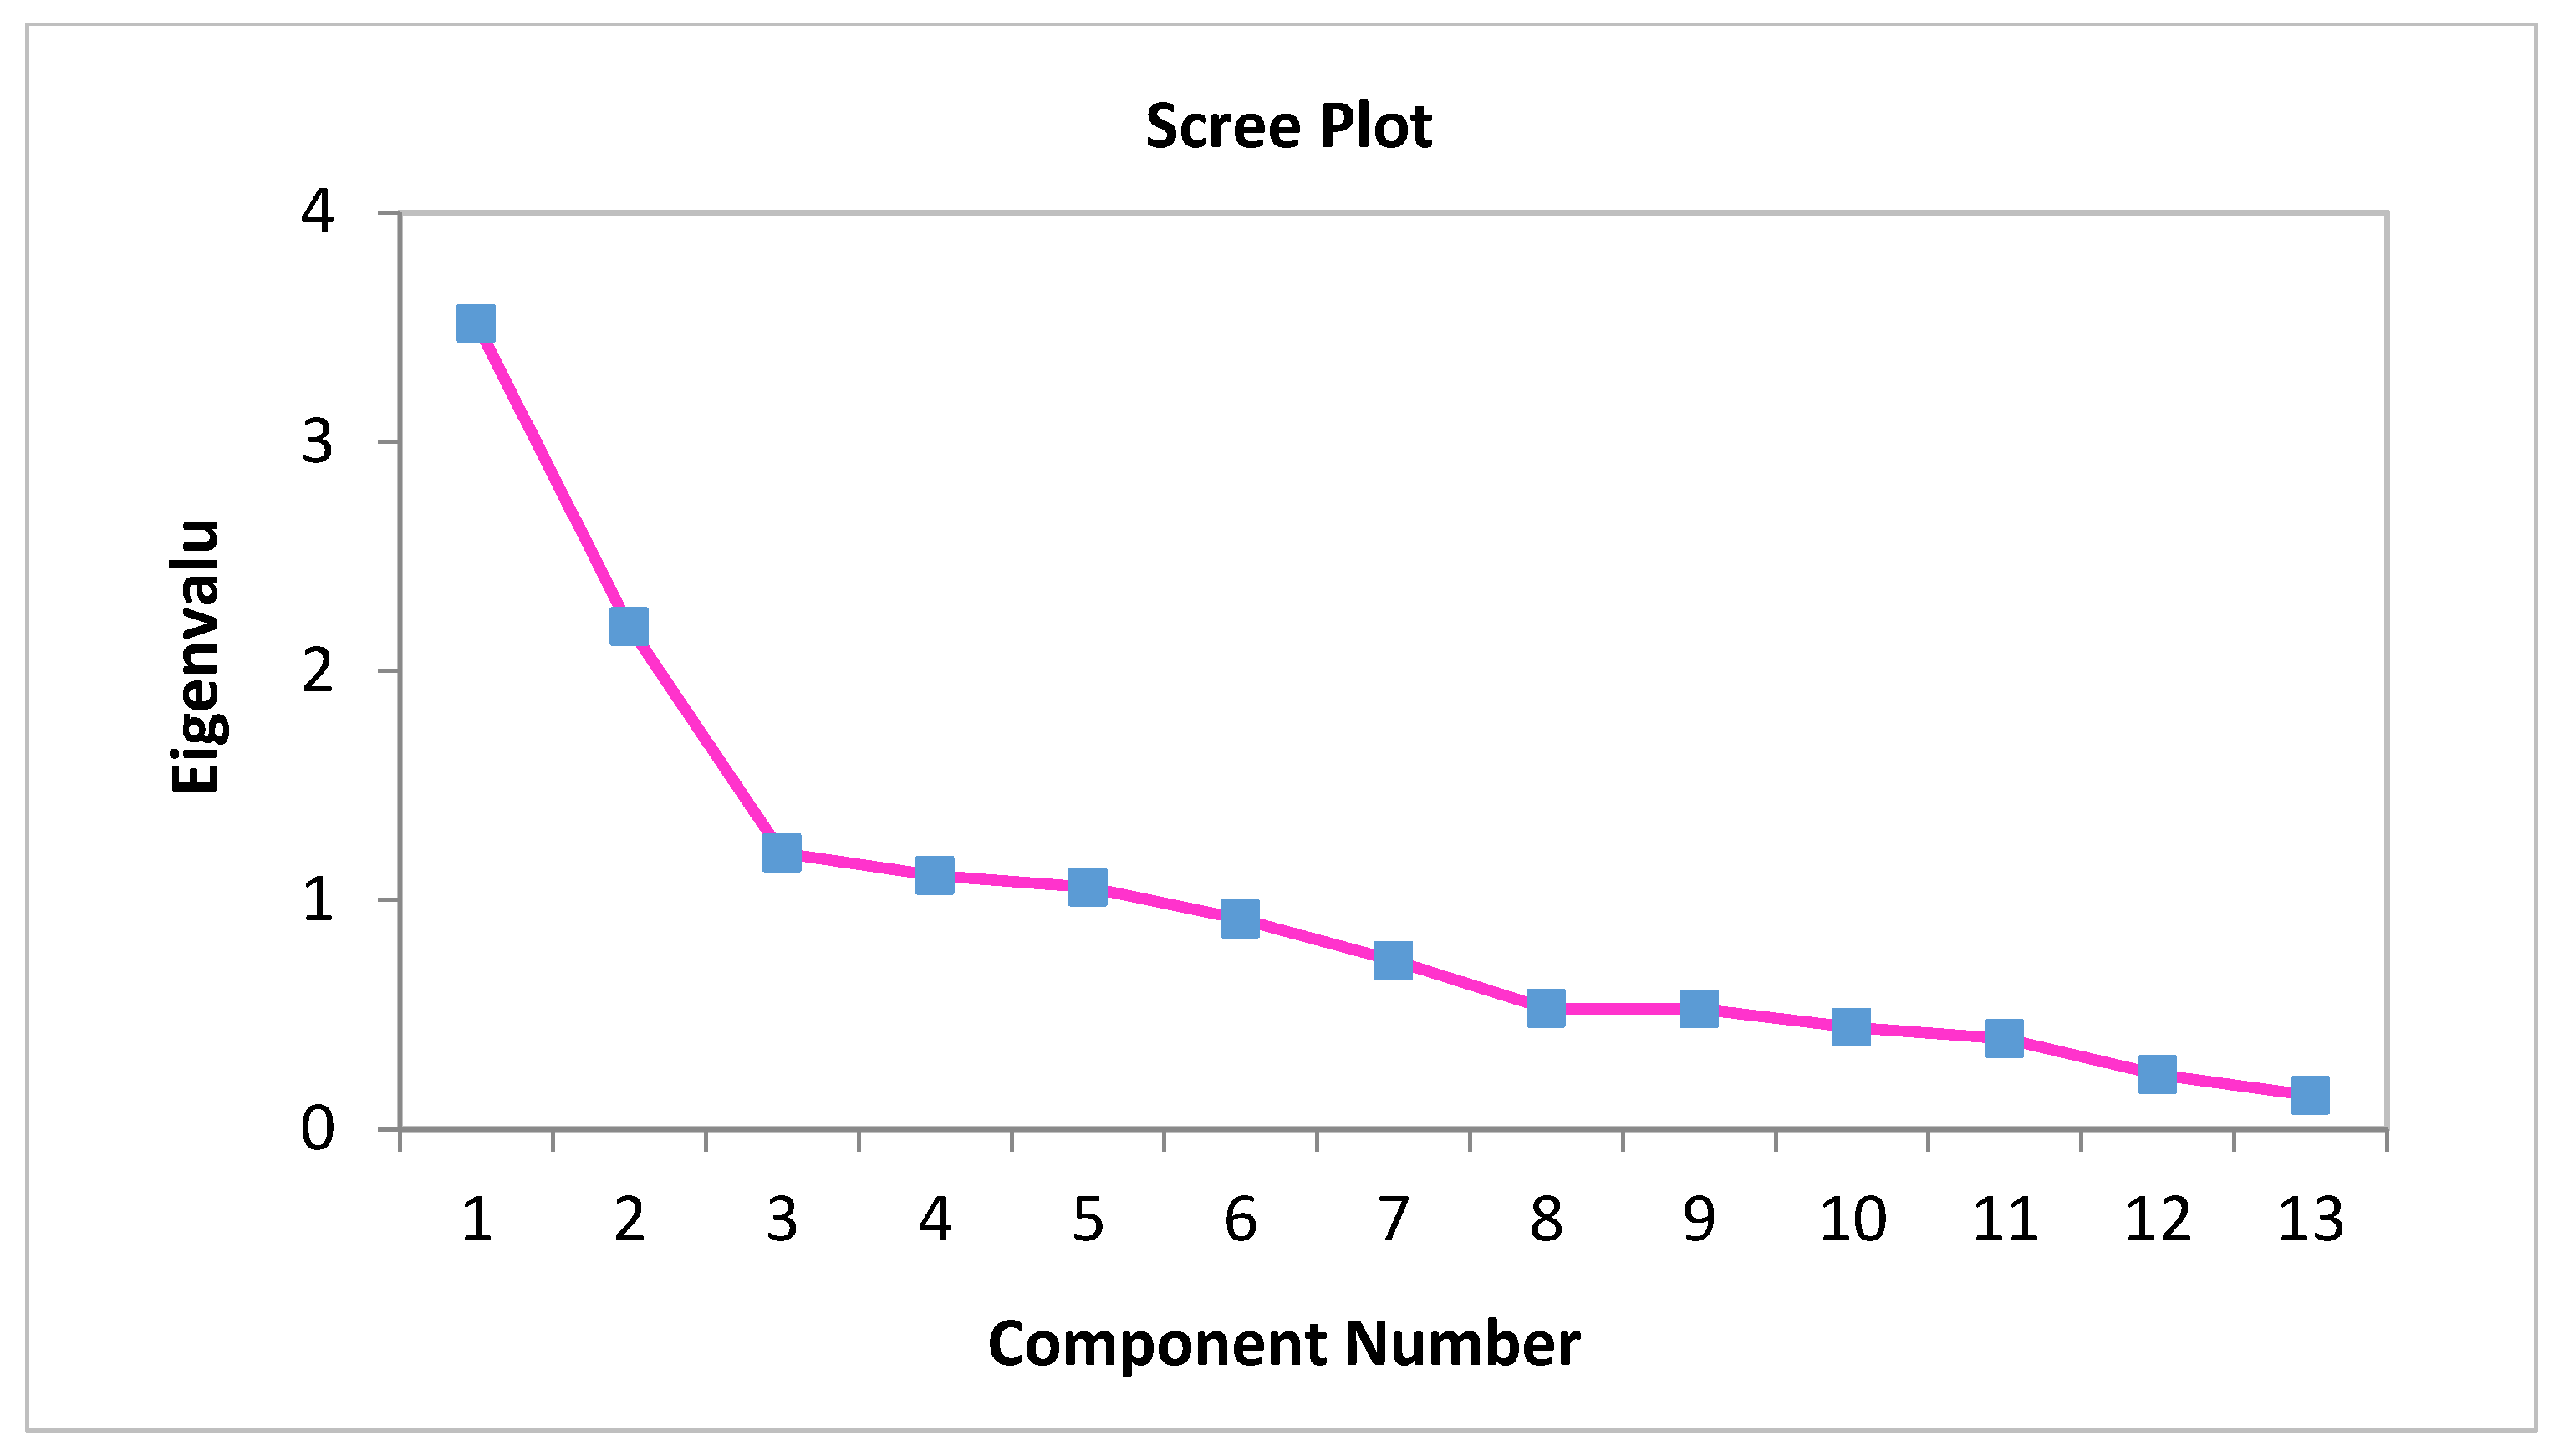
The differences between the values of the first two components and those of the other components are highlighted based on the graphical representation in
Figure 4.
Figure 5 shows that the first component was determined mainly by the variables Regulators and Sustainability Organizations, Financial groups, Press and Media, Public, Investors, and Board of Directors. The second component was determined in particular by other variables such as Local community, Employees, Clients/Consumers, Suppliers/Business Partners, Government and its agencies, Competitors, and NGOs.
The six companies in the sample with a turnover of over RON 10 billion in 2018 gave great importance to the opinions of some variables such as Clients/Consumers, Employees, Board of Directors, Suppliers/Business Partners, and NGOs. Romanian companies with a turnover of between RON 1 billion and 10 billion gave moderate importance to the opinions of the variables included in the first component, namely Regulators and Sustainability Organizations, Financial groups, Press and Media, Investors, and Board of Directors.
The variables included in the second component of Local community, Employees, Clients/Consumers, Suppliers/Business Partners, Competitors, and NGOs were assigned a high importance by companies with a turnover ranging from RON 500 million to 10 billion. Among the companies with a turnover of up to RON 500 million, there was a positive attitude towards Competitors, Governments and their agencies, Local community, Clients/Consumers, NGOs—Non-governmental organizations, Suppliers/Business Partners, Employees, Press and Media, and Public.
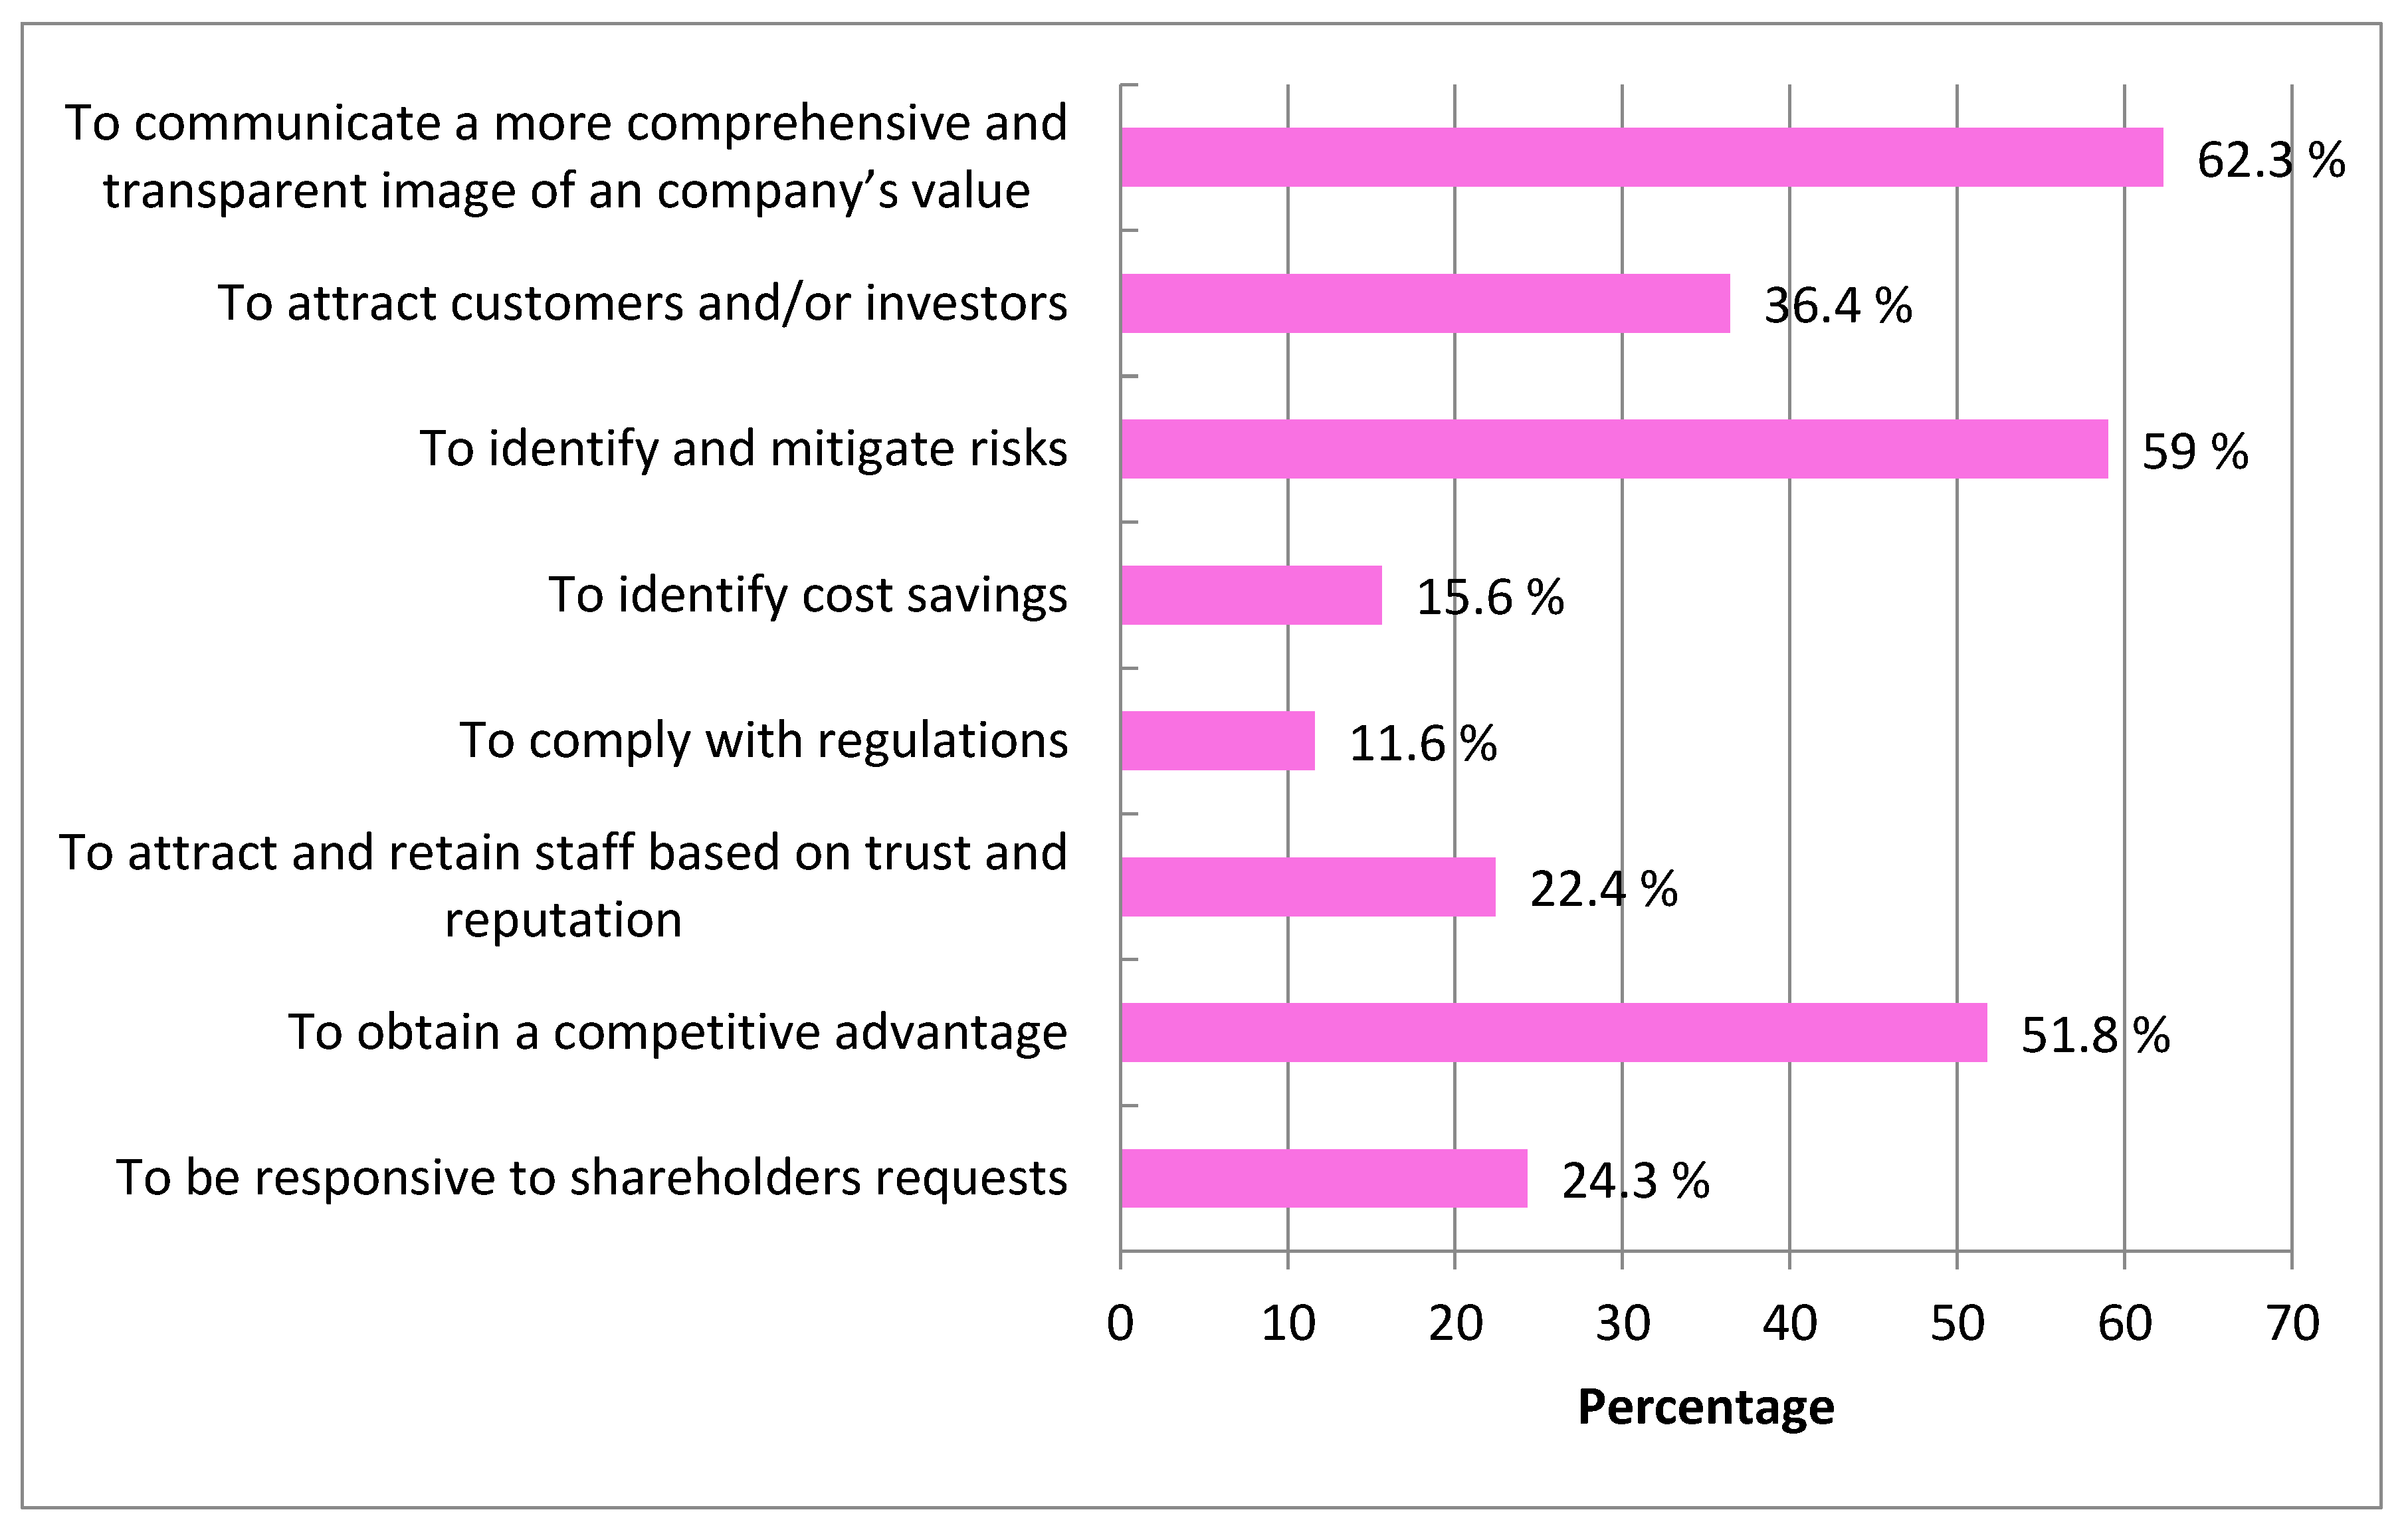
The third question concerned the identification of the company’s main objectives underpinning the sustainability report. A total of 371 respondents from the 384 companies analyzed returned 1051 responses, of which there were 13 non-responses (3.4% of the total sample). The first key objectives of strategic sustainability as indicated by the companies included in the sample were: “To communicate a more comprehensive and transparent image of a company’s value” (62.3%), “To identify and mitigate risks” (59.0%), and “To obtain a competitive advantage” (51.8%). Two of the targets/goals less targeted were: “To identify cost savings” (15.6%) and “To comply with regulations” (11.6%) (
Figure 6).
Of particular importance were three other targets indicated by the companies analyzed from the point of view of sustainability, such as: “To attract customers and/or investors” (36.4%), “Be responsive to shareholders’ requests” (24.3%), and “To attract and retain staff based on trust and reputation” (22.4%). However, nine out of 10 respondents (96.6%) recognized that by integrating the eight sustainable development objectives into strategic policies and by clearly highlighting the results obtained and the risk prevention measures in the sustainability report, it would increase the transparency of the information environment, social, governance, and financial performance of the companies (
Figure 6).
In the contingency table (
Appendix A,
Table A2) it can be seen that the distribution of sustainability reporting objectives by sample size of the companies grouped in five categories by profitability was different.
The percentages of the targets: “To communicate a more comprehensive and transparent image of a company’s value” and “To identify and mitigate risks” were 62.3% and 59%, respectively. This difference was due to companies with a profitability ranging from RON 100 million to 500 million who had given priority to the “To identify and mitigate risks” objective (11.3%), unlike most of the companies in the sample who preferred the “To communicate a more comprehensive and transparent image of a company’s value” (10.5%).
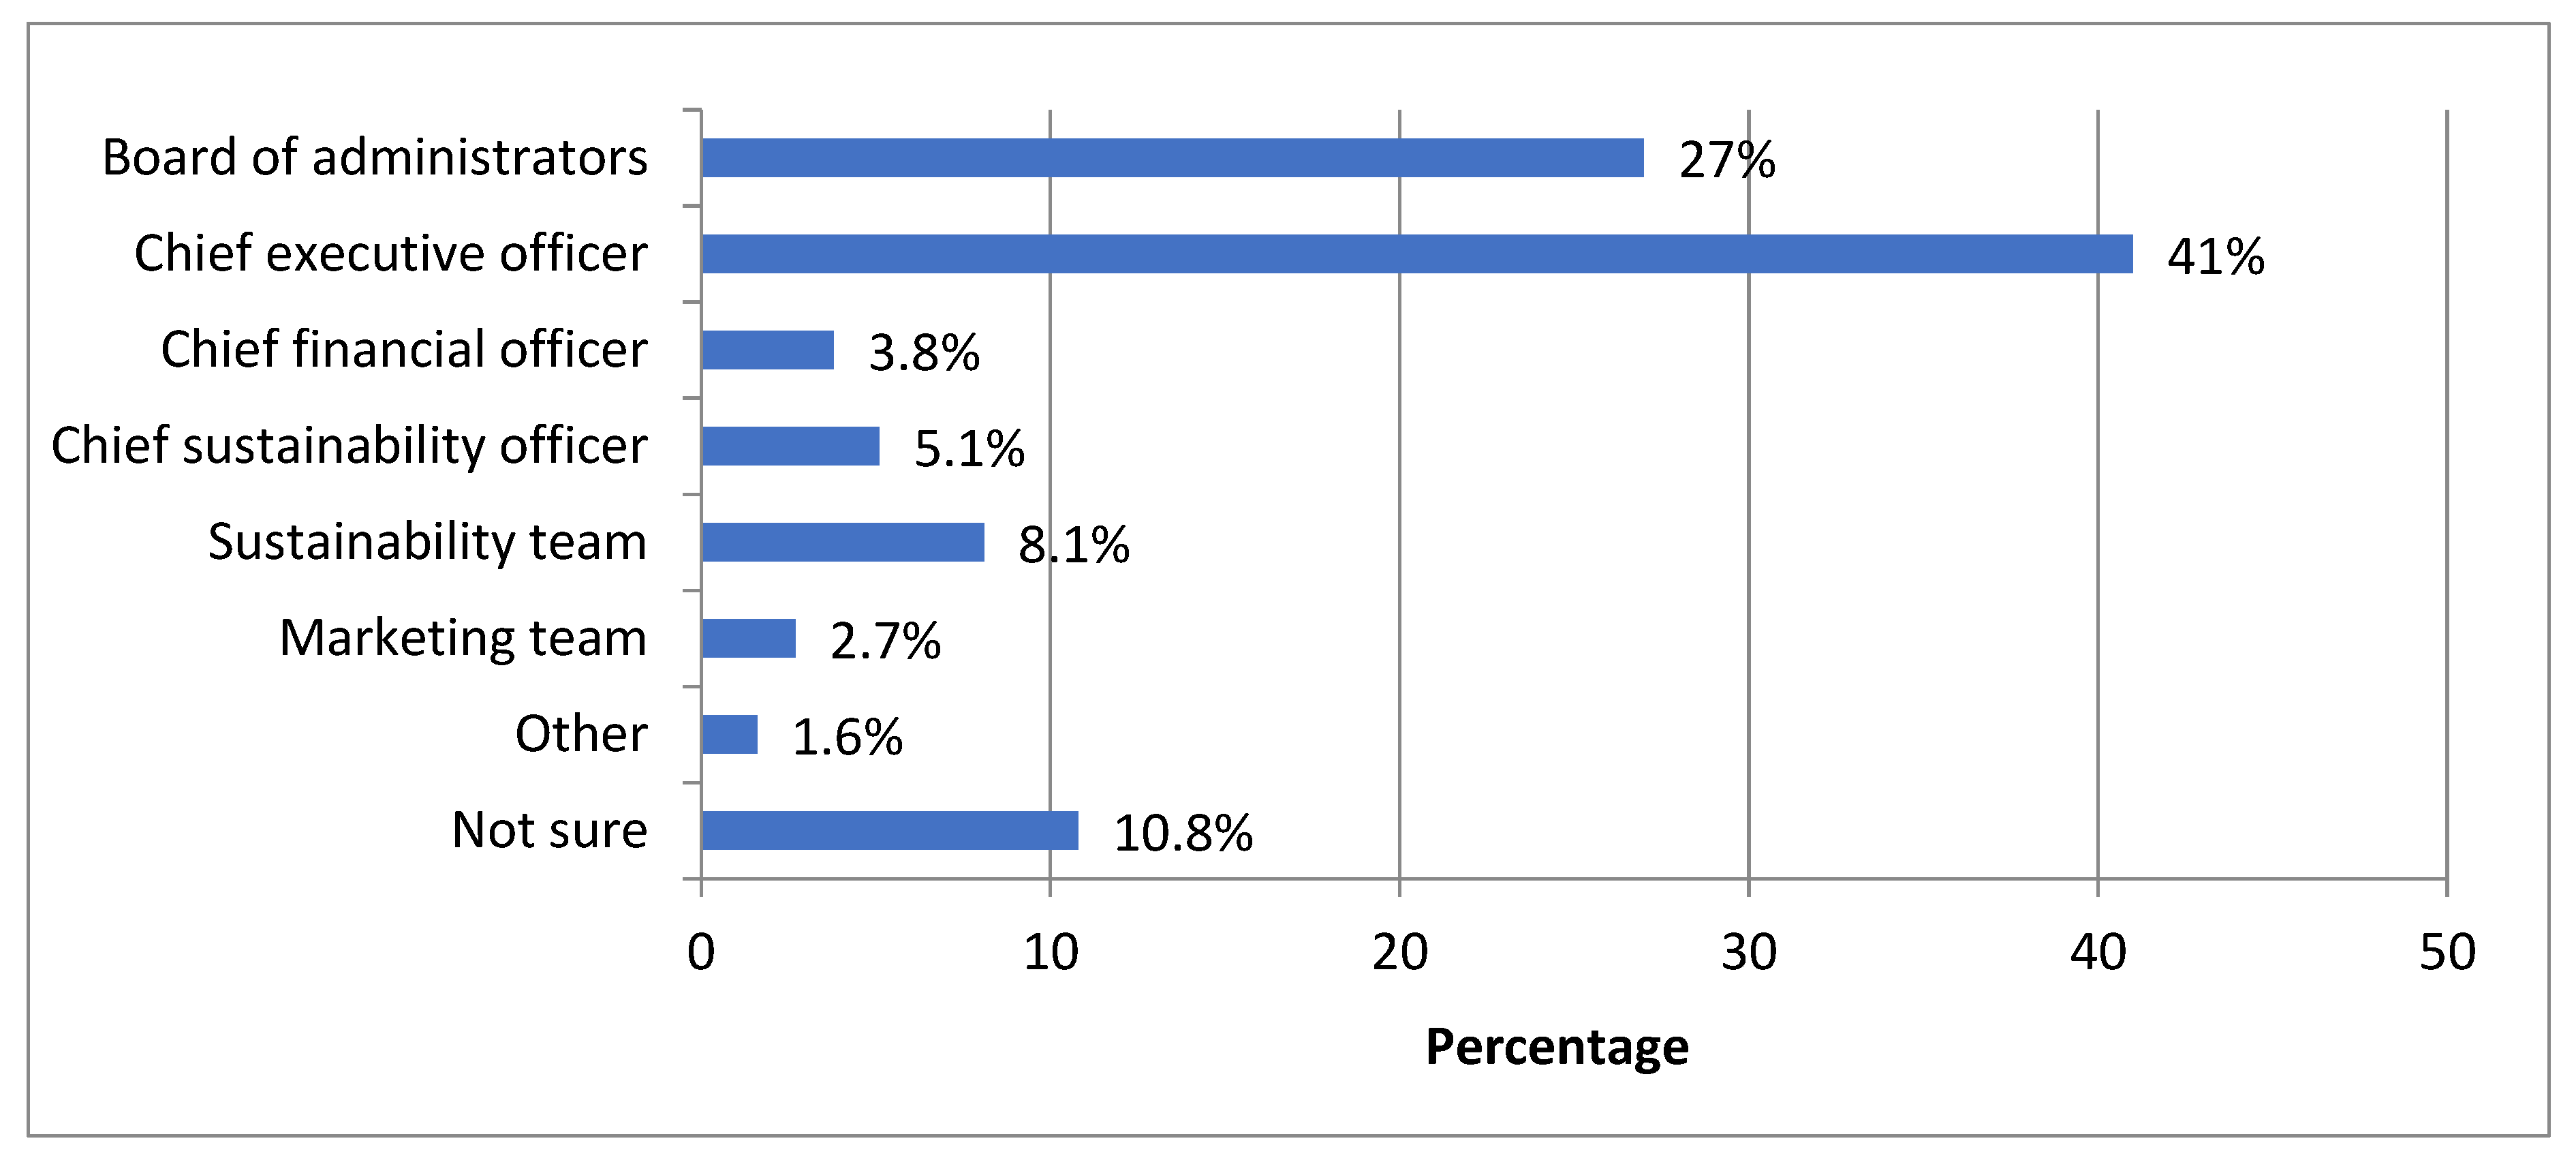
The fourth question allowed the identification of the team that is fully responsible for reflecting the sustainable strategy through the sustainability report. An important aspect of the survey was the recognition of responsibility for the sustainable strategy communicated in the company’s sustainability report. In addition, 41% of the managers indicated that the Chief Executive Officer was responsible. A significant number of respondents (27%) indicated that responsibility should be given to the Board of Administrators.
Nevertheless, 96.6% of the managers admitted that they gave great importance to performance management systems and corporate governance implemented within companies, based in particular on sustainability strategies (
Figure 7). More than 12.4% of respondents said they were not sure (Not sure) who had the responsibility to reflect the sustainability strategy in the sustainability report or indicated other parties. If 8.1% of respondents considered that the responsibility should be attributed to the Sustainability Team, another 5.1% of managers responded that it was the responsibility of the Chief Sustainability Officer (
Figure 7).
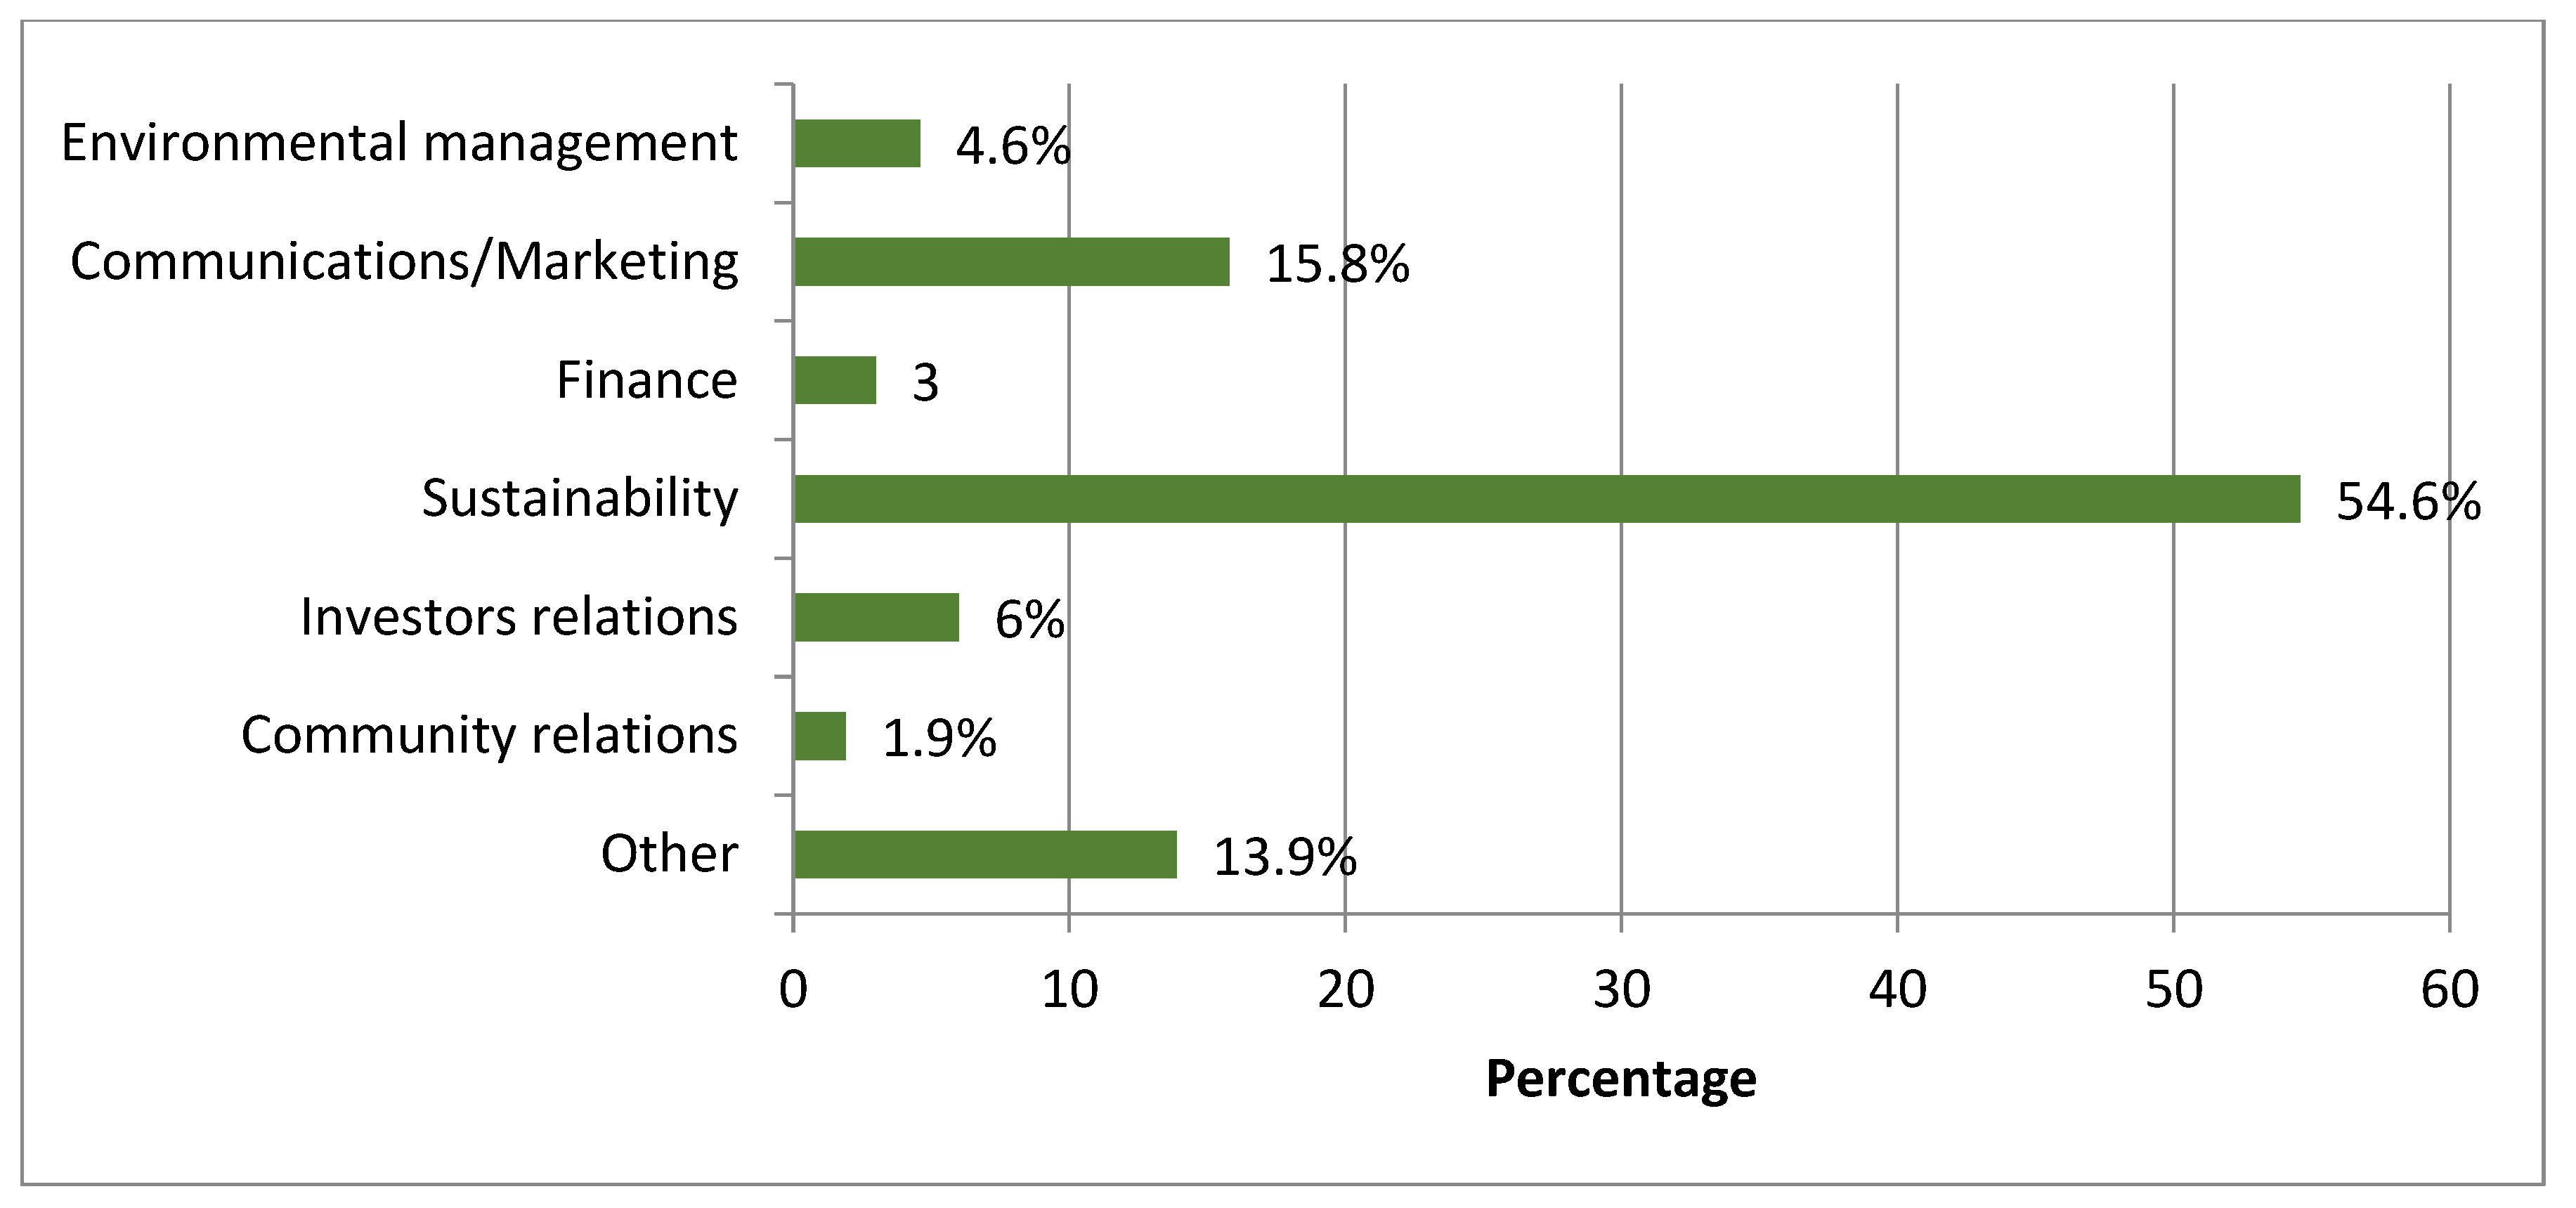
The fifth question defined the one within the groups responsible for the company’s sustainability report. As sustainability reporting is conducted concurrently with the process of developing the company’s overall strategy, there is a need to know the responsible groups involved in their preparation.
Figure 8 shows that more than half of the respondents indicated that the sustainability report of the company should be prepared by the Sustainability Department (54.6%). Managers of the most valuable companies (54.6%) in Romania said that sustainability reports should be developed in accordance with the GRI G4 guide [
44] and the European Commission Communication 2017/C215/01 guidelines on non-financial reporting (the methodology for reporting non-financial information) and companies should define their own visions on long-term sustainable development within them (
Figure 8).
Moreover, 15.8% of the managers said that the responsibility for preparing and publishing the sustainability report should go to the Communications/Marketing Department and another 13.9% of the respondents indicated other departments within the company (
Figure 8).
The structure of the report tracks important issues included in the company’s overall strategy, such as contributing positively to society and community, managing and reducing the environmental impact, ensuring fair treatment for all employees, and improving the company’s position in the market. It also aims to outline a comprehensive picture of the company’s activities and performance in the field of sustainability. Therefore, those responsible for reporting must ensure that all of these aspects are in line with the overall business strategy and sustainability strategy. If the Sustainability Department remains responsible for the accuracy of the information contained in the report, then the Chief Executive Officer (CEO), the highest governing position at the company level, is responsible for its approval, signing, and publication.
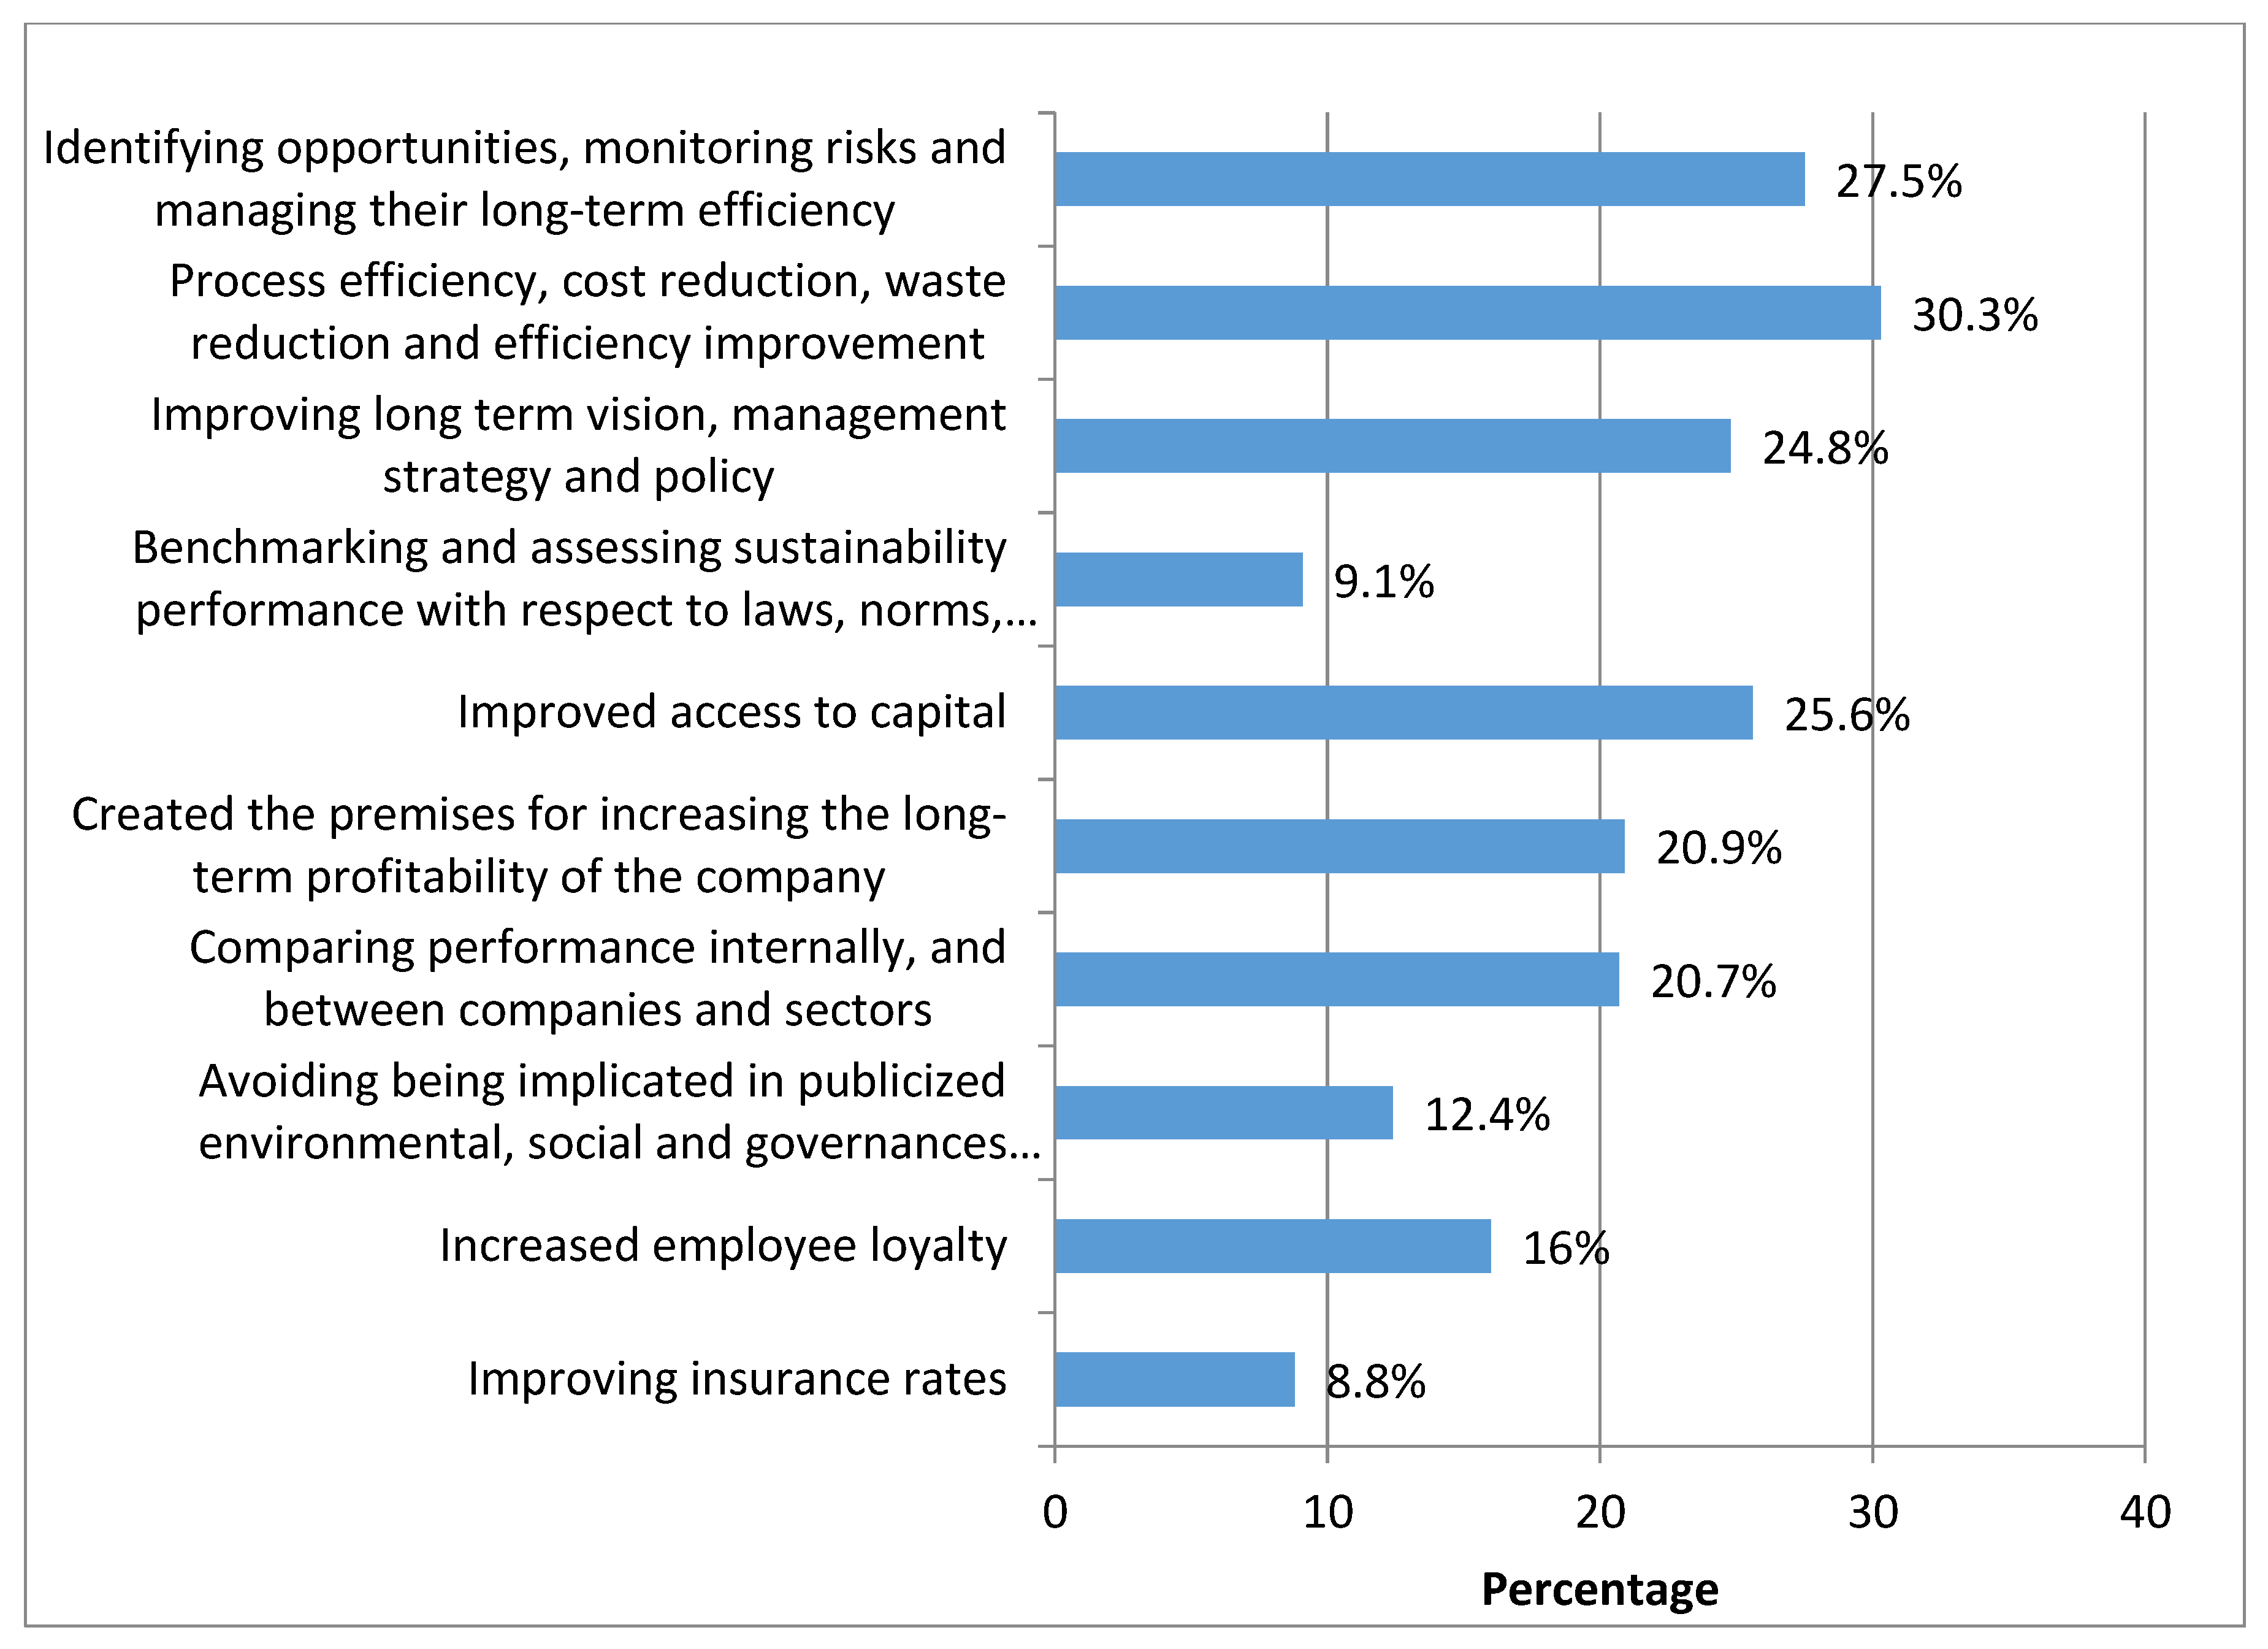
The sixth question concerned the distinction between the internal benefits for the company following the development of the sustainability report. Regarding the internal benefits generated following the company’s sustainability report, the responses were different. There were 712 responses from 363 responding companies and 21 non-responses (5.5% of the total sample).
Even so, 30.3% of respondents indicated that the first internal benefit was “Process efficiency, cost reduction, waste reduction, and efficiency improvement” and were confident that collecting data and concentrating/combining them into a sustainability report helped them to develop new long-term strategies. All of the collected data may be useful for conducting innovative processes, reducing production or distribution costs, reducing waste, and identifying new markets that are accessible to the company (
Figure 9). The second largest internal benefit indicated by 27.5% of respondents was “Identifying opportunities, monitoring risks, and managing their long-term efficiency.” Therefore, the information in sustainability reports can enable companies to anticipate and solve supply-chain issues, increase the efficiency of procurement processes, anticipate the future shortage of materials, and re-focus on the exploitation of alternative resources.
Two other important advantages indicated by the respondents were “Improved access to capital” (25.6%) and “Improving long term vision, management strategy and policy” (24.8%). Transparency through communication of the categories of sustainable activities could help attract a considerable number of investors and lower the costs of capital attracted to competitive markets. On the whole, the sustainable engagement of all companies will lead in the long term to differentiate them in the market, substantiate knowledge-based strategies and policies, and increase profitability (
Figure 9).
Differences in the distribution of the internal benefits generated by the sustainability reporting in relation to the company’s field of activity in the sample are shown in the contingency table (
Table A3,
Appendix A). Companies operating in Tourism, travel, and restaurants (1.1%) and Construction (1.7%) prioritized “Identifying opportunities, monitoring risks, and managing their long-term efficiency.” Finance/insurance/real estate/information services (2.5%) and Transport and utilities, telecommunication (4.7%) chose “Process efficiency, cost reduction, waste reduction, and efficiency improvement” as the first advantage. Companies in fields such as Trade (6.9%), Business/finance/insurance/real estate/information services (1.4%), Transport and utilities, telecommunications (4.1%), and the Manufacturing industry prioritized “Improving long term vision, management strategy, and policy.” Other companies operating in areas such as Agriculture/forestry and fishing/mining (1.7%), Business/finance/insurance/real estate/information services (0.8%), and Construction gave less priority to the “Improved Access to Capital” objective, arguing that investments were based on equity (
Table A3,
Appendix A).
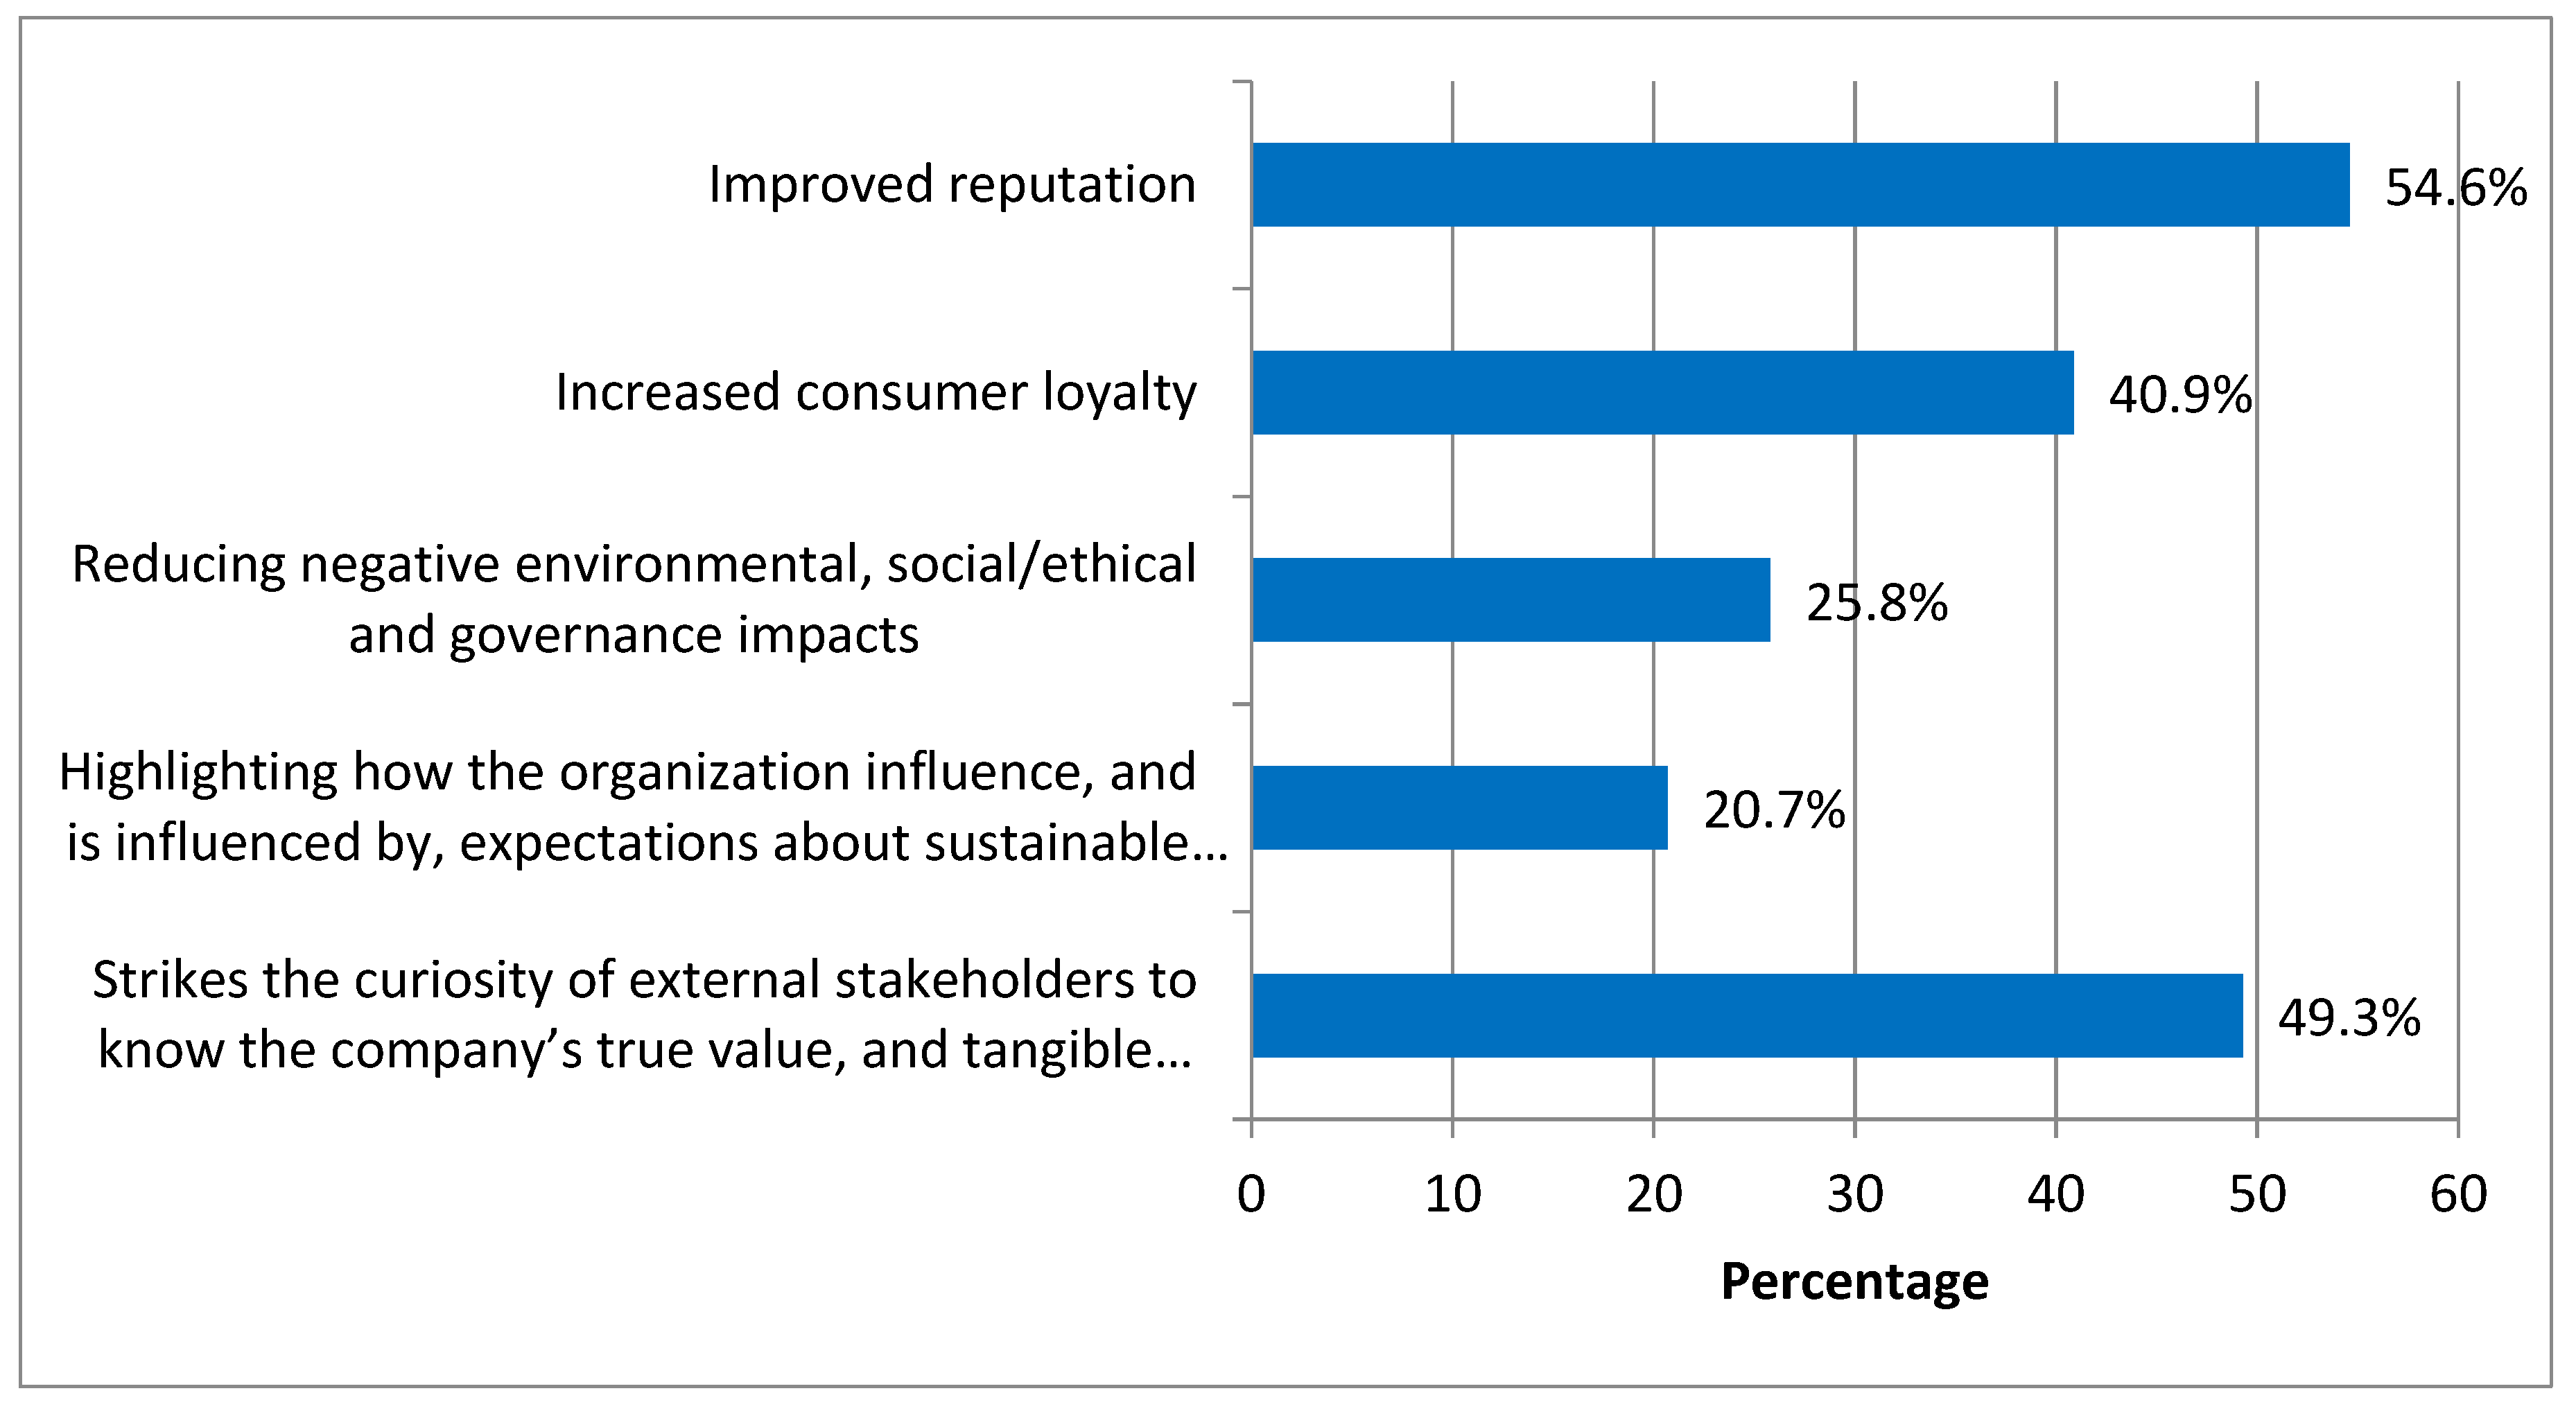
The seventh question referred to knowing the external benefits obtained by the company after drawing up a sustainability report. Companies also indicated distinct responses to the external benefits of the sustainability report. The share of responses reached 93% of the total sample (357 respondents), while the share of non-responses was 7% (27 non-responses).
“Improved reputation” (54.6%) and “Strikes the curiosity of external stakeholders to know the company’s real value and tangible and intangible assets” (49.3%) were the first two external major benefits that companies could gain from the data included in the sustainability reports. Sustainability reports can be important tools in the hands of companies in order to carry out building or restoration processes. The managers of the companies surveyed said that sustainability reporting could help improve brand image, increase consumer confidence in the company’s products/services, identify new consumer segments or serve distinct consumer choice segments, and allow for standard running, software or otherwise (
Figure 10).
Furthermore, a total of 49.3% of respondents stated that increasing transparency was the most important way to increase the trust of external stakeholders by letting them know the company’s real value, and also its tangible and intangible assets. Another important external benefit indicated by the managers responding was “Increased consumer loyalty” (40.9%), and they confirmed that the success of their own companies within the market was ensured by including sustainability strategic objectives such as building loyalty programs and increasing customer loyalty. Two other external benefits indicated by companies were “Reducing negative environmental, social/ethical, and governance deficits” (25.8%) and “Highlighting how the organization influences, and is influenced by, expectations about sustainable development” (20.7%). Sample companies that included sustainable development strategies in their own reports were already effectively managing their environmental and economic activities, improving their operational efficiency, using limited natural resources, and building lasting relationships with shareholders, employees, and other stakeholders (
Figure 10).
Table A4 (
Appendix A) shows the distribution of companies across 35 counties in Romania according to five external benefits specific to sustainability reporting. Companies active in Bucharest indicated that in following the sustainability reporting the first external benefits experienced would be related to “Improved reputation” (23.5%) and “Strikes the curiosity of the external stakeholders to know the company’s real value and tangible and intangible assets” (22.4%).
“Increased consumer loyalty” was the second external benefit, after “Improved reputation,” as indicated by 42 of the companies in the sample from counties like AR (four companies), CJ (four companies), CT (three companies), DJ (four companies), IF (14 companies), PH (seven companies), SM (three companies), and SV (three companies). Companies in seven counties—AG (seven companies), BV (four companies), BZ (two companies), GJ (two companies), IL (one company)—indicated that the significant external benefits gained from sustainability reporting were related to “Reducing negative environmental, social/ethical, and governance impacts” (
Table A4,
Appendix A).
5. Discussion
Often a priori and declaratively correlated with sustainability reporting (non-financial), sustainability strategies do not have a well-defined place in the strategic vision of many companies. However, 96.5% of the managers said that the sustainability report played a significant role in the business environment in terms of the relevant information provided and was the starting point for establishing their own sustainability strategy. Only 13 managers admitted that they did not correlate the sustainability strategy with the sustainability report. As seen in
Table 1c, nine out of 10 managers of companies with more than 1000 employees must set up and meet a number of sustainable objectives such as improving the wages and working conditions of employees, ensuring gender equality and respecting trade union rights, strengthening the dialogue between the company and the local community, and/or undertaking actions aimed at protecting and developing it. A total of 62.6% of company managers with more than 500 employees set their environmental priorities with sustainable targets including reducing soil, water and air pollution, using recycled materials, protecting biodiversity, reducing waste, and using renewable energy sources.
In the current economic, social, and legislative context, Romanian companies have the opportunity to decide, depending on the nature of their own activities, on their culture and values, on who the essential stakeholders are for the development of future businesses, and on the importance of their opinions in deciding to reconsider the sustainability report. As shown in
Table 2, 96.6% of the managers recognized the contributions of all kinds of customers and employees as the ones that generated the highest responsibilities on the part of the company. Therefore, regardless of the size of the turnover, the respondents were looking to identify, recruit, develop, and maintain people with the appropriate skills and experience that resonated with the values and priorities of their strategic alternatives. In addition, the customers evaluated and appreciated the quality of their employees by distinguishing them, a feature that makes the motivation and retention of the best of them crucial. By recording the highest average of ratings (4.84), Clients and their relationships with them became the most important factor for all of the respondents, especially when it came to their satisfaction. The respondents said they were more concerned with loyalty to their customers and building profitable long-term relationships than with attracting other customers or making new deals.
Several groups, such as the Board of Directors (3.82), Investors (3.45), Press and Media (2.99), Regulators and Sustainability Organizations (2.87), and Financial groups (2.46), earned a good average of the assessments of the importance given in the decision to reconsolidate sustainability reporting at the company level. These groups constantly influence a company’s actions, decisions, policies, and objectives. If the opinion of the Board of Directors is important for the managers interviewed in order to establish sustainable development goals and identify the means by which they could be reached, the opinions of investors and financial groups is essential in terms of increasing the funding of their own companies and accessing as many financial resources as possible, which will ultimately lead to positive economic growth. Minor importance was given by the managers to Public opinion (2.33) and Local community (2.31). One aspect highlighted by a large number of interviewed managers was the close relationship with the community—neighborhood residents, community institutions, environmental groups, consumer advocacy groups, etc. Even more moderate was the importance given by managers to the opinions of the following groups: Competitors (1.99), Suppliers/Business Partners (1.44), Governments and their agencies (1.86), and NGOs (1.16).
At the same time, nine out of ten respondents recognized that the overall objectives underpinning the company-specific business process objectives, designed in accordance with the strategic management system and published in all reports, needed to be reviewed periodically to ensure their relevance to the current context. Joining the sustainable development objectives to the company’s overall objectives ensures the improvement of all of the processes included in the integrated management system and remains in line with the declared policy. The priorities of the sustainable development objectives included in the report, according to the managers of the 371 companies, regardless of the level of profitability, were (a) building a real, comprehensive, transparent, and social image that would lead to an increase in the company’s performance and strengthening relations with stakeholders (62.3%); (b) identifying and evaluating the risks of activities carried out at all department levels of the company by taking into account collaborative and environmental relationships and mitigating risks by adopting risk mitigation measures if they become a threat (59%); and (c) gaining competitive advantages in the market by stimulating technological innovation and the use of specific know-how by matching product costs and prices, differentiating products and services, or by rapidly responding to customer requirements (51.8%). The same managers granted less importance to objectives such as the “Identification of cost savings” (15.6%) and “Compliance with regulations” (11.6%).
Fewer than half of the interviewed managers (41%) pointed out that, alongside responsibilities such as identifying medium- and long-term sustainable objectives, communicating regularly with shareholders and the president of the company, identifying the challenges faced by the company, and developing sustainable relationships with its stakeholders, the Chief Executive Officer (CEO) has the task of creating a sustainable strategy that is reflected in the company’s sustainability report. More than 54.6% of the respondents reported that the sustainability report should be done by specialists from the Sustainability Department. Moreover, the same respondents stressed that reporting would become balanced, transparent, and credible if the Guide on Global Reporting Initiative (GRI-4) and the European Commission Communications 2017/C215/01 guidelines on non-financial reporting (methodology for reporting non-financial information) were respected and used.
The internal benefits due to the sustainability reports were multiple for 95.5% of the managers (363 companies) operating in different sectors of activity. As
Table A3 indicates, the 122 manufacturing respondents identified advantages such as: (1) improving the long-term management vision, strategy, and policies (29.5%); (2) finding new solutions to increase the efficiency of manufacturing processes; (3) ensuring adequate waste management by recycling or using production processes as raw materials, the revaluation of those generated from their own activity at the expense of disposal, final disposal, or the incineration of the hazardous ones; (4) continuously exploring new opportunities for upgrading equipment so that energy consumption and emissions are reduced and the environmental impact reduced (27%); (5) reducing occupational risks through the adoption of measures to protect the safety and health of employees; and (6) efficiently managing operational and liquidity processes through the efficient use of financial resources.
In the commerce sector, 106 respondents considered that the internal benefits were related to (1) improving the company vision by making the corporate citizen more responsible by including objectives for creating value for stakeholders, by taking care of the hosting communities, and by protecting the environment (23.6%); (2) providing training and development programs for employees that meet their personal needs and the company’s objectives at the same time (20.8%); and (3) reducing the environmental impacts by reducing water consumption, replacing lighting systems, and recovering heat from cooling systems in stores, warehouses, and more (9.4%) (
Table A3).
The major external benefits gained from sustainability reporting were different, according to where they came from, allowing managers to improve their long-term sustainability strategies. As indicated in
Table A4, managers from the 156 companies in Bucharest admitted that among the advantages gained would be: (1) building strategies for maintaining a positive reputation at the brand level and implementing reputation management systems that are especially needed in the online environment (53.8%); (2) attracting a considerable number of external stakeholders after presenting a financial performance that reflects the exact financial health of the company (51.3%); and (3) building loyalty programs and increasing customer loyalty (42.3%). Managers from more than 122 companies from the counties IF (34), TM (20), PH (16), AG (12), BV (11), SB (10), AR (10), and CJ (9) identified other external benefits, such as the inclusion in the sustainability strategies of new objectives related to building loyalty programs and increasing customer loyalty (12.6%), and meeting the expectations and wishes of the stakeholders by annually reviewing the issues they consider relevant for inclusion in the sustainability report, thus ensuring that all reported information is anchored in the present organizational context (16%) (
Table A4).
6. Conclusions
Managing both the positive and negative impacts of business activities is a particularly important issue for both business and society. For companies, reporting sustainability is not just about knowing the risks and non-financial opportunities, but also about managing them properly. Adoption of the Guide on Global Reporting Initiative (GRI-4) and the European Commission Communications 2017/C215/01 guidelines on non-financial reporting (methodology for reporting non-financial information) requirements will trigger major changes in the Romanian business environment.
The results of this study are relevant to Romanian companies operating in different domains of activity (agriculture, trade, tourism, construction, manufacturing industry, and transport and utilities, telecommunications, business/finance/insurance/real estate) with more than 100 employees by way of producing future internal and external benefits after sustainability reporting. On one hand, the missions and objectives of companies must become sustainable by including social and environmental targets in sustainability strategies, and the views of particular groups such as Customers/Consumers, Employees, Local Community, Board of Directors, Regulators and Sustainability Organizations, Press and Media, Public, Investors, and NGOs must become increasingly important for companies wishing to remain competitive in the market in the future. Managers recognize the critical importance of a sustainability strategy and believe that the responsibility for reflecting it in the sustainability report should be held by the Chief Executive Officer and the responsibility for the accuracy of the information included in the report should belong to the Sustainability Department.
On the other hand, through sustainability reporting, companies need to provide information on not only their current activities, but also their impact on the economy, responsibility for employees, society, and the environment. These reports should represent the company’s values as well as their own business models over time, demonstrating the link between their strategies and their commitment to a local and global sustainable economy. An effective sustainability reporting process will deliver both internal and external benefits to both reporting and outsourcing companies, thus contributing to increasing their market success.
Additionally, our findings confirmed the studies by [
45,
46,
47,
48], who support the view that organizations must focus on monitoring and reporting their sustainability goals. According to
Table A2, the different attitudes of the companies with turnovers between RON 1 billion and 10 billion versus companies with turnovers between RON 500 million and 1 billion is due to the fact that companies with a profitability ranging from RON 500 million to 1 billion gave priority to the “To communicate a more comprehensive and transparent image of a company’s value” objective, unlike most of the companies in the sample, which preferred the “To attract and retain staff based on trust and reputation.” Therefore, the results of this research can help companies
- (a)
build trust in their reputation and increase customer loyalty;
- (b)
reach a considerable number of external stakeholders after presenting a financial performance that reflects the exact financial health of the company;
- (c)
maintain an operating license; and
- (d)
create, improve, repair the image of a particular brand, and implement reputation management systems especially needed in the online environment.
As a result of this, by managing the risks from sustainability dimension estimation, sustainability reporting can enable companies to
- (a)
increase response speed by improving processes;
- (b)
anticipate problems in a particular community and prepare appropriate actions, thus avoiding the shortage of future material.
This study presents the limitations inherent in quantitative marketing research. Further research may contribute by addressing the following aspects: developing and implementing sustainable enterprise development policies; increasing and improving reporting in developing countries; empowering organizations, governments, and the community to conclude new partnerships with stakeholders; evaluating the performance of processes and services acquired by developing sustainability reports; and identifying new directions in sustainability reporting.
The findings of this exploratory study underline not only the importance of adopting sustainable strategies and objectives by businesses, appreciating the views of stakeholder groups in deciding to reconsider sustainability reporting, employee training, and the delimitation of the responsible groups in their drafting, but also the benefits afforded by the reporting process. The sustainability report becomes, on one hand, an instrument to promote the enterprise and, on the other hand, provides accessible information to consumers, real and potential investors, and/or other interested parties about the real impact of the enterprise’s activity on society and the environment. This could help to not only enhance the image of the products and the enterprise in the minds of consumers and investors, but also conduct a wide selection process of the best sustainability reporting methods that best suit the needs of the enterprise and all stakeholders.
In the years to come, sustainability reporting at the level of the Romanian companies will favor the free access by users to information regarding the activities carried out in support of environmental and social protection, create all the conditions for attracting new investments, and offer the opportunity to compare the company’s sustainability performance with other global competitors, which will ensure transparency and enhance the disclosure of sustainability information.


 ,
, 


