Article

Factors and Paths of Transformation and Upgradation of Chemical Industry in Shandong, China

1
School of Computer Science and Technology, Shandong University of Finance and Economics, Jinan 250014, China
2
Shandong China-US Digital Media International Cooperation Research Center, Jinan 250014, China
3
School of Management Science and Engineering, Shandong University of Finance and Economics, Jinan 250014, China
4
Shandong Research Center of Financial Information Engineering Technology, Jinan 250014, China
*
Author to whom correspondence should be addressed.
Sustainability 2020, 12(8), 3443; https://doi.org/10.3390/su12083443
Submission received: 5 March 2020 / Revised: 15 April 2020 / Accepted: 18 April 2020 / Published: 23 April 2020
(This article belongs to the Section Sustainable Chemical Engineering and Technology)

Abstract

:
In the context of the Internet, there is a historical fusion between the new round of scientific and technological revolution and industrial transformation and the accelerated transformation of economic development methods. The task of the Shandong chemical industry’s transformation and upgradation is arduous and urgent. In this context, this article studies the influencing factors and development paths of the transformation and upgradation of the Shandong chemical industry. It provides theoretical guidance for high-quality and sustainable development of the Shandong chemical industry. First, this paper uses the fuzzy cognitive map tool to learn the historical laws of the transformation and upgradation of the Shandong chemical industry. It then determines the path of chemical industry transformation and upgradation, according to the interactions and weights between the learned indicators. By adjusting the influence coefficient between the indicators on each path, the degree of change in the influence of the indicator on the target value is analyzed. The critical path and the key indicators on the path according to the degree of impact are determined. Finally, the key path selected in this article is: return on investment (C8) → unit production value environmental consumption (C9) → number of R&D personnel (C4) → R&D expenditure internal expenditure (C6) → industrial output (C1) → energy consumption coefficient (C3). The key indicator on this path is R&D expenditure internal expenditure. According to the results, the development suggestion for the transformation and upgradation of the chemical industry in Shandong is to take the path of green development through technological innovation.

1. Introduction

The chemical industry mainly refers to the collective name of enterprises and units engaged in the production and development of the chemical industry, including the chemical industry, oil refining, metallurgy, energy, light industry, petrochemicals, the environment, medicine, environmental protection, and the military sector. The chemical industry has an integral relationship with the national economy and people’s lives. The chemical industry has the characteristics of a large, industrial-scale, long-chain, and intensive capital technology. Comparison with other developed countries shows that China’s chemical industry still has many problems. It includes relative overcapacity, weak technological innovation capability, serious product homogeneity, and an unreasonable industrial layout [1,2,3,4,5].
At present, under the background of the Internet, a new round of scientific and technological revolution and industrial reform has formed a historical convergence with China’s accelerated transformation of the economic development model. The transformation and upgradation tasks facing the chemical industry are particularly arduous and urgent demands. In the context of the country’s supply-side structural reforms and the conversion of old and new kinetic energy, the conventional path of the development of the chemical industry is unable to achieve the high-quality development goals of the chemical industry. The latest development paths need to be explored through transformation and upgradation.
Shandong’s total chemical industry economy has ranked first in China for 26 consecutive years. However, the current model, based on large-scale operations, can no longer meet the requirements of national development. Even so, it may pose a serious challenge to the development of the entire industry. With the rapid development of the Shandong Chemical Industry, there are still outstanding problems, such as high energy consumption, high pollution, and high occurrence of safety accidents. In response to the five development concepts of “innovative development, coordinated development, green development, open development, and shared development,” Shandong Province has accelerated the transformation and upgradation of the chemical industry and has established higher quality, more efficient, fairer and more sustainable development. These goals put forward the major issues of what kind of development to achieve and how to achieve the development, and clear the value orientation for the development of the chemical industry.
It is a systematic project to realize the five development concepts in the development process comprehensively. Based on this value orientation, this paper systematically determines the evaluation index system, constructs a fuzzy cognitive map from the perspective of systematic development, dynamically predicts the changes of indicators according to the reasoning mechanism of the fuzzy cognitive map, and chooses the path of transformation and upgradation.
The remainder of the paper is structured as follows. In Section 2, the literature related to industry transformation and upgradation is discussed. In Section 3, the research methods and the construction of the decision path selection model are described. In Section 4, the historical data of Shandong Province are used to determine the path of transformation and upgradation of the chemical industry. Finally, a discussion and a summary of the research conclusions are presented.

2. Literature Review

Research on industry transformation and upgradation at home and abroad has been ongoing. The term “transformation” was introduced into the field of economic management in the 1980s. At the macro-level, it mainly studied economic transformation or transition at the national level. The micro-level refers to the study of transformation from the perspective of enterprises. The historian Beckhard defines enterprise organizational transformation as the transformation of the organization in terms of form, structure, and nature. According to Bibeault [6], divided enterprise transformation takes place through the interplay of five components, i.e., the management process, the economic or business cycle, a competitive environment, breakthrough development of related products and government policy. Kaplinsky [7] summarized four development models of industry transformation and upgradation. After studying many cases, it was found that most industries show similar development rules during the upgradation process. The industry implements product upgrades during the upgradation process and evaluates the industry functions, and finally, the value chain position is improved. Poon [8] believes that enterprise upgradation is the transformation of manufacturing enterprises from low-value products to high-priced products as well as from labor-intensive to capital- or technology-intensive products.
Domestic and foreign scholars’ research on transformation and upgradation is thematically categorized into motivation, influencing factors, risks, paths, and measurement. The research on influencing factors is based on qualitative analysis and the establishment of the indicator system through expert experience. According to Leveryg and Merry [9], organizational transformation is a comprehensive internal corporate transformation. It covers the core processes, spirit and will of the organization. Haveman [10] pointed out that if a sudden change in the external environment is highly correlated with the organization’s existing activities and production capacity, the performance and survival of the organization can be improved. Forbes and Wield [11] believe that the company’s capital reserves and human capital are key resources. Sufficient capital reserves can be invested in research and development design, promotion, and other aspects of the enterprise, which is conducive to the improvement of the level of technological innovation and the formation of independent brands. Elliot [12] found a connection between tightly integrated technical support, organizational form and industrial transformation. The study concluded that innovation in technology support business changes the structure of traditional industries, which, in turn, promotes industrial transformation. Zhang [13] studied the effect of choices in leading industries and institutional innovation in the Ruhr area in Germany. It found that these factors can help transform the industry from a unified structure to a diversified structure and, in the same vein, transform traditional industry to manufacturing and services industry. Drucker [14] used company-level data to empirically study the relationship between industrial agglomeration and industrial structure changes from the perspective of labor productivity and believes that industrial agglomeration is an effective way to promote industrial structure adjustment. Xu [15] summarized the factors affecting the green industrial transformation as government policy, industrial structure, technological progress, human capital, and foreign capital introduction. To solve the limitations of qualitative research, some scholars use a combination of qualitative analysis and quantitative analysis. From the empirical point of view, Dai [16] uses principal components and multiple regression analysis methods to analyze the influencing factors on Guangzhou’s industrial transformation and upgradation. The research finds that the five factors affecting Guangzhou’s industrial transformation and upgradation are: technological innovation, industrial structure, human capital, social system, and ecological resources. By adopting the technical department weighting method and the Solow total factor productivity (TFP) method, Yan [17] explicitly used the factor analysis method and the linear regression analysis method to identify various indicators and analyzed the positive (negative) factors influencing the transformation and upgradation of the manufacturing industry.
For the study of the transformation and upgradation path, most scholars theoretically analyze the means of enterprise transformation and upgradation based on expert experience and case studies concerning countermeasures. Swartz [18] believes that, in a real situation, companies that cooperate are more likely to achieve technology integration, market access, and access to complementary resources, so companies can use alliance clusters to achieve enterprise transformation. Srinivasan’s [19] research on e-commerce companies found that these companies used enterprise resource planning systems (ERP) to realize the supply chain and eventually form the most integrated and beneficial supply chain. They also achieved enterprise transformation through this system. Taking the Liaocheng City of Shandong Province, with remarkable industrial characteristics, as an example, Liang [20] summed up the problems of transformation and upgradation by using statistics on and discussion of the top 100 enterprises, explored the transformation and upgradation path, and proposed related countermeasures in the form of a case study. Zhao [21] combined the analytic hierarchy process with the development of quality functions to construct a logistics enterprise transformation and upgradation capability evaluation model.
In recent years, the application of fuzzy cognitive graphs has become more and more widespread. The simple and intuitive structure of fuzzy cognitive graphs and the reasoning mechanism that can be used for knowledge expression have developed and improved in the analysis of social phenomena, risk assessment, and policy calculation. The fuzzy cognitive graph model is a model that is easy to understand, because each parameter in the model has a perceptible meaning. It has been applied to many different fields, including engineering, ecological management, medicine, and business processes, software engineering, economics and management, environmental science, politics, etc. [22,23,24,25,26].
According to the literature discussed above, research on the influencing factors and paths of industry transformation and upgradation is still in its early stages. Additionally, the transformation and upgradation of the research industry are strongly influenced by regions and industries. At present, most of the research on industry transformation and upgradation is based on expert opinions, and the results are more subjective and lack objective quantitative research.
Based on the research on influencing factors, this paper constructs a transformation path model through the inference evolution of the relationship between influencing factors. This is more scientific and convincing than previous research. As a kind of reasoning tool, the fuzzy cognitive map has a strong ability to express fuzzy information, causality, and explanatory power. Through the indicator data, the mutual influence and feedback between the influencing factors can be inferred to form a corresponding knowledge network. By analyzing the logical and direct influence relationship between the various system elements, a transformation and upgrade path is selected. According to the sensitivity of each index on the path, the key index and path are determined. Compared with traditional methods, the FCM method solves the problem of relying too much on expert opinion. Therefore, this paper proposes the use of the FCM method to study the influencing factors and paths in the transformation and upgradation of Shandong chemical enterprises.

3. Materials and Methods

3.1. Fuzzy Cognitive Map

Political scientist Robert Axelrod first proposed cognitive maps in 1976. These maps are used as a tool for representing social science knowledge. The cognitive map model is represented by a simple graph comprising nodes and edges [27,28,29,30,31]. Nodes represent concepts associated with a domain, and the causal relationship between them is described by directed edges, which can be thought of as a single-layer neural network.
First, set the concept set C = { C 1 , C 2 , , C n } of the fuzzy cognitive map, where C1 and C2 represent the i-th and j-th concept, target, or attribute, respectively. The W matrix is an adjacency matrix in which concepts interact with each other. The sign of the weight represents the direction of the causal relationship between concept C i and concept C j . When there is a definite causal relationship between the two concepts, then w i j > 0 ; if concept C i changes in the same direction as concept C j , then the increase (decrease) in the value of concept C i will cause the value of concept C j to increase (decrease). When there is a negative causal relationship between the two concepts, then w i j < 0 ; then, an increase in the value of concept C i will result in a decrease in the value of concept C j , while a reduction for concept C i will increase the value of C j . When there is no relationship between the two concepts, w i j = 0 . The intensity of the weight w i j represents the degree of influence between concept C i and concept C j .

3.2. Construction of FCM Decision Path Selection Model

Firstly, the causal relationship and causal weight of each index were learned through the fuzzy cognitive graph method. Secondly, the ingress and egress of the indicators were calculated according to the adjacency matrix of the fuzzy cognitive graph to obtain the structural relationship and influence degree between the indicators. The next step is to analyze the indicators and choose a decision path. Finally, the sensitivity of each path index is calculated, and the key index and the key path are determined.
The fuzzy cognitive map method has been widely used in economic systems, management decision-making, stock analysis, policy analysis, and control systems. Applying a fuzzy cognition map to study the influencing factors of the Shandong chemical enterprise’s transformation and upgradation, we can use fuzzy logic for clear and intuitive expression of the causal relationship between influencing factors. This article uses FCM interpretation and feedback to mitigate errors caused by expert experience and knowledge.
The calculation steps of the FCM method are:
STEP1: Determine the indicator system and establish a model of the influencing factors on the transformation and upgradation of chemical enterprises.
STEP2: Collect time-series data and perform equalization and normalization.
STEP3: The genetic algorithm is used to solve the relationship weights. A fuzzy cognitive map is drawn to reflect the interaction between the indicators.
STEP4: Calculate the ingress and egress of each indicator, determine the system goals, and choose the path of transformation and upgradation.
STEP5: Perform sensitivity analysis on each indicator to determine key indicators and critical paths.

3.2.1. Building an Indicator System

According to the previous research and the “Notice on Printing and Distributing the Overall Work Plan for the Special Action for the Transformation and Upgradation of Chemical Industry Safety in Shandong Province” issued by the General Office of the Provincial Party Committee, this paper considers economic benefits, technological innovation capabilities, green environmental protection, and policies. It establishes an indicator system that affects the factors that transform and upgrade enterprises in Shandong’s chemical industry.
Economic benefits reflect the relationship between GDP and production costs. These are the main objectives of investment project production and operation. Economic efficiency is the key to measure the core competitiveness of an enterprise. Improving industrial efficiency means improving investment efficiency and resource utilization efficiency, which is also the goal of enterprise transformation and upgradation. Zhang [32] uses the total industrial output value, leading business income, and overall profit to reflect the economic benefits of the company. Wu [33] and Lu [34] studied the impact of ROI on commercial interests. Ye [35] believes that the ex-factory price of industrial producers is an important indicator reflecting the price level and trend of industrial enterprises. Additionally, according to their study, it can also indicate price gain and industrial booms. According to data collection and the actual situation, this paper selects the total industrial output value, leading business income, return on investment, and industrial producers’ ex-factory price to represent the economic benefits of the enterprise.
The work plan emphasizes strengthening the construction of modern enterprise systems, improving the level of process technology equipment and products, and achieving innovative development, transformation, and upgradation. Many scholars believe that innovation ability is the source of the core competitiveness of enterprises. Innovation is the driving force for the transformation and upgradation of enterprises and is the critical measure to realize “Made in China” and “Create in China.” A company’s ability to innovate is often measured by quantitative indicators such as R&D expenditures, R&D activities, number of patent applications, and gross industrial output [36,37,38]. As a traditional process manufacturing enterprise, the chemical industry needs innovation to drive its development. Due to the limitations of the data, the innovation indicators selected in this paper are R&D expenditures and R&D activities. R&D expenditure is an important indicator reflecting the scientific and technological strength of the chemical industry and an essential basis for improving the core competitiveness of enterprises. The number of R&D personnel reflects the input strength of innovative resources from the perspective of human resources.
The highly polluting and energy-intensive industries in the chemical industry and the development trend of the contemporary green economy have led to a green transformation, which will ease the pressure on resources and environment while ensuring steady growth in output value. Xu [15] explored the relationship between energy consumption, emissions of three wastes, and total industrial output value. He believes that with the change in industrial output value, material consumption and pollutant emissions will change in the opposite direction. Therefore, in terms of environmental protection, this paper selects two indicators of energy consumption coefficients and environmental consumption per unit of output value.
Government intervention is also of considerable significance to the success of enterprise transformation and upgradation. However, the policy and its impacts are challenging to quantify. This paper selects the loan benchmark interest rate to study the effects of government policies on enterprise transformation and upgradation.
Selected in this paper are industrial gross output value, primary business income, energy consumption coefficient, R&D personnel, producer ex-factory price index, R&D expenditure private expenditure, loan benchmark interest rate, and investment return. Rate (ROI) and unit production value consumption encompass nine indicators. The established indicator system and the explanation of each indicator are shown in Table 1:

3.2.2. Model of Influencing Factors for the Transformation and Upgradation of Chemical Companies

This paper selects industrial output (C1), leading business income (C2), energy consumption factor (C3), the number of R&D personnel (C4), producer price index (C5), R&D expenditure internal expenditure (C6), loan benchmark interest rate (C7), return on investment (C8) and unit production value environmental consumption (C9) as nine indicators, for a quantitative study of the factors affecting the transformation and upgradation of chemical companies, namely, the concept node of FCM. Let its influence matrix W 9 × 9 be:
[ w 11 w 19 w 91 w 99 ]
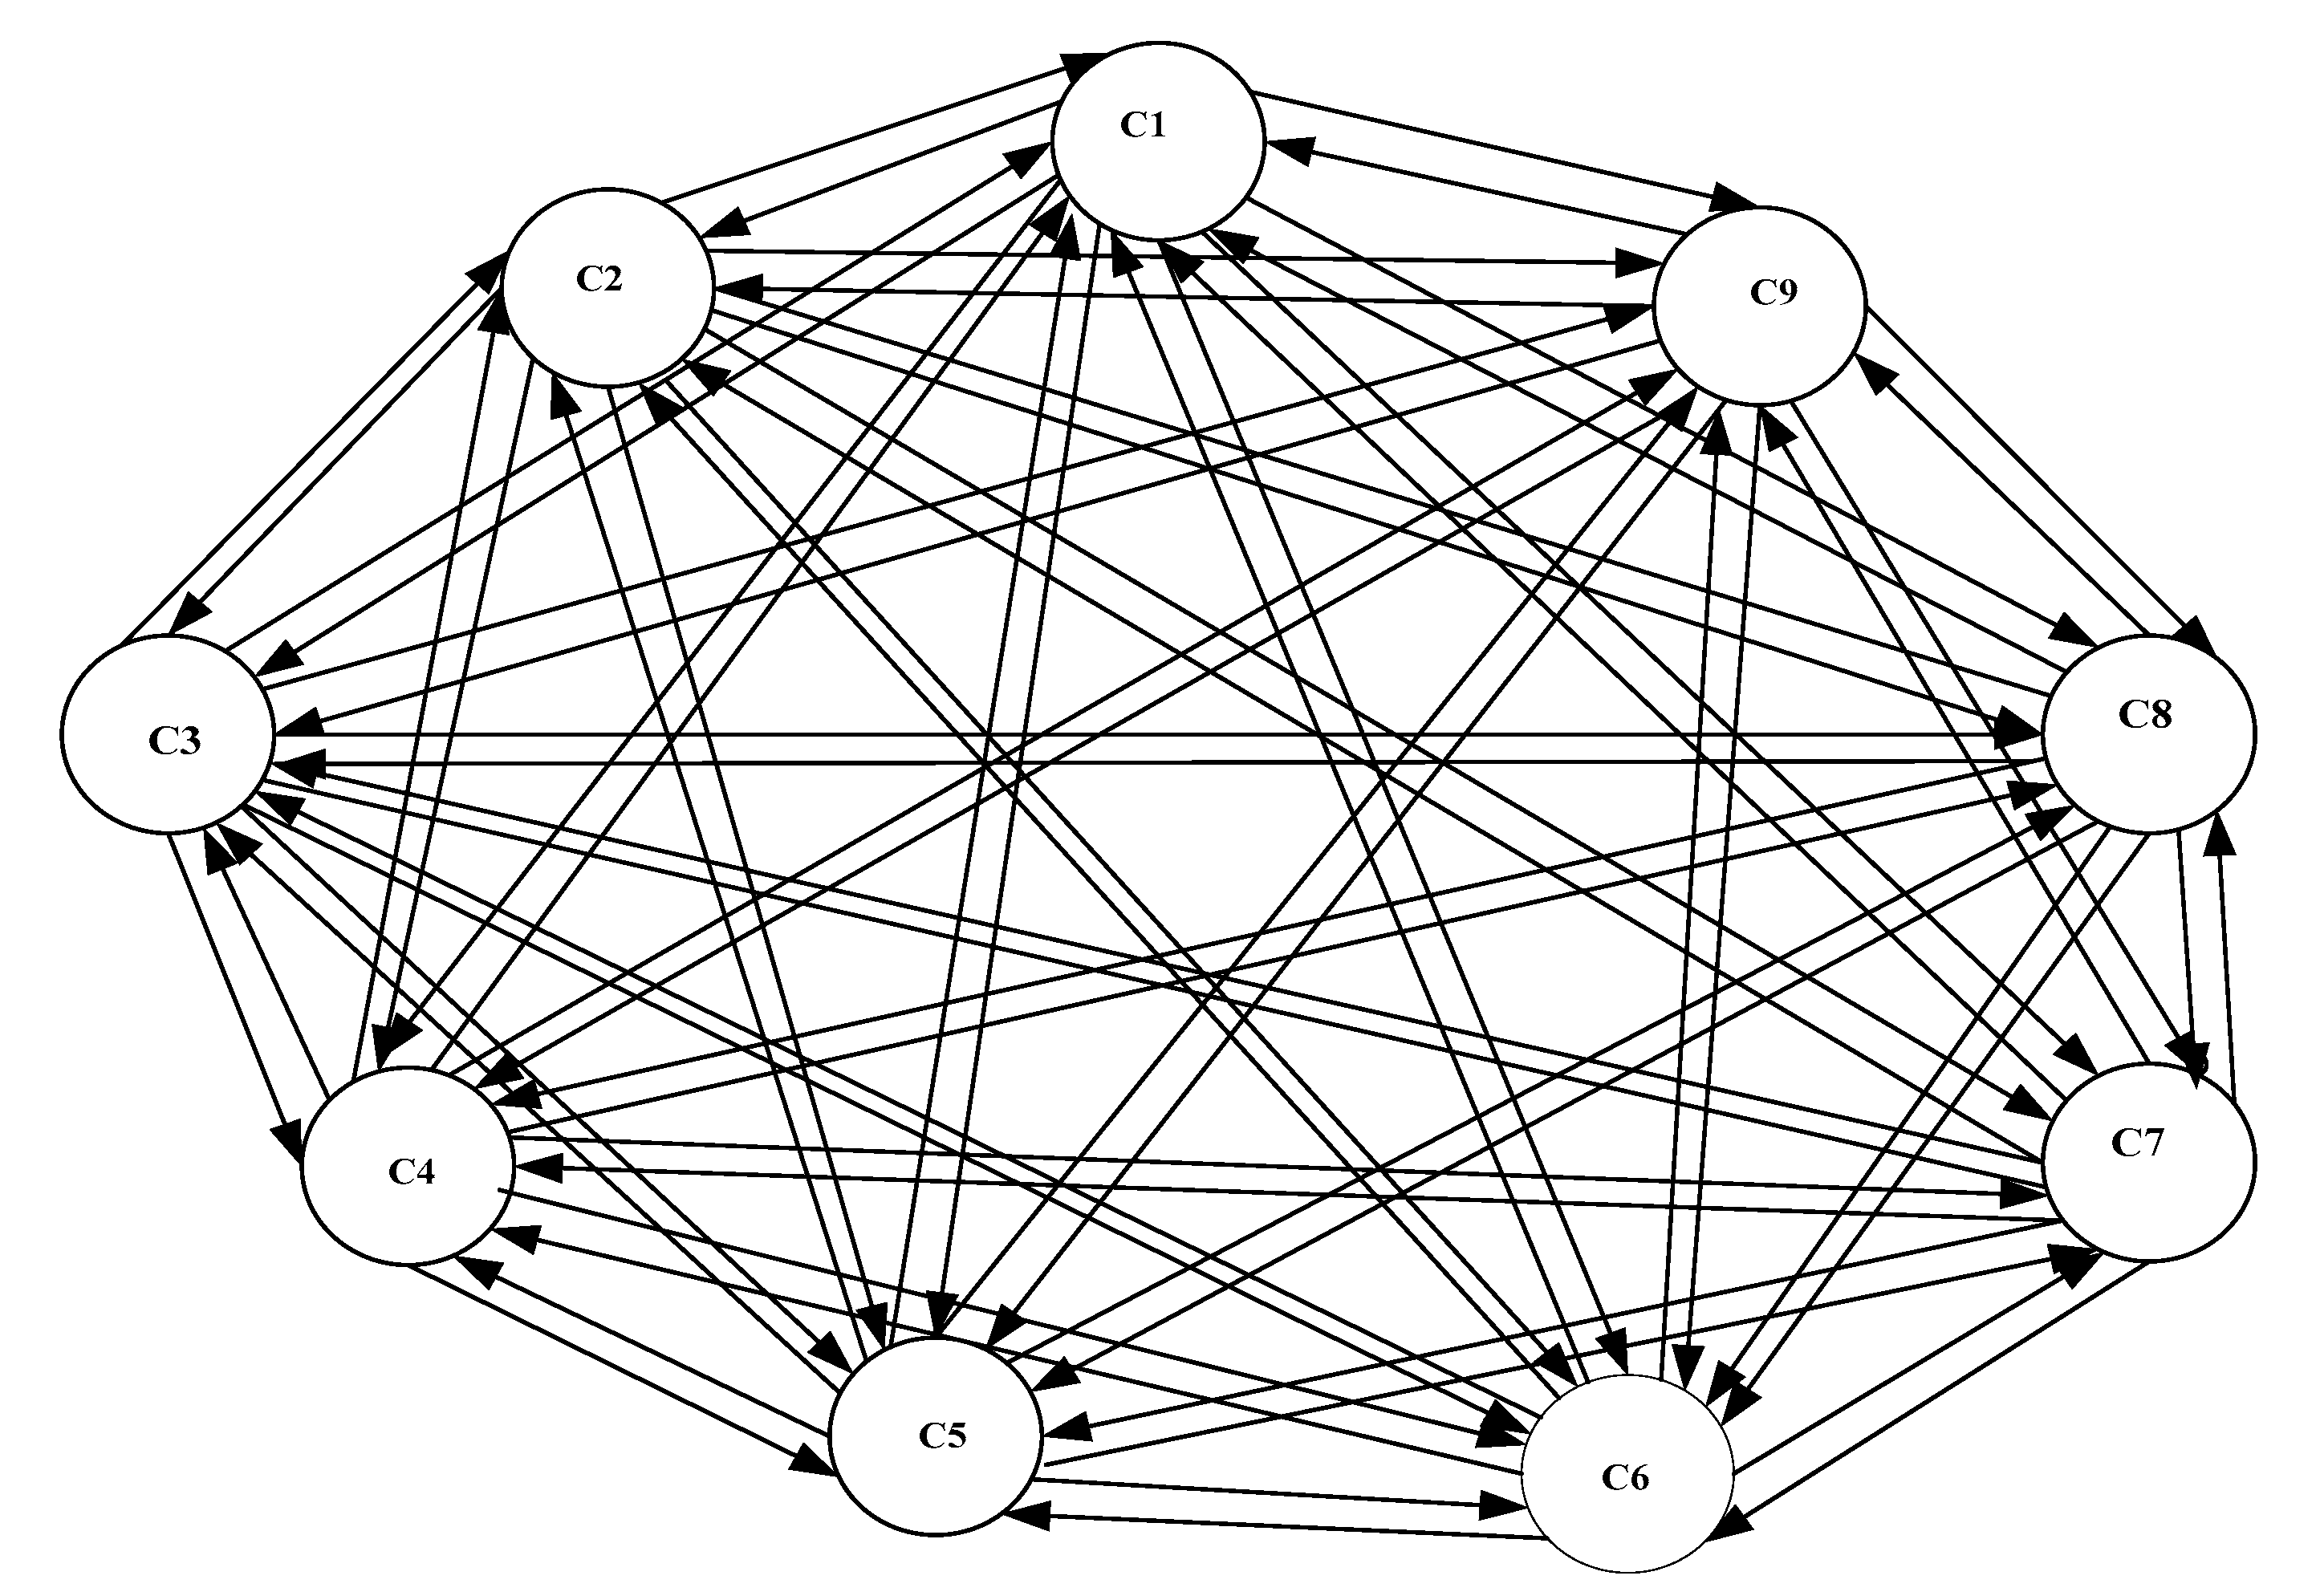
According to the influence matrix, the fuzzy cognitive map is drawn, as shown in Figure 1:
The influence relationship between the indicators in this figure is to be determined, and the time series data needs to be learned through a genetic algorithm.

3.2.3. Data Collection and Processing

To ensure the integrity and authenticity of the data, this paper takes the data of Shandong as an example to study the influencing factors and path of the transformation and upgradation of chemical enterprises. Combining the data of the Shandong Statistical Yearbook, we replaced the chemical industry data with data on five industries: petrochemical; coking and nuclear fuel processing; chemical raw materials and chemical product manufacturing; pharmaceutical manufacturing; chemical fiber manufacturing for rubber and plastic products. According to the indicators of transformation and upgradation of chemical industry enterprises formulated in the previous section, the data from 2001 to 2016 was obtained from Shandong Statistical Yearbook.
1. Equivalence calculation
Funds have time values, and at different times, they have different values. This is why they cannot be directly compared. Therefore, the index data for leading business income and other monetary amounts are equivalently converted based on 2001 currency values. The calculation method is as follows.
The total industrial output value is based on the producer’s appearance price index, because PPI is the price factor that constitutes the total industrial output value. The industrial output values of other years are then adjusted to the base year level. The entire industrial output value of the base year is G J , the total industrial output value of the year is G D , the producer price index of the producer in the base year is P J , and the producer price index of the producer is P D . The formula for calculating the total industrial output value of the year is:
G D = G J / P J P D
The internal expenditure of R&D funds is based on the GDP deflator. The internal expenditure of R&D funds in other years is the base year level. The internal expenditure of the benchmark R&D expenditure is R J . The internal expenditure of the R&D expenditure for the year is R D , the benchmark GDP deflator is D J , and the GDP deflator for the year is D D . The internal expenses of R&D funds for the year were:
R D = R J / D J D D
2. Normalized Processing
The normalization process aims to remove the dimension and harmonize the evaluation criteria. The normalization formula used here is:
x i = x i x min x max x min
where x i represents the normalized value of the original data; x i represents the original data value; x max represents the maximum value in the raw data of the indicator, and x min represents the minimum value in the raw data of the indicator.

3.2.4. Solving the Relationship Weight

Natural genetics, initially inspired by the origins and principles of genetic algorithms (GA), performs optimization and search tasks in many problem areas. Genetic algorithms have many characteristics such as adaptability, parallelism, global optimization, randomness, universality, etc., and have great potential in solving complex problems, especially NP-hard problems and adaptive design systems. Real-coded genetic (RCGA) algorithm is an extended algorithm of genetic algorithm (GA). Processing function optimization is an essential direction of genetic algorithm application. Since real-coded coding does not require codec decoding, it is closer to the problem, and it is easier to combine with other search techniques. Therefore, processing function optimization is increasingly using real-coded genetic algorithms [39,40].
1. Chromosome Structure
RCGA defines each chromosome as a floating-point vector. Its length corresponds to the number of variables in each problem. Each element of the vector is referred to as a gene. With FCM learning, each chromosome consists of N(N–1) genes, which are floating-point numbers from the range [−1, 1], defined as follows:
C = [ w 11 , , w 1 N , w 21 , , w 2 N , , w N N 1 ]
C represents a chromosome; w i j is a gene on a chromosome.
Each chromosome must be decoded back to the candidate FCM. This process involves copying the weight values from the chromosomes into corresponding units in the connection matrix, which defines the connection matrix of the FCM model. The number of chromosomes in the population is constant for each generation and is specified by the population size parameter.
2. Reasoning Mechanism
The state of the FCM model is determined by the value of the concept node after iteration t times. The initial state vector is inputted into the dynamic FCM model, and the current time state vector is multiplied by the adjacency matrix of the dynamic FCM model to obtain the next time state vector as the input value for the next iteration. Repeat this process until a steady state is reached. The mathematical model of FCM reasoning is:
x j ( t + 1 ) = F ( i j x i ( t ) w i j )
where x i ( t ) represents the state value of the conceptual node x i at time t; x j ( t + 1 ) represents the state value of the conceptual node x j at time t+1; t represents the discrete time, t = 0, 1, 2, 3, ..., T; F is a conversion function that normalizes the value of the concept node to the appropriate range. This article uses the sigmoid function as a conversion function; the function is as follows:
F ( x ) = 1 1 + e c x
C represents the experimental parameters, c > 0 .
3. Fitness Function
The essential thing in genetic algorithms is to design a fitness function for the problem. The state obtained by the fuzzy cognitive graph at this moment is compared with the actual state value at that moment to receive an error function:
E ( w ) = 1 2 t = 1 k 1 i = 1 N ( d i ( t ) c i ( t ) ) 2
where d i ( t ) is the expected output value of node i at time t; c i ( t ) is the actual output value of node i at time t; and i = 1 , 2 , N , N is the number of conceptual nodes in the system. t = 1 , 2 , , k 1 , k is the total number of training samples.
The fitness function used in this algorithm is:
K = 1 1 + E ( w )
4. Stop Condition
The proposed stop condition considers two scenarios in the learning process:
–Learning is successful; the sequence of state vectors obtained by simulating the candidate FCM is near the input data. The similarity between the actual state value and the real state value is described by the fitness function value of each generation of the best chromosome. Therefore, learning should be terminated when the fitness function value reaches the threshold max_fitness.
–Learning is unsuccessful, but the maximum number of iterations defined by the max_generation parameter has been reached.
5. RCGA Learning Process
The chromosome edge weight matrix in the initialization population is evaluated; that is, the new time state value reasoned by the FCM reasoning mechanism is compared with the actual result in the data source. If the end condition is reached, the optimal FCM edge weight matrix is obtained. Otherwise, the chromosome weight matrix is crossed and mutated, and the chromosome weight matrix with high fitness is selected to generate a new generation group to enter the next round. This process is iterated multiple times until the termination condition is reached. The specific learning process is as follows:
STEP1: Assign values to the parameters, including the population size m, the number of variables n, the crossover probability pc, the mutation probability pm, and the maximum algebra T allowed by the genetic calculation.
STEP2: Generation of the initial population. The initial population is randomly generated, and the population size m is set to 100.
STEP3: Calculate the individual fitness value. Calculate the fitness of each chromosome in the population according to Formulas (8) and (9).
STEP4: Selection. The selection operator uses roulette selection to calculate the cumulative probability for each individual based on the fitness of each individual.
STEP5: Intersection. Using a single-point crossover method, the populations are randomly paired first, then the intersections are randomly set, and, finally, some genes are exchanged between the paired chromosomes. The crossover probability is p c .
STEP6: Variation. The mutation calculation is performed by the method of significant position variation. First, the position of the genetic modification of each individual is determined, and then the genetic value of the variation point is reversed according to a certain probability. The probability of variation is p m .
The relationship weight training pseudocode is as follows:
Initialize parameters such as p c , p m , m, T, and max_generation. Randomly generate the first generation population pop.
Do
{
 Calculate the fitness of each individual in the population pop F(i)
 Initialize empty population newpop
 Do
 {
  Select two individuals from the population pop according to the fitness by the proportional selection algorithm
  If(random (0,1) < pc)
   {Intersection of 2 individuals by crossover probability}
  If(random (0,1) < pm)
   {For two individuals to perform mutation operations according to mutation probability}
  Add 2 new individuals to the population new pop
 }until (M children are created)
}until (any chromosome fitness value exceeds max_fitness, or breeding algebra exceeds m)
3.2.5. Calculation of Indicator In-out

Because fuzzy cognitive graphs can be very complicated, graph theory indexes provide a way to analyze their structure. Calculate its out-degree, in-degree, and centrality, respectively.
1. Outdegree: The sum of the rows of the absolute values of the variables in the adjacency matrix. The cumulative intensity of exiting this node is:
o d ( v i ) = k = 1 9 | w i k |
2. Indegree: The sum of the columns of the absolute values of the variables in the adjacency matrix. The cumulative intensity of entering the node is:
i d ( v i ) = k = 1 9 | w k i |
3. Centrality: The role of a variable in a cognitive map can be understood by calculating its centrality. The sum of out-degree and in-degree can measure centrality. Centrality can be used to calculate the index’s contribution to the system.
c ( v i ) = o d ( v i ) + i d ( v i )

3.2.6. Choice of the Decision Path

The fuzzy cognitive map is used to select the path for the transformation and upgradation of chemical companies to provide help for the development of chemical companies. Specific steps are as follows:
STEP1: Determine the system goals according to the out and in degrees of the indicator.
STEP2: Use the fuzzy cognitive map to find the circuit that can achieve the goal as the initial path.
STEP3: Use the reasoning mechanism of the fuzzy cognitive graph to calculate the steady state of each index.
STEP4: Change the weight of the relationship between the indicators on each path and calculate the growth rate of the improved target value compared to the initial value.
STEP5: Determine the key indicators and paths based on the calculation results.

4. Results

4.1. Construction of FCM Decision Path Selection Model

4.1.1. Data Collection and Processing

The raw data and processed data are shown in Table 2, Table 3, and Table 4. The CPI index and GDP deflator for the past years are shown in Table 5:

4.1.2. Solving the Relationship Weight

According to the RCGA learning process, under the condition of mutation rate of 0.825, crossover rate of 0.95, and maximum asynchronous length of 0.07, the weight matrix is learned, and the optimal weight matrix is obtained by combining expert opinions. As follows:
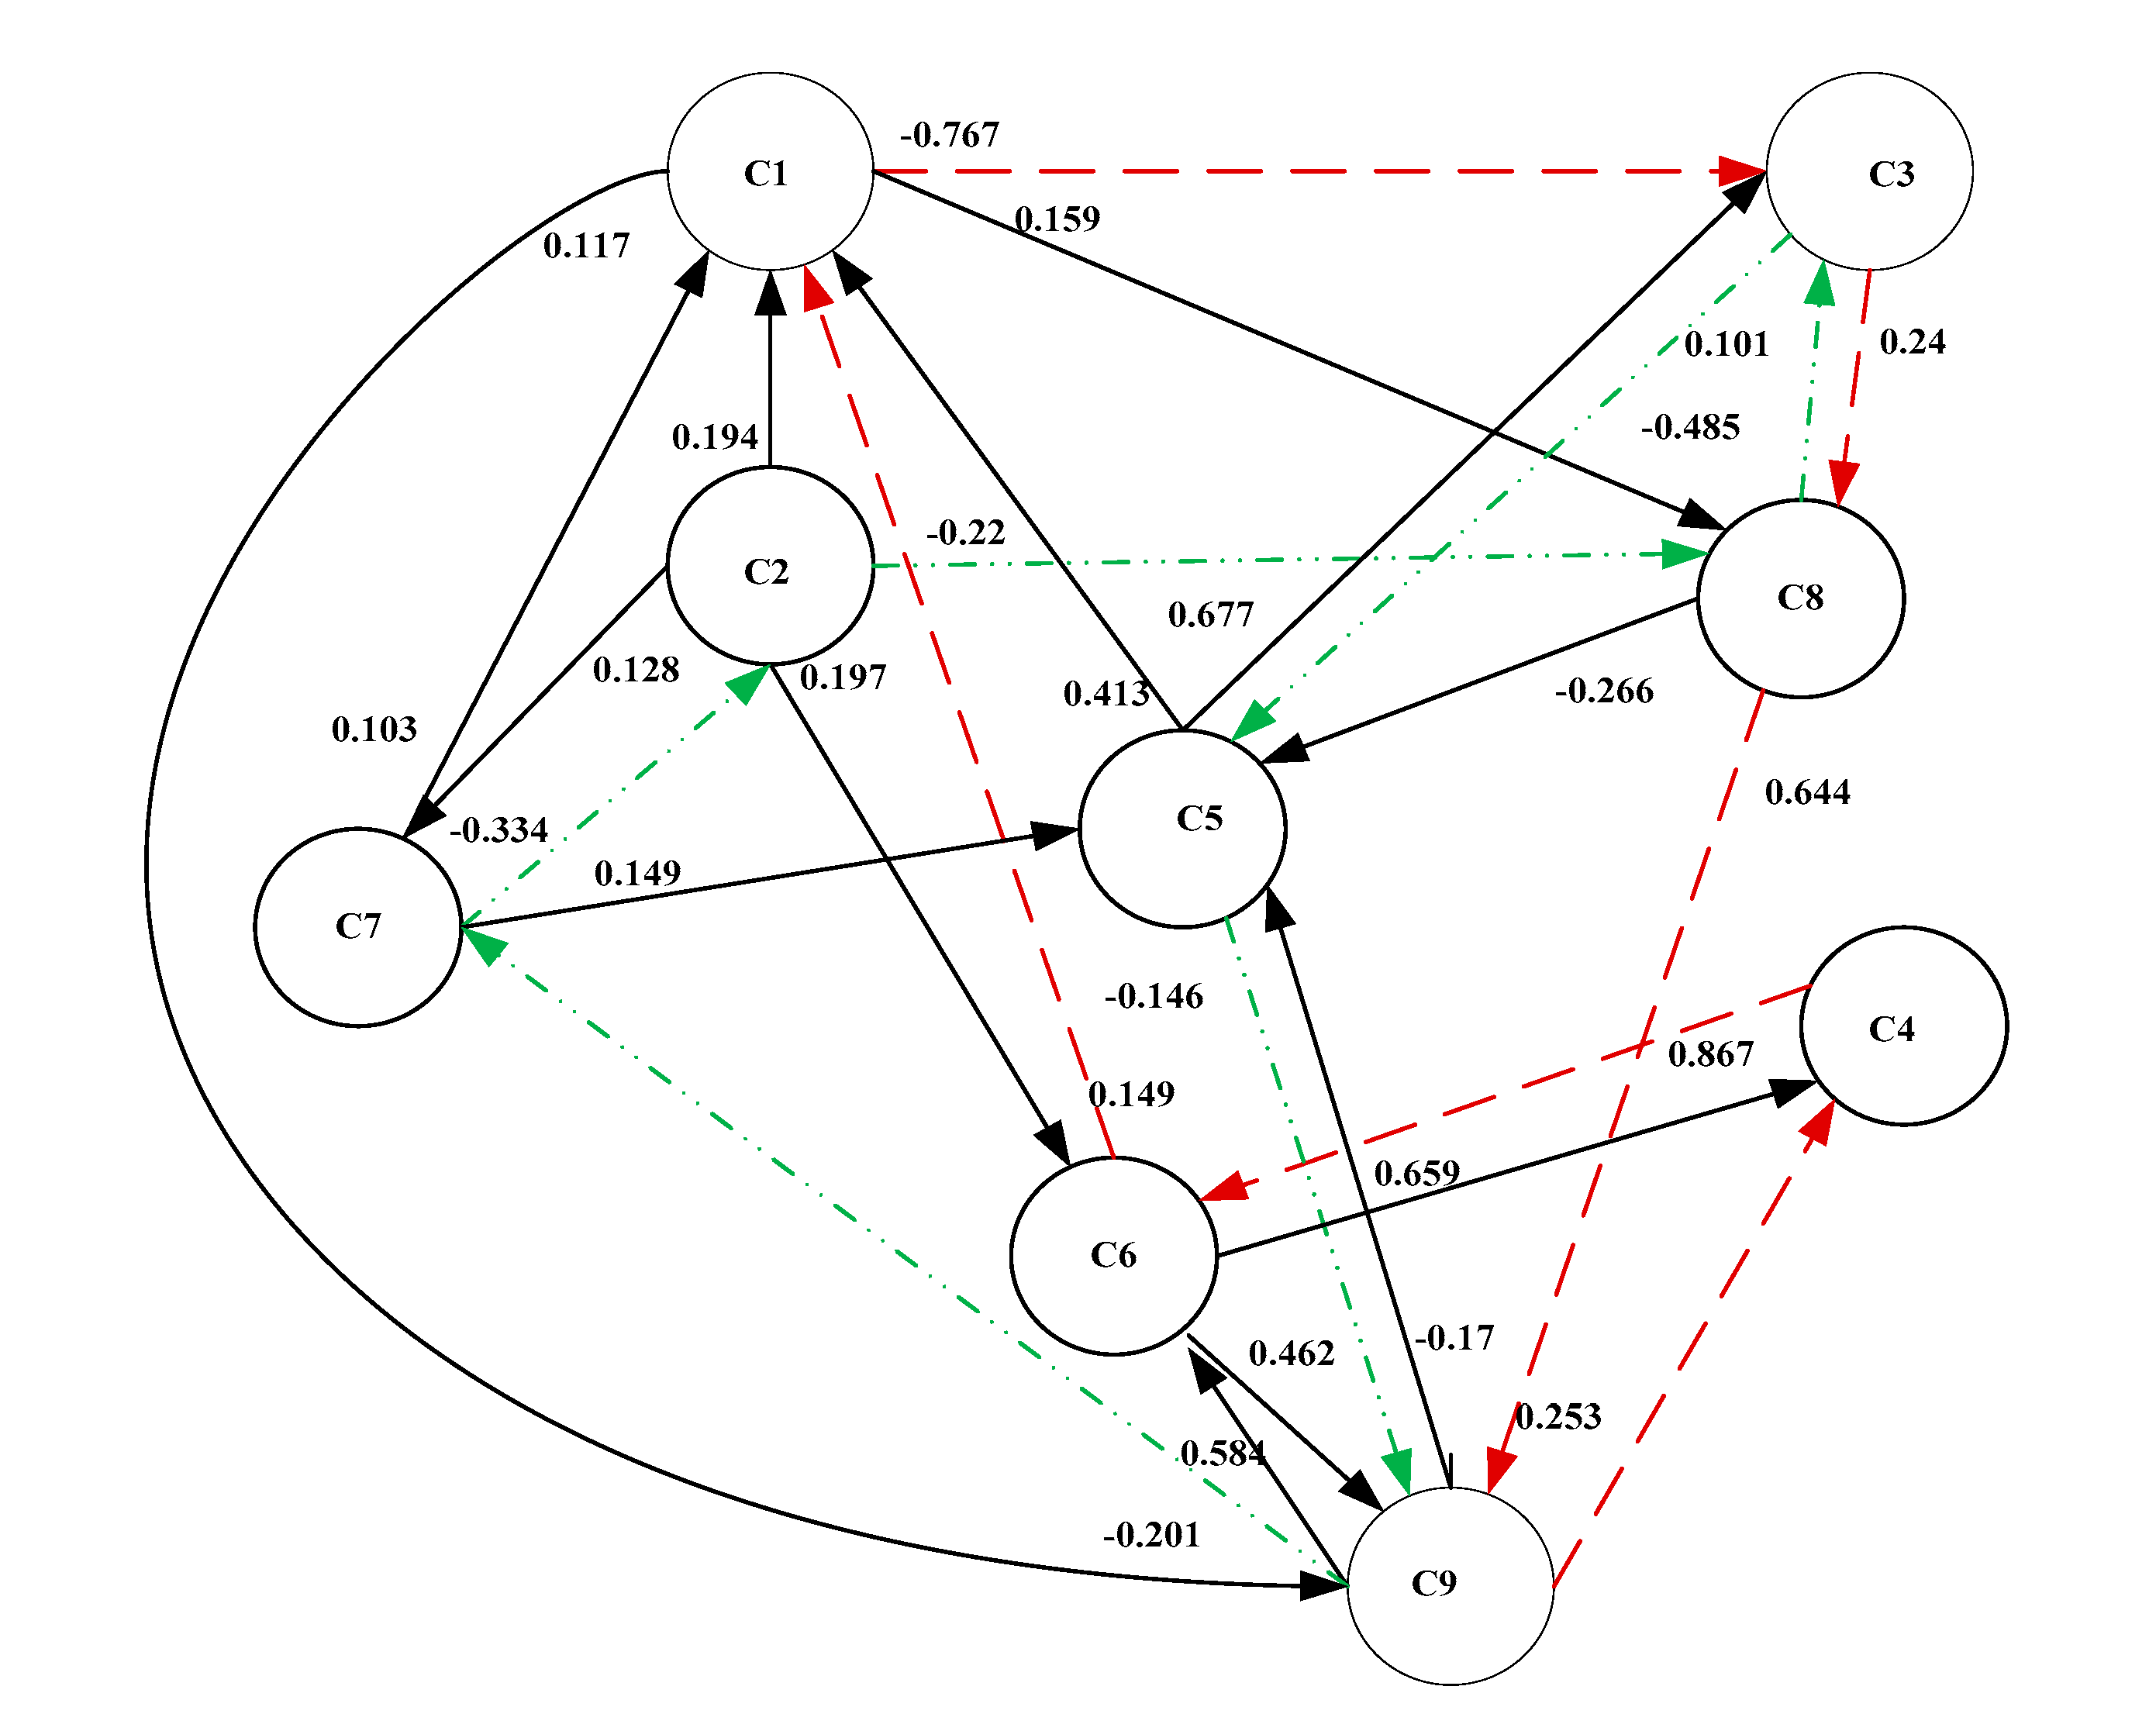
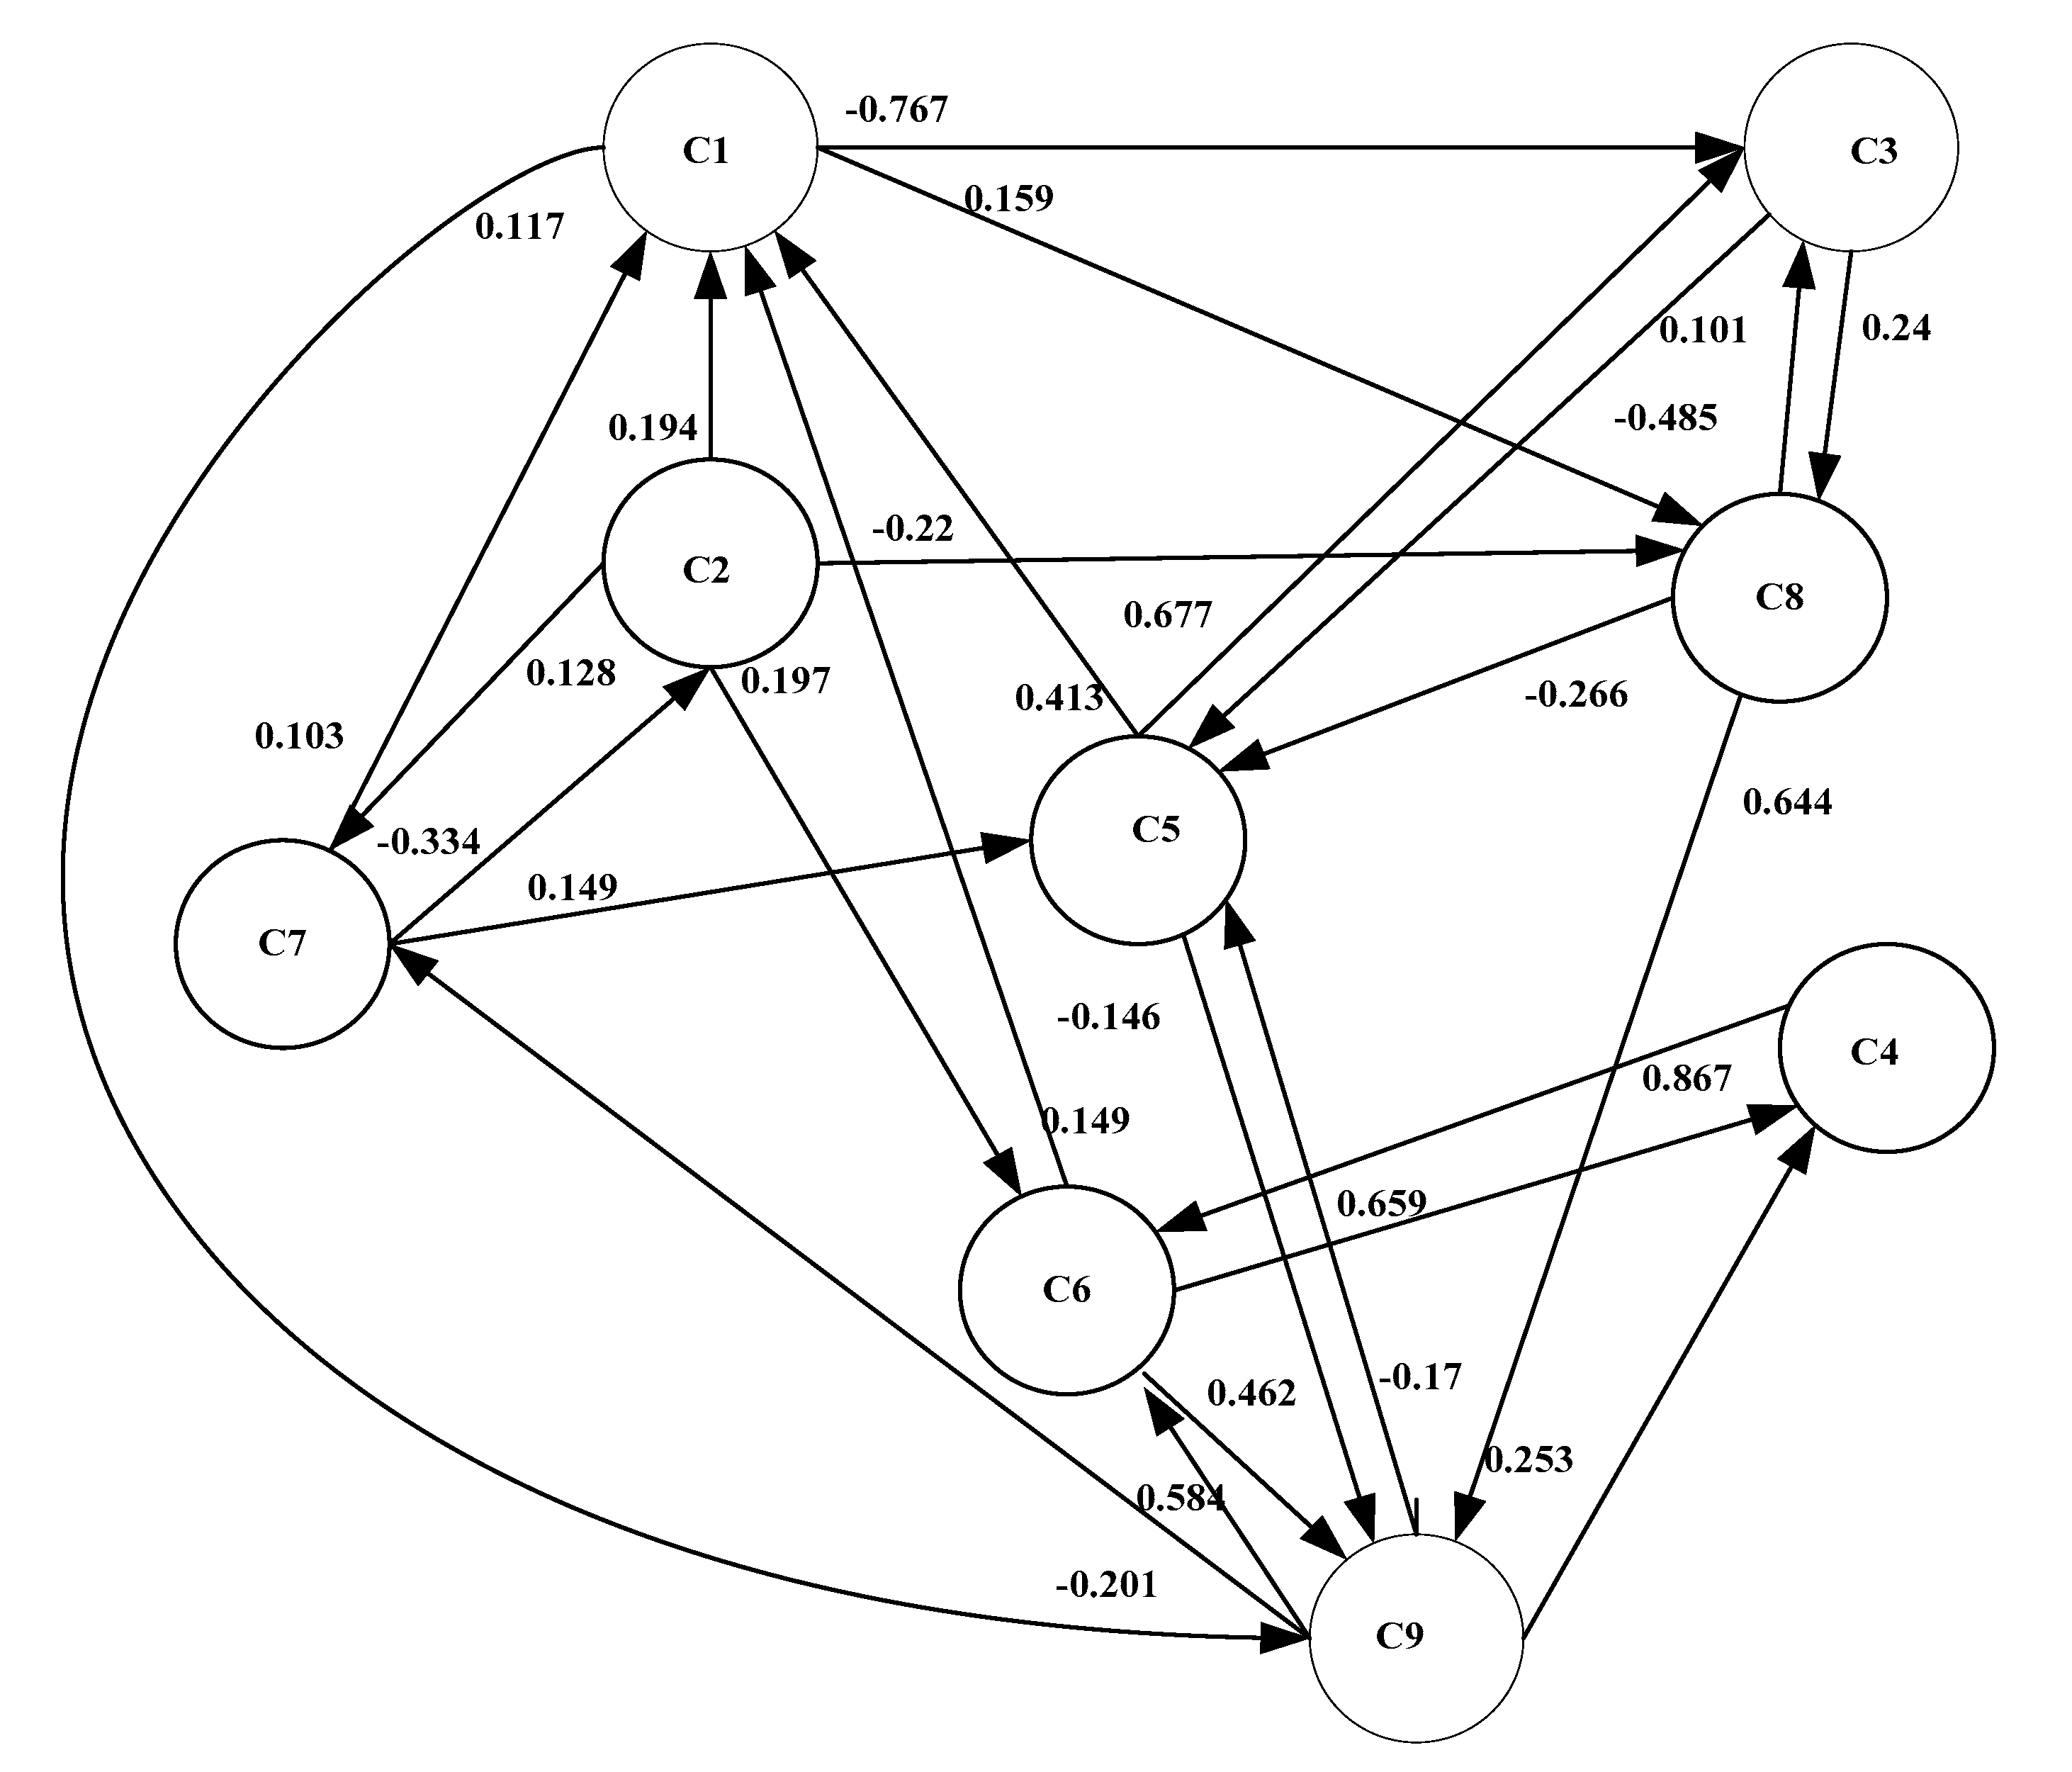
W = [ 0 0 0.767 0 0 0 0 0.159 0.117 0.194 0 0 0 0 0.197 0.128 0.22 0 0 0 0 0 0.101 0 0 0.24 0 0 0 0 0 0 0.867 0 0 0 0.413 0 0.677 0 0 0 0 0 0.146 0.149 0 0 0.659 0 0 0 0 0.462 0.103 0.334 0 0 0.149 0 0 0 0 0 0 0.485 0 0.266 0 0 0 0.644 0 0 0 0.253 0.17 0.584 0.201 0 0 ]
According to the weight matrix, a fuzzy cognitive map can be drawn, as shown in Figure 2:

4.1.3. Calculating the Impact Degree of Indicators

The weight matrix W learned by the previous genetic algorithm is used to calculate the direct influence matrix and the comprehensive impact index of each index factor. The results are shown in Table 6:
As seen in Table 6, the indicators with higher output are: return on investment (C8) > R&D expenditure internal expenditure (C6) > producer’s appearance price index (C5) > unit production value environmental consumption (C9). The higher output, the more significant the impact on other indicators.
According to the penetration results, the indicators with higher penetration are: energy consumption coefficient (C3) > R&D expenditure internal expenditure (C6) > unit production value environmental consumption (C9) > number of R&D personnel (C4). These indicators are easily affected by other indicators.

4.1.4. Selection of Transformation and Upgradation Path for Chemical Enterprises

According to the result of the index penetration degree calculation in the previous section, the energy consumption coefficient (C3) with the highest penetration degree is taken as the termination point of the path. The goal of the system is to decrease the value of the energy consumption coefficient (C3).
First, the return on investment (C8) with the highest output degree is used as the initial node of the first path. According to the structure of the fuzzy cognitive graph, with the return on investment (C8) as the starting node and the energy consumption coefficient (C3) as the endpoint, the first path of transformation and upgradation is obtained: energy consumption coefficient (C3)→return on investment (C8) → unit production value environmental consumption (C9)→number of R&D personnel (C4)→ R&D expenditure internal expenditure (C6)→industrial output (C1)→ energy consumption coefficient (C3). As a result, a closed-loop circuit with return on investment (C8) as the starting node and the energy consumption coefficient (C3) as the endpoint is obtained, as shown in Figure 3 (red line).
Second, the second path is determined, with the producer’s appearance price index (C5) as the initial node and the energy consumption coefficient (C3) as the endpoint: energy consumption coefficient (C3)→producer’s appearance price index (C5)→unit production value environmental consumption (C9)→loan benchmark interest rate (C7)→main business income (C2)→return on investment (C8)→energy consumption coefficient (C3), as shown in Figure 3 (green line).

4.1.5. Choice of the Decision Path

The next step is to change the coefficients between the indicators on the first path and analyze the impact of changes in each coefficient on the target value.
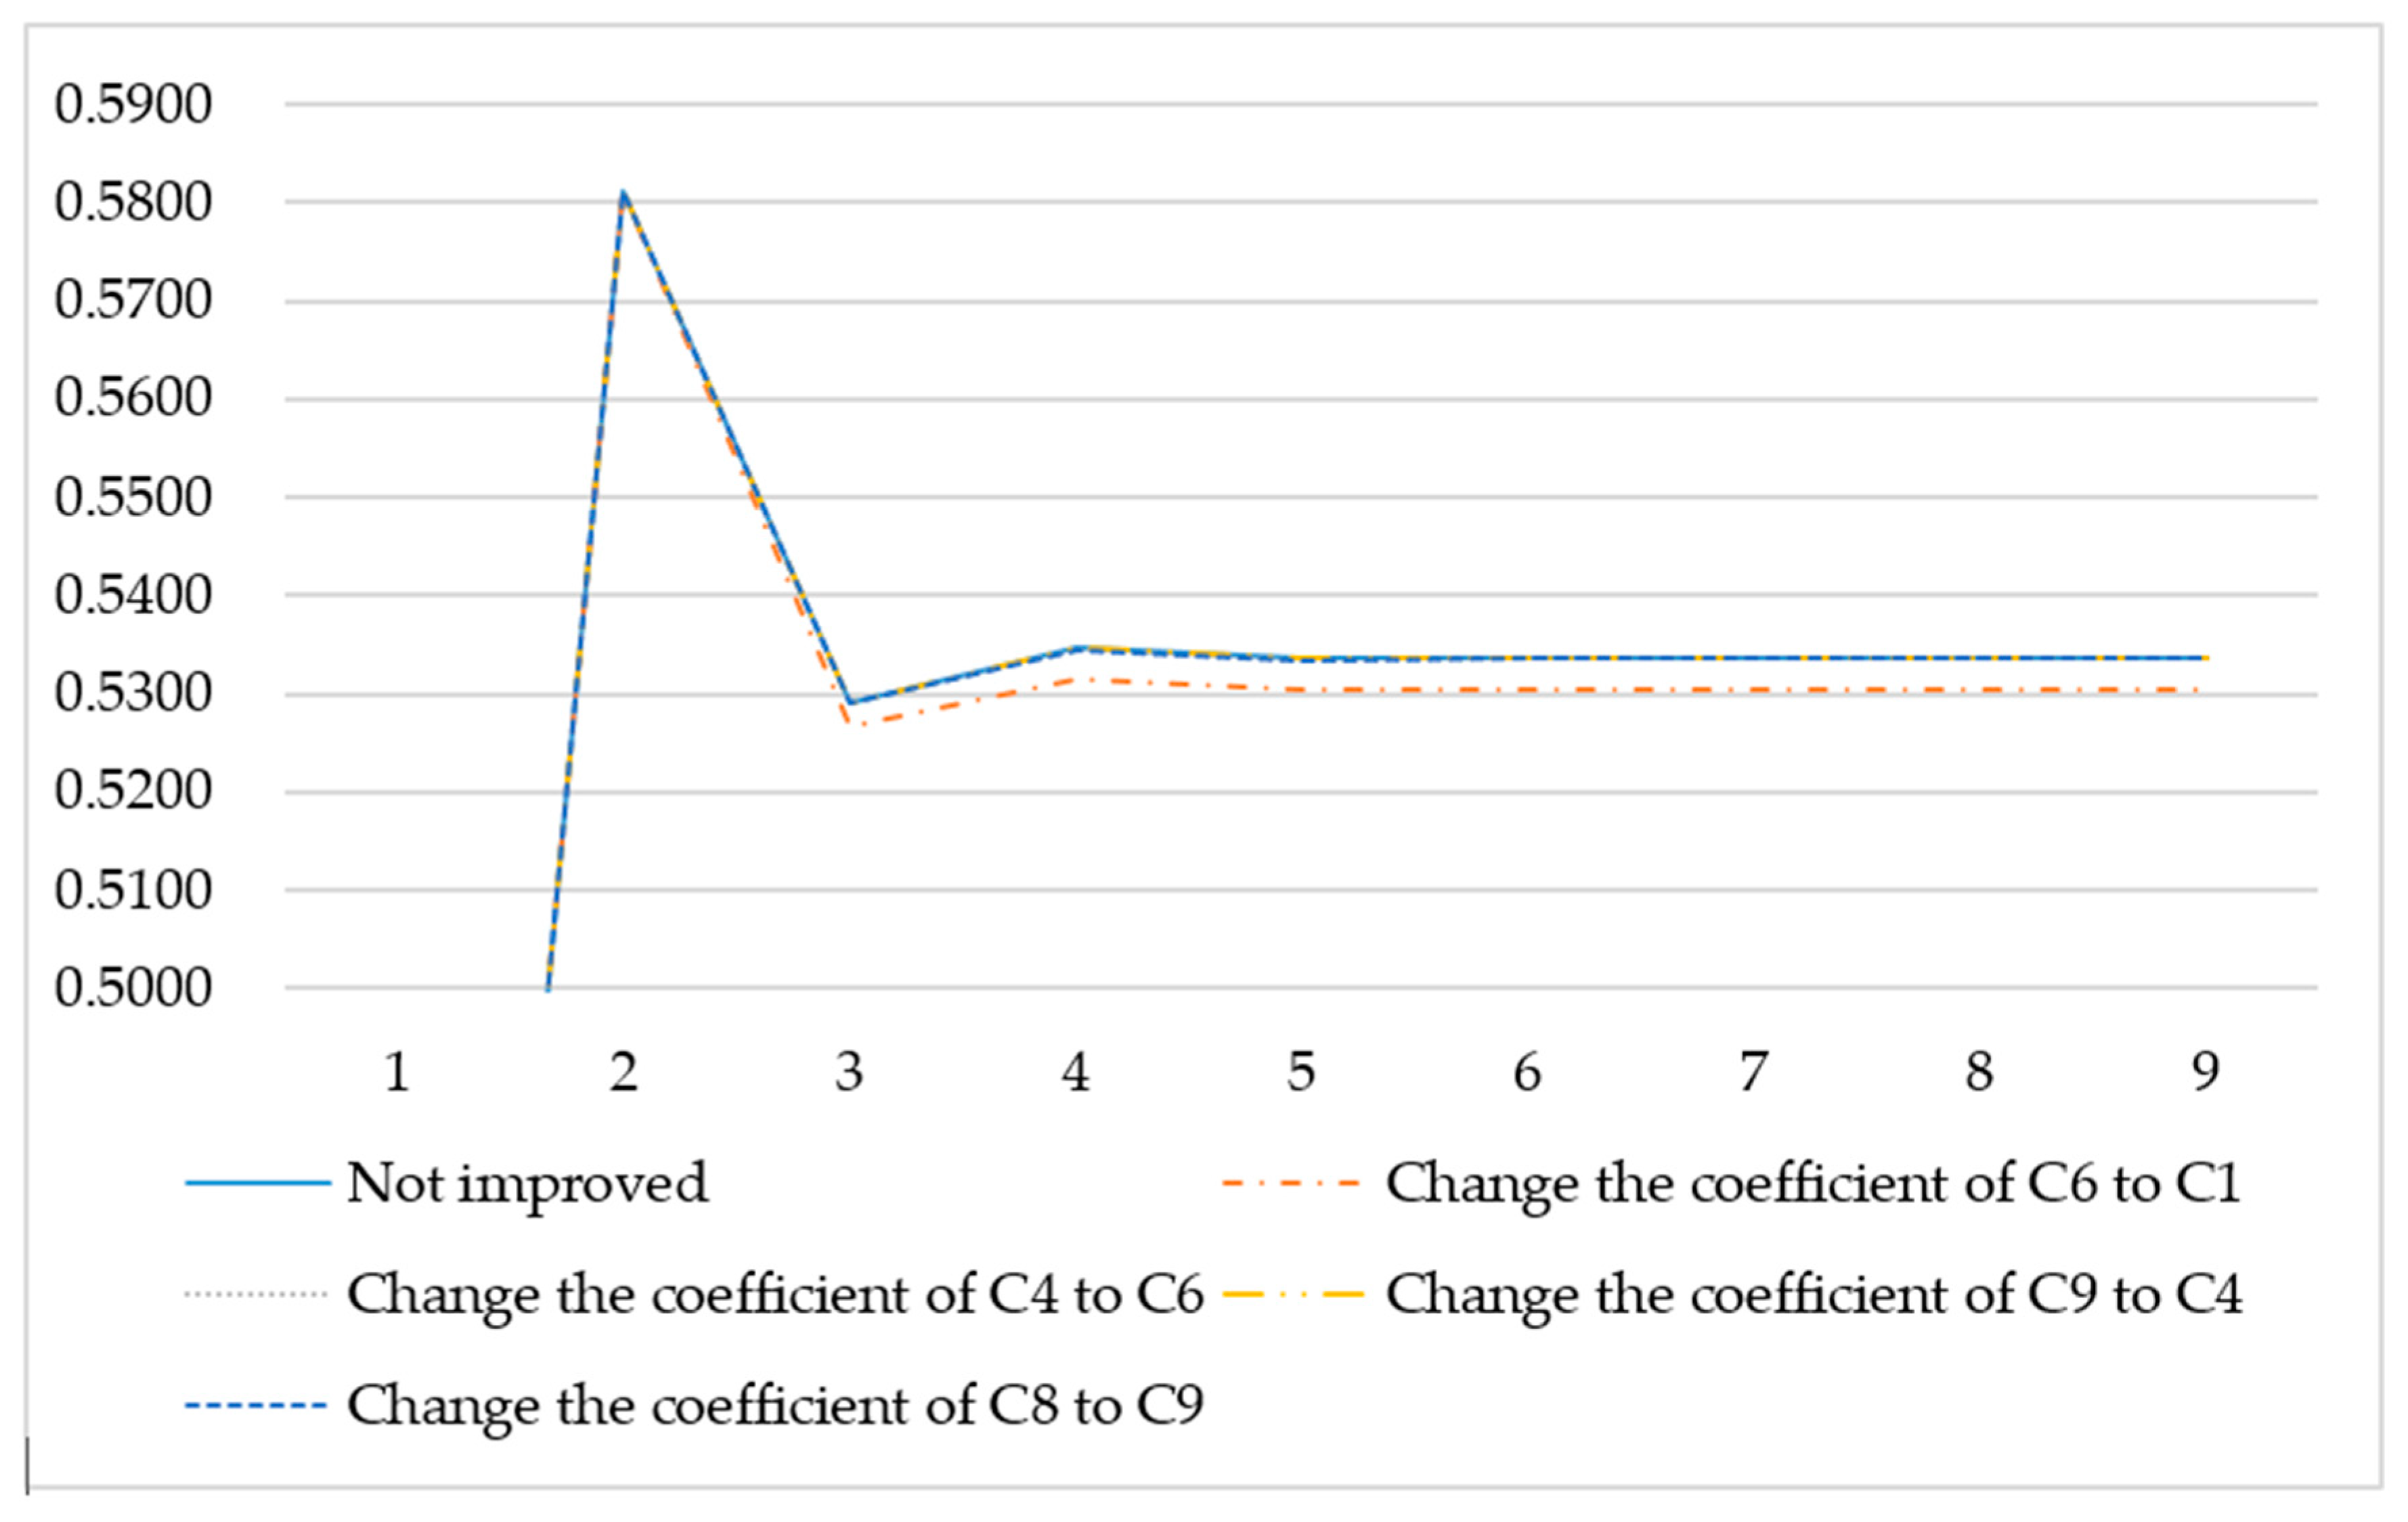
Adjust the coefficients between the indicators in path 1 by 0.1, use the fuzzy cognitive graph inference mechanism to infer the dynamic change of the energy consumption coefficient (C3), and draw a comparison curve, as shown in Figure 4.The sensitivity of indicators in path 1 is shown in Table 7.
As seen in Figure 4 and Table 7, changing the coefficient of the R&D expenditure internal expenditure (C6) has the most significant impact on the energy consumption coefficient (C3), and the absolute value of the value-added rate is as high as 0.5997. Changes in other coefficients have little effect on the results. Therefore, the key factor in the first path is the R&D expenditure internal expenditure (C6).
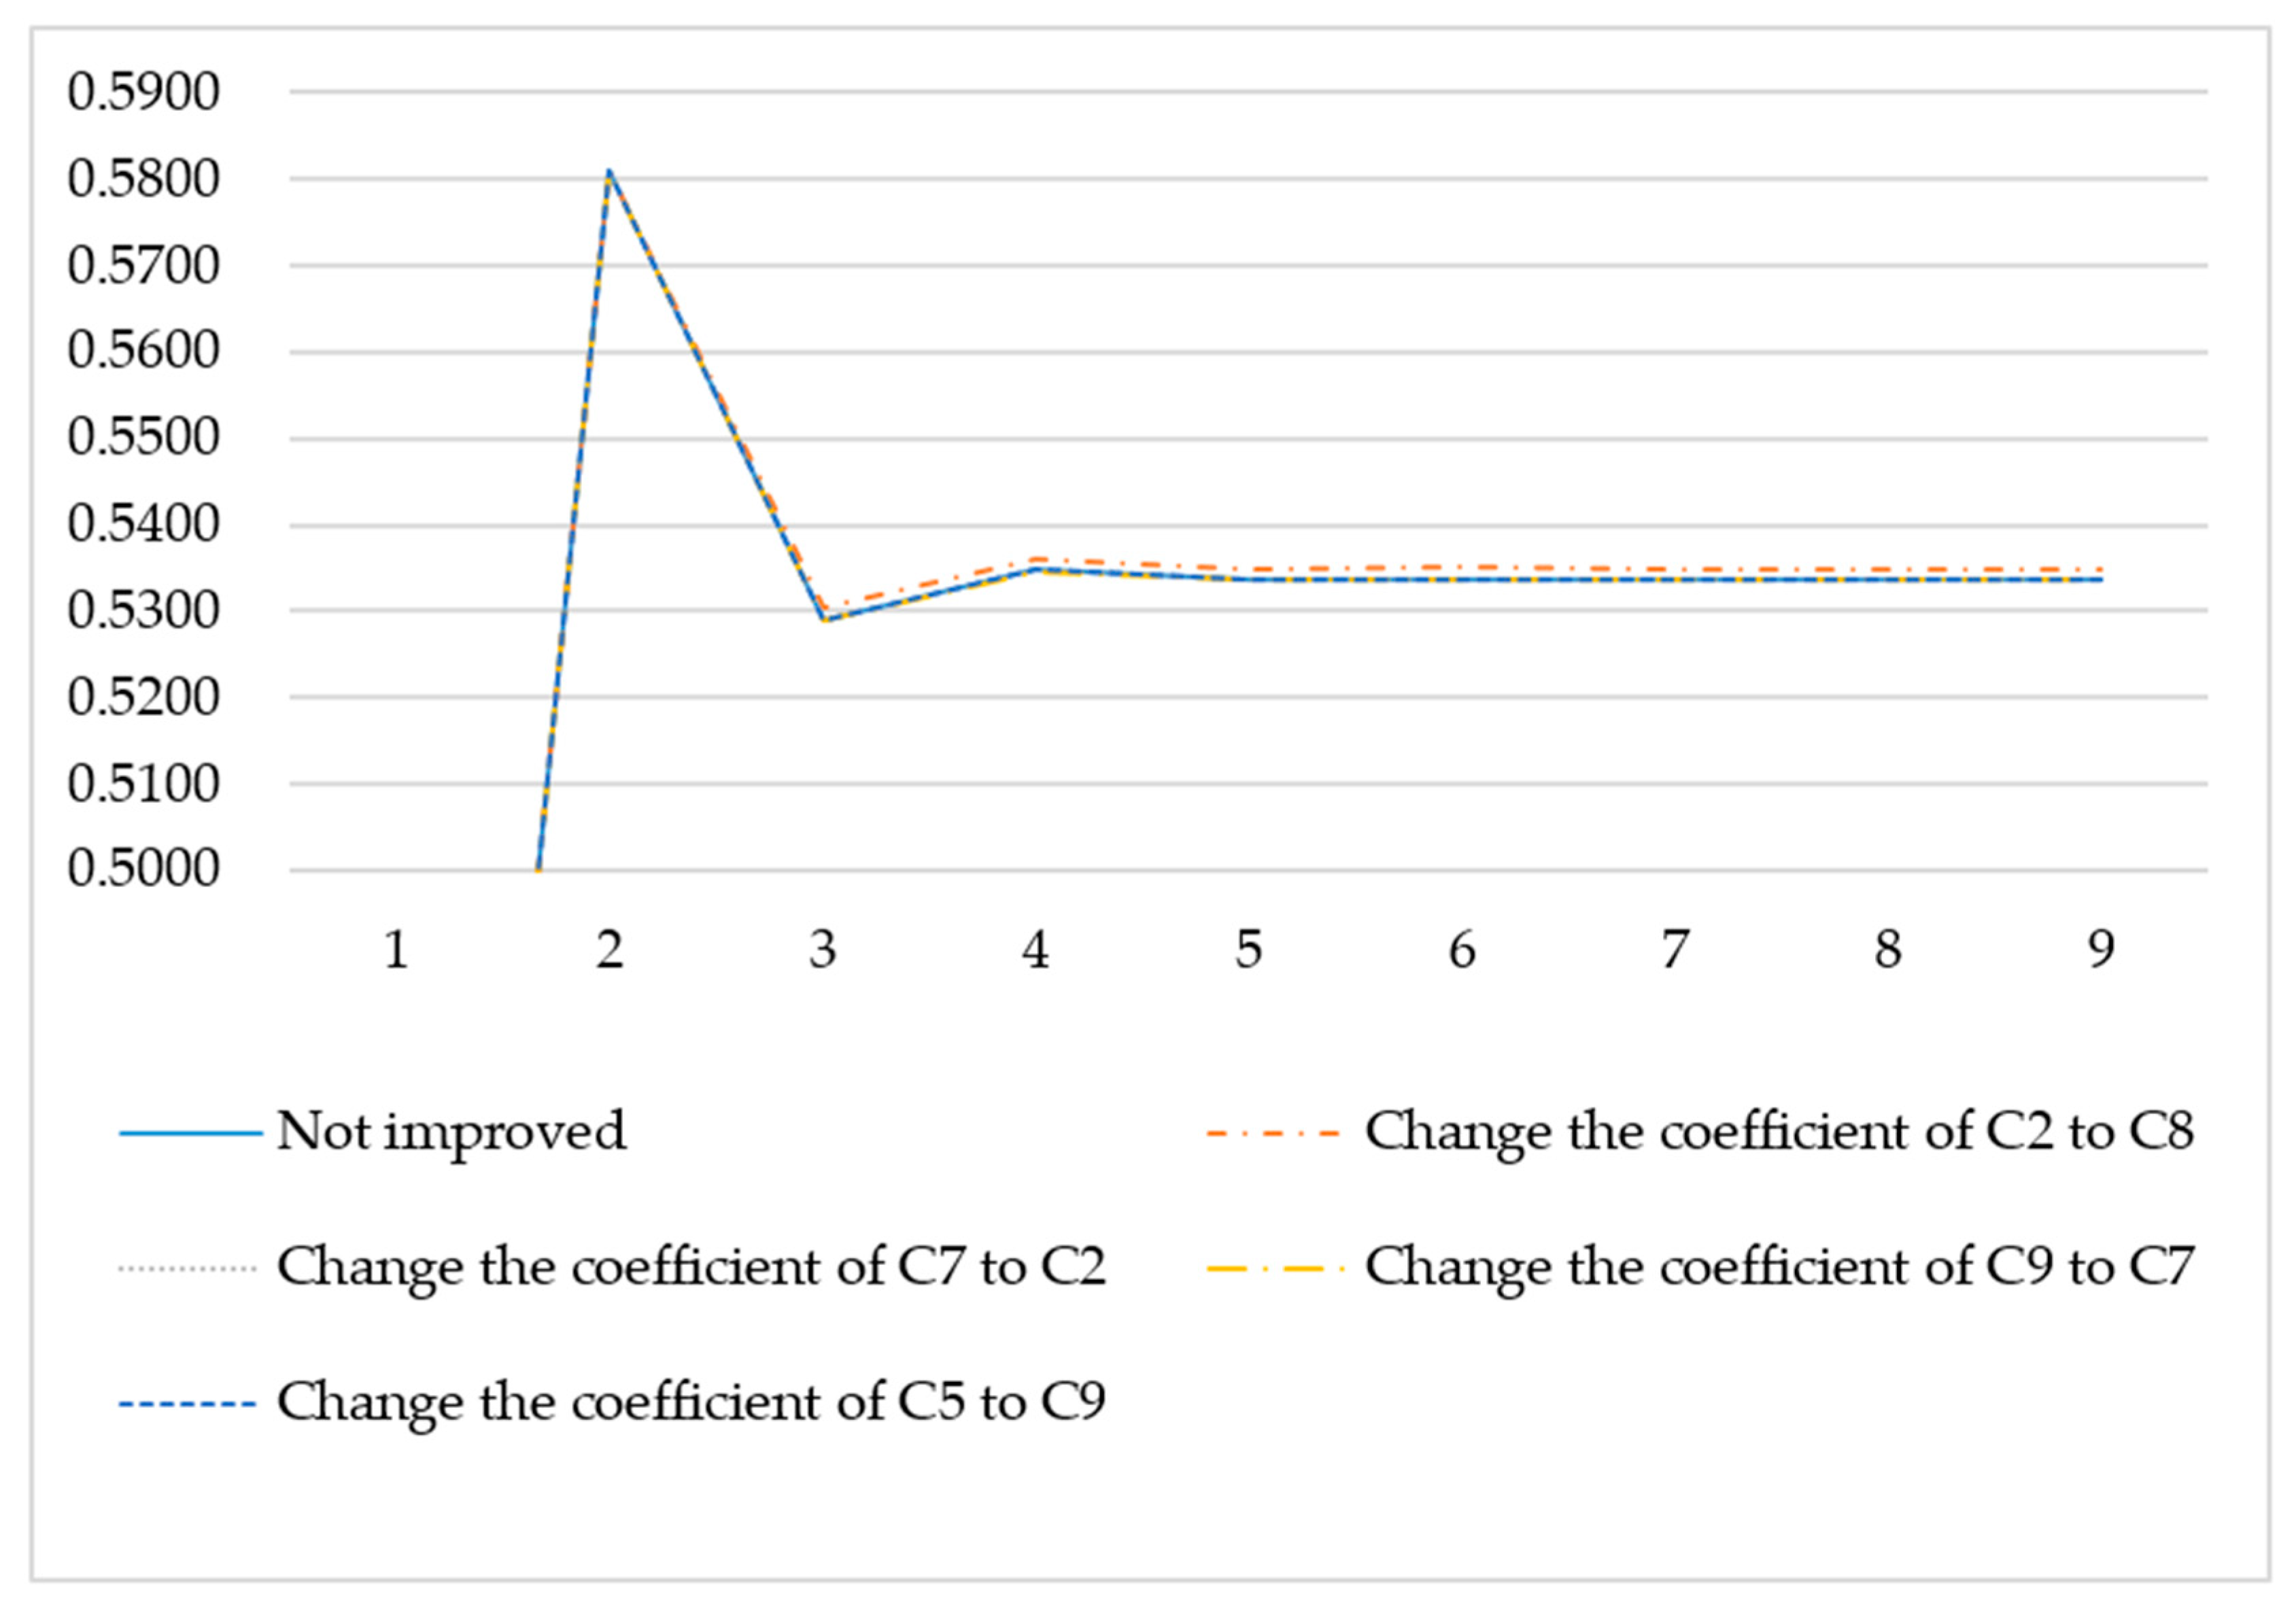
The next step was to adjust the coefficient between the indicators in Path 2 to 0.1, use the fuzzy cognitive graph inference mechanism to infer the dynamic change of the energy consumption coefficient (C3), draw a comparison curve, and calculate the sensitivity of each indicator, as shown in Figure 5. The sensitivity of indicators in path 1 is shown in Table 8.
It can be seen from Figure 5 and Table 8 that changing the weight value of main business income (C2) on return on investment (C8) also has a greater impact on the energy consumption coefficient (C3), with a maximum growth rate of 0.2836. Changes in other index coefficients have a smaller effect on the energy consumption coefficient (C3). Therefore, in path 2, the key factor is the main business income (C2).
Compared with the first path, the highest growth rate of the second path is slightly smaller than that of the first path. Therefore, the first path is critical.
As seen in the previous section, the first path is the critical path. The key indicator of the first path is the R&D expenditure internal expenditure (C6). Every indicator on the critical path should be controlled, especially the key indicators. According to the fuzzy cognitive map, the value of industrial output (C1) is negatively correlated with the energy consumption coefficient (C3); an increase in the industrial output (C1) will lead to a decrease in the energy consumption coefficient (C3). The R&D expenditure internal expenditure (C6) positively affects the industrial output (C1). To reduce the target value, the values of the R&D expenditure internal expenditure (C6) should be increased. Therefore, the Shandong provincial government should establish a sound incentive mechanism promptly, to encourage the chemical industry to increase investment in science and technology. First of all, it is necessary to enrich and optimize funding support for the chemical industry, adopt indirect support methods such as step discounts and performance rewards, and encourage chemical companies to invest in innovative projects with development potential and carry out technological innovation. This also takes the form of first investment and then subsidies, to give a certain percentage of financial grants to advantageous projects to motivate the enthusiasm of enterprises for scientific research. Later, fiscal and preferential tax policies should be released to encourage chemical companies to innovate independently. The government should comply with the policies and regulations issued by the state and reduce the tax rate of independent innovation enterprises. This encourages enterprises to develop and produce high-tech products and increase exports. Finally, it is necessary to guide and support chemical companies to strengthen school–enterprise cooperation and build scientific and technological innovation organizations. Likewise, it is necessary to encourage and support chemical companies to cooperate with universities and research institutes to establish joint laboratories; to effectively increase investment in research and development of strategic key technologies and major equipment; and to accelerate the establishment and improvement of a technological innovation platform with advanced levels.

5. Discussion

Through the above research, the key path for the transformation and upgradation of the Shandong chemical industry is to ultimately reduce energy consumption by increasing the return on investment, reducing environmental consumption, and increasing scientific and technological investment. On this critical path, increasing investment in science and technology is the most vital influencing factor. In other words, the Shandong chemical industry should promote transformation and upgradation through scientific and technological innovation to realize the transformation of the green chemical industry. This result is consistent with the development concept and value orientation of the transformation and upgradation of the chemical industry. The five development concepts, including "innovative development, coordinated development, green development, open development, and shared development", put forward in China’s thirteenth five-year plan, reflect China’s future development thinking, direction, and focus on establishing higher quality processes. The goal of efficient, fairer and more sustainable development marks the transition from extensive to high-quality development. It proposed goals for the transformation and upgradation of the chemical industry and raised major issues about what kind of growth to achieve and how to achieve it. This is a clear value orientation for the development of the chemical industry.
Shandong is the largest chemical province in the country. In 2016, there were more than 4000 chemical production enterprises above designated size in the province. The number of enterprises above designated size, main income, profits, taxes, and profits accounted for about one-fifth of the national chemical industry. However, the traditional chemical industry has serious environmental pollution problems. To root out ecological pollution at its source, it is necessary to completely change the development model of infection first and then control and abandon the extensive production model. This will follow the green chemical route and change the linear material flow process from resource–waste/emissions to resource–product–renewable resource: a recycling material flow process. This will reduce the three forms of waste production and emissions, and lead to industrial transformation and upgradation. For Shandong Chemical Industry, safety is the prerequisite; environmental protection is the key; transformation and upgradation are the core; and all these important factors cannot be separated from technological innovation.
The transformation and upgradation of the chemical industry is a complex system with multiple indicators. Comprehensive comprehension of the five development concepts during the development of the chemical industry requires a systematic approach. With this understanding, this article methodically determines the evaluation index system. It builds a fuzzy cognitive map from the perspective of system development. It then dynamically chooses the transformation path of the chemical industry according to the reasoning mechanism of the fuzzy cognitive map. Previous studies [16,17,20,21] have chosen the transformation path based on expert opinion. The shortcoming of using expert opinion is that it may or may not be consistent with the actual situation. This article overcomes this shortcoming by using historical data to select the transformation path.
The purpose of this article is to find a path that can enhance the transformation and upgradation capabilities of the chemical industry and promote the transformation and upgradation of the chemical industry. First, this uses fuzzy cognitive map tools to for causal reasoning and interpretation of indicators that affect the transformation and upgradation of the chemical industry. The essence of the fuzzy cognitive map method is to learn the laws of the chemical industry transformation and upgradation system through historical data, that is, the weight matrix of the fuzzy cognitive map, which reflects the endogenous influence between the indicators in the system. The initial data is inputted into the system, and the FCM reasoning mechanism is used to infer the evolution of each indicator data until the indicator data reaches a stable state, at which time the system reaches stability. If you want to change this state, you need to break the law of formation. The choice of path takes advantage of this feature of the fuzzy cognitive map, adjusting the degree of impact on the system’s steady state through regular adjustment of changes, and selecting the key development path and key impact indicators. This method applies to the problem of industry transformation and upgradation.

6. Conclusions

This article uses a fuzzy cognitive map as a tool to select the path of transformation and upgradation of Shandong’s chemical industry. The specific results are as follows:
Through the study of historical data, a fuzzy cognitive map of Shandong chemical industry transformation and upgradation was drawn. The figure explains the relationship between indicators. According to the calculation of the index entry and exit degree, the endpoint of the transformation and upgradation path of the Shandong chemical industry is determined as the energy consumption coefficient. The goal of the system is to reduce the energy consumption coefficient of the Shandong chemical industry system through the control of other indicators on the path and provide a basis for decision making concerning the sustainable development of the Shandong chemical industry.
According to the directional influence between the indicators and the endpoints of the path, two loops were found, that is, two development paths for the transformation and upgradation of the Shandong chemical industry. Through the calculation of the index sensitivity, the index sensitivity of the first path is slightly higher than that of the second path, so the primary path is determined as the development path of the Shandong chemical industry. This path increases the return on investment, reduces the environmental consumption of unit output value, and increases the investment of manpower and capital for innovative research, thereby increasing the industry output value and ultimately reducing energy consumption. The key indicator on this path is R&D internal expenditure, which reflects the importance attached to technological innovation by the Shandong chemical industry. Through the control of this indicator, the energy consumption during the transformation and upgradation of the Shandong Chemical Industry can be changed to a greater extent. Finally, some suggestions for the high-quality and sustainable development of the Shandong chemical industry are given. This includes improving incentive mechanisms, encouraging chemical companies to invest in innovative projects with development potential, and carrying out technological innovation. In addition, it strengthens school–enterprise cooperation and training, and introduces high-end scientific and technical talent.
Compared with previous studies, this paper depicts the path of transformation and upgradation of chemical industry from the perspective of quantitative analysis, avoiding excessive dependence on expert opinions, and making the results scientific and persuasive. Currently, however, the use of this method has some limitations. First, the impact indicator for the transformation and upgradation of the chemical industry relies on data. The indicator data comes from the statistical data in the "Shandong Statistical Yearbook," and the accuracy of statistical data cannot be guaranteed. If the statistical data at a certain point deviates from the actual situation or if the data is missing, it will have an impact on the results. Secondly, in the research process, this article identifies the development rules of the transformation and upgradation system of the chemical industry based on historical data. According to the learned rules, the future development trend of the system is dynamically predicted to select the path. However, we have overlooked that the system will be affected by policies in the process of development, and the laws of development may be broken by external factors. Therefore, in future research, we will judge the future state of system development based on relevant policies that affect the development of the chemical industry.

Author Contributions

Writing—original draft preparation, H.H. and Y.Y.; writing—review and editing, R.Z. and B.B. All authors have read and agreed to the published version of the manuscript.

Funding

This research was funded by the National Social Science Fund of China, No 18BJL047, Shandong Provincial Social Science Planning Project, No 18BGLJ05, and Shandong Provincial Department of Education Research and Development Program, NoKJ2018BZN029.

Acknowledgments

The authors gratefully acknowledge the comments and improvement suggestions of the anonymous reviewers; and the superb contribution and infinite willingness of the panel members.

Conflicts of Interest

The authors declare no conflict of interest.

References

  1. Cox, E. Chemical Industry. Ind. Eng. Chem. 1955, 47, 432–437. [Google Scholar] [CrossRef]
  2. Schmid, A.; Hollmann, F.; Park, J.B. The use of enzymes in chemical industry in Europe. Curr. Opin. Biotech. 2002, 13, 359–366. [Google Scholar] [CrossRef]
  3. Basil, J.; Nikolau, M.; Ann, D.N. Platform biochemicals for a biorenewable chemical industry. Plant. J. 2008, 54, 536–545. [Google Scholar]
  4. Gavrilescu, M.; Chisti, Y. Biotechnology—A sustainable alternative for chemical industry. Biotechnol. Adv. 2005, 23, 471–499. [Google Scholar] [CrossRef]
  5. Hoffman, A.J. Institutional Evolution and Change: Environmentalism and the U.S. Chemical Industry. Acad. Manag. J. 1999, 42, 351–371. [Google Scholar]
  6. Bibeault, D.B. Corporate Turnaround: How Managers Turn Losers Into Winners; Accountancy, Sage: Frederick, MD, USA, 1982. [Google Scholar]
  7. Kaplinsky, R. Spreading the Gains from Globalisation: What can be Learned from Value Chain Analysis; Institute of Development Studies; Sage: Brighton, UK, 2000. [Google Scholar]
  8. Poon, S.C. Beyond the global production networks: A case of furtherupgradation of Taiwan’s information technology industry. Int. J. Tech. Glob. 2004, 1, 130–144. [Google Scholar] [CrossRef]
  9. Biggart, N.W.; Levy, A.; Merry, U. Organizational Transformation: Approaches, Strategies, Theories. Adm. Sci. Q. 1988, 33, 471. [Google Scholar] [CrossRef]
  10. Haveman, H.A. Between a Rock and a Hard Place: Organizational Change and Performance under Conditions of Fundamental Environmental Transformation. Adm. Sci. Q. 1992, 37, 48–75. [Google Scholar] [CrossRef]
  11. Forbes, N.; Wield, D. What is R&D? Why does it matter? Sci. Public Policy 2004, 31, 267–277. [Google Scholar]
  12. Elliot, S. Technology-Enabled Innovation, Industry Transformation and the Emergence of Ambient Organizations. Ind. Inno. 2006, 13, 209–225. [Google Scholar] [CrossRef]
  13. Shaohua, Z.; Ruirui, H. From Single to Diverse Structure and from Manufacturing to Services:the Transformation Process of Ruhr. Urban. Stud. 2012, 2, 42–47. [Google Scholar]
  14. Drucker, J.; Feser, E. Regional industrial structure and agglomeration economies: An analysis of productivity in three manufacturing industries. Reg. Sci. Urban. Econ. 2015, 42, 1–14. [Google Scholar] [CrossRef]
  15. Xu, X.W. Research on the Contribution of Influencing Factors of Shijiazhuang Industrial Green Transformation. Master’s Thesis, Liaoning University, Liaoning, China, 2016. [Google Scholar]
  16. Dai, D. Research on the Factors Affecting Industrial Transformation and Upgradation. Master’s Thesis, Guangdong Academy of Social Science, Guangdong, China, 2014; pp. 1–69. [Google Scholar]
  17. Yan, F.P. Research on Transformation andupgradation of Manufacturing Industry in Foshan City. Master’s Thesis, CPC Guangdong Provincial Committee Party School, Guangzhou, China, 2018. [Google Scholar]
  18. Swartz, N. No Cingular Killer App (Cingular Wireless plans to develop data services) (Company Business and Marketing). Curr. Microbiol. 2001, 43, 244–248. [Google Scholar]
  19. Srinivasan, M. E-Business and ERP: A Conceptual Framework toward the Business Transformation to an Integrated E-Supply Chain. Int. J. Enterp. Inform. Syst. 2010, 6, 1–19. [Google Scholar] [CrossRef] [Green Version]
  20. Liang, S.G. Analysis on the Path and Countermeasure of Industrial Enterprise Transformation and Upgrade-Taking Liaocheng Enterprise as an Example. J. Liaocheng Univ. 2018, 1, 119–127. [Google Scholar]
  21. Zhao, L.S. Research on Evaluation of Logistics Enterprise Transition andupgradation Capability. Value. Eng. 2018, 37, 12–14. [Google Scholar]
  22. Nápoles, G.; Salmeron, J.L.; Froelich, W. Fuzzy Cognitive Modeling: Theoretical and Practical Considerations. Intell. Decis. Technol. 2020, 142, 77–87. [Google Scholar]
  23. Nápoles, G.; Houdt, G.; Laghmouch, M. Fuzzy Cognitive Maps: A Business Intelligence Discussion. Intell. Decis. Technol. 2020, 142, 89–98. [Google Scholar]
  24. Bahri, O.; Mourhir, A.; Papageorgiou, E.I. Integrating fuzzy cognitive maps and multi-agent systems for sustainable agriculture. Euro-Medit. J. Environ. Int. 2020, 5, 1. [Google Scholar] [CrossRef]
  25. Nasirzadeh, F.; Ghayoumian, M.; Khanzadi, M. Modelling the social dimension of sustainable development using fuzzy cognitive maps. Int. J. Const. Manag. 2020, 20, 223–236. [Google Scholar] [CrossRef]
  26. Papageorgiou, K.; Singh, P.K.; Papageorgiou, E. Fuzzy Cognitive Map-Based Sustainable Socio-Economic Development Planning for Rural Communities. Sustainability 2020, 12, 305. [Google Scholar] [CrossRef] [Green Version]
  27. Bevilacqua, M.; Ciarapica, F.E.; Mazzuto, G. Fuzzy cognitive maps for adverse drug event risk management. Saf. Sci. 2018, 102, 194–210. [Google Scholar] [CrossRef]
  28. Rezaee, M.J.; Yousefi, S.; Valipour, M.; Dehdar, M.M. Risk Analysis of Sequential Processes in Food Industry Integrating Multi-stage Fuzzy Cognitive Map and Process Failure Mode and Effects Analysis. Comput. Ind. Eng. 2018, 123, 325–337. [Google Scholar] [CrossRef]
  29. Zhang, L.; Qiao, X.D.; Zhu, L.J.; Zhu, M.X. Research on cognitive map analysis method. Inf. Stud. Theory Appl. 2014, 37, 34–39. [Google Scholar]
  30. Zdanowicz, P.; Petrovic, D. New Mechanisms for Reasoning and Impacts Accumulation for Rule-Based Fuzzy Cognitive Maps. IEEE T. Fuzzy Syst. 2018, 26, 543–555. [Google Scholar] [CrossRef]
  31. Zou, X.; Liu, J. A Mutual Information-Based Two-Phase Memetic Algorithm for Large-Scale Fuzzy Cognitive Map Learning. IEEE T. Fuzzy Syst. 2018, 26, 2120–2134. [Google Scholar] [CrossRef]
  32. Zhang, Y.Y.; Chen, L.F.; Pan, D. Measurement of Jiangsu’s Industrial Transformation andupgradation Development Level and Analysis of Regional Differences. Ind. Sci. Trib. 2018, 17, 100–102. [Google Scholar]
  33. Wu, L.L.; Ren, H.; Xing, R.F. Analysis on Corporation Human Capital Pricing Based on Game Theory and System Dynamics. J. Manag. Sci. 2006, 19, 24–31. [Google Scholar]
  34. Lu, Z.P. Return on investment and effectiveness of monetary policy. Mod. Manag. Sci. 2016, 2016. 8, 48–50. [Google Scholar]
  35. Ye, Q.N.; Xiong, Y. Analysis of Shenzhen PPI and IPI "not synchronous" phenomenon. China Natl. Cond. Strength 2018, 5, 75–78. [Google Scholar]
  36. Liang, J.; Li, J. Construction of Evaluation Index System of Competitiveness of Hi-Tech Parks. Soft. Sci. 2011, 25, 10–13. [Google Scholar]
  37. Zhang, Z.Y.; Li, Z.Y. Research on Innovation Driven Manufacturing Transformation andupgradation. Stud. Soc. Chin. Charact. 2015, 4, 41–44. [Google Scholar]
  38. Wu, J. Influence of Regional Industrial Transfer on the Transformation andupgradation of Manufacturing Industry in Western China—Based on the Perspective of Industry Value Chain. Soft. Sci. 2017, 31, 21–25. [Google Scholar]
  39. Kwak, N.S.; Lee, J. An Enhancement of Selection and Crossover Operations in Real-coded Genetic Algorithm for Large-dimensionality Optimization. J. Mech. Sci. Technol. 2016, 30, 237–247. [Google Scholar] [CrossRef]
  40. Otsuka, A.; Nagata, F. Quality Design Method Using Process Capability Index Based on Monte-Carlo Method and Real-coded Genetic Algorithm. Int. J. Prod. Econ. 2018, 204, 358–364. [Google Scholar] [CrossRef]
Figure 1. Fuzzy cognitive map without weights.
Sustainability 12 03443 g001
Figure 2. Fuzzy cognitive map with weights.
Sustainability 12 03443 g002
Figure 3. The choice of enterprise transformation and upgrade path.
Sustainability 12 03443 g003
Figure 4. The impact of changes in the index coefficients on path 1 on C3.
Sustainability 12 03443 g004
Figure 5. The impact of changes in the index coefficients of path 2 on C3.
Sustainability 12 03443 g005
Table 1. Index system and interpretation of each indicator.
IndicatorExplanation
Economic benefitIndustrial output(C1)The indicator data expressed in monetary form refers to the total value of final industrial products produced by chemical enterprises above designated size or providing industrial labor activities. It reflects the whole scale and overall level of production in the chemical industry within a specified period.
Main business income(C2)Refers to the operating income from the production and operation of major products of enterprises above designated size in the chemical industry. Uses the leading business income indicators to determine the development trend in the chemical industry within a specified period.
PPI(C5)PPI (producer price index) is the producer’s ex-factory price index. It is a relative number that reflects the trend and degree of change in the total ex-factory price of the chemical products of the above-scale chemical enterprises for the first time in a certain period. The index can observe the impact of changes in ex-factory prices on total industrial output and added value.
Return on investment(C8)This refers to the value that an enterprise should return through finance and the economic recovery that the enterprise receives from an investment in an investment business activity. It can reflect the company’s overall profitability and help optimize resource allocation. Return on investment (ROI) = annual profit or annual profit / total investment × 100%. It can be seen from the formula that enterprises can increase the return on investment by reducing the cost of sales and increasing the profit rate.
Technological innovation capabilityNumber of R&D personnel
(C4)
Refers to the number of people involved in research, management, and support work in research and experimental development projects. Reflects the scale of manpower invested in research and development activities with independent intellectual property rights in the chemical industry.
R&D expenditure internal expenditure(C6)Refers to the actual spending of the investigating unit for internal R&D activities (primary research, applied research, and experimental development). This indicator reflects the R&D level of the company and reflects the competitiveness of the chemical company.
GreenUnit production value environmental consumption(C9)Refers to the actual expenditure of the investigating unit for internal R&D activities (basic research, applied research, and experimental development). This indicator reflects the R&D level of the company and reflects the competitiveness of the chemical company.
Energy consumption factor(C3)A technical and economic indicator that reflects the relationship between energy and national economic development. It refers to the ratio of the average growth rate of energy consumption in a certain period to the average growth rate of GDP or the average growth rate of industrial and agricultural production in the same period. The greater the energy consumption coefficient, the faster the growth of energy consumption is than the growth rate of the national economy. The higher the energy consumption, the lower the energy efficiency.
PolicyLoan benchmark interest rate(C7)This is the loan-directed interest rate issued by the central bank (the People’s Bank of China) to commercial banks, and is one of the monetary policies used by the central bank to regulate the operation of the social economy and financial system. The benchmark interest rate can affect the level of financing of the company.
Table 2. Raw data.
Table 2. Raw data.
YearC1C2C3C4C5C6C7C8C9
200116,662,37615,830,9511.0310,41598.55107,2685.850.57650.0073
200220,245,74419,053,2131.5614,58396.68121,7655.850.47380.0069
200327,080,13525,811,6141.3612,083105.12145,8885.310.36470.0069
200437,880,42036,539,8361.3912,128106.2240,2245.310.43180.0076
200556,429,32255,652,9321.3213,480107.38283,8135.580.31670.0082
200673,787,41472,281,4560.7413,989103.27144,8735.580.36120.0089
200796,151,96794,251,9450.6120,785102.72546,4946.120.43860.0103
2008122,399,711119,401,6130.3731,488107.63854,9137.470.36160.0104
2009142,508,801140,239,825.80.4839,48593.581,021,2575.310.47680.0124
2010170,868,621168,689,141.50.643,567107.481,358,9205.310.56470.0124
2011216,957,615217,332,9950.6254,320107.271,720,7965.810.63480.0114
2012265,226,046267,981,4070.4864,64296.82,202,6536.560.57360.0124
2013303,435,570300,733,9310.570,15997.52,543,35560.5450.0121
2014341,645,09546,050,3760.3876,81198.32,973,58160.020.012
2015351,928,234351,327,4130.579,00493.93,292,2825.60.52640.0129
2016377,803,207376,770,2220.4386,42496.63,611,6364.350.47140.0112
Table 3. Equivalent calculated data.
YearC1C2C3C4C5C6C7C8C9
2001169,075.3526178,759.15871.0310,41598.55107,2685.850.57650.0073
200216,346,205.0917,750,784.461.5614,58396.68107,951.03495.850.47380.0069
200317,773,201.0718,072,550.941.3612,083105.12110,798.76495.310.36470.0069
200417,955,802.4518,519,448.841.3912,128106.2118,511.80495.310.43180.0076
200518,155,311.3618,179,806.441.3213,480107.38123,135.42555.580.31670.0082
200617,460,411.6618,054,675.030.7413,989103.27127,990.22735.580.36120.0089
200717,367,420.2218,662,456.170.6120,785102.72138,025.58586.120.43860.0103
200818,197,580.218,823,339.410.3731,488107.63148,764.99577.470.36160.0104
200915,822,071.517,875,915.870.4839,48593.58148,565.33935.310.47680.0124
201018,172,218.918,394,317.430.643,567107.48158,926.4535.310.56470.0124
201118,136,713.0718,769,711.660.6254,320107.27171,946.14855.810.63480.0114
201216,366,494.1318,251,310.10.4864,64296.8175,991.81666.560.57360.0124
201316,484,846.8818,269,186.020.570,15997.5179,827.320160.5450.0121
201416,620,107.1618,215,558.270.3876,81198.3181,319.488660.020.012
201515,876,175.6118,090,426.860.579,00493.9181,487.62035.60.52640.0129
201616,332,679.0618,322,813.770.4386,42496.6183,683.84014.350.47140.0112
Table 4. Normalized training data.
YearC1C2C3C4C5C6C7C8C9
20010.350.420.550.000.350.000.480.910.06
20020.220.001.000.060.220.010.480.740.00
20030.820.030.830.030.820.050.310.560.00
20040.900.720.860.030.900.150.310.670.12
20050.980.400.800.040.980.210.390.480.21
20060.690.280.310.050.690.270.390.560.33
20070.650.850.200.140.650.400.570.680.56
20081.001.000.000.281.000.541.000.560.59
20090.000.120.090.390.000.540.310.740.92
20100.990.600.190.440.990.680.310.890.90
20110.210.950.210.580.970.850.471.000.75
20120.230.470.090.720.230.900.710.900.90
20130.210.480.110.790.280.950.530.850.86
20140.340.480.010.880.340.970.530.000.84
20150.020.320.110.910.020.970.400.821.00
20160.210.530.051.000.211.000.000.730.71
Table 5. CPI and GDP deflators over the years.
YearCPIGDP Deflator
2001101.8102.08
200299.3102.73
2003101.1105.44
2004103.6112.78
2005101.7117.18
2006101121.8
2007104.4131.35
2008105.3141.57
2009100141.38
2010102.9151.24
2011105163.63
2012102.1167.48
2013102.2171.13
2014101.9172.55
2015101.2172.71
2016102.5174.8
Table 6. Degree of divergence and centrality of each indicator.
OutdegreeOrderIndegreeOrderCentralityOrder
C11.04350.85951.9026
C20.73970.33481.0738
C30.34191.92912.273
C40.86760.91241.7797
C51.23630.68661.9225
C61.2721.64822.9181
C70.58680.32990.9159
C81.39510.61972.0144
C91.20841.36932.5772
Table 7. The sensitivity of indicators in path 1.
Number of IterationsChange the Coefficient of C6 to C1Growth RateChange the Coefficient of C4 to C6Growth RateChange the Coefficient of C9 to C4Growth RateChange the Coefficient of C8 to C9Growth RateNot Improved
00.338100.338100.338100.338100.3381
10.581100.581100.581100.581100.5811
20.5266−0.45370.52900.52900.52900.529
30.5316−0.57980.5346−0.01870.534700.5345−0.03740.5347
40.5304−0.59970.5335−0.01870.533600.5335−0.01870.5336
50.5305−0.59960.5336−0.01870.533700.5336−0.01870.5337
60.5305−0.59960.5336−0.01870.533700.5336−0.01870.5337
70.5305−0.59960.5336−0.01870.533700.5336−0.01870.5337
Table 8. The sensitivity of indicators in path 2.
Number of IterationsChange the Coefficient of C2 to C8Growth RateChange the Coefficient of C7 to C2Growth RateChange the Coefficient of C9 to C7Growth RateChange the Coefficient of C5 to C9Growth RateNot Improved
00.338100.338100.338100.338100.3381
10.581100.581100.581100.581100.5811
20.53050.28360.52900.52900.52900.529
30.53590.22440.534700.5346−0.01870.53480.01870.5347
40.53480.22490.533600.533600.53370.01870.5336
50.5350.24360.53380.01870.533700.53380.01870.5337
60.53490.22480.533700.533700.53380.01870.5337
70.53490.22480.533700.533700.53380.01870.5337