Article

Inhibition during Anaerobic Co-Digestion of Aqueous Pyrolysis Liquid from Wastewater Solids and Synthetic Primary Sludge

Department of Civil, Construction and Environmental Engineering, Marquette University, P.O. Box 1881, Milwaukee, WI 53233, USA
*
Author to whom correspondence should be addressed.
Sustainability 2020, 12(8), 3441; https://doi.org/10.3390/su12083441
Submission received: 29 March 2020 / Revised: 17 April 2020 / Accepted: 20 April 2020 / Published: 23 April 2020
(This article belongs to the Special Issue Anaerobic Environmental Biotechnology and Sustainability)

Abstract

:
Pyrolysis can convert wastewater solids into useful byproducts such as pyrolysis gas (py-gas), bio-oil and biochar. However, pyrolysis also yields organic-rich aqueous pyrolysis liquid (APL), which presently has no beneficial use. Autocatalytic pyrolysis can beneficially increase py-gas production and eliminate bio-oil; however, APL is still generated. This study aimed to utilize APLs derived from conventional and autocatalytic wastewater solids pyrolysis as co-digestates to produce biomethane. Results showed that digester performance was not reduced when conventional APL was co-digested. Despite having a lower phenolics concentration, catalyzed APL inhibited methane production more than conventional APL and microbial community analysis revealed a concomitant reduction in acetoclastic Methanosaeta. Long-term (over 500-day) co-digestion of conventional APL with synthetic primary sludge was performed at different APL organic loading rates (OLRs). Acclimation resulted in a doubling of biomass tolerance to APL toxicity. However, at OLRs higher than 0.10 gCOD/Lr-d (COD = chemical oxygen demand, Lr = liter of reactor), methane production was inhibited. In conclusion, conventional APL COD was stoichiometrically converted to methane in quasi steady state, semi-continuous fed co-digesters at OLR ≤ 0.10 gCOD/Lr-d. Undetected organic compounds in the catalyzed APL ostensibly inhibited anaerobic digestion. Strategies such as use of specific acclimated inoculum, addition of biochar to the digester and pretreatment to remove toxicants may improve future APL digestion efforts.

Graphical Abstract

1. Introduction

Contaminants such as antibiotic resistance genes, pathogens and other micropollutants can enter the environment when wastewater solids are land applied or landfilled [1,2]. Release of these constituents may be reduced if solids management technologies such as pyrolysis are employed to remove or destroy these contaminants and reduce the volume of biosolids [1,3,4]. Pyrolysis involves the thermal conversion of wastewater solids in the absence of oxygen at temperatures between 400 and 1000 °C, and yields three products: biochar, pyrolysis gas (py-gas) and pyrolysis liquid [5,6,7,8]. Biochar can be used as a soil amendment to increase crop growth and an adsorbent to remove pollutants [3,5,7]. Py-gas is a mixture of methane (CH4), carbon monoxide (CO), hydrogen (H2) and other gases that can be combusted directly for heat and power generation.
Pyrolysis liquid is a complex mixture of organic compounds with water and often partitions into bio-oil (a light non-aqueous phase liquid) and aqueous pyrolysis liquid (APL) [6,8,9,10,11]. Bio-oil can be used as a renewable fuel after conditioning to remove water, organic acids and other constituents that are corrosive during combustion. By contrast, APL is water-based, has a low heating value and currently has no known beneficial use [10,11,12]. APL can be environmentally harmful if not managed properly due to its high chemical oxygen demand (COD) concentration and the presence of potentially toxic organic compounds such as cresol, ethylbenzene, phenol and xylene [13].
Autocatalytic pyrolysis is a recently-developed process that uses previously-produced biochar from biosolids pyrolysis as a catalyst to increase py-gas while decreasing bio-oil and APL production [5,8,14]. The novel autocatalytic process has been shown to increase py-gas energy by more than three times (from 2940 kJ/kg biosolids-pyrolyzed to 10,200 kJ/kg biosolids-pyrolyzed) [14]. Additionally, as illustrated in the graphical abstract, autocatalytic pyrolysis of wastewater biosolids at 800 °C resulted in no bio-oil production, but APL was still produced (catalyzed APL) that had a lower organic content and fewer unsaturated hydrocarbons compared to non-catalyzed APL [13,14].
One possible APL management strategy involves anaerobic digestion, since APL contains a high concentration of organics (30–300 gCOD/L), including acetic acid (approximately 25 g/L) that possibly could be converted to biogas containing methane for renewable energy generation [11,13]. However, previous studies have shown anaerobic digestion is challenging since APL contains organic compounds that are known to inhibit methanogens and reduce or stop digester methane production [10,11,15]. In addition, high ammonia nitrogen (NH3-N) concentration in APL may also cause digester inhibition [13,16]. Both catalyzed and non-catalyzed APLs used in this study contained high NH3-N concentrations. Therefore, air-stripping pretreatment was employed to reduce NH3-N content in APLs.
Anaerobic degradability of APL produced under different pyrolysis conditions has been previously investigated mostly in batch systems that do not mimic full-scale, continuously-fed systems. No reports were found regarding semi-continuous anaerobic co-digestion of APL derived from wastewater solids, biomass acclimation and the influence of APL feeding on the digester microbiome. Additionally, catalyzed APL derived from the novel autocatalytic pyrolysis process [14] has yet to be investigated as a viable co-digestate for anaerobic digestion. Parry et al. (2012) reported anaerobic co-digestion of APL obtained from pyrolysis of dried wastewater biosolids as well as thickened sludge; APL digestion resulted in 8% of the expected methane in a batch biochemical methane potential (BMP) test. The pyrolysis was performed at a low temperature (200 °C) and the APL generated was fed one time in a batch mode at 3.75 gCOD/L [17]. In another batch study, APL from corn stalk pyrolysis at 400 °C inhibited methanogenic activity at organic loading of 35 gCOD/Lr and nutrient supplement did not improve methane production, but biochar addition helped increase methane production in the batch and semi-continuous processes [11]. Hübner and Mumme (2015) also conducted a batch study using unacclimated biomass with APL derived at different temperatures (330, 430 and 530 °C) and demonstrated greater inhibition from APL derived at higher temperatures [10]. In a recent study, Yu et al. (2020) added different dilutions of APL (5, 50 and 100 times dilution) diluted with pure water during anaerobic digestion of swine manure. Anaerobic digestion of swine manure with APL addition was reported feasible in a batch test at low APL concentrations, whereas methane production ceased when the 5-time dilution was used [18]. Phenolic compounds in the APL was described as a possible cause for the digester failure [18]. In another recent study, anaerobic digestion of APL generated from birch bark at 500 °C resulted in poor methane production, probably due to the high phenolics concentration (24 g/kg total phenolics) [19]. Biochar addition was reported to increase methane production by adsorbing some inhibitors [19]. Zhou et al. (2019) used different APL pretreatments including overliming to reduce the toxicity of the APL derived from pyrolysis of corn stover under 500 °C [15]. The overliming method removed a majority of the toxic compounds and increased biogas production. Subsequently, acclimation increased the microbial tolerance to APL after overliming.
The objective of this study was to elucidate co-digestion behavior for semi-continuously fed anaerobic digesters treating synthetic primary sludge along with APLs derived from wastewater biosolids pyrolysis. It was hypothesized that the catalyzed APL would exhibit toxicity different from that of conventional APL. Additionally, it was hypothesized that acclimation of microorganisms would increase methane production in the long-term semi-continuous co-digestion of APL with synthetic primary sludge. Synthetic primary sludge was co-fed to simulate co-digestion operations that could occur at municipal water resource reclamation facilities that currently have primary sludge digestion and may add solids pyrolysis in the future. Co-digesters treating synthetic primary sludge were separately co-fed with raw (non-air-stripped) and air-stripped catalyzed and non-catalyzed APLs. APL air stripping was performed to reduce NH3-N concentration in APL to prevent NH3-N toxicity to anaerobic microorganisms. The effects of autocatalytic pyrolysis and air-stripping pretreatment on APL digestibility and anaerobic microbial community were investigated in this study. Additionally, a long-term (over 500 days) co-digestion study was conducted to investigate biomass acclimation to APL toxicity.

2. Materials and Methods

2.1. APL Production and APL NH3-N Air Stripping

Catalyzed and non-catalyzed APLs were produced by pyrolysis at 800 °C of commercially available, dried biosolids, derived from anaerobically digested primary sludge and raw waste activated sludge (Milorganite®) from the Jones Island Water Resource Recovery Facility (Milwaukee, Wisconsin) as described elsewhere [14]. Milorganite® is a commercially available soil conditioner and has a nutrient composition of 6% nitrogen (N), 4% phosphorus (P) and 2.5% total iron (Fe) [20,21]. In an effort to remove NH3-N that could inhibit methanogenesis, some catalyzed and non-catalyzed APL samples (30 mL) were aerated for 9 h at 2 L/min air flow (1 atm, 20 °C) to strip NH3-N [7]. Volatile constituents such as ethylbenzene and styrene were also removed during air stripping (Table S1) [13].

2.2. Short-Term Semi-Continuous Anaerobic Digestion

Anaerobic digesters were inoculated with anaerobic biomass from municipal digesters at the Fox River Water Pollution Control Center (Brookfield, WI). Digesters were 160 mL serum bottles with 50 mL working volume and were capped with butyl rubber stoppers. Five sets of triplicate digesters were operated at a 10-day solid retention time (SRT); each set was fed daily with synthetic primary sludge at a solids loading rate of 1.3 gVS/Lr-d (VS = volatile solids, Lr = liter of reactor) corresponding to an organic loading rate (OLR) of 2 gCOD/Lr-d. One digester set was a control receiving synthetic sludge and no APL. The remaining four digester sets were co-fed catalyzed APL, catalyzed air-stripped APL, non-catalyzed APL and non-catalyzed air-stripped APL, respectively, at an OLR of 0.05 gCOD/Lr-d along with synthetic primary sludge. The APL OLR of 0.05 gCOD/Lr-d was employed since it did not inhibit methanogenesis in a previous study which determined APL IC50 values (i.e., APL concentration that inhibited methane production rate by 50%) of 0.3–2.3 gCOD/L for the various APLs used in this study [13]. Digesters were incubated at 35 °C and mixed on a shaker table at 150 rpm. All five digester sets were operated for 30 days to reach quasi steady state operation, which is determined as operation for at least 3 SRTs (i.e., 30 days) under consistent conditions when digester performance such as daily biogas production rate or effluent COD concentration variations are less than 10%. The digesters were then continued for 15 more days.

2.3. Long-Term Semi-Continuous Anaerobic Digestion

A long-term co-digestion study was carried out for 523 days in 160 mL serum bottle digesters with 50 mL working volume capped with butyl rubber stoppers. Two sets of triplicate digesters were seeded with anaerobic biomass from municipal digesters at the Fox River Water Pollution Control Center (Brookfield, WI). Digesters were operated at 1.3 gVS/Lr-d (2 gCOD/Lr-d OLR) from the synthetic primary sludge and at a 10-day SRT. One set received synthetic primary sludge and no APL (control), whereas the other set was co-fed non-catalyzed APL and synthetic primary sludge. The initial APL OLR was 0.05 gCOD/Lr-d and was increased over time in a stepwise progression to 0.5 gCOD/Lr-d.

2.4. Synthetic Primary Sludge

Synthetic primary sludge was a mix of ground, dry dog food (Nutro Natural Choice, Franklin, TN, USA) and basal nutrient media with the following characteristics: 1.2 gCOD/L and 0.78 gVS/L and 0.94 gTS/L (TS = total solids). The dry dog food has a mix of proteins (26%) and fats (12%) and previously has been used as consistent synthetic primary sludge in anaerobic digestion testing since the inherent variability of actual primary sludge causes inconsistent operations [22,23,24]. Basal nutrient media was a modified version of media described by Speece (2008) [25]. The nutrient media contained the following (mg/L): MgSO4.7H2O (400); KCl (400); CaCl2.2H2O (50); (NH4)2.HPO4 (80); FeCl2.4H2O (10); CoCl2.6H2O (1); KI (10); (NaPO3)6 (10); Na2S.9H2O (300); the salts MnCl2.4H2O, NH4VO3, CuCl2.2H2O, ZnCl2, AlCl3.6H2O, Na2MoO4.2H2O, H3BO3, NiCl2.6H2O, NaWO4.2H2O, and Na2SeO3 (each at 0.5); yeast extract (10); Cysteine (10); and NaHCO3 (6000).

2.5. Analytical Methods

Biogas production was measured daily using a 150 mL wetted-barrel glass syringe. Biogas methane concentration was measured by gas chromatography (GC System 7890A, Agilent Technologies, Irving, TX, USA) using a thermal conductivity detector (TCD). Volatile fatty acids (VFA) concentrations were measured by gas chromatography (GC System 7890A, Agilent Technologies, Irving, TX, USA) using a flame ionization detector (FID). The APLs were analyzed by GC-FID using a 1701 capillary column to quantify hydrocarbons [13]. The pH was measured using a pH probe and meter (Orion 4 Star, Thermo, Waltham, MA, USA). Soluble COD (SCOD) was measured by filtering the sample through a 0.45 μm pore size membrane syringe filter and determining the filtrate COD by standard methods [26]. Total COD, TS, VS, total suspended solids (TSS) and volatile suspended solids (VSS) concentrations were determined by standard methods [26].

2.6. DNA Extraction and Sequencing

Digester biomass samples were analyzed using Illumina sequencing. Approximately 1.8 mL of biomass was removed on day 15 before quasi steady state was achieved and on day 45 after quasi steady state was achieved. Samples were stored at −20 °C prior to DNA extraction. DNA was extracted using a commercial kit (DNeasy PowerLyzer PowerSoil Kit, Qiagen, USA) according to the manufacturer instructions. Sequencing was performed by a commercial company (Molecular Research, LP, Shallowater, TX, USA) using the Illumina MiSeq v3 300 base pair sequencing platform (Illumina, San Diego, CA, USA). Universal primers, 515F and 806R were used for PCR amplification to target the V4 variable region of the 16S rRNA gene as described elsewhere [27]. Raw un-joined sequence data were quality filtered and sequences were depleted from barcodes and primers. Subsequently, sequences with ambiguous base reads, those with less than 200 base pairs, and those with homopolymer sequences of six base pairs or longer were removed. Sequences were denoised and clustered in operational taxonomic units (OTU) using 97% similarity. Each taxonomic unit was compiled into taxonomic counts and then classified using BLASTn against a curated database derived from GreenGenes, Ribosomal Database Project II (RDPII) and National Center for Biotechnology Information (NCBI).

2.7. Statistical Analysis

Statistical analyses including average, standard deviation, normality test and two-sample student’s t-test calculations were performed using Microsoft Excel 2015 and Minitab 18.1.0. For microbial community analysis, dual hierarchical clustering (using R command hclust and heatmap) and non-metric multidimensional scaling (nMDS) using the VEGAN package were performed using custom R scripts [28]. The nMDS clustering was performed based on a 95% confidence interval. Dual hierarchical clustering and heatmap construction were performed using the seven dominant archaeal and 50 dominant bacterial OTUs based on relative abundance values. Analysis was performed to identify OTU abundance value differences (p < 0.001) between control, catalyzed APL and non-catalyzed APL digesters using the negative binomial test as implemented in the DESeq2 package [29,30]. The 223 major archaeal and bacterial OTUs with relative abundance >0.1% in at least three samples were used in DEseq2 analysis. Shannon diversity index values (H) and Evenness index (E) were determined based on Illumina sequence results as described by Falk et al. (2009) [31].

3. Results and Discussion

3.1. APL Composition

APL from autocatalytic pyrolysis (catalyzed APL) contained 84% lower COD and significantly reduced VFA concentrations compared to non-catalytic APL before air stripping (Table 1). However, the NH3-N concentration in APL after autocatalysis was 14% greater than that of non-catalytic APL (Table 1); the NH3-N concentration increase was ostensibly due to the more complete reduction of nitrogenous compounds to NH3-N during autocatalysis. Compounds detected by the GC-FID method in non-catalyzed APL included 23 hydrocarbons, phenols and methoxy-substituted aromatic constituents, whereas only four constituents were detected in the catalyzed APL (Table S1). Only 0.74% (w/w) of the total organic content in the catalyzed APL was detected, whereas about 5% (w/w) in non-catalyzed APLs was identified (Table S1). Therefore, there are other organics in the APL that remained undetected. The majority of the compounds that were identified in non-catalyzed APL were aromatic and nitrogen-containing organics including substituted phenols and benzenes (Table S1).
After air stripping, NH3-N concentration was reduced by 79% in non-catalyzed APL and 67% in catalyzed APL (Table 1). Air stripping did not have a significant effect on the COD and VFA concentrations of non-catalyzed APL (p > 0.05, n = 6); however, COD concentration in catalyzed APL decreased by approximately 50% after air stripping (Table 1). Styrene and ethylbenzene were removed from catalyzed APL by air stripping (Table S1).

3.2. Short-Term Semi-Continuous Anaerobic Digestion

During short-term digestion study (<50 days), catalyzed APL fed at the loadings employed substantially inhibited methane production regardless of whether or not the APL was pretreated by air stripping. During quasi steady state operation (days 30–45), COD removals in digesters fed catalyzed APL with and without air stripping were 47 ± 4% and 52 ± 7%, respectively, whereas COD removal in control digesters was 76 ± 4%. COD removal in digesters fed non-catalyzed APL with and without air stripping was 73 ± 3%. The methane production was significantly lower in digesters that received catalyzed APL compared to all other digesters (p < 0.05, n = 45) (Figure 1A). Pretreatment of catalyzed and non-catalyzed APLs using air stripping did not influence the extent of inhibition, methane production, effluent COD or effluent SCOD concentrations of the co-digesters (p > 0.05, n = 3) (Table 2).
Despite detecting fewer phenolic compounds in catalyzed APL compared to non-catalyzed APL, SCOD and VFAs accumulated in the digesters fed catalyzed APL and methane production was inhibited (Figure 1). It was apparent from digester methane production, COD, SCOD and VFA results that catalyzed APL exerted a higher toxicity to digester taxa than non-catalyzed APL. Both raw and air-stripped non-catalyzed APL did not inhibit methane production during co-digestion. However, only a maximum of 1 mL of methane per day was expected based on stoichiometry from the total conversion of the APL to methane at the loading rate employed. Therefore, the APL loading employed was too low to discern its conversion to methane but was necessary to preclude toxicity to the unacclimated anaerobic biomass. Despite the increased OLR due to APL addition, digester methane production from the digesters co-fed air-stripped and raw non-catalyzed APL was not discernably greater than that of the control digesters fed only synthetic primary sludge (p > 0.05, n = 45) (Figure 1A). During quasi steady state operation from days 30 to 45, the control digesters produced 38.8 ± 1.8 mL methane per day (average ± standard deviation) and digesters fed non-catalyzed APL with and without air stripping produced 40.4 ± 2.0 and 38.0 ± 2.7 mL methane per day, respectively. The control digesters and digesters fed air-stripped and raw non-catalyzed APL also exhibited similar COD and SCOD reduction (p > 0.05, n = 3) (Figure 1B) (Table 2).
The observed digester pH ranged from 7.2 to 7.5 during the quasi steady state period in all digesters. The effluent total VFA concentrations in control digesters and digesters fed non-catalyzed APLs were below 60 mg/L as acetic acid (Table 2). However, the digesters that received air-stripped and raw catalyzed APL showed the highest quasi steady state effluent total VFA concentrations of >2 g/L, with a majority of VFAs produced as acetic acid (Table 2). Short-term co-digestion of catalyzed APL, regardless of NH3-N reduction from air stripping pretreatment, substantially reduced methane production and COD removal compared to control digesters receiving no APL and co-digesters receiving non-catalyzed APL. Counter to the predicted reduction in inhibition, the catalyzed APL used in the current study was an inhibitory co-substrate. Therefore, investigating the microbial community composition shifts in these short-term co-digesters is vitally important for understanding anaerobic treatment of APL.

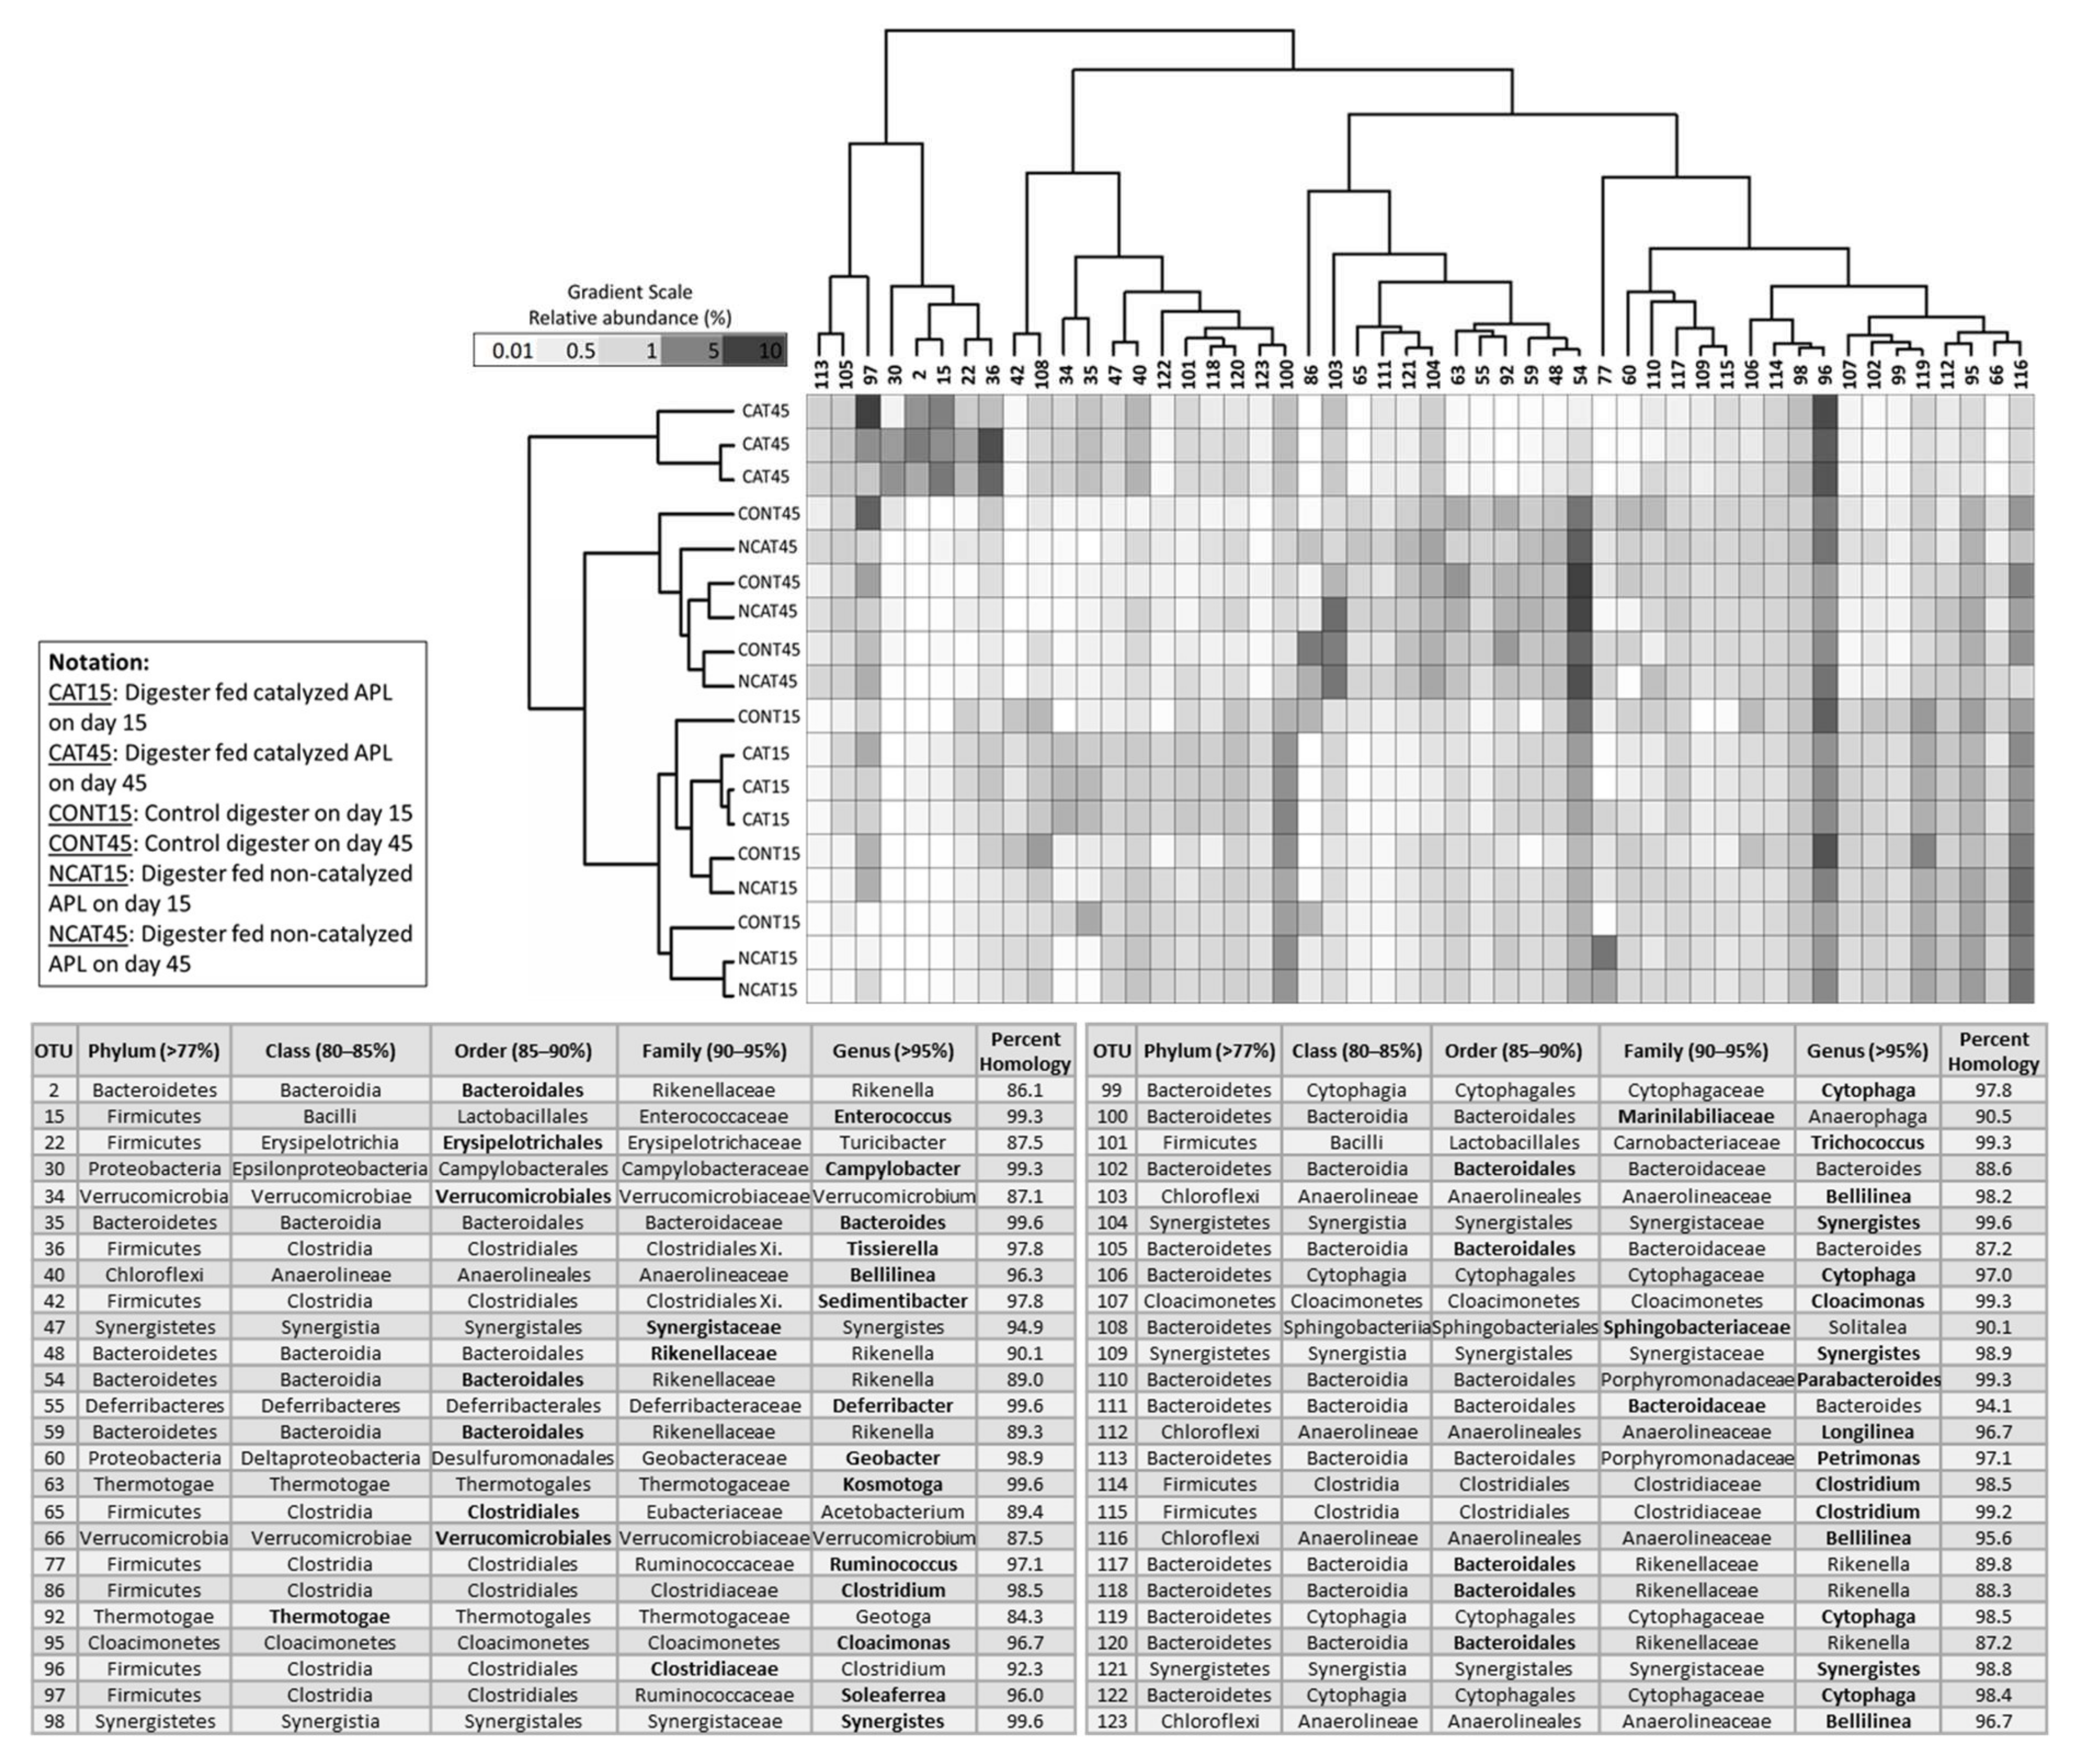
3.3. Short-Term Digestion Microbial Community Analysis

Illumina sequencing yielded over 1 million sequence reads, with 58,730 ± 9924 reads per digester sample. Based on 97% similarity, 5073 microbial OTUs were observed with an average of 1853 ± 480 OTUs per digester. Previous studies have described that higher microbial diversity and evenness are associated with digesters that perform well under transient conditions, whereas inhibited digesters have lower diversity and evenness [32,33]. However, this was not observed in this study as Shannon diversity (H) values were 4.7–5.2 and evenness (E) values were 0.7–0.8 among the inhibited and uninhibited digesters on days 15 and 45, demonstrating no statistical difference between inhibited and uninhibited digesters (p > 0.05, n = 3).

3.3.1. Archaea Community

A total of 79 archaeal OTUs were identified among all digesters with an average relative abundance of 3.2 ± 1.5% of the total microbial community in each digester. Exposure to catalyzed APL for 45 days altered the archaeal community compared to control digester communities, whereas the archaeal communities in the uninhibited digesters that maintained >70% COD removal (control digesters and digesters fed non-catalyzed APL) were more similar (Figure S1).
The 7 dominant archaeal OTUs accounted for 94 ± 2.6% of total archaeal community relative abundance (Figure 2). Of the seven dominant archaeal OTUs, two were classified as the genus Methanosaeta (OTUs 56 and 71), one Methanobacterium (OTU 128), one Thermogymnomonas (OTU 125) and one as family Methanobrevibacter (OTU 124); the other two OTUs were unknown archaea (OTU 126 and 127) (Figure 2).
The conventional and autocatalytic pyrolysis conditions under which APL was produced affected the archaeal communities during anaerobic co-digestion. All digesters on day 15 had Methanosaeta (OTU 56) as the dominant archaeal OTU with more than 70% of total archaeal community relative abundance (Figure 2). On day 45, Methanosaeta (OTU 56) was still dominant in the uninhibited digesters. The effluent acetic acid concentrations in the uninhibited digesters were very low (<2 mg/L after day 30), ostensibly due to the activity of the dominant acetoclastic Methanosaeta (OTU 56 and 71) (Table 2). However, its relative abundance decreased to less than 30% after day 15 in digesters fed catalyzed APL (Figure 2). This was also indicated by DESeq2 analysis that showed decreased abundance (p < 0.001) of two Methanosaeta genera (OTU 56 and 71) in digesters fed catalyzed APL compared to control digesters on day 45 (Figure S3). Additionally, abundance of an unknown archaeal OTU (127) increased in the inhibited digesters (Figure 2).

3.3.2. Bacteria Community

A total of 4994 bacterial OTUs were observed across all digesters, with an average of 1823 ± 469 bacterial OTUs in each digester. There were 50 dominant bacterial OTUs having the highest relative abundance values that together represented 63.1 ± 2.3% of the total microbial community abundance. Among these dominant OTUs, Clostridiaceae (OTU 96) and Ruminococcaceae (OTU 97) were most dominant in all digesters on both days 15 and 45 (Figure 3). Both are strictly anaerobic, fermentative bacteria; Clostridiaceae produces organic acids and alcohols from carbohydrates or peptones and Ruminococcaceae generates organic acids and H2 as end products [34,35].
Similar to results observed for archaeal community, the pyrolysis conditions under which APL was produced affected the bacterial communities. On day 15, the bacterial communities in all digesters were similar, as shown by 95% confidence ellipses in the nMDS plot (Figure S2). On day 45, however, the bacterial community in digesters fed inhibitory APL (i.e., catalyzed APL) was significantly different from the other digester communities (Figure S2). The difference was also observed among the dominant bacterial OTUs, which were different in digesters fed catalyzed APL for 45 days compared to those in uninhibited digesters (Figure 3).
In uninhibited digesters, the dominant bacterial OTUs were Bacteroidales (OTU 54 and 59), Kosmotoga (OTU 63), and Thermotogae (OTU 92) (Figure 3). Kosmotoga and Thermotogae belong to the phylum Thermotogae, which are thermophilic, strict anaerobic bacteria, fermenting a variety of carbohydrates, organic acids, alcohols and proteinaceous substrates [36]. DESeq2 analysis on control versus digesters fed non-catalyzed APL on day 45 revealed the relative abundance of only three bacterial OTUs (family Ruminococcaceae and genera Leptospira and Pelospora) decreased by more than 2-fold in digesters fed non-catalyzed APL compared to control digesters, thus indicating the high similarity between the bacterial community in the control digesters and digesters fed non-catalyzed APL.
In the inhibited digesters, the relative abundance of Bacteroidales (OTU 2), Enterococcus (OTU 15), Erysipelotrichales (OTU 22), Campylobacter (OTU 30) and Tissierrella (OTU 36) increased to more than 65%, whereas they remained less than 40% in uninhibited digesters (Figure 3). DESeq2 analysis indicated a significant increase (p < 0.001) in the relative abundance of these five OTUs in the inhibited digesters fed catalyzed APL as compared to the control digesters (Figure S3). Among the five OTUs that were favored in inhibited digesters, Enterococcus is a facultative anaerobic bacterium that requires several amino acids, purine and pyrimidine bases for growth [35]. Pyrimidines were detected in relatively high concentration in catalyzed APL in a previous study [13]. Bacteroidales, Erysipelotrichales, Campylobacter and Tissierella are fermenters that can use carbohydrates, proteins or amino acids to produce organic acids [37,38,39,40,41,42].
Syntrophomonadaceae and Synergistaceae were the dominant families of Syntrophic bacteria during quasi steady state in all digesters. On day 45, Syntrophomonadaceae contributed to 2 ± 0.5% and Synergistaceae contributed to 8 ± 1.2% of the total microbial relative abundance. Syntrophomonadaceae and Synergistaceae are known to utilize fatty acids and amino acids, respectively, in syntrophic association with H2-consuming methanogens [43,44]. DESeq2 analysis identified two syntrophic bacterial OTUs, Syntrophomonadaceae (OTU 11) and Synergistaceae (OTU 47), whose relative abundance were statistically higher (p < 0.001) in inhibited digesters fed catalyzed APL as compared to the control digesters (Figure S3). Syntrophomonadaceae (OTU 11) contributed 32% of the total relative abundance of family Syntrophomonadaceae in digesters fed catalyzed APL, but only contributed to 0.4% and 1% of the Syntrophomonadaceae family in the control digesters and the digesters fed non-catalyzed APL, respectively. Synergistaceae (OTU 47), which was also among the first 50 dominant bacterial OTUs observed among all digesters, contributed to 14% of total relative abundance of the family Synergistaceae in digesters fed catalyzed APL, but only contributed to 4% of the total relative abundance of the family Synergistaceae in uninhibited digesters. Along with the archaeal community structure, the above results indicate that continuous addition of catalyzed APL resulted in a significant shift in the anaerobic digester hydrolytic/fermentative and syntrophic bacteria community.

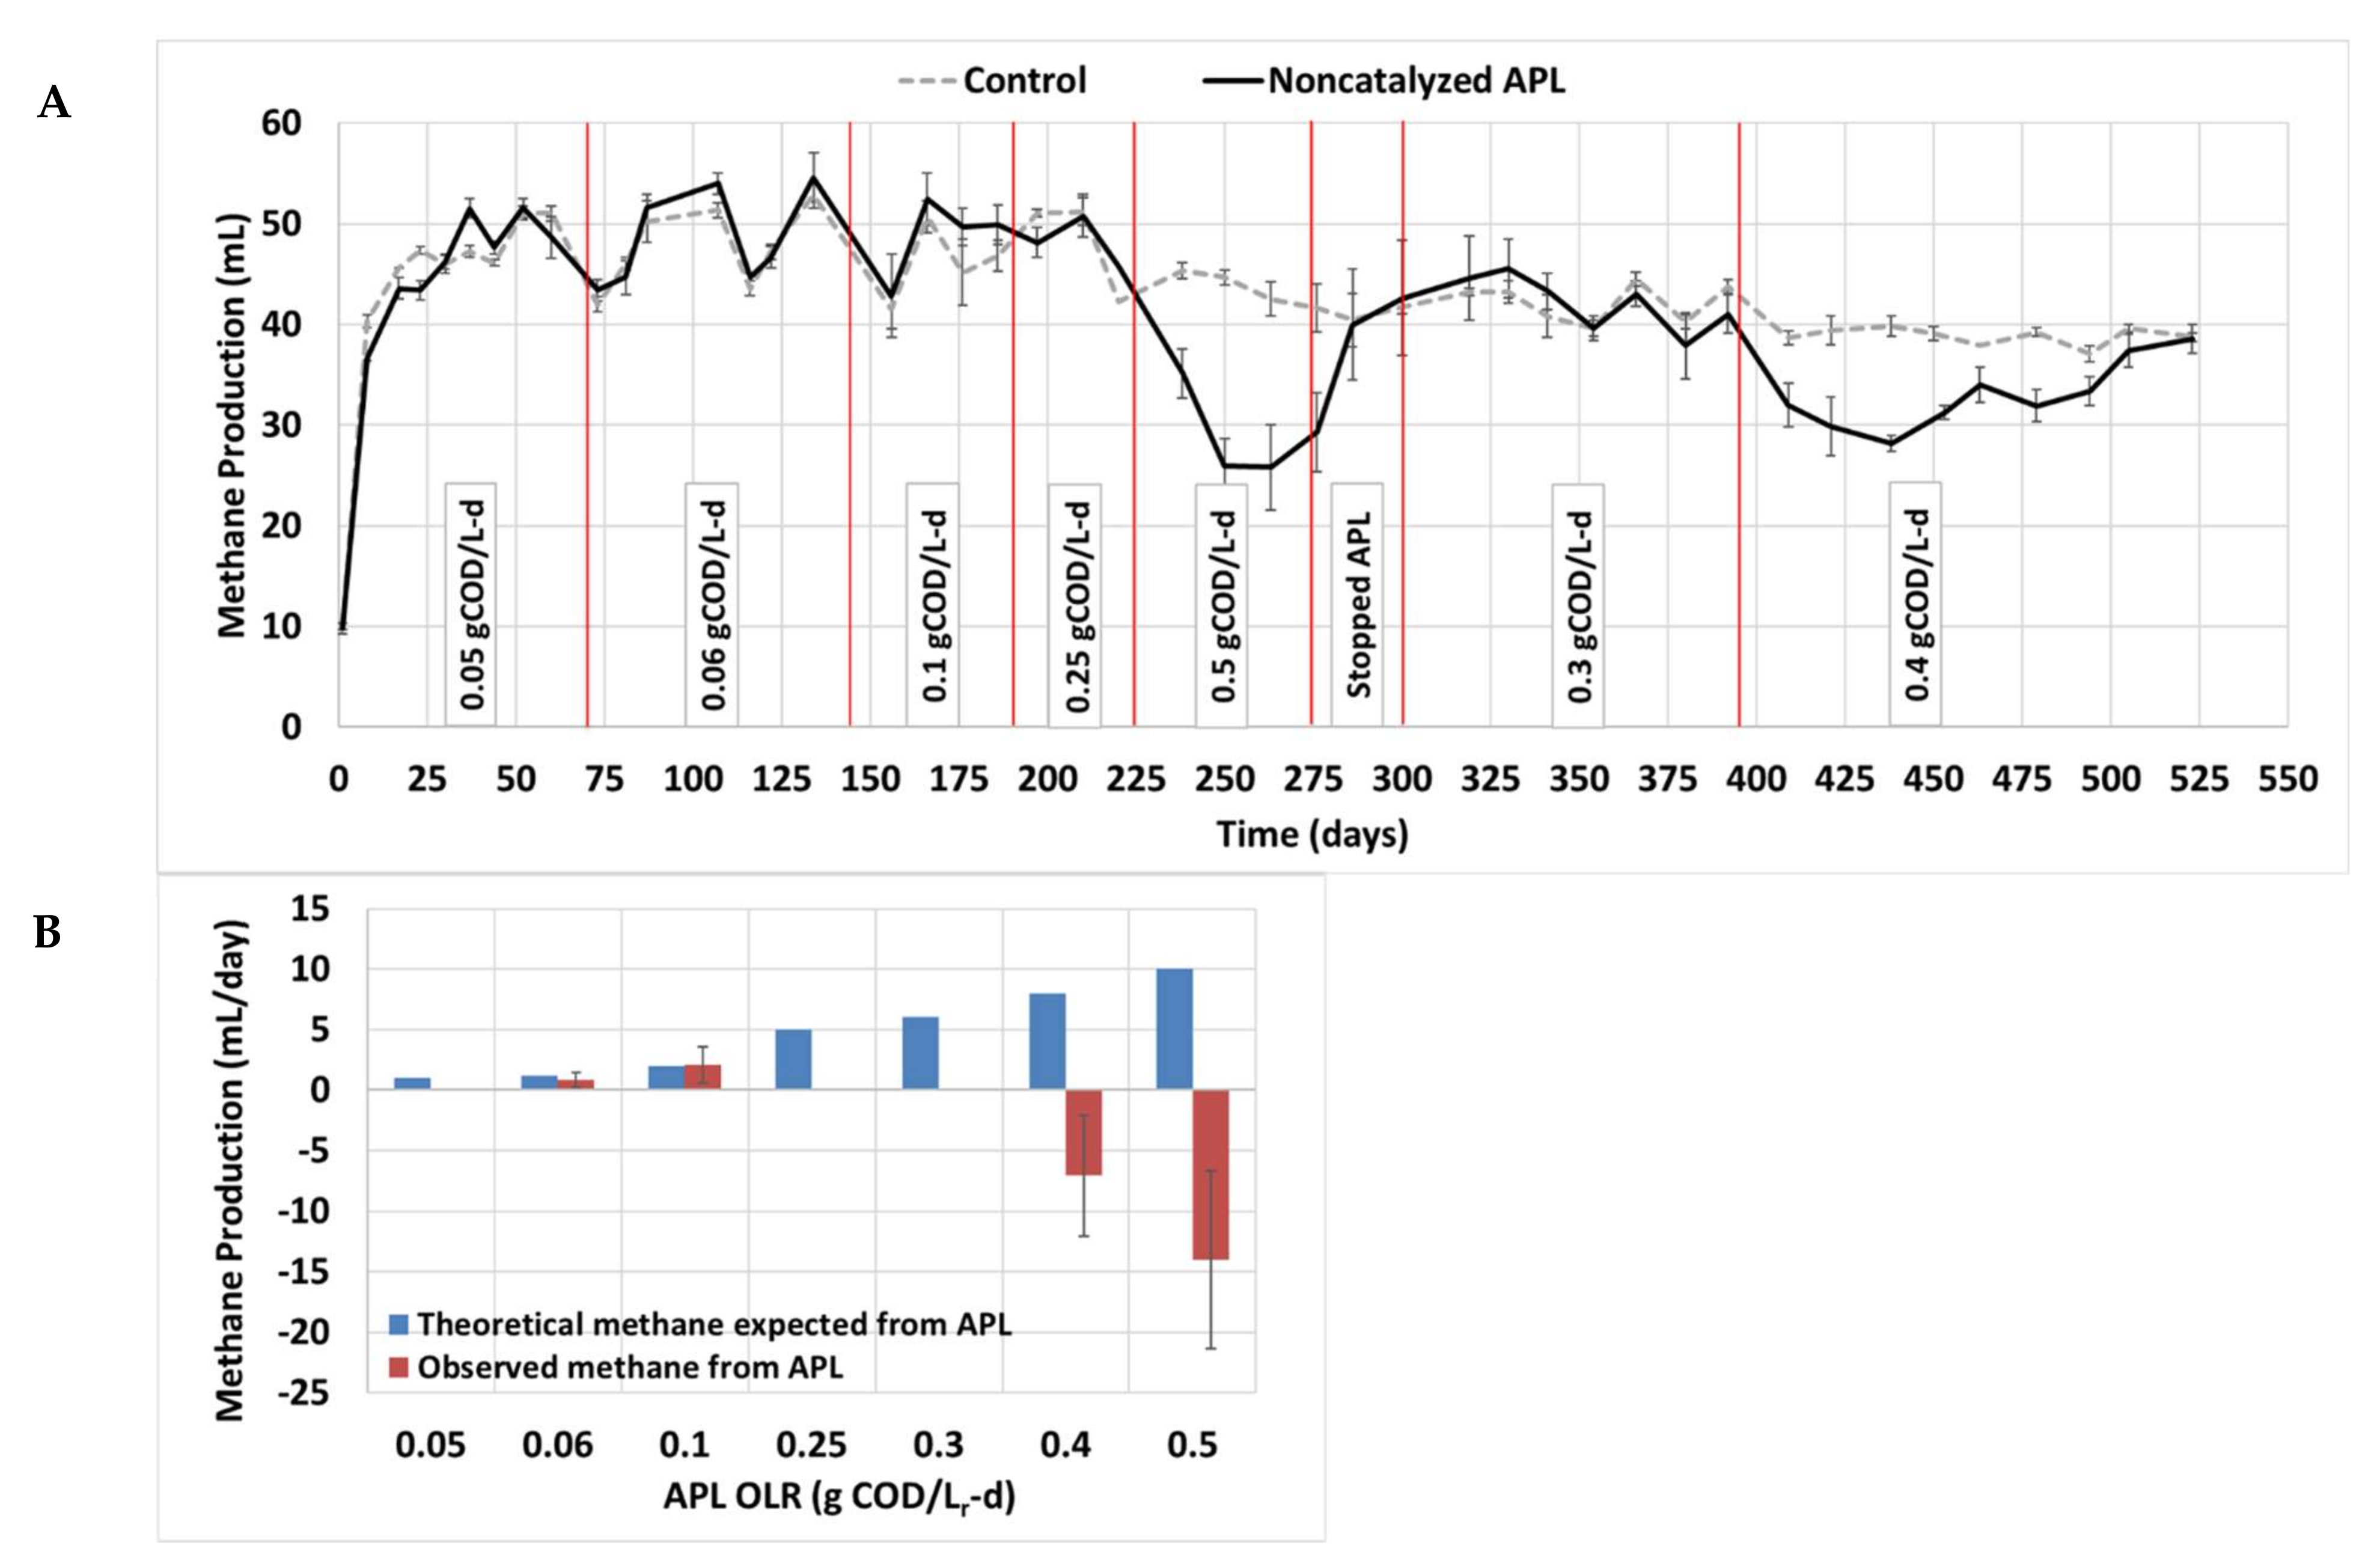
3.4. Long-Term Semi-Continuous Anaerobic Digestion

During long-term co-digestion (>500 days), the microorganisms were exposed to incremental non-catalyzed APL loadings in order to acclimate to the toxic compounds and show tolerance. At low APL OLRs of 0.06 and 0.1 gCOD/Lr-d, the expected theoretical stoichiometric methane production from APL COD was observed; however, higher OLRs inhibited methane production ostensibly due to APL toxicity that could be attributed to the phenolics, which are well-known toxicants in the APL [11,15,18,19] (Figure 4B). Phenolic compounds exert toxicity by disrupting cell membrane proteins and permeability, resulting in inactivation of enzymatic systems and damage to intracellular components [15,45]. Corresponding to methane production results, digestate COD, SCOD and VFA concentrations increased in inhibited co-digesters at higher APL OLRs (Figure S4).
During the first 67 days operating at 0.05 gCOD/Lr-d APL, no statistical difference was observed between control digesters and digesters fed non-catalyzed APL (p > 0.05, n = 201) (Figure 4A), and no excess methane was observed from APL addition (Figure 4B). This is probably due to the very low APL OLR and low associated methane production expected (1 mL/d).
When the APL OLR was increased to 0.06 and 0.1 gCOD/Lr-d, methane production from APL was observed (Figure 4). The average daily methane production from co-digesters receiving non-catalyzed APL was statistically higher than that of the control digesters under both 0.06 and 0.1 gCOD/Lr-d (p = 0.01, n = 207 and p = 3×10⁻¹², n = 135, respectively) (Figure 4B). Previously, an APL digester loading rate higher than 0.05 gCOD/Lr-d for non-catalyzed APL was reported as not sustainable due to toxicity [13], but after acclimation, higher sustainable OLR values were observed in the current study.
Increasing the APL OLR to 0.25 and 0.5 gCOD/Lr-d resulted in either no methane production from APL or inhibition of the co-digester methane production (Figure 4A, 4B). To avoid permanent inhibition, the APL OLR was stopped on day 275 and the co-digester methane production recovered in 25 days. After recovery, co-digesters were fed APL at 0.3 gCOD/Lr-d on day 301 and were continued for 94 days, where no statistical difference was observed between methane production from co-digesters versus control digesters (p > 0.05, n = 282). Finally, the APL OLR was raised to 0.4 gCOD/Lr-d, which initially resulted in inhibition of methane production but started to show acclimation, where in the last six days, no statistical difference in methane production was observed between the control digesters and co-digesters fed non-catalyzed APL (p > 0.05, n = 18) (Figure 4A).
Overall, results from the long-term co-digestion of non-catalyzed APL demonstrate the viability of anaerobic co-digestion of conventional APL and the capability of microorganisms to acclimate to APL. However, acclimation can take a very long time and may be inefficient in a real wastewater treatment application. One strategy to overcome this is to use seed microorganisms that are already acclimated to similar compounds present in the APL, such as biomass from anerobic digesters treating phenolic wastewater [45,46].

3.5. Inhibition by APL and Future Considerations

Similar to the results observed for non-catalyzed APL from biosolids, the presence of phenolic compounds in APL derived from different pyrolysis conditions has previously been reported to inhibit anaerobic digestion. In a recent study on anaerobic digestion of APL generated from birch bark at 500 °C, a high concentration of phenolics (24 g/kg total phenolics) observed in the APL was mentioned to be a major microbial inhibitor [19]. Yu et al. (2020) employed different dilutions of APL in anaerobic digestion and observed that an elevated concentration of phenolics in less diluted APL resulted in anaerobic digester failure [18]. Zhou et al. (2019) performed anaerobic digestion of APL derived from pyrolysis of corn stover at 500 °C, and phenols were reported as potential major toxicants in raw APL [15].
Co-digestion of non-catalyzed APL produced through the conventional pyrolysis process showed no inhibition during anaerobic co-digestion at loading rates of ≤0.1 gCOD/Lr-d. Despite detecting fewer phenolic compounds in catalyzed APL, it exerted greater inhibition during co-digestion with synthetic primary sludge. The catalyzed APL had a COD concentration of 33 g/L; however, the organic compounds identified by GC-FID only contributed a small fraction of this COD (0.74% w/w). Catalytic pyrolysis can be advantageous over conventional pyrolysis to increase py-gas production; however, the remaining organic compounds in the catalytic APL undetected by GC-FID are ostensibly more toxic or recalcitrant to methanogenic processes and, therefore, complicate the management of APL by anaerobic digestion.
Utilizing acclimated biomass to help improve anaerobic digestion of APL is a strategy to reduce the toxic effect of APL [15,19]. Methanogenic cultures already exposed to similar constituents as in APL, such as biomass in anaerobic digesters treating phenolic wastewater, could be a beneficial seed biomass to reduce the long acclimation period required [45,46]. Additionally, pretreatment of toxic phenolic compounds via partial oxidation using chemical oxidation processes such as ozonation may be another promising strategy to transform recalcitrant APL organics into more easily degradable and less toxic compounds [47]. For example, Xu et al. (2011) found that aldehydes and alcohols in bio-oil were oxidized to more easily degradable carboxylic acids after bio-oil was treated with ozone. Recalcitrant organics including nitrogenous aromatics and polyaromatics were also ozonated and organic acids were produced that were more susceptible to biological degradability [47]. Ozonation of olive mill waste removed phenolic inhibitors and methane yield increased by more than 16% [48]. The feasible application of anaerobic co-digestion of APL for energy recovery and a better assessment of its environmental and economic impacts require further investigation [49].

4. Conclusions

APL derived from wastewater solids pyrolysis has a high COD content which offers potential to be recovered as methane from anaerobic digesters; however, some APL compounds are inhibitory to anaerobic microbes. Results of this study show that, at non-catalytic APL OLRs of 0.06 and 0.1 gCOD/Lr-d, quasi steady state methane production from APL is sustainable in co-digesters also fed synthetic primary sludge. However, at lower APL OLRs, no APL methane production was discernable, and, at higher APL OLRs, methanogenesis was inhibited. Catalyzed APL with lower COD and fewer detectable phenolic compounds inhibited methane production more than non-catalyzed APL. Potential inhibitory compounds present in catalyzed APL undetected by current methods ostensibly caused the observed toxicity. Acetoclastic Methanosaeta was significantly inhibited in digesters fed catalyzed APL but remained dominant in uninhibited digesters. The conditions under which pyrolysis is conducted substantially affect APL biodegradability and the resulting microbial community in anaerobic digesters fed APL. It is apparent that pyrolysis byproduct utilization is an important consideration when selecting biosolids pyrolysis scenarios. In the future, additional strategies such as using specific, acclimated biomass, APL pretreatment or addition of biochar to the digester may improve APL conversion to biogas containing methane for renewable energy.

Supplementary Materials

The following data are available online at https://www.mdpi.com/2071-1050/12/8/3441/s1: Figure S1: archaea nMDS plot; Figure S2: bacteria nMDS plot; Figure S3: DESeq2 result; Figure S4: long-term co-digestion functional data; and Table S1: APLs organic constituents quantified by GC-FID analysis.

Author Contributions

Experiments performance, S.S.; data analysis, S.S.; writing—original draft, S.S.; supervision, K.V.; writing—review and editing, K.V. and D.Z.; experiment design help, N.B.; data analysis help, N.B. and K.V.; research planning, D.Z.; methodology, D.Z.; research supervision, D.Z. All authors have read and agreed to the published version of the manuscript.

Funding

This research received no external funding.

Acknowledgments

The authors thank Mike Dollhopf (Laboratory manager at Water Quality Center, Marquette University, Milwaukee, USA) for his laboratory contributions and Dr. Zhongzhe Liu (Assistant Professor at the California State University-Bakersfield, USA) for providing the aqueous pyrolysis liquid.

Conflicts of Interest

The authors declare no conflict of interest.

References

  1. Liu, Z.; Singer, S.; Tong, Y.; Kimbell, L.; Anderson, E.; Hughes, M.; Zitomer, D.; McNamara, P. Characteristics and applications of biochars derived from wastewater solids. Renew. Sustain. Energy Rev. 2018, 90, 650–664. [Google Scholar] [CrossRef]
  2. Tsai, W.T.; Lee, M.K.; Chang, J.H.; Su, T.Y.; Chang, Y.M. Characterization of bio-oil from induction-heating pyrolysis of food-processing sewage sludges using chromatographic analysis. Bioresour. Technol. 2009, 100, 2650–2654. [Google Scholar] [CrossRef] [PubMed]
  3. Ross, J.J.; Zitomer, D.H.; Miller, T.R.; Weirich, C.A.; McNamara, P.J. Emerging investigators series: Pyrolysis removes common microconstituents triclocarban, triclosan, and nonylphenol from biosolids. Environ. Sci. Water Res. Technol. 2016, 2, 282–289. [Google Scholar] [CrossRef] [Green Version]
  4. Kimbell, L.K.; Kappell, A.D.; McNamara, P.J. Effect of pyrolysis on the removal of antibiotic resistance genes and class I integrons from municipal wastewater biosolids. Environ. Sci. Water Res. Technol. 2018, 4, 1807–1818. [Google Scholar] [CrossRef] [Green Version]
  5. McNamara, P.J.; Koch, J.D.; Liu, Z.; Zitomer, D.H. Pyrolysis of Dried Wastewater Biosolids Can Be Energy Positive. Water Environ. Res. 2016, 88, 804–810. [Google Scholar] [CrossRef] [Green Version]
  6. Fonts, I.; Gea, G.; Azuara, M.; Ábrego, J.; Arauzo, J. Sewage sludge pyrolysis for liquid production: A review. Renew. Sustain. Energy Rev. 2012, 16, 2781–2805. [Google Scholar] [CrossRef]
  7. Seyedi, S. Anaerobic Co-digestion of Aqueous Liquid from Biosolids Pyrolysis. Master’s Thesis, Marquette University, Milwaukee, WI, USA, 2018. [Google Scholar]
  8. Liu, Z.; Mayer, B.K.; Venkiteshwaran, K.; Seyedi, S.; Raju, A.S.K.; Zitomer, D.; McNamara, P.J. The state of technologies and research for energy recovery from municipal wastewater sludge and biosolids. Curr. Opin. Environ. Sci. Health 2020, 14, 31–36. [Google Scholar] [CrossRef]
  9. Park, E.S.; Kang, B.S.; Kim, J.S. Recovery of oils with high caloric value and low contaminant content by pyrolysis of digested and dried sewage sludge containing polymer flocculants. Energy Fuels 2008, 22, 1335–1340. [Google Scholar] [CrossRef]
  10. Hübner, T.; Mumme, J. Integration of pyrolysis and anaerobic digestion–Use of aqueous liquor from digestate pyrolysis for biogas production. Bioresour. Technol. 2015, 183, 86–92. [Google Scholar] [CrossRef]
  11. Torri, C.; Fabbri, D. Biochar enables anaerobic digestion of aqueous phase from intermediate pyrolysis of biomass. Bioresour. Technol. 2014, 172, 335–341. [Google Scholar] [CrossRef]
  12. Li, H.; Xu, Q.; Xue, H.; Yan, Y. Catalytic reforming of the aqueous phase derived from fast-pyrolysis of biomass. Renew. Energy 2009, 34, 2872–2877. [Google Scholar] [CrossRef]
  13. Seyedi, S.; Venkiteshwaran, K.; Zitomer, D. Toxicity of Various Pyrolysis Liquids from Biosolids on Methane Production Yield. Front. Energy Res. 2019, 7, 1–12. [Google Scholar] [CrossRef]
  14. Liu, Z.; McNamara, P.; Zitomer, D. Autocatalytic Pyrolysis of Wastewater Biosolids for Product Upgrading. Environ. Sci. Technol. 2017, 51, 9808–9816. [Google Scholar] [CrossRef] [PubMed] [Green Version]
  15. Zhou, H.; Brown, R.C.; Wen, Z. Anaerobic digestion of aqueous phase from pyrolysis of biomass: Reducing toxicity and improving microbial tolerance. Bioresour. Technol. 2019, 292, 121976. [Google Scholar] [CrossRef] [PubMed]
  16. Yenigün, O.; Demirel, B. Ammonia inhibition in anaerobic digestion: A review. Process Biochem. 2013, 48, 901–911. [Google Scholar] [CrossRef]
  17. Parry, D.L.; Lewis, F.M.; Vandenburgh, S.; Haug, R.T.; Amador, J.; Way, S.E.E. Pyrolysis of Dried Biosolids for Increased Biogas Production. Proc. Water Environ. Fed. 2012, 2012, 1128–1139. [Google Scholar] [CrossRef]
  18. Yu, X.; Zhang, C.; Qiu, L.; Yao, Y.; Sun, G.; Guo, X. Anaerobic digestion of swine manure using aqueous pyrolysis liquid as an additive. Renew. Energy 2020, 147, 2484–2493. [Google Scholar] [CrossRef]
  19. Wen, C.; Moreira, C.M.; Rehmann, L.; Berruti, F. Feasibility of anaerobic digestion as a treatment for the aqueous pyrolysis condensate (APC) of birch bark. Bioresour. Technol. 2020, 307, 123199. [Google Scholar] [CrossRef]
  20. Specifications: Milorganite. Available online: https://www.milorganite.com/professionals/product-information/specifications (accessed on 13 April 2020).
  21. Fertilizer Basics |Milorganite. Available online: https://www.milorganite.com/lawn-care/fertilizer-basics (accessed on 14 April 2020).
  22. Benn, N.; Zitomer, D. Pretreatment and Anaerobic Co-digestion of Selected PHB and PLA Bioplastics. Front. Environ. Sci. 2018, 5, 1–9. [Google Scholar] [CrossRef] [Green Version]
  23. Dang, Y.; Holmes, D.E.; Zhao, Z.; Woodard, T.L.; Zhang, Y.; Sun, D.; Wang, L.Y.; Nevin, K.P.; Lovley, D.R. Enhancing anaerobic digestion of complex organic waste with carbon-based conductive materials. Bioresour. Technol. 2016, 220, 516–522. [Google Scholar] [CrossRef]
  24. Venkiteshwaran, K.; Benn, N.; Seyedi, S.; Zitomer, D. Methane yield and lag correlate with bacterial community shift following bioplastic anaerobic co-digestion. Bioresour. Technol. Rep. 2019, 7, 100198. [Google Scholar] [CrossRef]
  25. Speece, R.E. Anaerobic Biotechnology and Odor/Corrosion Control for Municipalities and Industries; Archae Press: Nashville, TN, USA, 2008. [Google Scholar]
  26. American Public Health Association (APHA). Standard Methods for the Examination of Water and Wastewater; APHA: Washington DC, USA, 1998. [Google Scholar]
  27. Carey, D.E.; Zitomer, D.H.; Kappell, A.D.; Choi, M.J.; Hristova, K.R.; McNamara, P.J. Chronic exposure to triclosan sustains microbial community shifts and alters antibiotic resistance gene levels in anaerobic digesters. Environ. Sci. Process. Impacts 2016, 18, 1060–1067. [Google Scholar] [CrossRef] [PubMed] [Green Version]
  28. Venkiteshwaran, K.; Milferstedt, K.; Hamelin, J.; Zitomer, D.H. Anaerobic digester bioaugmentation influences quasi steady state performance and microbial community. Water Res. 2016, 104, 128–136. [Google Scholar] [CrossRef] [PubMed] [Green Version]
  29. Anders, S.; Huber, W. Differential expression analysis for sequence count data. Genome Biol. 2010, 11, R106. [Google Scholar] [CrossRef] [PubMed] [Green Version]
  30. Kappell, A.D.; Kimbell, L.K.; Seib, M.D.; Carey, D.E.; Choi, M.J.; Kalayil, T.; Fujimoto, M.; Zitomer, D.H.; McNamara, P.J. Removal of antibiotic resistance genes in an anaerobic membrane bioreactor treating primary clarifier effluent at 20 °C. Environ. Sci. Water Res. Technol. 2018, 4, 1783–1793. [Google Scholar] [CrossRef] [Green Version]
  31. Falk, M.W.; Song, K.G.; Matiasek, M.G.; Wuertz, S. Microbial community dynamics in replicate membrane bioreactors–Natural reproducible fluctuations. Water Res. 2009, 43, 842–852. [Google Scholar] [CrossRef] [PubMed]
  32. Carballa, M.; Regueiro, L.; Lema, J.M. Microbial management of anaerobic digestion: Exploiting the microbiome-functionality nexus. Curr. Opin. Biotechnol. 2015, 33, 103–111. [Google Scholar] [CrossRef]
  33. Xu, K.; Liu, H.; Chen, J. Effect of classic methanogenic inhibitors on the quantity and diversity of archaeal community and the reductive homoacetogenic activity during the process of anaerobic sludge digestion. Bioresour. Technol. 2010, 101, 2600–2607. [Google Scholar] [CrossRef]
  34. Shkoporov, A.N.; Chaplin, A.V.; Shcherbakova, V.A.; Suzina, N.E.; Kafarskaia, L.I.; Bozhenko, V.K.; Efimov, B.A. Ruthenibacterium lactatiformans gen. nov., sp. nov., an anaerobic, lactate-producing member of the family Ruminococcaceae isolated from human faeces. Int. J. Syst. Evol. Microbiol. 2016, 66, 3041–3049. [Google Scholar] [CrossRef] [Green Version]
  35. Vos, P.D.; Garrity, G.M.; Jones, D.; Krieg, N.R.; Ludwig, W.; Rainey, F.A.; Schleifer, K. Bergey’s Manual of Systematic Bacteriology—Vol 3: The Firmicutes; Springer-Verlag: New York, NY, USA, 2009; ISBN 9780387950419. [Google Scholar]
  36. L’Haridon, S.; Jiang, L.; Alain, K.; Chalopin, M.; Rouxel, O.; Beauverger, M.; Xu, H.; Shao, Z.; Jebbar, M. Kosmotoga pacifica sp. nov., a thermophilic chemoorganoheterotrophic bacterium isolated from an East Pacific hydrothermal sediment. Extremophiles 2014, 18, 81–88. [Google Scholar] [CrossRef] [Green Version]
  37. Su, X.L.; Tian, Q.; Zhang, J.; Yuan, X.Z.; Shi, X.S.; Guo, R.B.; Qiu, Y.L. Acetobacteroides hydrogenigenes gen. nov., Sp. nov., An anaerobic hydrogen-producing bacterium in the family Rikenellaceae isolated from a reed swamp. Int. J. Syst. Evol. Microbiol. 2014, 64, 2986–2991. [Google Scholar] [CrossRef] [PubMed]
  38. Bosshard, P.P.; Zbinden, R.; Altwegg, M. Novel anaerobic, Gram-positive bacterium. Int. J. Syst. Evol. Microbiol. 2002, 12, 1263–1266. [Google Scholar]
  39. O’Cuív, P.; Klaassens, E.S.; Durkin, A.S.; Harkins, D.M.; Foster, L.; McCorrison, J.; Torralba, M.; Nelson, K.E.; Morrison, M. Draft genome sequence of Turicibacter sanguinis PC909, isolated from human feces. J. Bacteriol. 2011, 193, 1288–1289. [Google Scholar]
  40. Verbarg, S.; Rheims, H.; Emus, S.; Frühling, A.; Kroppenstedt, R.M.; Stackebrandt, E.; Schumann, P. Erysipelothrix inopinata sp. nov., isolated in the course of sterile filtration of vegetable peptone broth, and description of Erysipelotrichaceae fam. nov. Int. J. Syst. Evol. Microbiol. 2004, 54, 221–225. [Google Scholar] [CrossRef] [PubMed]
  41. Vandamme, P.; De Ley, J. Proposal for a New Family, Campylobacteraceae. Int. J. Syst. Evol. Microbiol. 1991, 41, 451–455. [Google Scholar] [CrossRef]
  42. Collins, M.D.; Shah, H.N. Reclassification of Bacteroides praeacutus Tissier (Holdeman and Moore) in a New Genus, Tissierella, as Tissierella praeacuta. Int. J. Syst. Bacteriol. 1986, 36, 461–463. [Google Scholar] [CrossRef] [Green Version]
  43. Sieber, J.R.; Sims, D.R.; Han, C.; Kim, E.; Lykidis, A.; Lapidus, A.L.; McDonnald, E.; Rohlin, L.; Culley, D.E.; Gunsalus, R.; et al. The genome of Syntrophomonas wolfei: New insights into syntrophic metabolism and biohydrogen production. Environ. Microbiol. 2010, 12, 2289–2301. [Google Scholar] [CrossRef]
  44. Vartoukian, S.R.; Palmer, R.M.; Wade, W.G. The division “Synergistes. ” Anaerobe 2007, 13, 99–106. [Google Scholar] [CrossRef]
  45. Madigou, C.; Poirier, S.; Bureau, C.; Chapleur, O. Acclimation strategy to increase phenol tolerance of an anaerobic microbiota. Bioresour. Technol. 2016, 216, 77–86. [Google Scholar] [CrossRef]
  46. Fang, H.H.; Zhou, G.M. Degradation of phenol and p-cresol in reactors. Water Sci. Technol. 2000, 42, 237–244. [Google Scholar] [CrossRef]
  47. Alvares, A.B.C.; Diaper, C.; Parsons, S.A. Partial oxidation by ozone to remove recalcitrance from wastewaters—A review. Environ. Technol. 2001, 22, 409–427. [Google Scholar] [CrossRef] [PubMed]
  48. Benitez, F.J.; Beltran-Heredia, J.; Torregrosa, J.; Acero, J.L. Improvement of the anaerobic biodegradation of olive mill wastewaters by prior ozonation pretreatment. Bioprocess Eng. 1997, 17, 169–175. [Google Scholar] [CrossRef]
  49. Ma, Y.; Liu, Y. Turning food waste to energy and resources towards a great environmental and economic sustainability: An innovative integrated biological approach. Biotechnol. Adv. 2019, 37, 107414. [Google Scholar] [CrossRef] [PubMed]
Figure 1. Short-term digester functional data. Average and standard deviation values are from triplicate systems. (A) Methane production, (B) Digestate COD concentration, (C) Digestate SCOD concentration. The whiskers represent one standard deviation above and below the mean. Some whiskers are small and not visible.
Sustainability 12 03441 g001
Figure 2. Dual hierarchical clustering of the seven most abundant archaeal OTUs. These OTUs represent 94 ± 2.6% of the total archaeal abundance in all digesters. Taxonomic classification in bold font represents the valid level based on percent homology, with the homology percentage ranges in parentheses. Digester communities on day 15 were dominated by Methanosaeta (OTU 56). However, communities in digesters co-fed catalyzed APL shifted by day 45 and were dominated by an unknown archaea (OTU 127).
Sustainability 12 03441 g002
Figure 3. Dual hierarchical clustering of the 50 most abundant bacteria. These OTUs represent 63.1 ± 2.3% of total microbial community abundance in all the digesters. Taxonomic classification in bold font represents the valid level based on percent homology, with the homology percentage ranges in parentheses. Communities on day 45 clustered separately from communities on day 15. On day 45, bacterial communities in the digesters fed catalyzed APL clustered separately from all other communities. Clostridiaceae (OTU 96) and Ruminococcaceae (OTU 97) were dominant in all digesters on days 15 and 45. In inhibited digesters, Bacteroidales (OTU 2), Enterococcus (OTU 15), Erysipelotrichales (OTU 22), Campylobacter (OTU 30), and Tissierrella (OTU 36) were dominant, but not in other digesters.
Sustainability 12 03441 g003
Figure 4. Methane production results from the long-term acclimation study. Control digesters received synthetic primary sludge and no APL, whereas non-catalyzed APL digesters were co-fed synthetic primary sludge and non-catalyzed APL. (A) Daily methane volume produced; the red lines show the time at which the APL OLR was changed. (B) Comparison between theoretical stoichiometric maximum daily expected methane from APL COD (blue bars) and the observed methane produced from APL (compared to controls) at each organic loading rate (red bars). Whiskers represent one standard deviation above and below the mean. Some whiskers are small and not visible.
Sustainability 12 03441 g004
Table 1. Aqueous pyrolysis liquid (APL) composition a.
APLCOD
(g/L)
NH3-N
(g/L)
VFA Concentration as Acetic Acid (g/L)
Non-catalyzed 202 ± 4.363 ± 0.129 ± 1.6
Non-catalyzed, air-stripped 198 ± 7.813 ± 0.633 ± 1.1
Catalyzed 33 ± 1.172 ± 3.40.06 ± 0.009
Catalyzed, air-stripped17 ± 0.725 ± 0.3BD
a BD indicates the concentration was below the detection limit. COD: chemical oxygen demand; VFA: volatile fatty acids.
Table 2. Digester effluent characterization on day 45 a.
Co-Digestate FeedTotal VFA Concentration as Acetic Acid (mg/L)Acetic Acid Concentration (mg/L)COD Concentration (g/L)SCOD Concentration (g/L)Methane Production (mL/d)
None (Control)BDBD4.1 ± 0.520.7 ± 0.0238.8 ± 1.8
Catalyzed2010 ± 431500 ± 1647.1 ± 2.55.2 ± 1.128.0 ± 4.0
Catalyzed air-stripped2070 ± 341530 ± 1539.6 ± 0.45.8 ± 0.6528.0 ± 5.9
Non-catalyzed50.0 ± 16BD4.5 ± 0.160.9 ± 0.0538.0 ± 2.7
Non-catalyzed air-strippedBDBD4.7 ± 0.571.1 ± 0.240.4 ± 2.0
a BD indicates the concentration was below the detection limit. SCOD: soluble chemical oxygen demand.

