1. Introduction
Domestic market fragmentation in China has always been an essential issue of academic concern [
1,
2,
3]. There are generally two reasons that lead to domestic market fragmentation: One is geographical distance, and the other is the border effect of government intervention and local protectionism. With the promotion of transportation infrastructure, especially High-Speed Rail, the role of geographic distance in market fragmentation has been declining significantly. The inter-provincial market fragmentation caused by the border effect still has an important impact on the regional economic development in China. This paper tries to investigate the non-linear effect of inter-provincial market fragmentation on the regional economic development in China.
Most studies conclude that severe market fragmentation will inevitably lead to the loss of macroeconomic efficiency [
4], and will not be conducive to the economic development of an overall country. But why do provincial governments in China still tend to choose the strategy of market fragmentation? The possible reason is that market fragmentation may have a positive effect on regional economic development, which is different from the negative effect on national economic development. We argue that inter-provincial market fragmentation has both positive and negative influences on regional economic development in China. It is important to strengthen the positive effect of market fragmentation and weaken the negative effect of market fragmentation for promoting regional economic development in China.
The inter-provincial market fragmentation means that goods, services, and production factors cannot be circulated freely across different regions [
5], preventing the exertion of market scale and comparative advantage. Market fragmentation entails that the developing regions cannot effectively undertake the production factors and industries from the developed regions, and the enterprises in developed regions cannot expand their market in developing regions. Therefore, in both developed and developing regions, inter-provincial market fragmentation has an adverse impact on regional economic development.
On the other hand, inter-provincial market fragmentation also has a positive effect on regional economic development. The policy of market fragmentation implemented by the local government can protect the inferior industries in its jurisdiction [
6]. The protection and cultivation of inferior industries can optimize the regional industrial structure in the future and provide an industrial base for regional economic development. Meanwhile, inter-provincial market fragmentation can reduce the outflow of production factors and taxes in a region, and then increase the production factors and fiscal revenue in that region. The increase of production factors is conducive to regional economic development under the market mechanism. The increase of financial revenue provides financial support for future regional economic development under the government mechanism [
7].
Is the positive effect of inter-provincial market fragmentation on regional economic development stronger than its negative effect? We argue that the inter-provincial market fragmentation imposes an inverted U-shaped influence on regional economic development. When the degree of market fragmentation is lower than a certain value, the positive effect of inter-provincial market fragmentation on regional economic development is stronger than its negative effect. Conversely, when the degree of market fragmentation is beyond a certain value, the positive effect of inter-provincial market fragmentation on regional economic development is weaker than its negative effect. It is necessary to maintain moderate market fragmentation for the promotion of regional economic development.
Furthermore, there is a difference in the periods and regions in terms of the effect of inter-provincial market fragmentation on regional economic development. Since China’s reform and opening up, with marketization promotion, the market has played a more important role in the allocation of resources in regional economic development [
8]. The hindrance of inter-provincial market fragmentation to market scale and comparative advantage is also increasing as time goes on. It is beneficial to maintain a lower degree of market fragmentation for the market scale and comparative advantage to be effective. As far as regional heterogeneity is concerned, it is necessary to maintain a lower degree of market fragmentation in Eastern and Central China for regional economic development. There is a more perfect market mechanism in Eastern and Central China, by which the market will play a more important role in resource allocation than the government [
9]. Conversely, it is necessary to maintain a higher degree of market fragmentation in Western China. A proper increasing degree of market fragmentation in Western China can reduce the outflow of production factors and taxes, and thus make a greater contribution to regional economic development.
There are various motivations for provincial governments to implement the policy of market fragmentation, including Social Stability, Fiscal Revenue Enhancement, and Official Positions Promotion. We will analyze the impact of inter-provincial market fragmentation on regional economic development under the influence of different motivations of provincial governments. Furthermore, we will put forward a strategy of maintaining a moderate market fragmentation for promoting regional economic development.
Based on panel data of 31 provincial regions in Mainland China from 1999 to 2015, we empirically examine the non-linear impact of inter-provincial market fragmentation on regional economic development by using the system Generalized Moment Estimation (GMM) approach and investigate the regional and period differences of the effect. Meanwhile, constructing a cross-terms model, we empirically analyze the influence of various provincial government motivations on the non-linear relationship between inter-provincial market fragmentation and regional economic development.
The subsequent sections are organized as follows. The second section reviews the literature on the studies related to this paper. The third section measures the degree of inter-provincial market fragmentation of 31 provinces in Mainland China. The fourth section empirically analyzes the non-linear effect of inter-provincial market fragmentation on regional economic development. The fifth section empirically analyzes the effect of various motivations of provincial governments on the non-linear relationship between inter-provincial market fragmentation and regional economic development. The sixth section ends the study with some conclusions.
2. Literature Review
The measurement of domestic market fragmentation originated from scholars’ research on evaluating the trade barriers between international markets. With the deepening of the research on international market fragmentation, scholars began to pay attention to the measurement of domestic market fragmentation. There are mainly four approaches adopted.
(a) A Production Perspective Approach, which examines whether the market tends to be fragmented by analyzing the interregional dispersion of output. Young (2000) found that there was widespread convergence in the structure of output during the reform period, as the different provinces duplicated each other’s industries. Young (2000) also presented data on the variance of regional labor allocations and labor productivities, showing that these diverged substantially during the reform period [
10]. Fan & Wei (2006) applied the developed econometric methods of panel unit root tests and nonlinear mean reversion to investigate price convergence in China, and found that prices did converge to the law of one price in China for an overwhelming majority of goods and services [
11]. Fan and Wei (2006) shed light on the extent of the market economy in China and cast doubt on Young’s (2000) proposition.
(b) A Trade Perspective Approach, which uses the trade flow or border effect between provinces to reflect the degree of domestic market integration and its changing trend. By analyzing the average trade output and import data of 25 provinces in China from 1987 to 1992, Naughton (1999) found that inter-provincial trade flows were significantly stronger than international trade flows and domestic markets tended to be integrating [
12]. Poncet (2005) relied on industry-level trade flows extracted from provincial input–output tables to develop a model that analyzes the magnitude and evolution of Chinese provinces’ engagement in domestic trade by computing all-inclusive indicators of trade barriers. Poncet (2005) found that over the 1990s, not only was China’s domestic market fragmentation along provincial borders great, but it also has become more severe at least between 1992 and 1997 [
13]. The research results of Poncet (2005) show that the border effect leads to domestic market fragmentation.
(c) An Economic Cycle Perspective Approach, which uses the correlation of economic cycles to measure the synergy between different regions, and indirectly reflects the degree of domestic market fragmentation. Xu (2002) analyzed the pattern of provincial economic integration in China for the period 1991–1998 by means of an error-components model that decomposes provincial sectoral real value-added growth into common national effects, industry-specific effects, and province-specific effects. Xu (2002) found significant co-movements in the long run, although province-specific factors still account for one-third of the variance of real output growth in the short run. The results suggest that although economic integration of the Chinese provinces has progressed under reform, it is by no means complete [
14].
(d) A Price Perspective Approach based on the “Glacier Cost” model. Engel and Rogers (1996) used CPI data for U.S. and Canadian cities for fourteen categories of consumer prices to examine the nature of the deviations from the law of one price. Engel and Rogers (1996) found that the distance between cities explains a significant amount of the variation in the prices of similar goods in different cities, but the variation of the price is much higher for two cities located in different countries than for two equidistant cities in the same country [
15]. Parsley and Wei (2001) exploited a three-dimensional panel data set of prices on 27 traded goods, over 88 quarters, across 96 cities in the U.S. and Japan. Focusing on dispersion in prices between city-pairs, Parsley and Wei (2001) found that crossing the U.S.-Japan Border’ is equivalent to adding as much as 43,000 trillion miles to the cross-country volatility of relative prices [
16].
However, the above methods cannot distinguish inter-provincial market fragmentation from market fragmentation caused by geographical distance. We measure the inter-provincial market fragmentation by adopting an adjusted priced-based approach from the Law of One Price using a three-dimensional panel of annual price on eight products across 31 Chinese provinces between 1999 and 2015 and eliminating the effect of geographical distance and traffic improvement. As far as we know, this paper is the first that uses this methodology on the measurement of domestic market fragmentation.
On the research of the relationship between market fragmentation and regional economic development, some scholars believe that market fragmentation hinders regional economic development. Although economic integration of the Chinese provinces has progressed under reform, it is by no means complete [
14]. Poncet (2003) relied on a new set of provincial trade flow to analyze and compare the magnitude and evolution of Chinese provinces’ engagement in domestic and international trade by computing all-inclusive indicators of trade barriers. Poncet (2003) found that Chinese provinces’ greater involvement in international trade went hand in hand with a decrease in domestic trade flow intensity between 1987 and 1997 [
17]. Alcalá and Ciccone (2003) found that trade and domestic market size are robust determinants of economic growth over the 1960–1996 period, and market integration has a significant role in promoting economic growth, which indirectly reflected the adverse effect of the market fragmentation on economic growth [
18]. Stoica et al. (2020) believe that market integration has a positive influence and has many benefits on the growth and sustainable development of the economy [
19].
Other scholars have argued that there is a non-linear impact of market fragmentation on regional economic development [
20]. When the degree of market fragmentation is lower than a certain value, the effect of market fragmentation on regional economic development is positive. Conversely, when the degree of market fragmentation is beyond a certain value, the effect of market fragmentation on regional economic development is negative. In terms of period heterogeneity, some scholars have argued that the influence of market fragmentation on regional economic development is constantly changing with the promotion of China’s marketization. In terms of regional heterogeneity, some scholars have argued that market fragmentation had different effects on economic development in different regions of China. Market fragmentation had a positive role in developing regions of China, where the market mechanism is improving [
21]. We also analyze the non-linear effect of inter-provincial market fragmentation on regional economic development and its differences in various regions and periods.
3. Measurement of Inter-Provincial Market Fragmentation
3.1. Method
Roman (2020) argued that the distance between markets could be recognized as one of the more important factors determining price difference [
22]. This means that distance affects the accuracy of measuring inter-provincial market fragmentation relying on the “one-price rule.” The traditional Law of One Price (LOP) holds that the causes of market fragmentation include two aspects: One is geographical distance, and the other is administrative barriers and institutional barriers [
23]. By removing the effect of inter-provincial distance between provinces, we attempt to adopt an adjusted priced-based approach from the Law of One Price to measure the inter-provincial market fragmentation.
Let P (
i, k, t) be the price of the good category
k in province
i at year
t. For a given province pair (
i, j) and a given good category
k at year
t, we define the absolute deviation as
The absolute deviation of prices of the good category
k increases with the distance between province
i and province
j. To remove the effect of inter-provincial distance between provinces, we denote a new price dispersion as
where
refers to the new price dispersion of an identical good,
k, between province
i and
j at year
t.
is the distance between provincial capitals in province
i and
j.
is the proportion of highway mileage to total grade mileage at year
t. The greater the absolute value of
, the greater the price dispersion between province
i and
j, and the higher the degree of inter-provincial market fragmentation.
The data used in this paper are three-dimensional, including region, year, and the goods category. The regional dimension refers to 31 provinces in Mainland China. There are 34 provincial-level administrative regions in China, including 31 provinces in Mainland China as well as Chinese Hong Kong, Chinese Macao, and Chinese Taiwan. We only selected 31 provinces in Mainland China for analysis, because the statistical caliber of Chinese Hong Kong, Chinese Macao, and Chinese Taiwan is inconsistent with that of Mainland China. The year dimension refers to 1999–2015 due to the lack of data and the difficulty of data acquisition. The eight goods categories classified by the Chinese statistical department in the CPI statistics include grain, vegetables, beverages and tobacco and alcohol, clothing, daily necessities, medicine and health care supplies, books and magazines and electronic publications, and fuel commodities.
Using Parsley and Wei ‘s approach (2001) [
24], we did the following:
First, we calculated the average fluctuation of price dispersion of the good category
k as
where province
i and province
j are adjacent,
n is the sum of pairs of adjacent provinces.
Second, we calculated the fluctuation of price dispersion of the good category
k between province
i and province
j at year
t as
Third, we calculated the variance of the eight goods categories between province i and province j at year t as . The greater the value of , the higher the degree of market fragmentation between province i and province j at year t.
Fourth, we calculated the degree of market fragmentation of province
i at year
t as
where
is the degree of market fragmentation of province
i at year
t,
is the number of provinces that is adjacent to province
i. For example, the degree of market fragmentation of Heilongjiang is the mean of the variance of price dispersion of Heilongjiang and Jilin and Heilongjiang and Neimenggu.
The above calculation process produced 527 observations that are the degree of market fragmentation of 31 provinces during 1999–2015. The original data of the above indicators are from the China Statistical Yearbook, the China Labor Statistical Yearbook, and the National Research Network.
3.2. Spatio-Temporal Analysis of Inter-Provincial Market Fragmentation in China
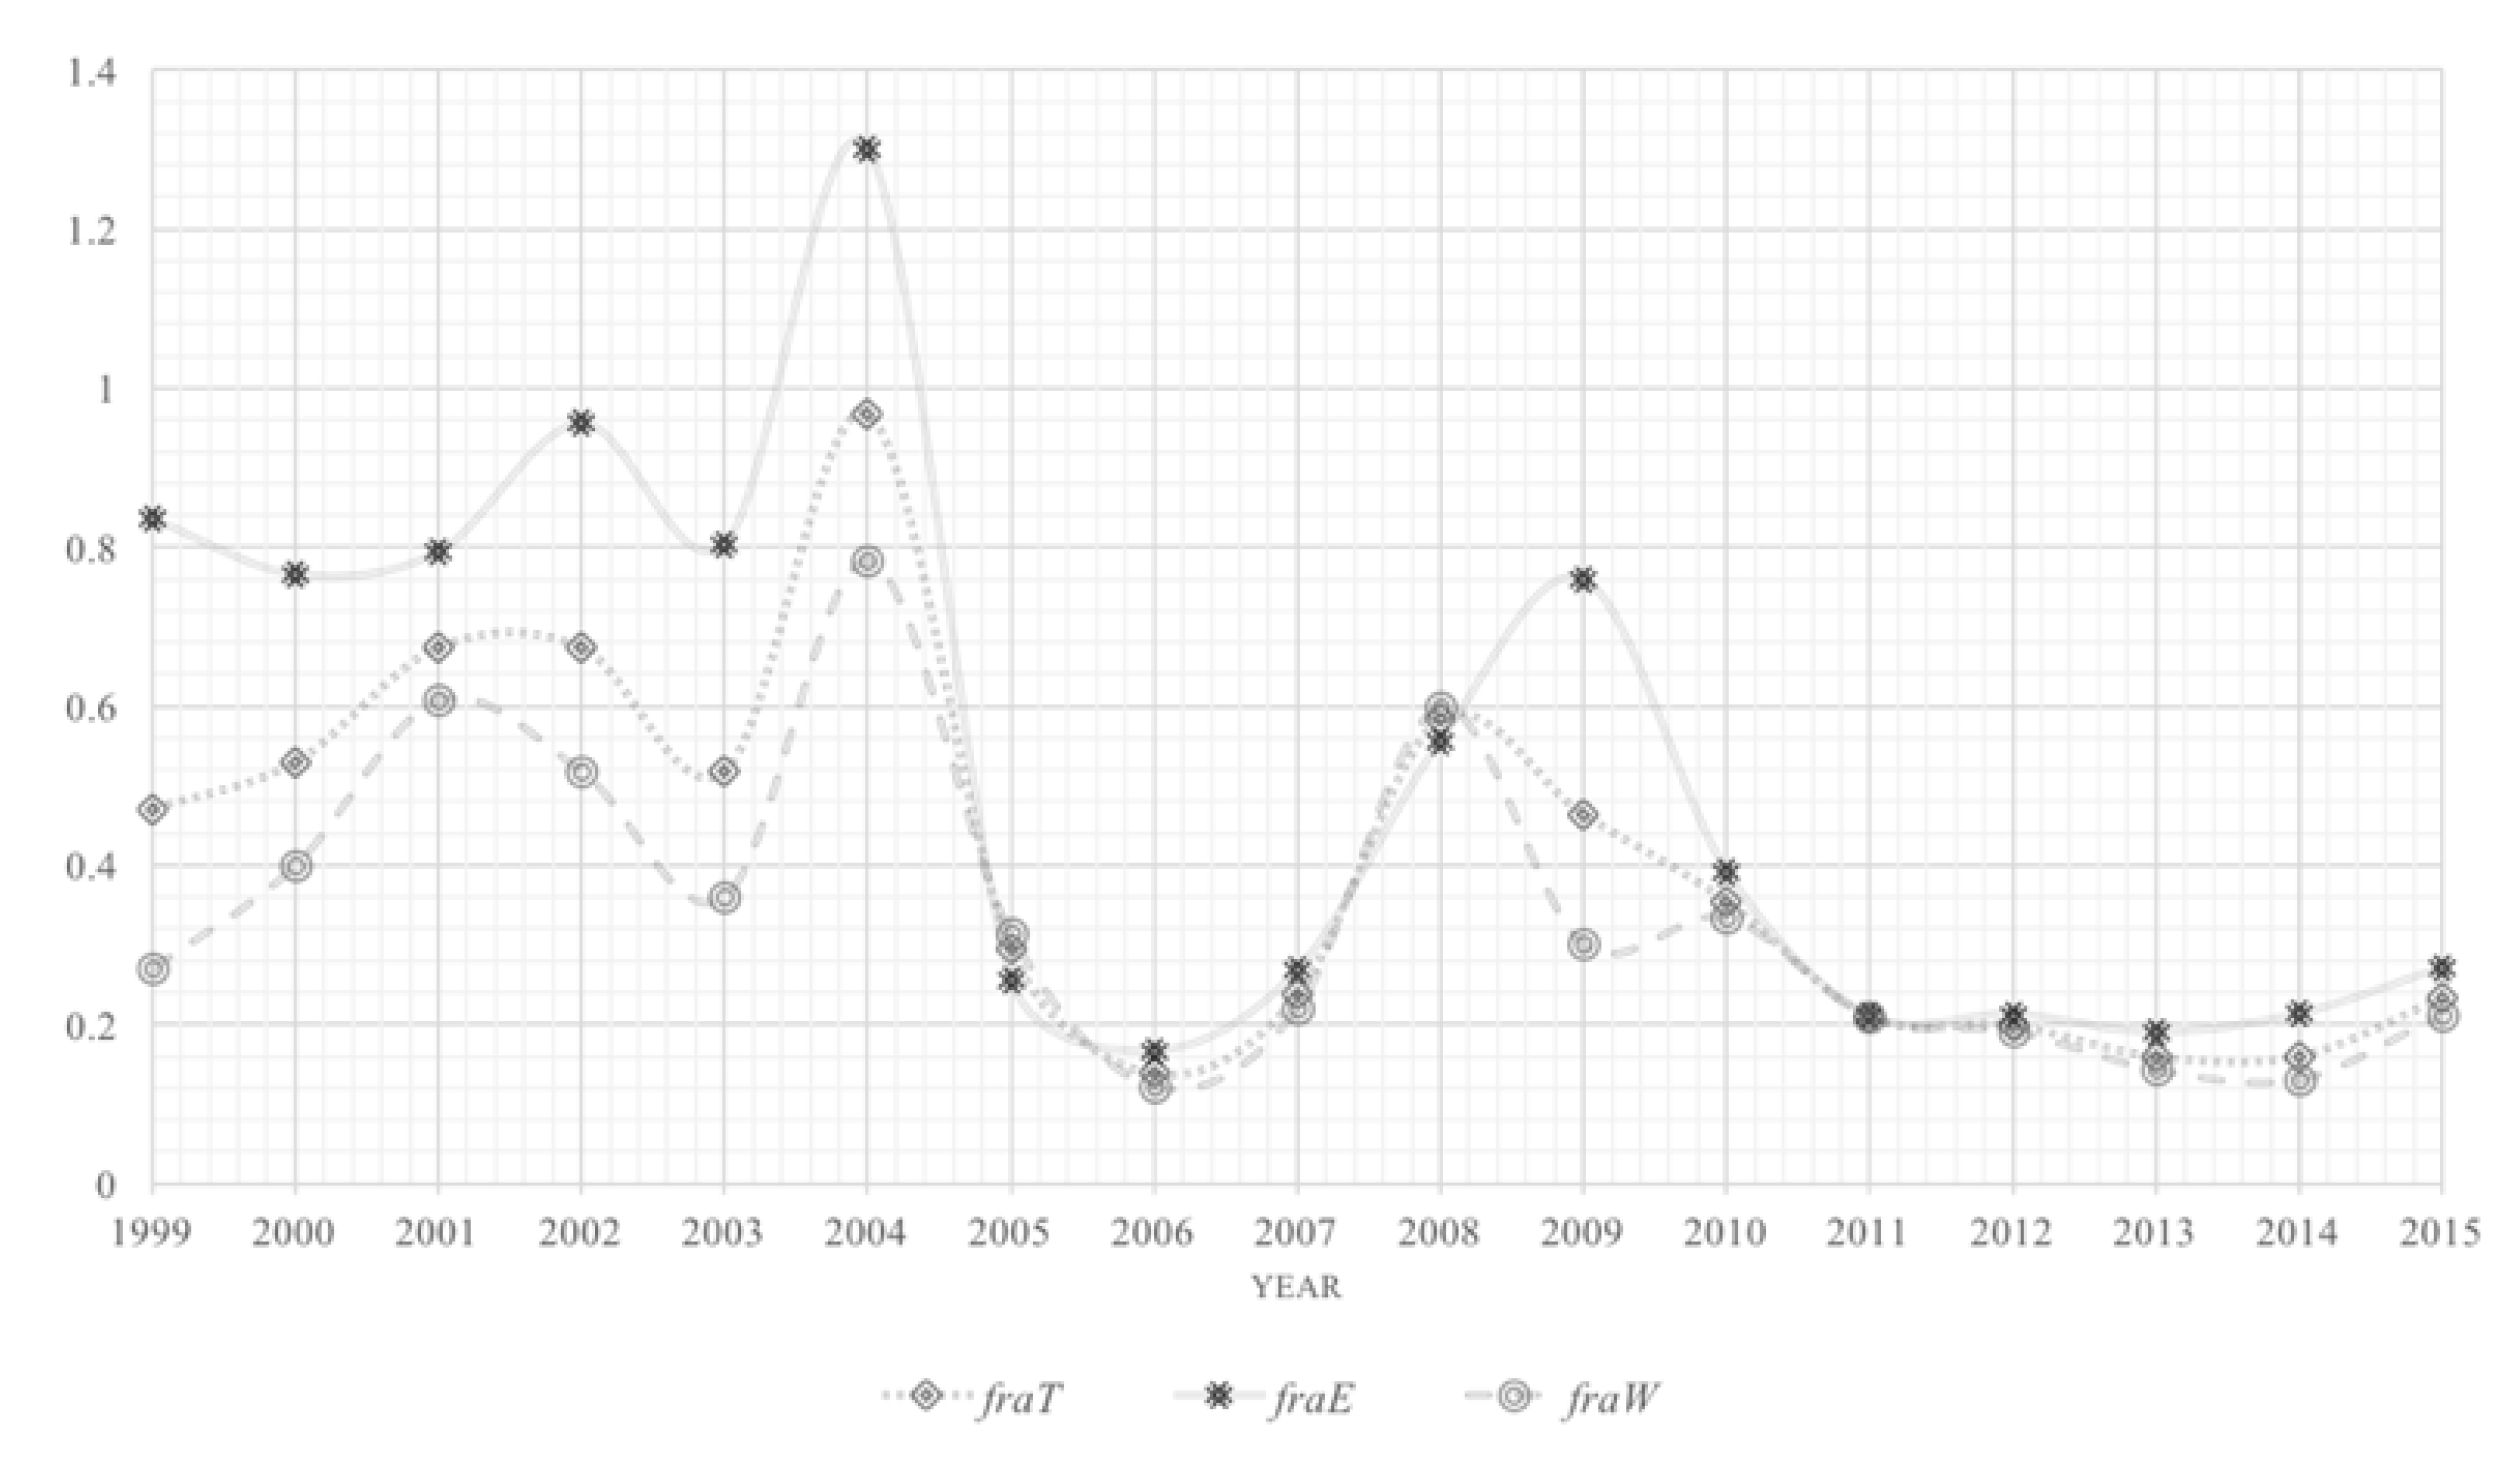
We denote the average value of the market fragmentation of 31 provinces in Mainland China at year
t as
fraT, denote the average value of the market fragmentation of 11 eastern provinces in China at year
t as
fraE, denote the average value of the market fragmentation of 20 central and western provinces in China at year
t as
fraW. The 11 provinces in Eastern China include Beijing, Fujian, Guangdong, Hainan, Hebei, Jiangsu, Liaoning, Shandong, Shanghai, Tianjin, and Zhejiang. The six provinces in Central China include Anhui, Henan, Shanxi, Hubei, Hunan, and Jiangxi. The 14 provinces in Western China include Gansu, Guangxi, Guizhou, Heilongjiang, Jilin, Neimenggu, Ningxia, Qinghai, Shaanxi, Sichuan, Xizang, Xinjiang, Yunnan, and Chongqing.
Figure 1 presents the average index of market fragmentation over 31 provinces from 1999 to 2015.
It might be divided into two periods, namely phase of fragmentation (1999–2004) and phase of integration (2005–2015). In the first phase, the average index of market integration is in the range 0.4704–0.9663 and is high and less volatile. The degree of domestic market fragmentation in China in 1999 is 0.4704, while the degree of inter-provincial market fragmentation in China in 2004 is 0.9663. However, it falls sharply from 2004. After 2004, the highest value is 0.5835 in 2008, and the lowest value is 0.1382 in 2006. The degree of inter-provincial market fragmentation in China in 2015 is 0.2333. Market integration has appeared in the last 10 years.
Before 2005, the degree of inter-provincial market fragmentation in Eastern China was higher than that in Central and Western China. After 2005, the degree of inter-provincial market fragmentation in Eastern China was converging with that in Central and Western China. This indicates that the differences in market fragmentation between economic regions were narrowing.
The degree of inter-provincial market fragmentation increased slightly during 2008–2009. The 2008 economic crisis started to manifest itself officially on the 15th of September 2008 in the United States of America [
25]. Since then, it spread not only to the financial sector of the global economy but also to its real sectors. Geographically, it spread to many parts of the world, including China. Affected by the global financial crisis, provincial governments had strengthened their intervention in the market, and the degree of inter-provincial market fragmentation slightly increased.
The domestic market fragmentation in China appears to have caused a fluctuating decline during 1999–2015. The average index of market fragmentation over 31 provinces in the first phase (1999–2004) is 0.6385, while the average index of market fragmentation over 31 provinces in the second phase (2005–2015) is 0.2757. The domestic market fragmentation in China decreased by 56.82%. However, there are some provinces which experienced a rapid fragmenting during the period 1999–2015. As shown in
Table 1, Hunan’s degree of market fragmentation increased rapidly from 0.1536 in 1999 to 0.3934 in 2015. Guizhou’s degree of market fragmentation increased rapidly from 0.1791 in 1999 to 0.3677 in 2015.
As shown in
Table 1, the top five provinces in the market fragmentation ranking in 2015 are Shanghai, Ningxia, Beijing, Hunan, and Hainan. The degree of market fragmentation of Shanghai is 0.7237. The degree of market fragmentation of Ningxia is 0.5375. The degree of market fragmentation of Beijing is 0.4387. The degree of market fragmentation of Hunan is 0.3934. The degree of market fragmentation of Hainan is 0.3751.
As shown in
Table 1, the last five provinces in the market fragmentation ranking in 2015 are Fujian, Anhui, Jiangxi, Shandong, and Xizang. The degree of market fragmentation of Fujian is 0.0402. The degree of market fragmentation of Anhui is 0.0872. The degree of market fragmentation of Jiangxi is 0.1008. The degree of market fragmentation of Shandong is 0.1071. The degree of market fragmentation of Xizang is 0.1106.
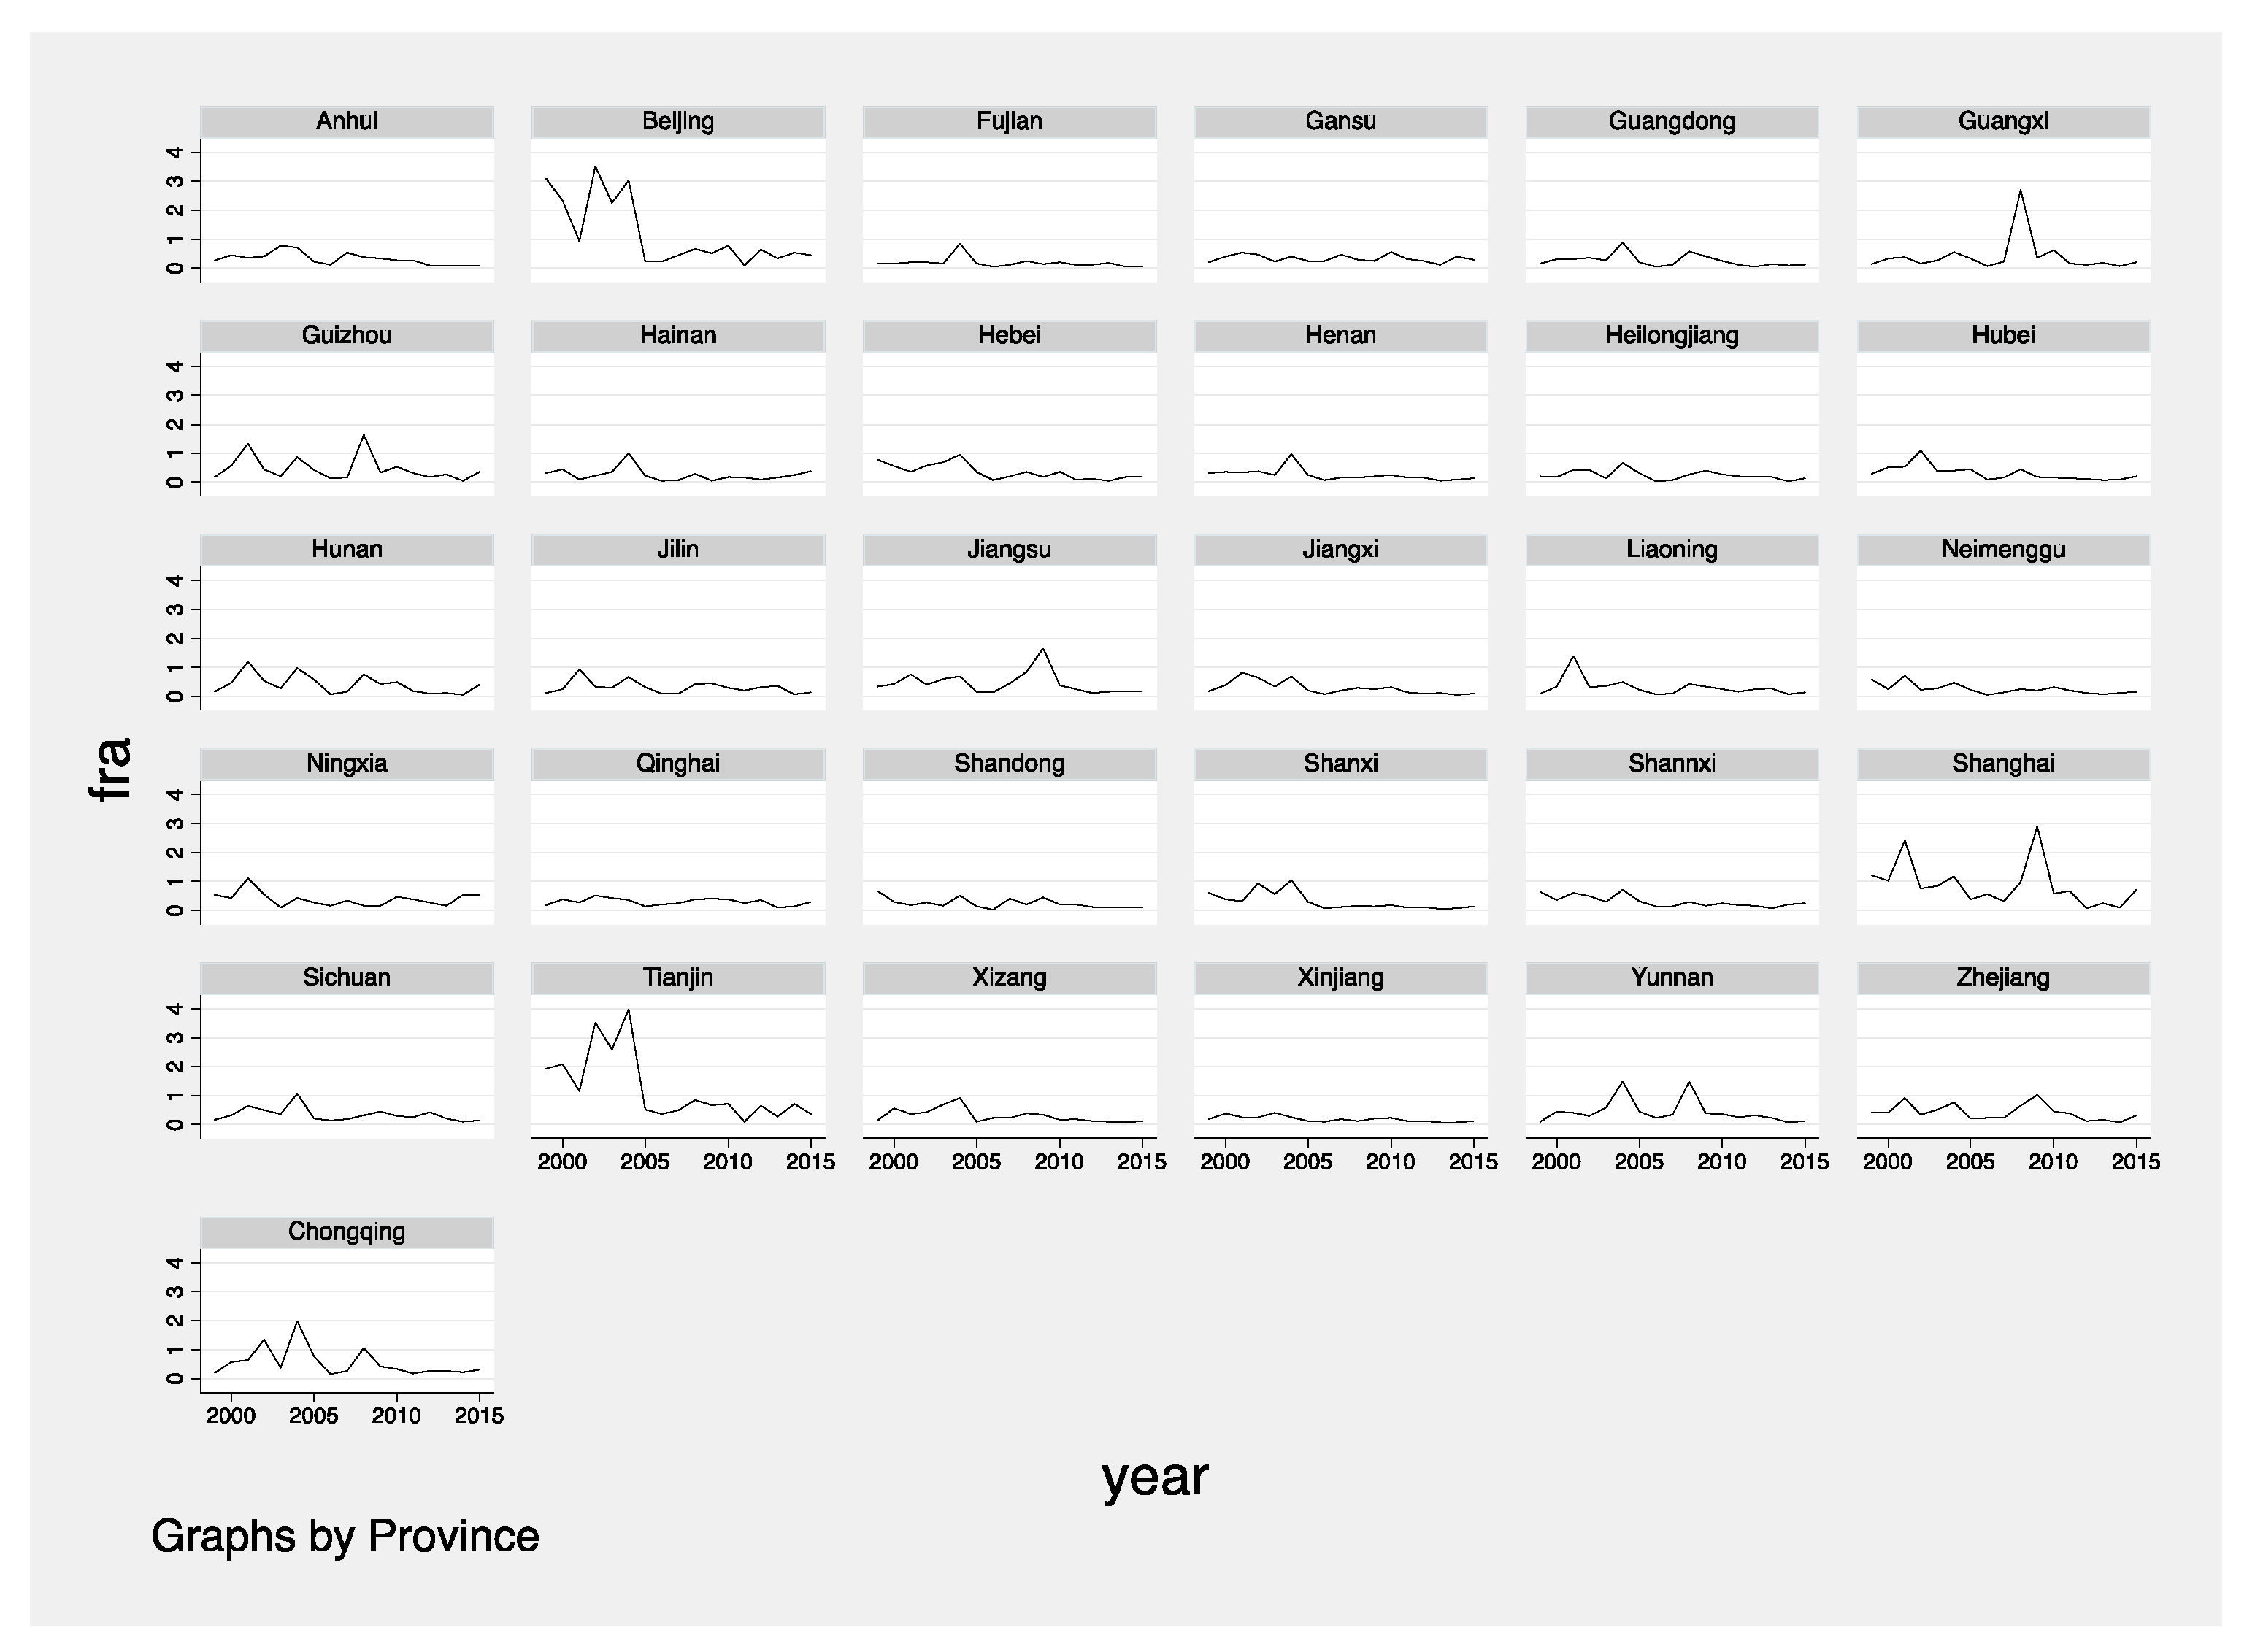
As shown in
Figure 2, the degree of market fragmentation of municipalities directly under the Central Government (Beijing, Shanghai, Tianjin, and Chongqing) was relatively higher. The provinces with large fluctuations in the degree of market fragmentation are Beijing, Guangxi, Shanghai, Tianjin, Yunnan, and Chongqing. However, in some provinces, such as Fujian, the degree of market fragmentation has not changed much during 1999–2015. In some underdeveloped provinces, such as Xinjiang, the degree of market fragmentation is relatively low. Poncet (2003) found that Chinese provinces’ greater involvement in international trade went hand in hand with a decrease in domestic trade flow intensity between 1987 and 1997 [
17]. The degree of market fragmentation in some provinces, such as Shanghai, with a high degree of international openness, is relatively high.
4. An Empirical Study on the Non-Linear Effect of Inter-Provincial Market Fragmentation on Regional Economic Development
4.1. Empirical Design
Modeling for Empirical Study
We assume that the output function of region
i at time
t is
.
Y refers to output level,
A refers to total factor productivity,
K refers to capital, and
L refers to labor. Borrowing the approach of Ke (2015) [
26], we assume that total factor productivity is
, where
Dome refers to the openness of region
i to domestic markets,
Open refers to the openness of region
i to foreign markets, and
refers to the other factors affecting
A besides
Dome and
Open. Because market fragmentation and
Dome are completely negatively correlated, we can draw the following:
where
refers to market fragmentation of region
i at year
t. We assume that per capita output level is
, and the capital-labor ratio is
. We can then draw the following:
Using Checherita–Westphal’s approach (2012) [
27] for reference, the estimation model in this paper is set as the most common binomial form on the research of non-linear relationships based on the existing literature on market fragmentation. Accordingly, a basic static empirical model after logarithm is designed as follows:
where
is a constant coefficient,
(
j = 1, 2, …, 5) is the coefficient term of each variable,
is the unobservable factor related to the region, and
represents the random disturbance term.
Considering that many variables are affecting regional economic development, there may be some endogenous problems in the estimation model designed in this paper, such as missing variables, which may lead to a correlation between the relevant explanatory variables and the stochastic perturbation terms. Traditional estimation methods, such as Ordinary Least Squares, Maximum Likelihood, Panel Fixed Effect, Panel Random Effect, and Feasible Generalized Least Squares (FGLS), may make the estimation coefficients biased and inconsistent. GMM is usually adopted to solve this problem. GMM is suitable for sample data with “large N and small T,” and it is not necessary to specify the exact distribution information of random error terms, while the existence of heteroscedasticity and sequence correlation is allowed. Thus, the panel model should be a dynamic model that contains the first-order lag term of the interpreted variable. We can draw a dynamic model as follows:
GMMexchange rate (annual average price) to convert the US dollar price into the RMB price. The capital-labor ratio is represented by the ratio of capital to the labor force, where the capital is represented by the gross fixed capital formation from expenditure-based GDP which is adjusted based on 1999, and the labor force is represented by the number of employed persons in urban areas given the availability of data.
The original data of the above indicators are from the China Statistical Yearbook, the China Labor Statistical Yearbook, and the National Research Network.
Table 2 gives a statistical description of the average of all of the major explanatory variables and explained variables of 31 province samples from 1999 to 2015 in China. The average statistics reflect the mean level of the variable sample data.
During the 17 years, the per capita GDP and the capital-labor ratio in China increased steadily and rapidly. The per capita GDP increased by 586.40%. The capital-labor ratio increased by 149.28%. The gross capital formation increased by 458.27%. The number of employed persons in urban areas was on the rise, with an increase of 137.50% by 2015. The ratio of total import and export to Gross Domestic Production shows an inverted U-shaped trend, with the highest value (0.3822) in 2006 and a slight decline (0.2717) in 2009 due to the impact of the global economic crisis.
4.2. Analysis of Empirical Results
4.2.1. Estimated Results with the Full Dataset
In
Table 3, we adopted the panel data of 31 provinces in Mainland China from 1999 to 2015 for an empirical analysis of the non-linear effect of inter-provincial market fragmentation on regional economic development using Stata Statistical Software: Release 15 (StataCorp LLC, College Station, TX, USA) [
28].
Before performing the panel regression, stationarity tests for series should be conducted, otherwise, the regression may be spurious and will result in misleading conclusions (Ma et. al, 2016) [
29]. The second-generation panel unit root tests proposed by Pesaran (2007) [
30] were adopted in this paper. We found that both tests reject the null of the unit root for the variables
y,
fra,
Open, and
k at 10% significance. We conclude that these variables are stationary.
We used lagged values of the dependent variable as a gmm-style instrument for the level equation as well as an iv-style instrument for the first difference equation. We followed the two-step system GMM procedure in order to get an efficient estimator that controls the panel specific autocorrelation and heteroscedasticity problems in the model.
It is essential to check the validity of the instruments and the absence of serial correlation of second-order in the first-differences error term [
31]. We used the Sargan test [
32] for over-identifying restrictions statics for the validation of GMM dynamic models. The results of the Sargan test suggest that the regressions specifications have failed to reject the null hypothesis, and the instruments are valid. Another test is for second-order autocorrelation in the first-differences error term, and all coefficients of the p-value (AR-2) show high values. These findings generally indicate that we cannot reject the null hypothesis of the absence of second-order serial correlation in the first-differences error. The test results support the consistency of the system GMM estimator in our estimated results.
In
Table 3, Model 3 is the most basic model. In Model 3, we included both the log of
fra, and the log
fra squared in the regression to account for possible non-linearity in the relationship. Based on Model 3, Model 2 added the log of
Open. Based on Model 2, Model 1 added the log of
k.
The inter-provincial market fragmentation imposes an inverted U-shaped influence on regional economic development in China. The coefficient of the quadratic term of Ln(fra) is between −0.0832 and −0.0476 and passed the inspection of the 1% significance level, which suggests an inverted U-shaped influence. The coefficient of the primary term of Ln(fra) is between −0.2590 and −0.1322 and passed the inspection of the 1% significance level. When the degree of market fragmentation is lower than a certain value, the positive effect of inter-provincial market fragmentation on regional economic development is stronger than its negative effect. Conversely, when the degree of market fragmentation is beyond a certain value, the positive effect of inter-provincial market fragmentation on regional economic development is weaker than its negative effect. It is necessary to maintain moderate inter-provincial market fragmentation for the promotion of regional economic development.
However, with the increasing degree of market fragmentation, it eventually has an adverse impact on regional economic development. The inter-provincial market fragmentation is not conducive to the long-term development of the regional economy. This conclusion is consistent with that of Ke‘s study (2015) [
26]. Ke (2015) constructed an enhanced indicator for trade barrier and examined the endogenous relationship between market integration and regional economies across China from 1995 to 2011, and found that the endogenous relationship is significant, reflecting a virtuous cycle [
33]. We provide a definite answer to the current debate about whether there is a critical point for the impact of inter-provincial market fragmentation on regional economic development.
The effect of international openness on regional economic development is positive. As shown in
Table 3, the coefficient of Ln(
Open) is between 0.2075 and 0.2912 and passed the inspection of the 1% significance level. Rapid economic growth has been underpinned by expansion in its domestic markets and the integration of domestic and international markets in goods, services, capital, labor, and foreign exchange. Linking markets, both domestic and international, has been key to China’s success [
21]. The effect of the capital-labor ratio on regional economic development is positive. As shown in
Table 3, the coefficient of Ln(
k) is 0.3023 and passed the inspection of the 1% significance level.
4.2.2. Estimated results for different regions
We found that the effect of inter-provincial market fragmentation on regional economic development differs greatly among different economic regions. This paper divides the economic regions into Eastern and Central China and Western China. As shown in
Table 4, Model 4 provides the estimated results of sample provinces in Eastern and Central China, and Model 5 provides the estimated results of sample provinces in Western China.
There is an inverted U-shaped relationship between inter-provincial market fragmentation and regional economic development both in Eastern and Central China and Western China. As shown in Model 4, the coefficient of the quadratic term of Ln(fra) is −0.0527 and passed the inspection of the 1% significance level, which suggests an inverted U-shaped influence. As shown in Model 5, the coefficient of the quadratic term of Ln(fra) is −0.0330 and passed the inspection of the 10% significance level, which suggests an inverted U-shaped influence.
There is a critical value such that, if the inter-provincial market fragmentation is initially below this value, the effect of inter-provincial market fragmentation on regional economic development is positive, whereas if the inter-provincial market fragmentation is above this value, the effect of inter-provincial market fragmentation on regional economic development is negative.
By calculating , we can obtain this critical value. The critical value of fra in Model 1 is 0.25. The critical value of fra in Model 4 is 0.21. The critical value of fra in Model 5 is 0.38. The critical value of fra in Model 1 is greater than the critical value of fra in Model 4. The critical value of fra in Model 5 is greater than the critical value of fra in Model 1.
It is necessary to maintain a lower degree of inter-provincial market fragmentation in Eastern and Central China for regional economic development. There is a more perfect market mechanism in Eastern and Central China, by which the market will play a more important role in resource allocation than the government. The hindrance of inter-provincial market fragmentation to market scale and comparative advantage is also increasing in Eastern and Central China. On the other hand, the excessive increasing degree of inter-provincial market fragmentation leads to excessive local government intervention in the market, which is not conducive to the development of a regional economy.
Conversely, it is necessary to maintain a higher degree of inter-provincial market fragmentation in Western China. The degree of marketization in Western China is relatively lower than that in Eastern and Central China. Provincial governments play a more important role in resource allocation than the market. A proper increasing degree of market fragmentation in Western China can reduce the outflow of production factors and taxes, and thus make a greater contribution to regional economic development. However, the excessive inter-provincial market fragmentation is not conducive to regional economic development. Moreover, the regional development strategy implemented by the central government in China limits the provincial governments’ choice of a market fragmentation strategy.
The effect of international openness on regional economic development is positive. As shown in
Table 4, the coefficient of Ln(
Open) is between 0.1251 and 0.2563 and passed the inspection of the 1% significance level. The effect of the capital-labor ratio on regional economic development is positive. As shown in
Table 4, the coefficient of Ln(
k) is between 0.2259 and 0.5574 and passed the inspection of the 1% significance level.
4.2.3. Estimated results over periods
We use the system GMM approach to empirically analyze the non-linear effect of inter-provincial market fragmentation on regional economic development during 1999–2007 and during 2008–2015, respectively. Estimated results over periods are shown in
Table 5.
The coefficient of the quadratic term of Ln(fra) is −0.0013, and the coefficient of the primary term of Ln(fra) is 0.0316 in the period of 1999–2007. The coefficient of the quadratic term of Ln(fra) is −0.0213 in the period of 2008–2015 and passed the inspection of the 1% significance level. The coefficient of the primary term of Ln(fra) is −0.1101 in the period of 2008–2015 and passed the inspection of the 1% significance level.
The critical value of fra in the period of 1999–2007 is greater than the critical value of fra in the period of 2008–2015. It is beneficial to maintain a lower degree of market fragmentation as time goes on. Since China’s reform and opening up, with marketization promotion, the market has played a more important role in the allocation of resources in regional economic development. The hindrance of inter-provincial market fragmentation to market scale and comparative advantage is also increasing with time. It is beneficial to maintain a lower degree of market fragmentation for the market scale and comparative advantage to be effective.
Meanwhile, maintaining moderate inter-provincial market fragmentation can reduce the outflow of production factors and taxes in a region, and thus increase the production factors and fiscal revenue in that region. The increase of production factors is conducive to regional economic development under the market mechanism. The increase of financial revenue provides financial support for the future development of the region under the government mechanism.
The effect of international openness on regional economic development is positive. As shown in
Table 5, the coefficient of Ln(
Open) is between 0.0210 and 0.0682 and passed the inspection of the 1% significance level. The effect of the capital-labor ratio on regional economic development is positive. As shown in
Table 5, the coefficient of Ln(
k) is between 0.2515 and 0.4980 and passed the inspection of the 1% significance level.
5. An Empirical Study on the Effect of Inter-Provincial Market Fragmentation on Regional Economic Development under the Influence of Provincial Governments’ Motivations
5.1. Empirical Design
There are various motivations for provincial governments to implement the policy of market fragmentation, including Social Stability, Fiscal Revenue Enhancement, and Official Positions Promotion. Under the influence of different motivations of provincial governments, will the effect of inter-provincial market fragmentation on regional economic development be different? Using a Cross-Terms Model, we conducted an empirical study on the effect of inter-provincial market fragmentation on regional economic development under the influence of provincial governments’ motivations.
We can draw a Cross-Terms Model is as follows:
where
refers to the motivation of provincial governments, and
refers to the cross-term between the motivation of provincial governments and inter-provincial market fragmentation of region
i at year
t. We take the partial derivative with respect to
on both sides of the equation as follows:
Let
. The moderate degree of inter-provincial market fragmentation is as follows:
Known as and , Equation (12) dictates that the motivations of provincial governments make it necessary to maintain a lower degree of inter-provincial market fragmentation for regional economic development if .
The motivations of provincial governments selected in this paper include Social Stability, Fiscal Revenue Enhancement, and Official Positions Promotion. The Social Stability (
sst) is to be measured by the proportion of employment in state-owned enterprises to the total employment in urban areas. The higher the proportion of employment in state-owned enterprises in total employment, the greater the pressure of local government to maintain social stability by maintaining a high employment rate, and the stronger the motivation to increase inter-provincial market fragmentation to protect local enterprises is. Fiscal Revenue Enhancement (
fre) is to be measured by the proportion of government financial expenditure to GDP. An increase in fiscal expenditure requires an increase in fiscal revenue. Facing financial pressure, provincial governments tend to increase fiscal revenue by strengthening inter-provincial market fragmentation. Official Positions Promotion (
opp) is to be measured by the ranking of GDP per capita in different provinces. Li and Zhou (2005) found that the likelihood of the promotion of provincial leaders increases with their economic performance, while the likelihood of termination decreases with their economic performance [
34]. Provincial government leaders pay more attention to the short-term economic development during their term of office. Inter-provincial market fragmentation can significantly lead to the short-term development of the regional economy. Therefore, provincial governments attempt to promote this short-term development by strengthening inter-provincial market fragmentation, to improve political performance and lead to the promotion of the official position.
5.2. Analysis of Empirical Results
In
Table 6, we report the empirical results of adding cross-terms. The cross-term of
sst and
fra is added in Model 7. The cross-term of
fre and
fra is added in Model 8. The cross-term of
opp and
fra is added in Model 9. All three cross-terms are added in Model 6.
As shown in
Table 6, the inter-provincial imposes an inverted U-shaped influence on regional economic development in China, which is consistent with the estimated results in
Table 3. This proves that the estimation results in
Table 3 are robust.
The coefficient of Ln(fra) × Ln(sst) is 0.0637 and 0.0675, respectively, in Model 6 and Model 7 and passed the inspection of the 1% significance level. The coefficient of Ln(fra) × Ln(fre) is −0.0550 and −0.0326, respectively, in Model 6 and Model 8 and passed the inspection of the 5% significance level. The coefficient of Ln(fra) × Ln(opp) is 0.0180 and 0.0314, respectively, in Model 6 and Model 9. Thus, Fiscal Revenue Enhancement requires the maintenance of a lower degree of inter-provincial market fragmentation for regional economic development, and Social Stability and Official Positions Promotion make it necessary to maintain a higher degree of inter-provincial market fragmentation for regional economic development.
Compared with Social Stability and Official Positions Promotion, Fiscal Revenue Enhancement has a negative influence on the effect of inter-provincial market fragmentation on regional economic development. The motivations of Social Stability and Official Positions Promotion of provincial governments are strongly constrained by the central government. The central government is more inclined to restrain the provincial government’s strategy of inter-provincial market fragmentation for the market scale and comparative advantage to be effective. Provincial governments need a high amount of funds in the process of economic governance and social governance. Provincial governments have a strong motivation to increase fiscal revenue by implementing the strategy of inter-provincial market fragmentation.
The effect of international openness on regional economic development is positive. As shown in
Table 6, the coefficient of Ln(
Open) is between 0.1907 and 0.2144 and passed the inspection of the 1% significance level. The effect of the capital-labor ratio on regional economic development is positive. As shown in
Table 6, the coefficient of Ln(
k) is between 0.3101 and 0.5174 and passed the inspection of the 1% significance level.
6. Conclusions
This paper measures the inter-provincial market fragmentation by adopting an adjusted priced-based approach from the Law of One Price using a three-dimensional panel of annual price on eight goods categories across 31 provinces in Mainland China during 1999–2015. By using the system GMM approach, we analyze the non-linear effect of inter-provincial market fragmentation on regional economic development and its differences in various regions and periods. By constructing a Cross-Terms Model, we analyze the influence of various motivations of provincial governments on the non-linear relationship between inter-provincial market fragmentation and regional economic development.
Chinese domestic market fragmentation appeared to cause a fluctuating decline during 1999–2015. The degree of market fragmentation between provinces in the same economic regions was higher than the degree of market fragmentation between provinces across different economic regions. The degree of market fragmentation of municipalities directly under the central government (Beijing, Shanghai, Tianjin, and Chongqing) was relatively higher.
We argue that the inter-provincial market fragmentation imposes an inverted U-shaped influence on regional economic development. When the degree of market fragmentation is lower than a certain value, the positive effect of inter-provincial market fragmentation on regional economic development is stronger than its negative effect. Conversely, when the degree of market fragmentation is beyond a certain value, the positive effect of inter-provincial market fragmentation on regional economic development is weaker than its negative effect. It is necessary to maintain moderate market fragmentation for the promotion of regional economic development.
Furthermore, there is a difference in periods and regions in terms of the effect of inter-provincial market fragmentation on regional economic development. It is beneficial to maintain a lower degree of market fragmentation as time goes on for the market scale and comparative advantage to be effective. As far as regional heterogeneity is concerned, it is necessary to maintain a lower degree of market fragmentation in Eastern and Central China for regional economic development. Conversely, it is necessary to maintain a higher degree of market fragmentation in Western China. A proper increasing degree of market fragmentation in Western China can reduce the outflow of production factors and taxes, and thus make a greater contribution to regional economic development.
Compared with Social Stability and Official Positions Promotion, the motivation of Fiscal Revenue Enhancement requires the maintenance of a lower degree of inter-provincial market fragmentation for regional economic development.
At present, China’s economic development has entered a new stage. The growth rate of fiscal revenue in China has declined. Meanwhile, fiscal expenditure shows a trend of rigid growth in China. Furthermore, the contradiction between revenue and expenditure is prominent. In this context, it is necessary to speed up the reform of the tax system, optimize the structure of the tax system, gradually increase the proportion of direct tax, and establish a perfect local tax system. Moreover, local governments in China should effectively manage local debt issuance, increase the deficit rate, and expand the scale of deficit, and correspondingly increase the new debt limit of local governments.


