Bus Rapid Transit System: A Study of Sustainable Land-Use Transformation, Urban Density and Economic Impacts

Abstract
1. Introduction
2. Literature Review
3. Materials and Methods
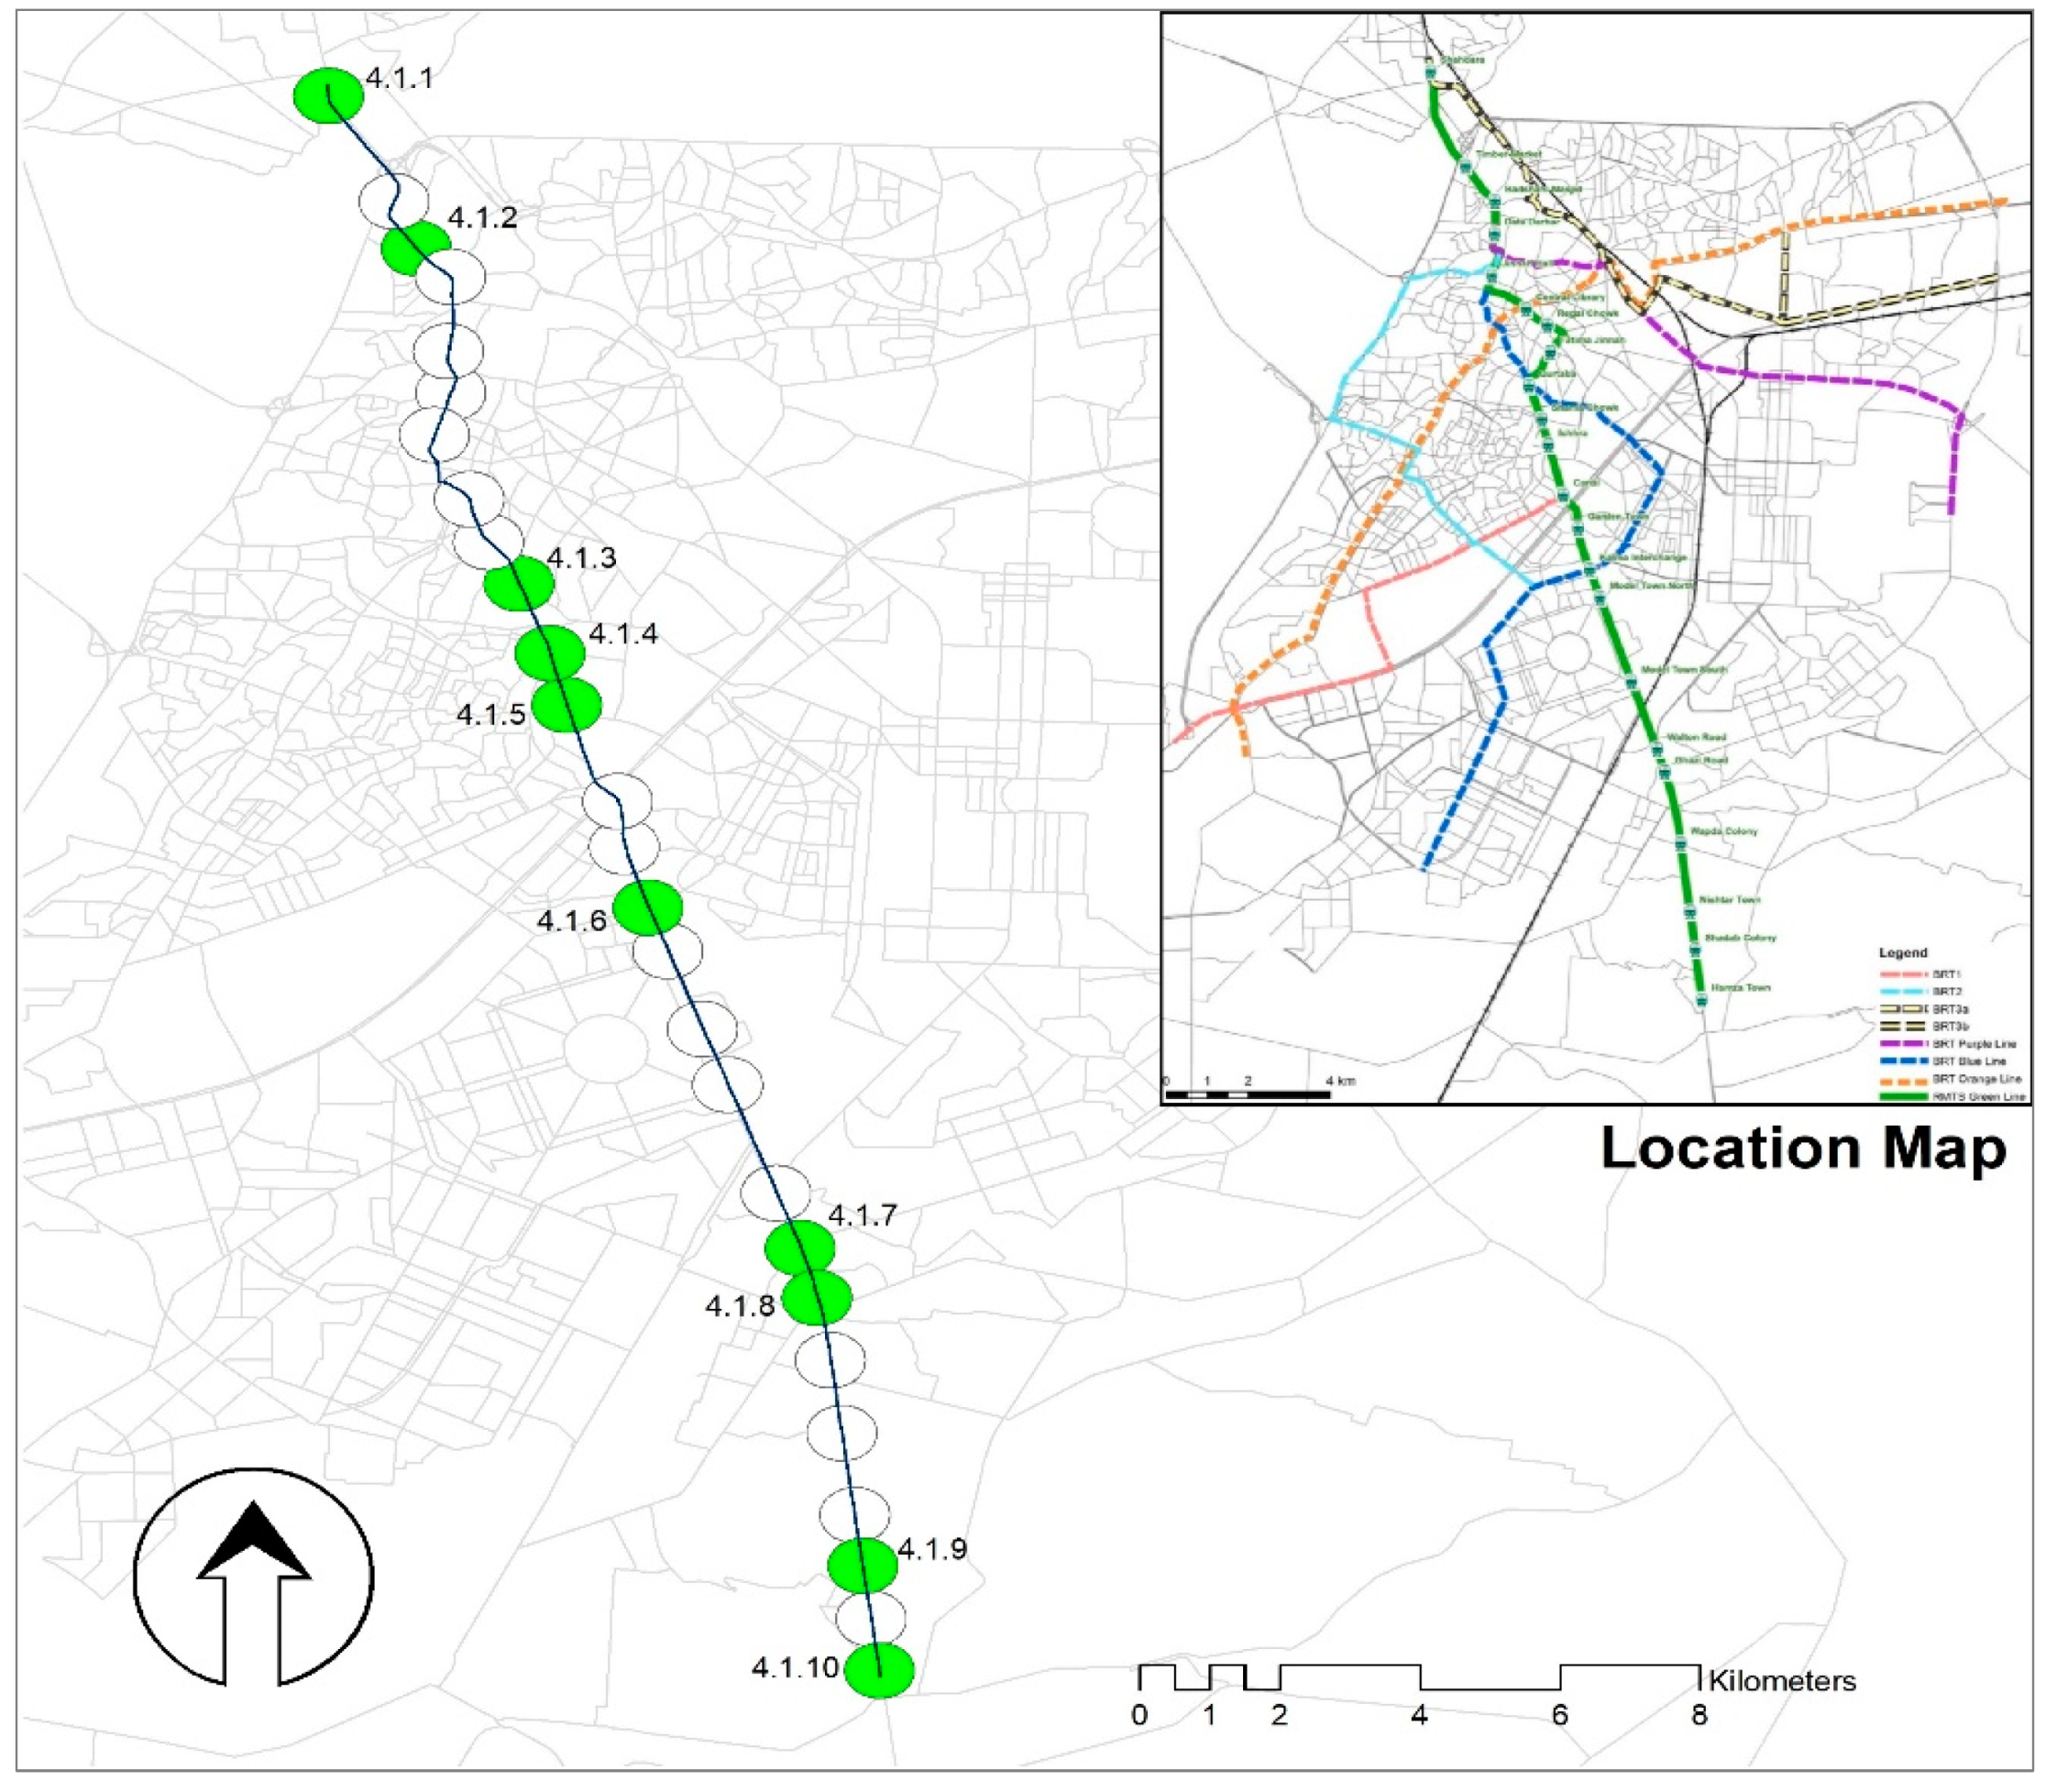
3.1. Study Area
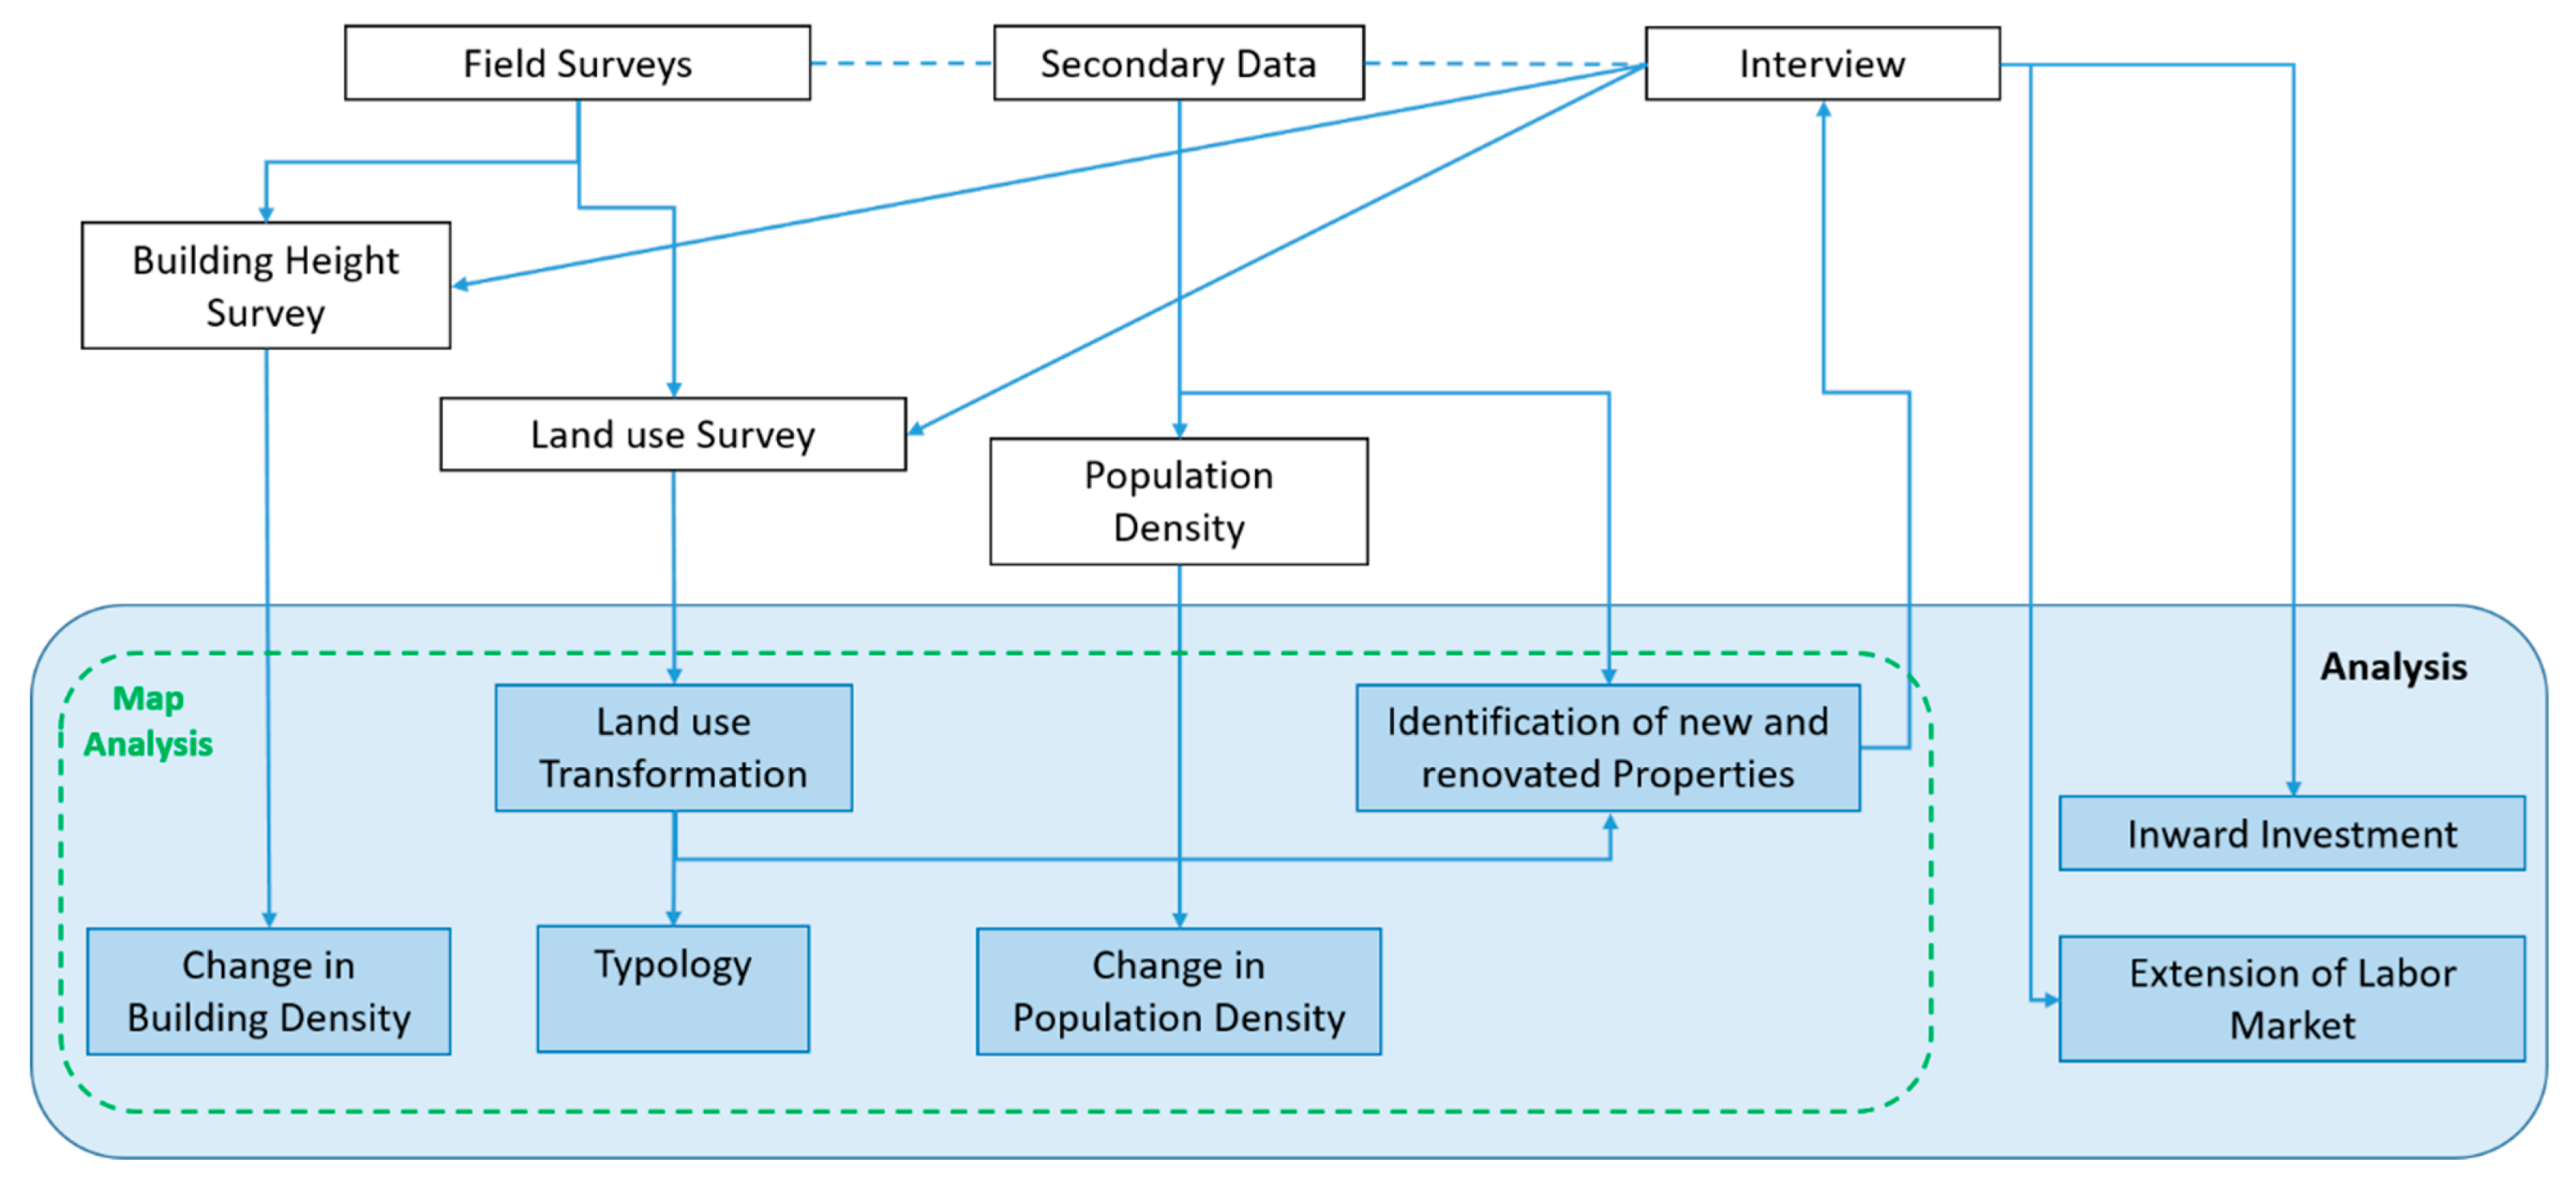
3.2. Methodology
4. Results and Discussion
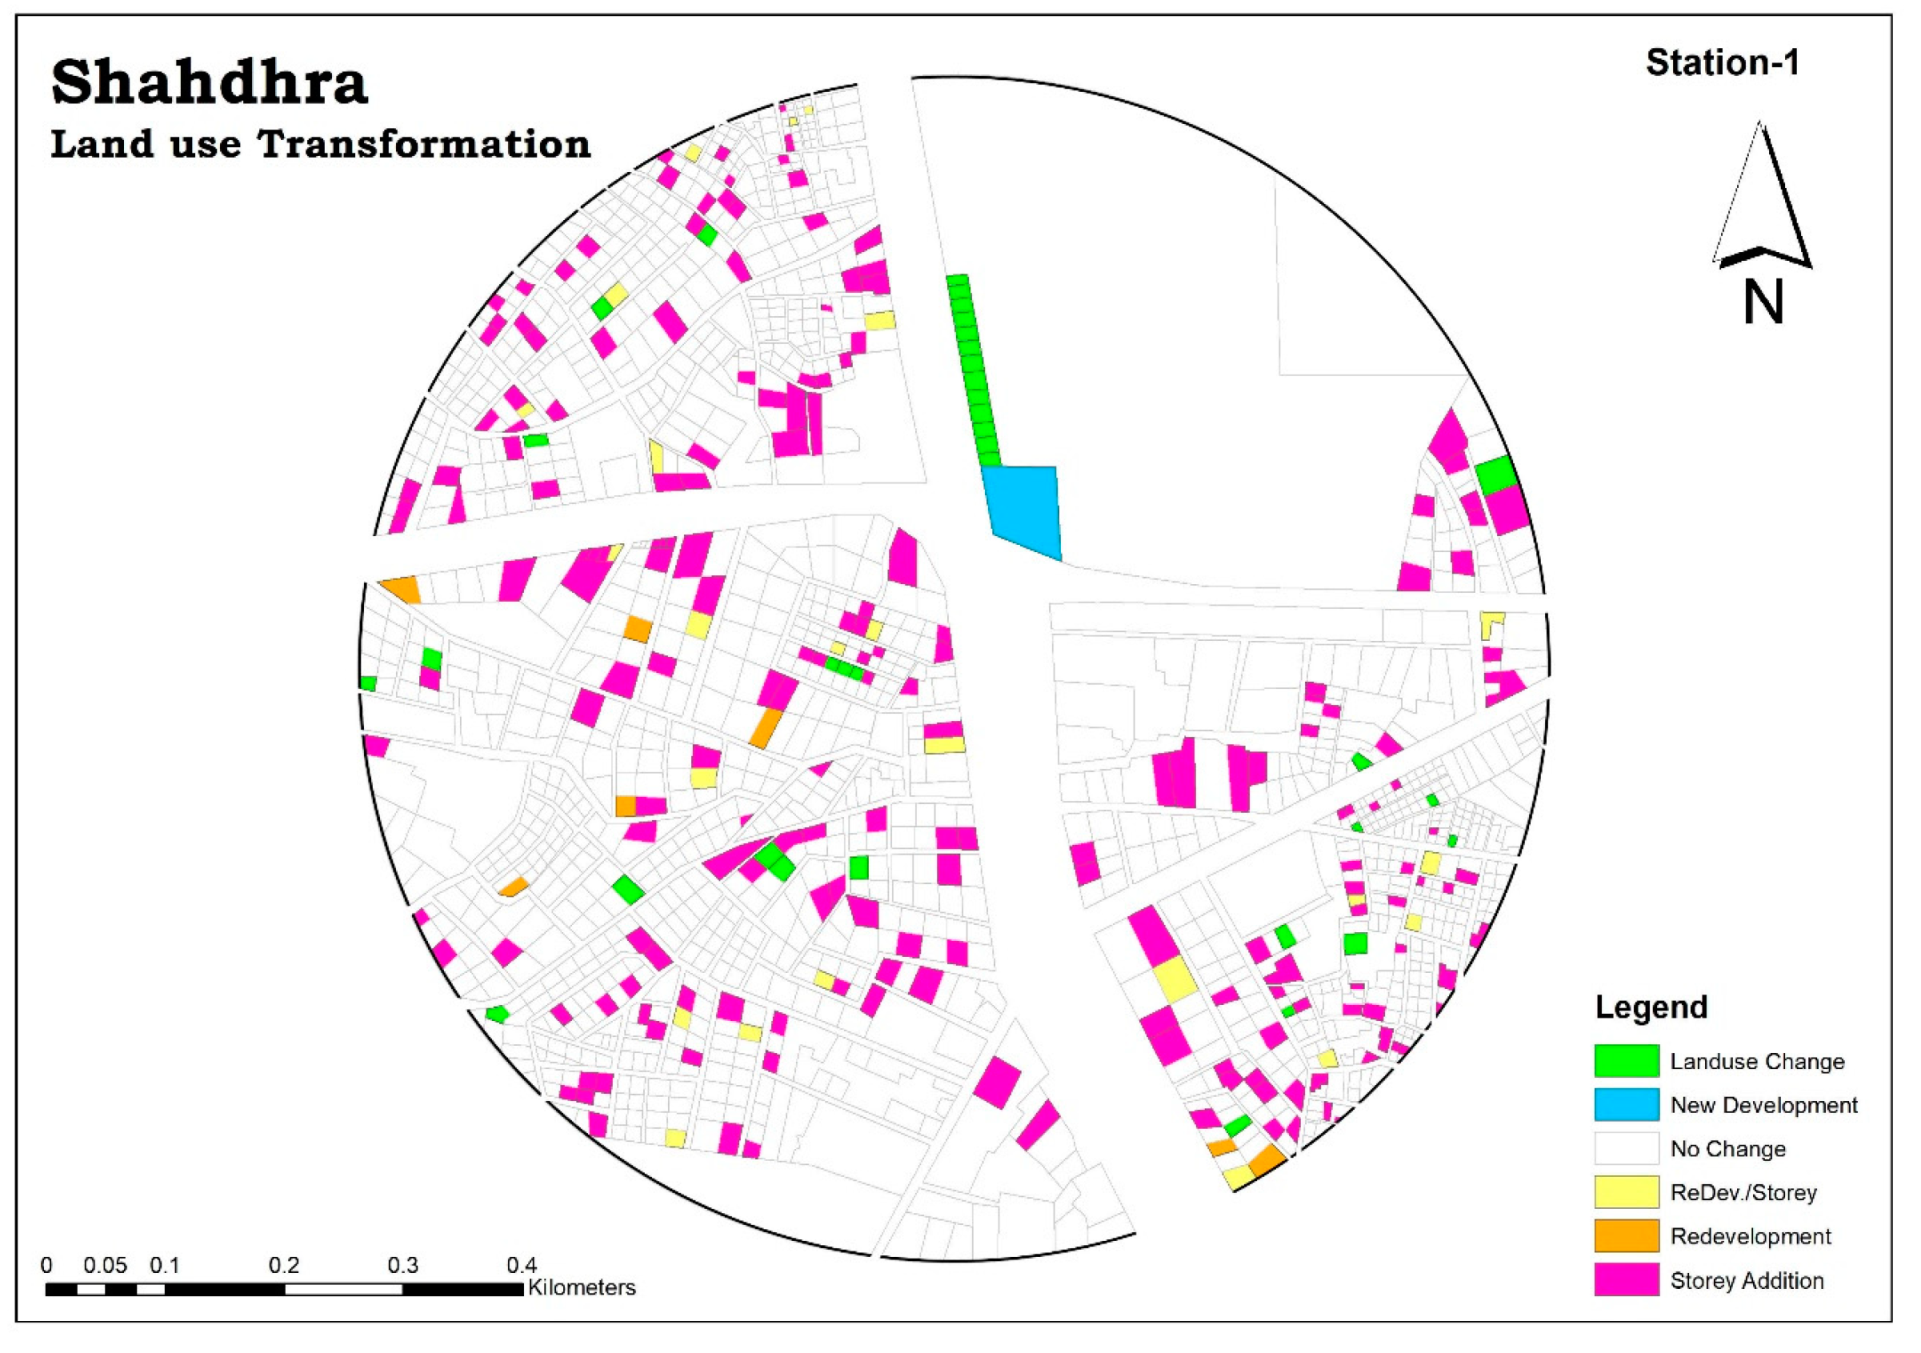
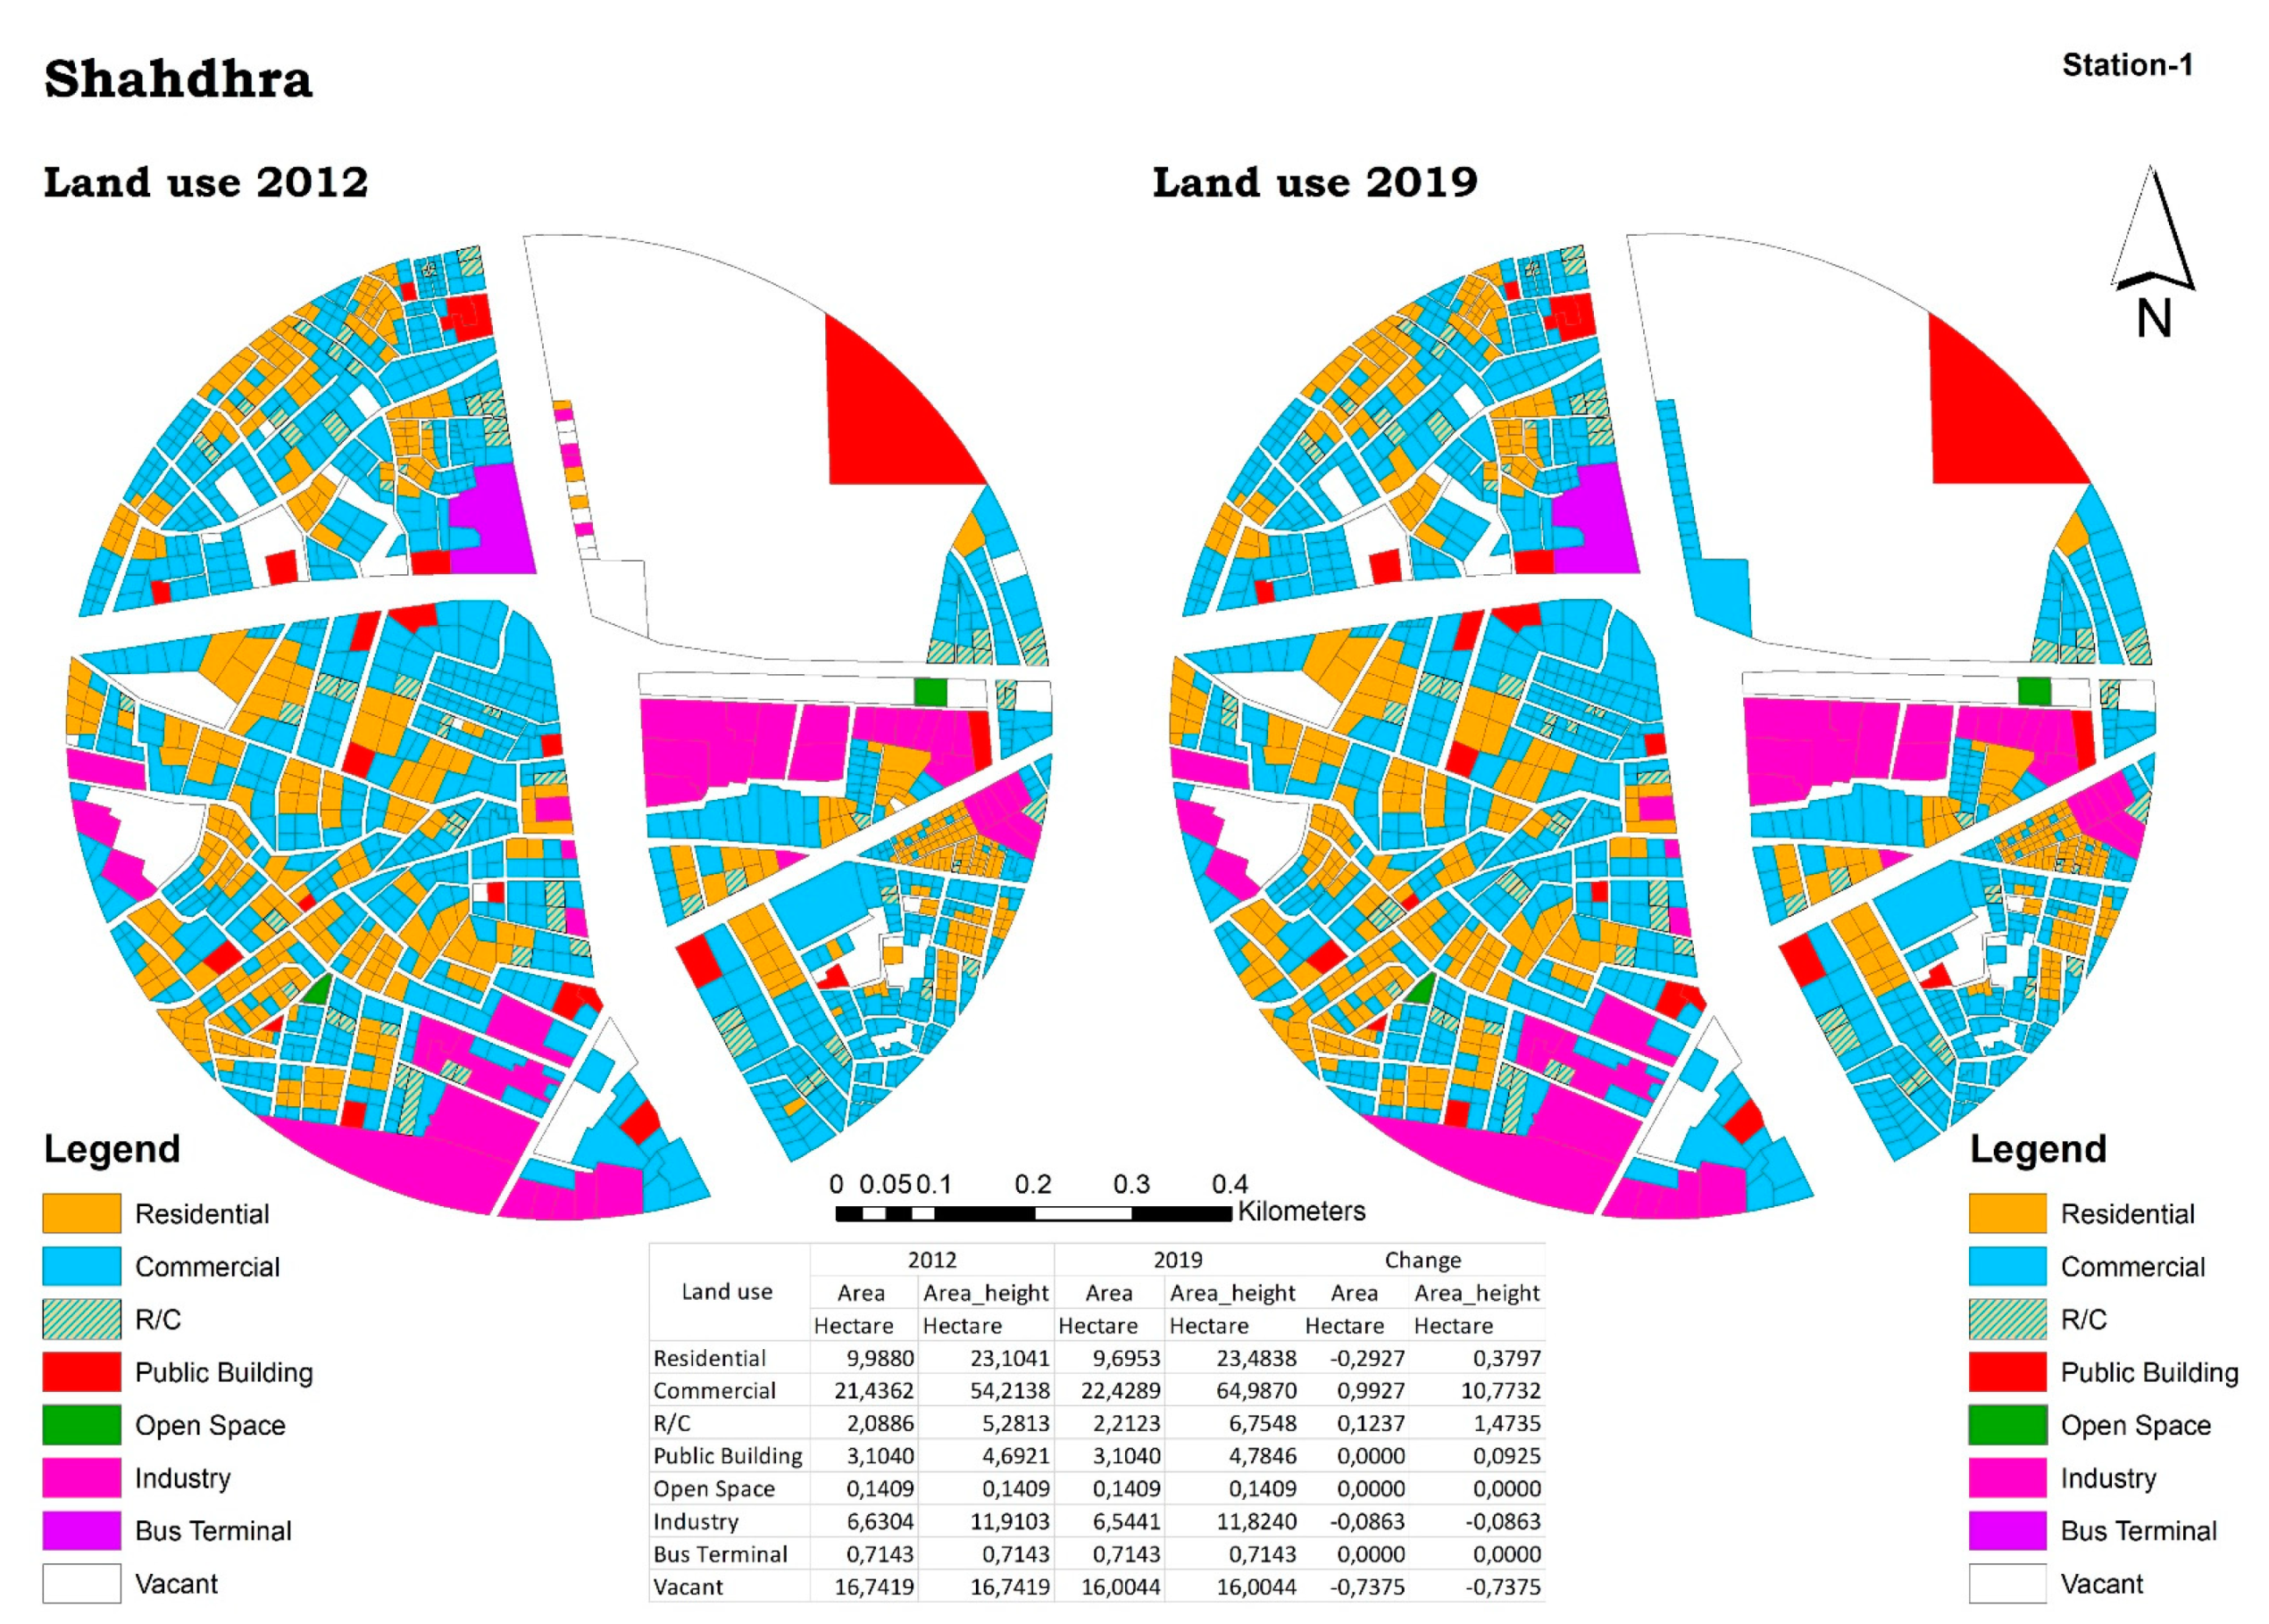
4.1. Land-Use Change Transformation
4.1.1. Station-1: Shahdara Station
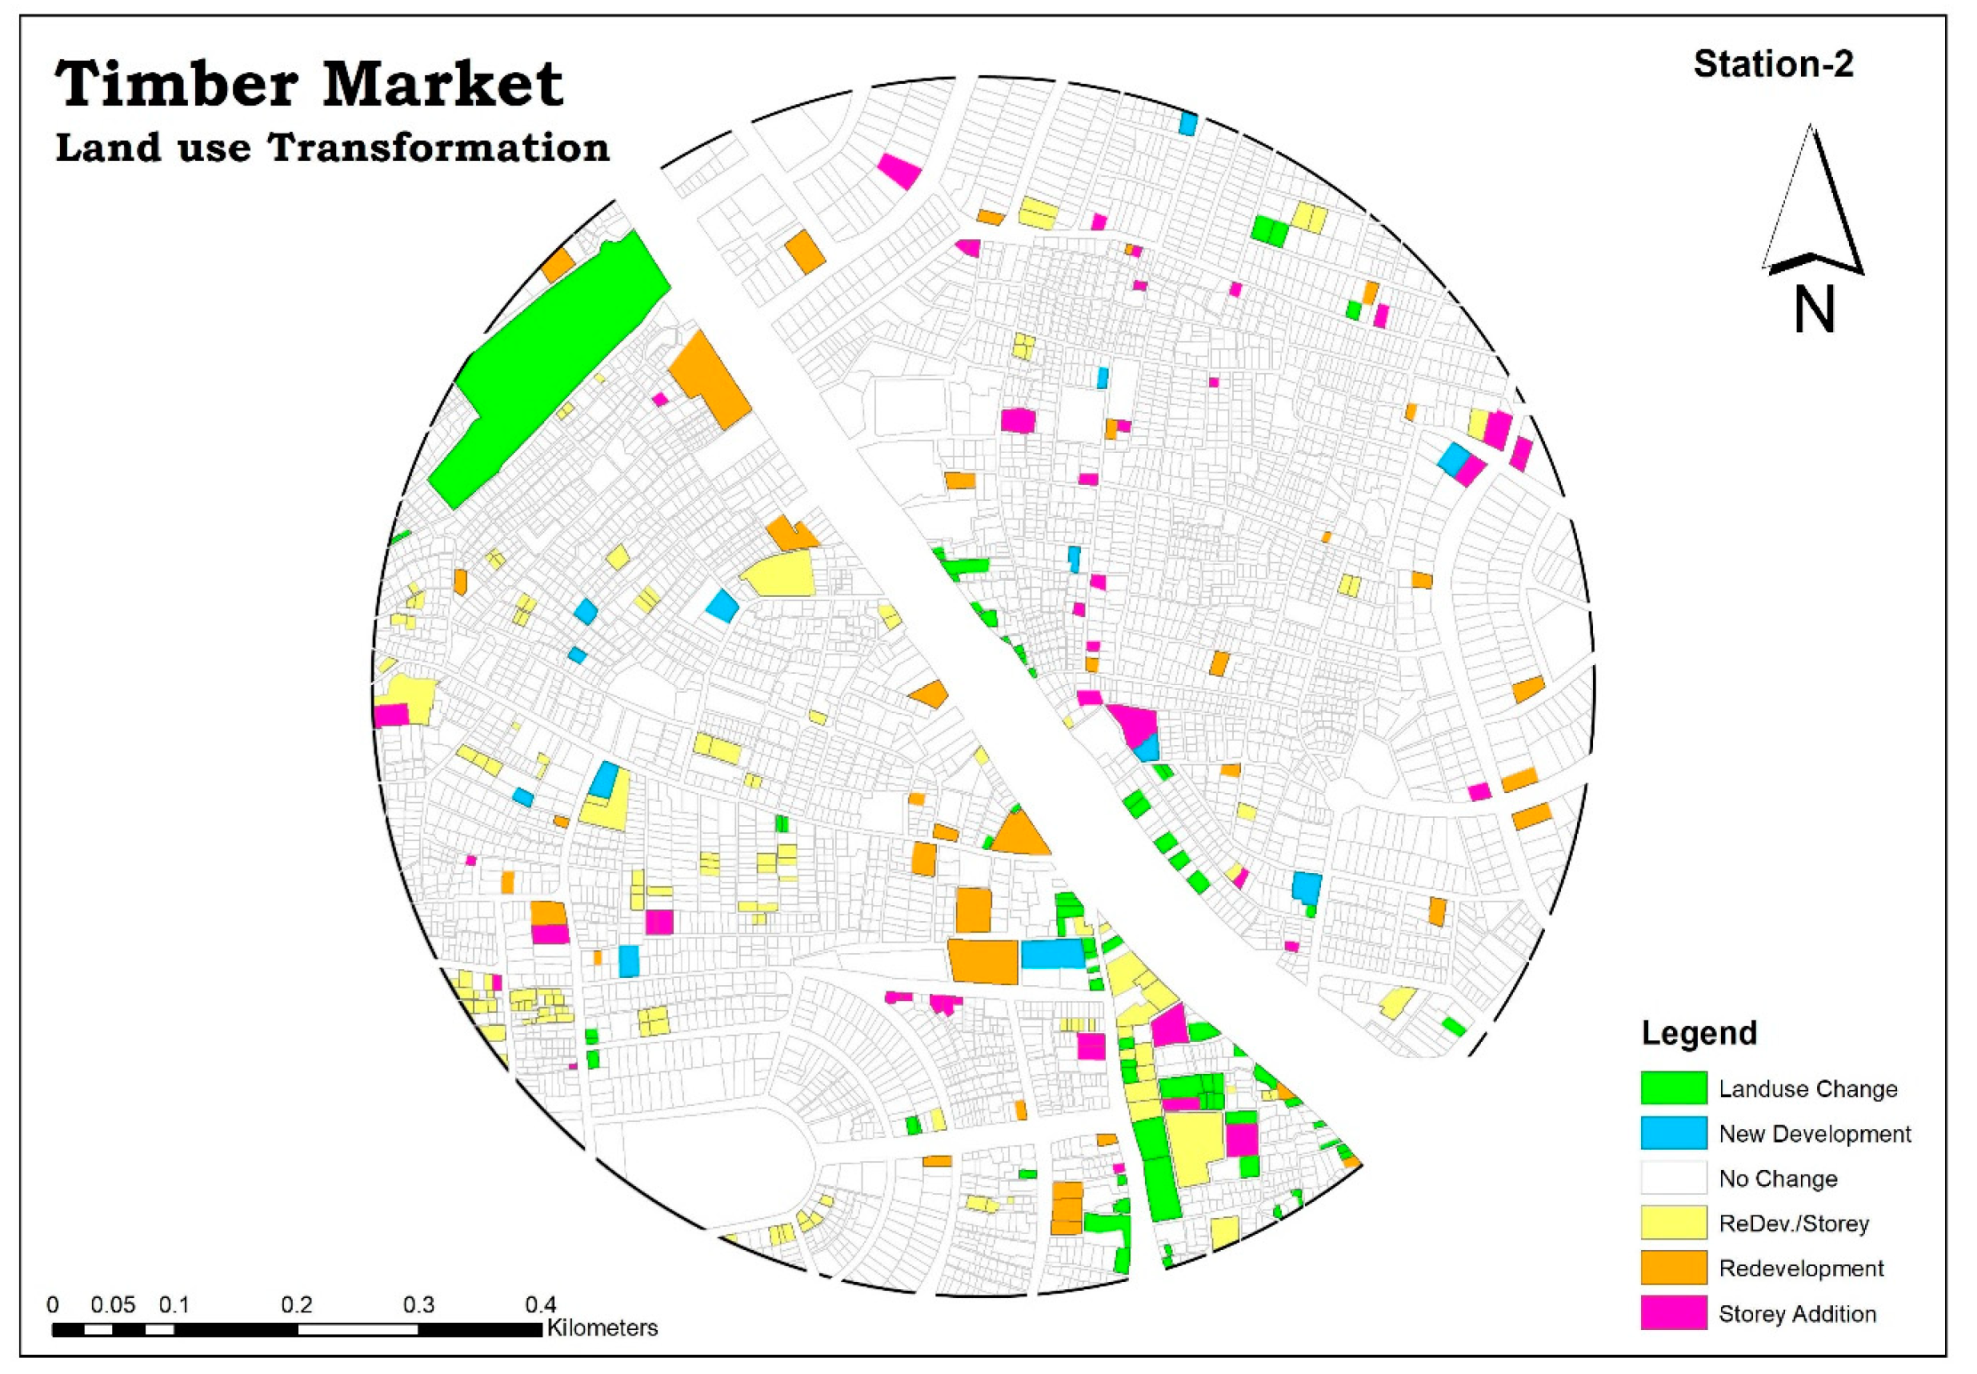
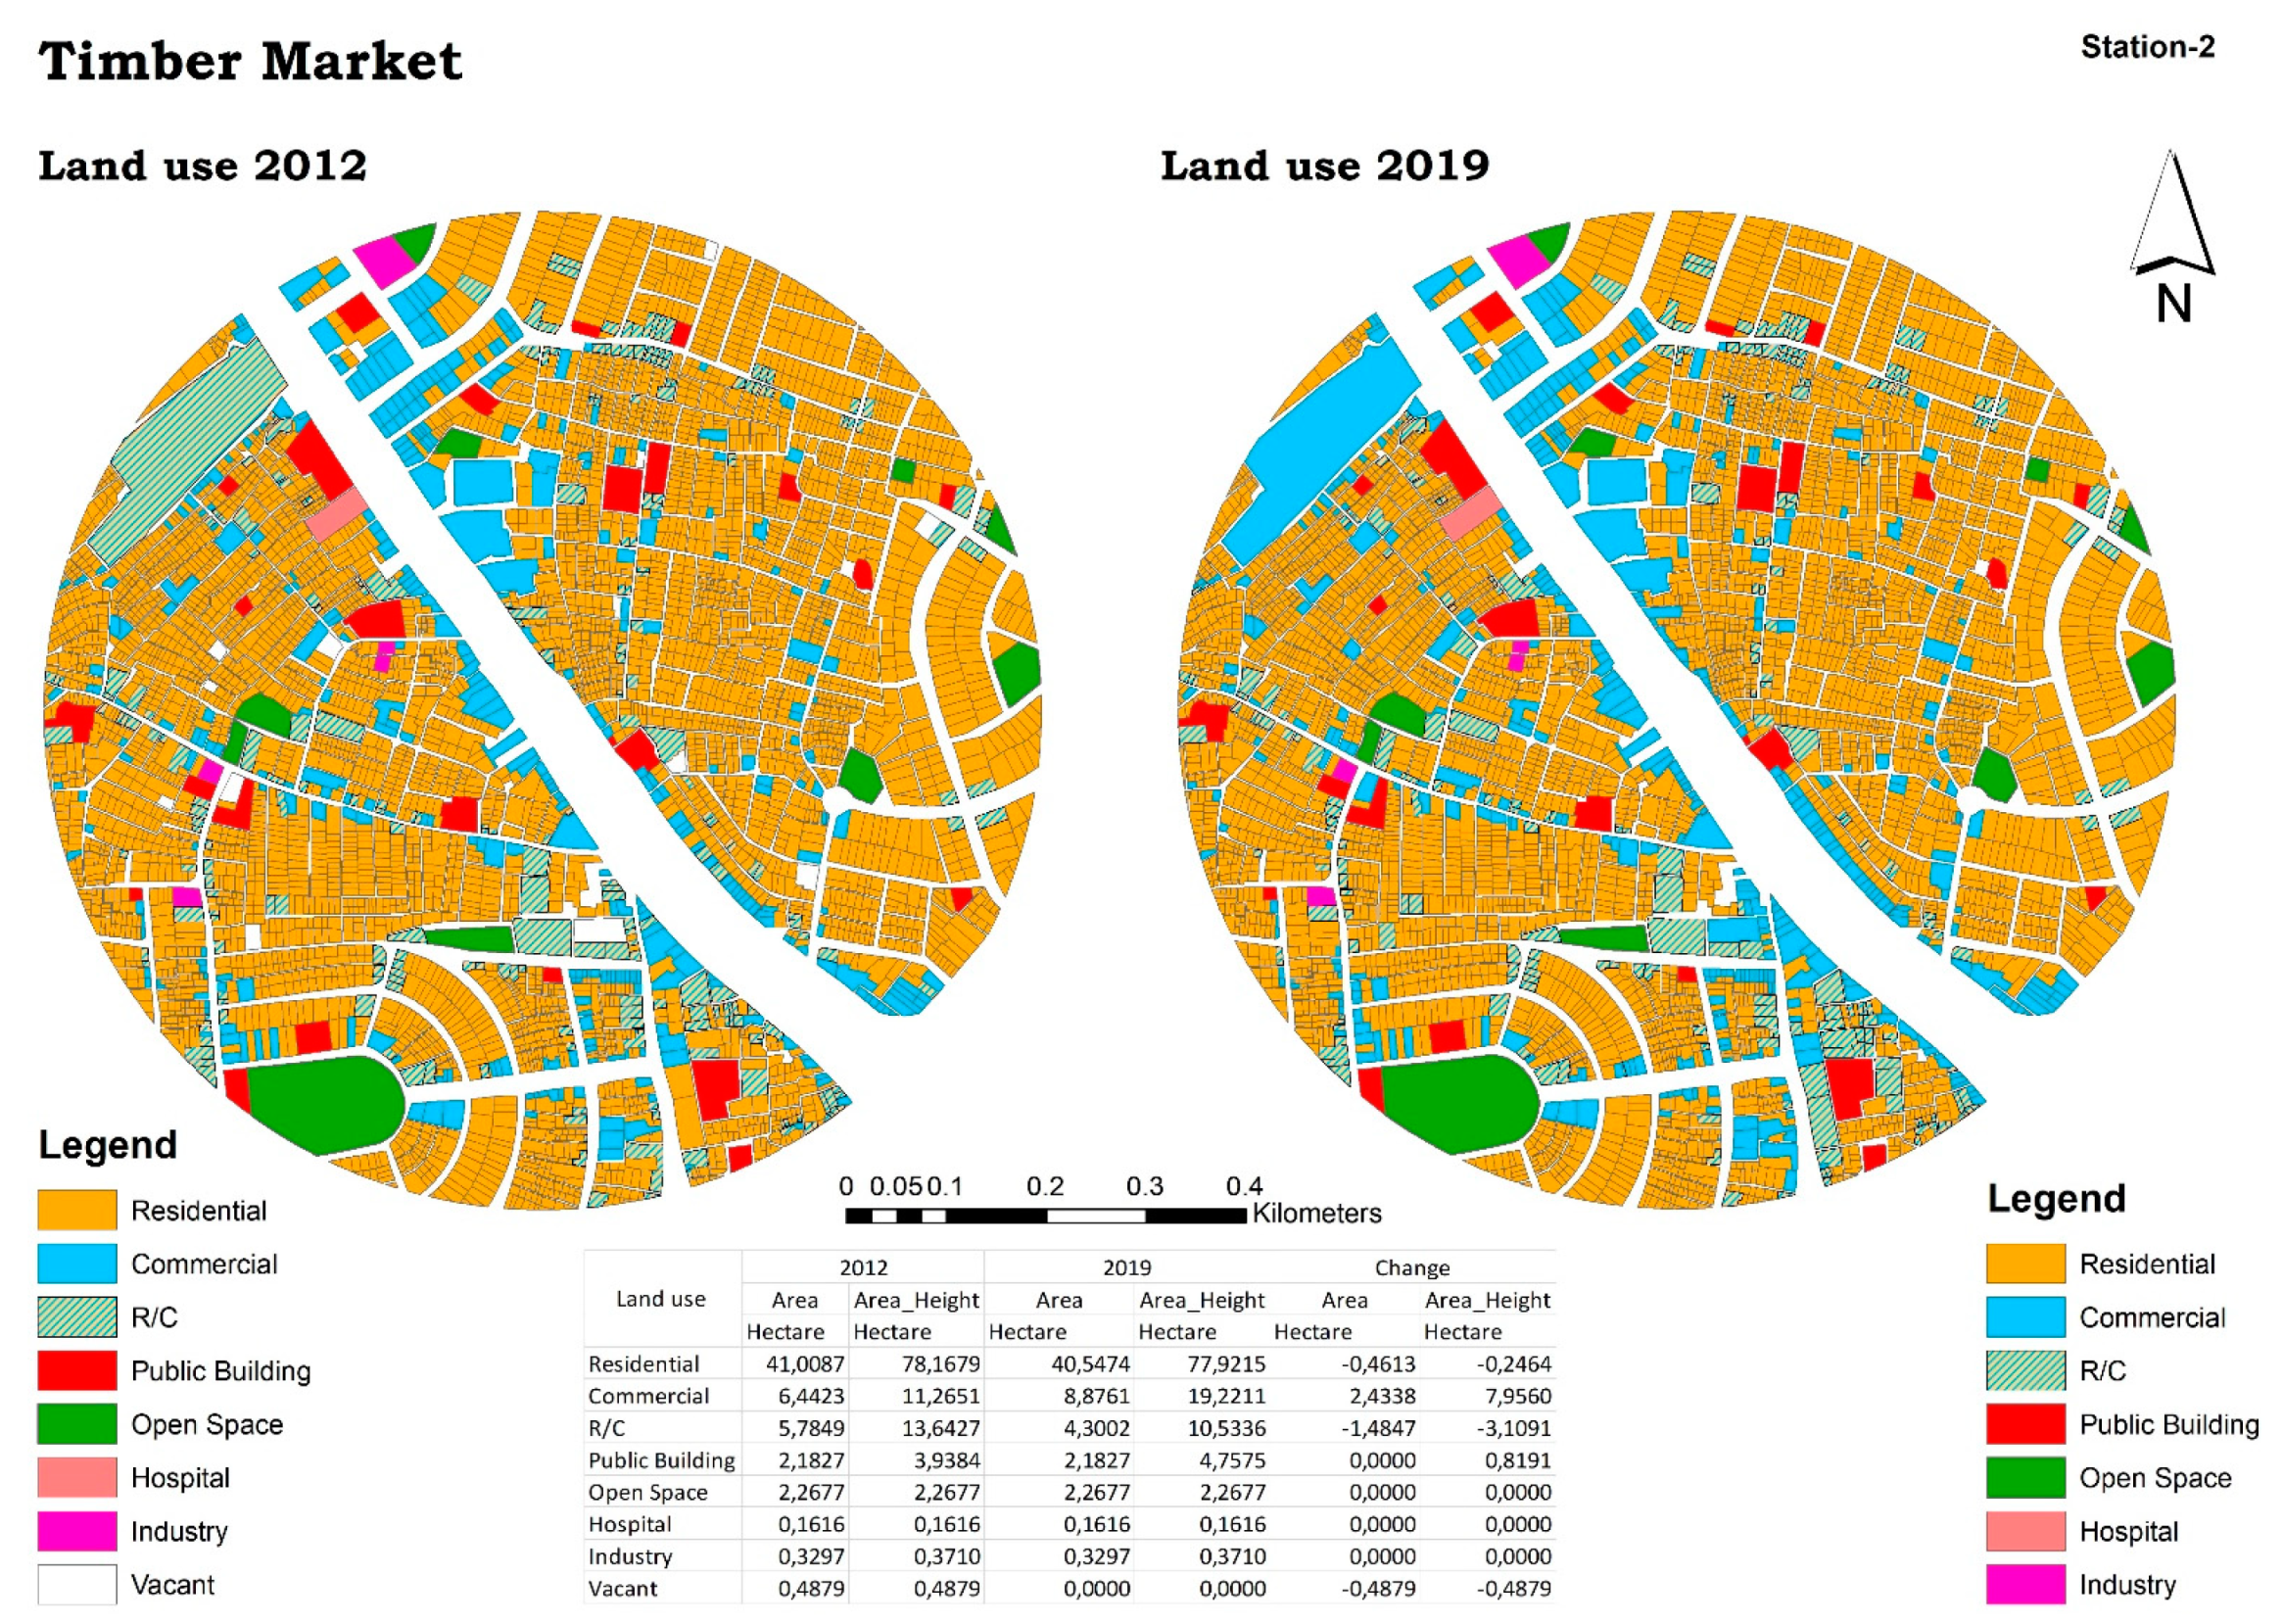
4.1.2. Station-2: Timber Market
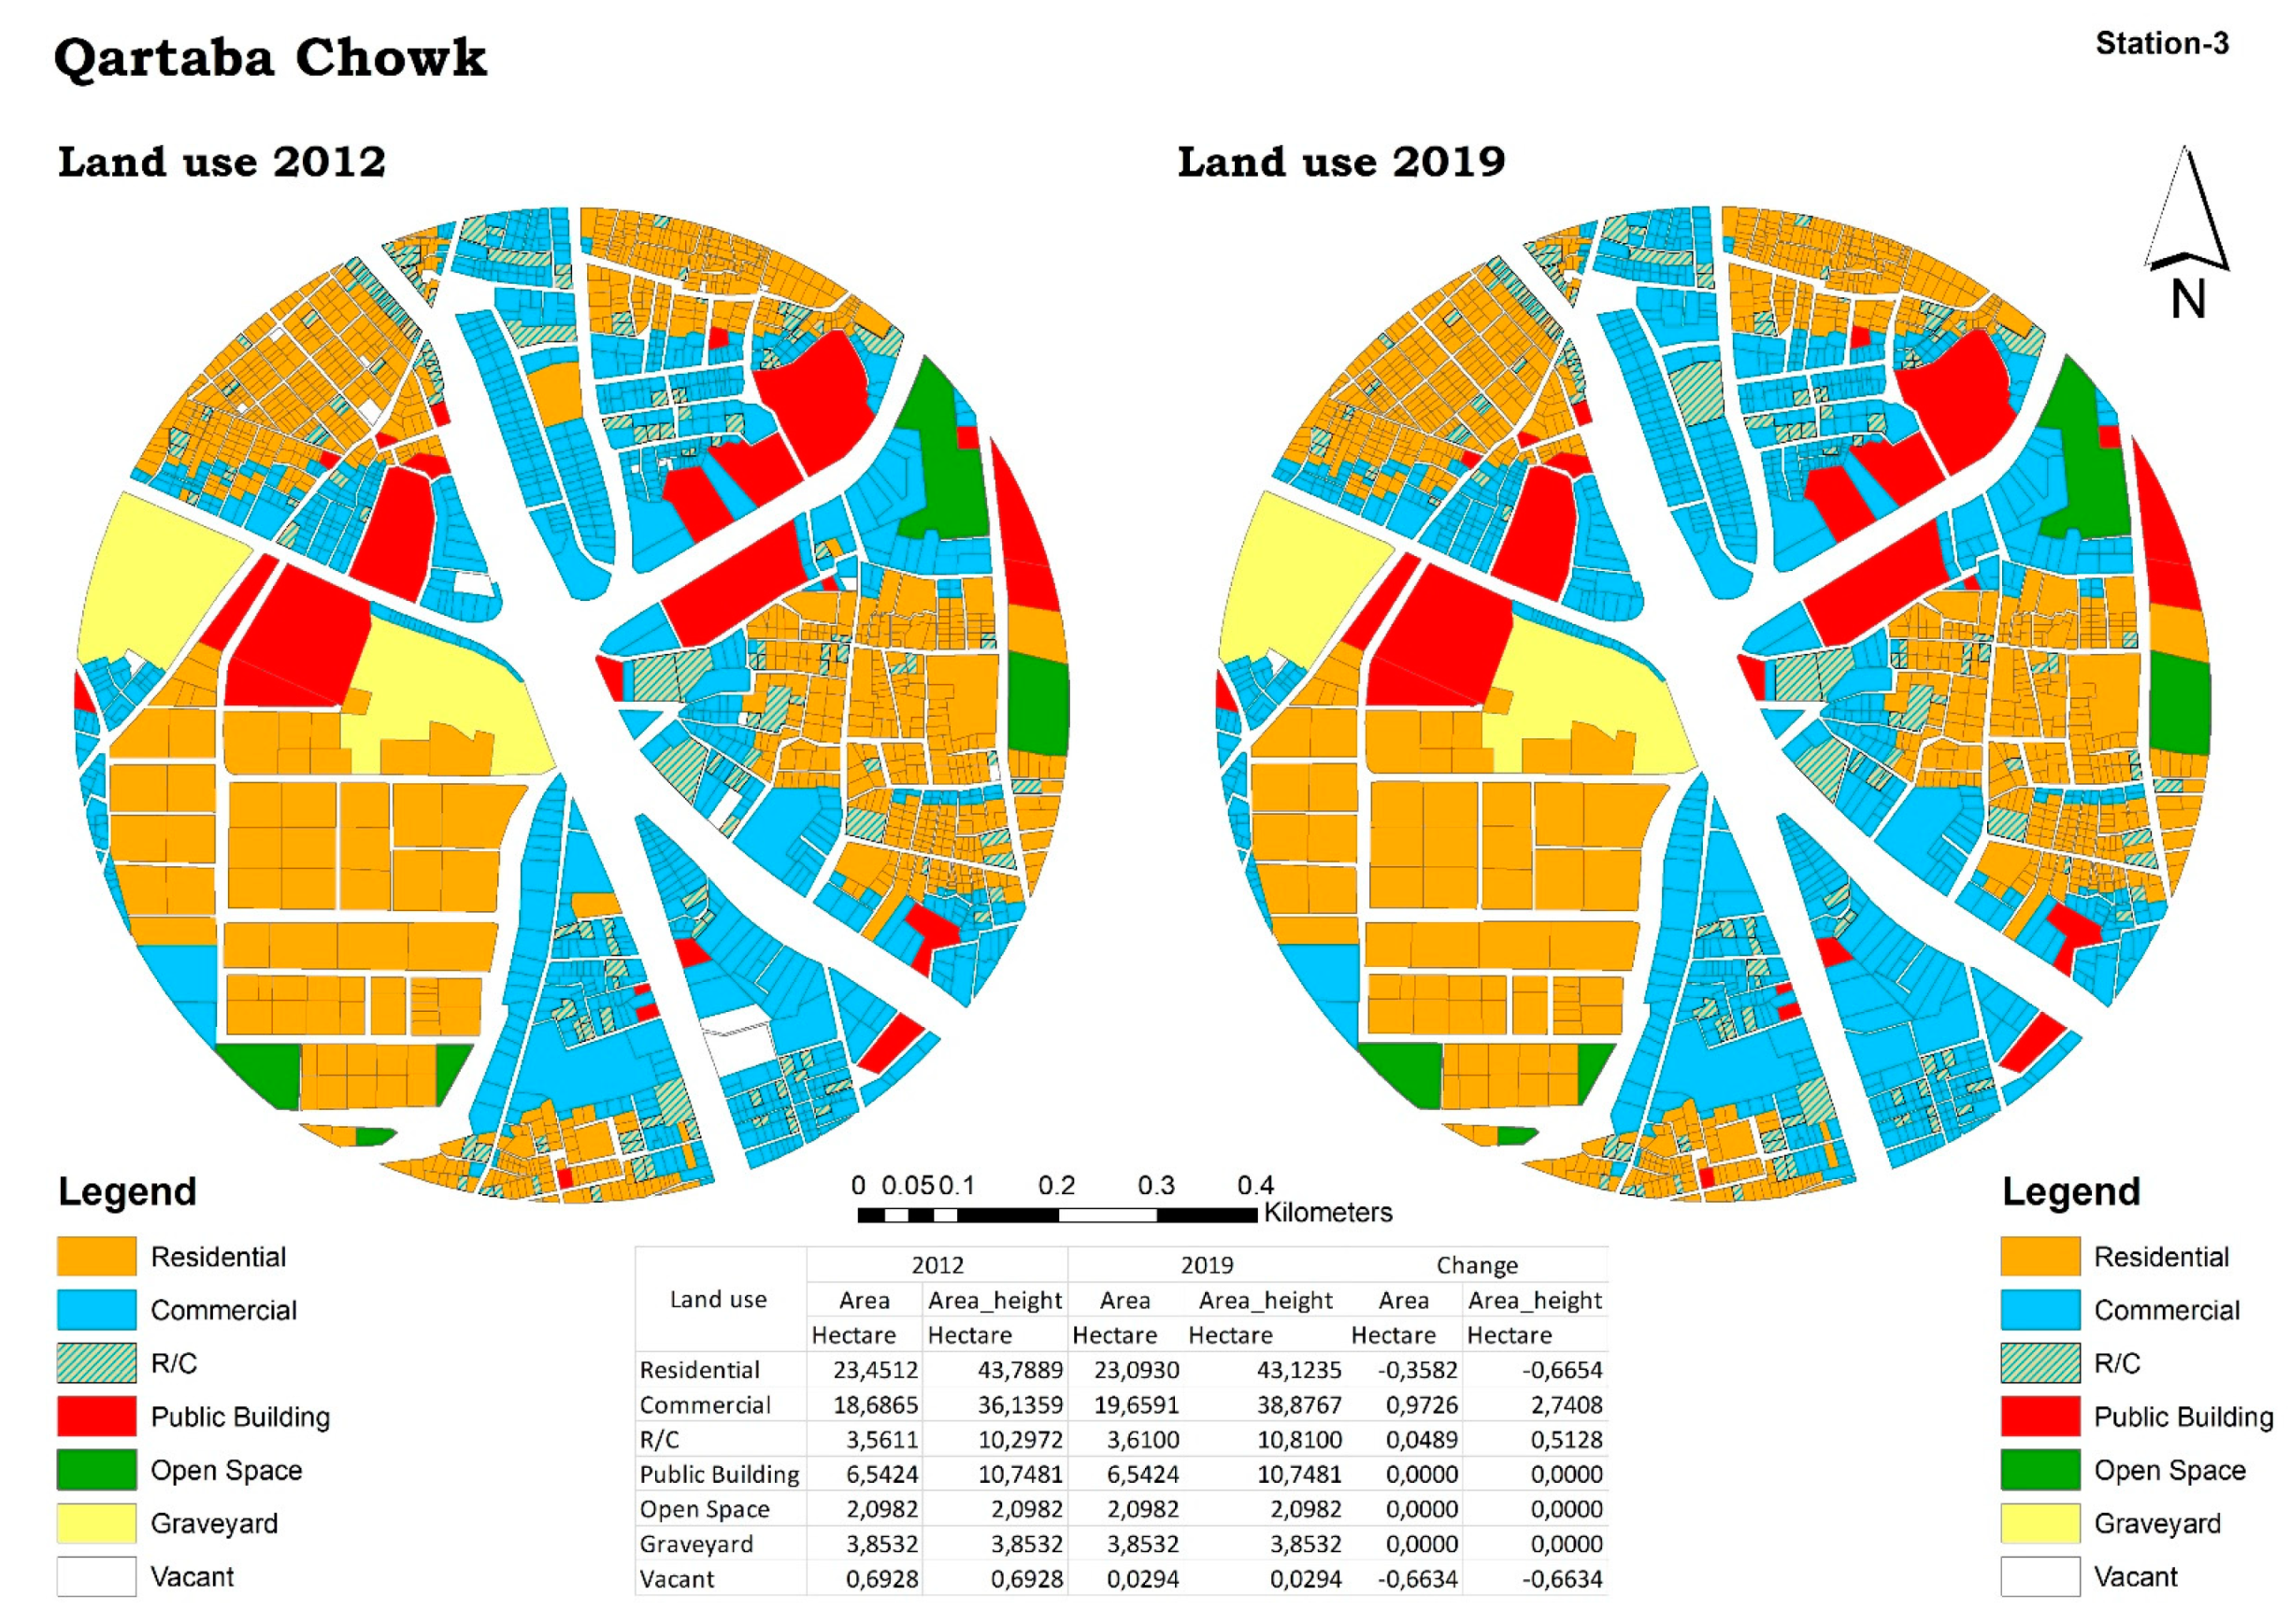
4.1.3. Sration-3: Qartaba Chowk
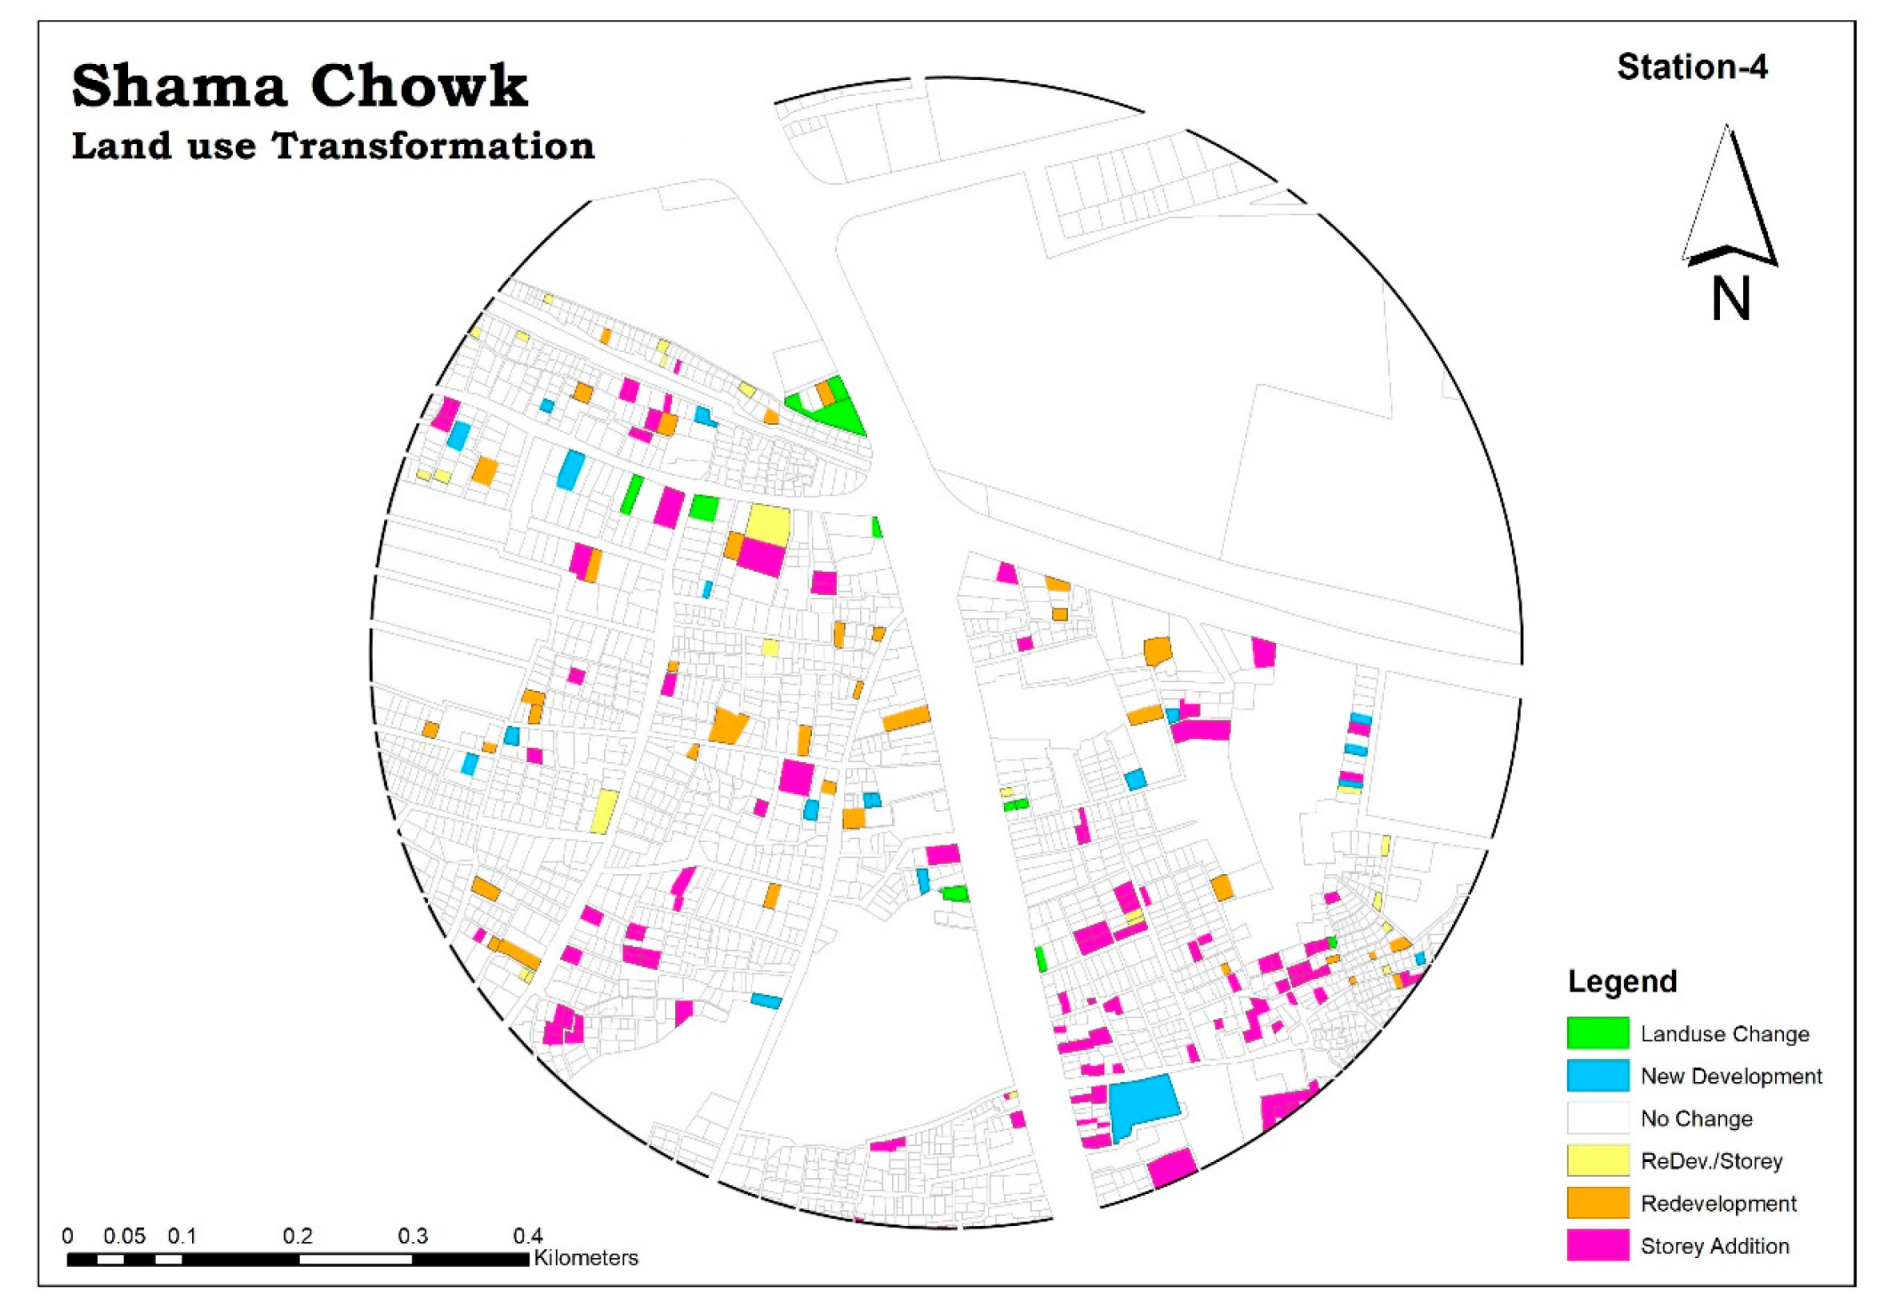
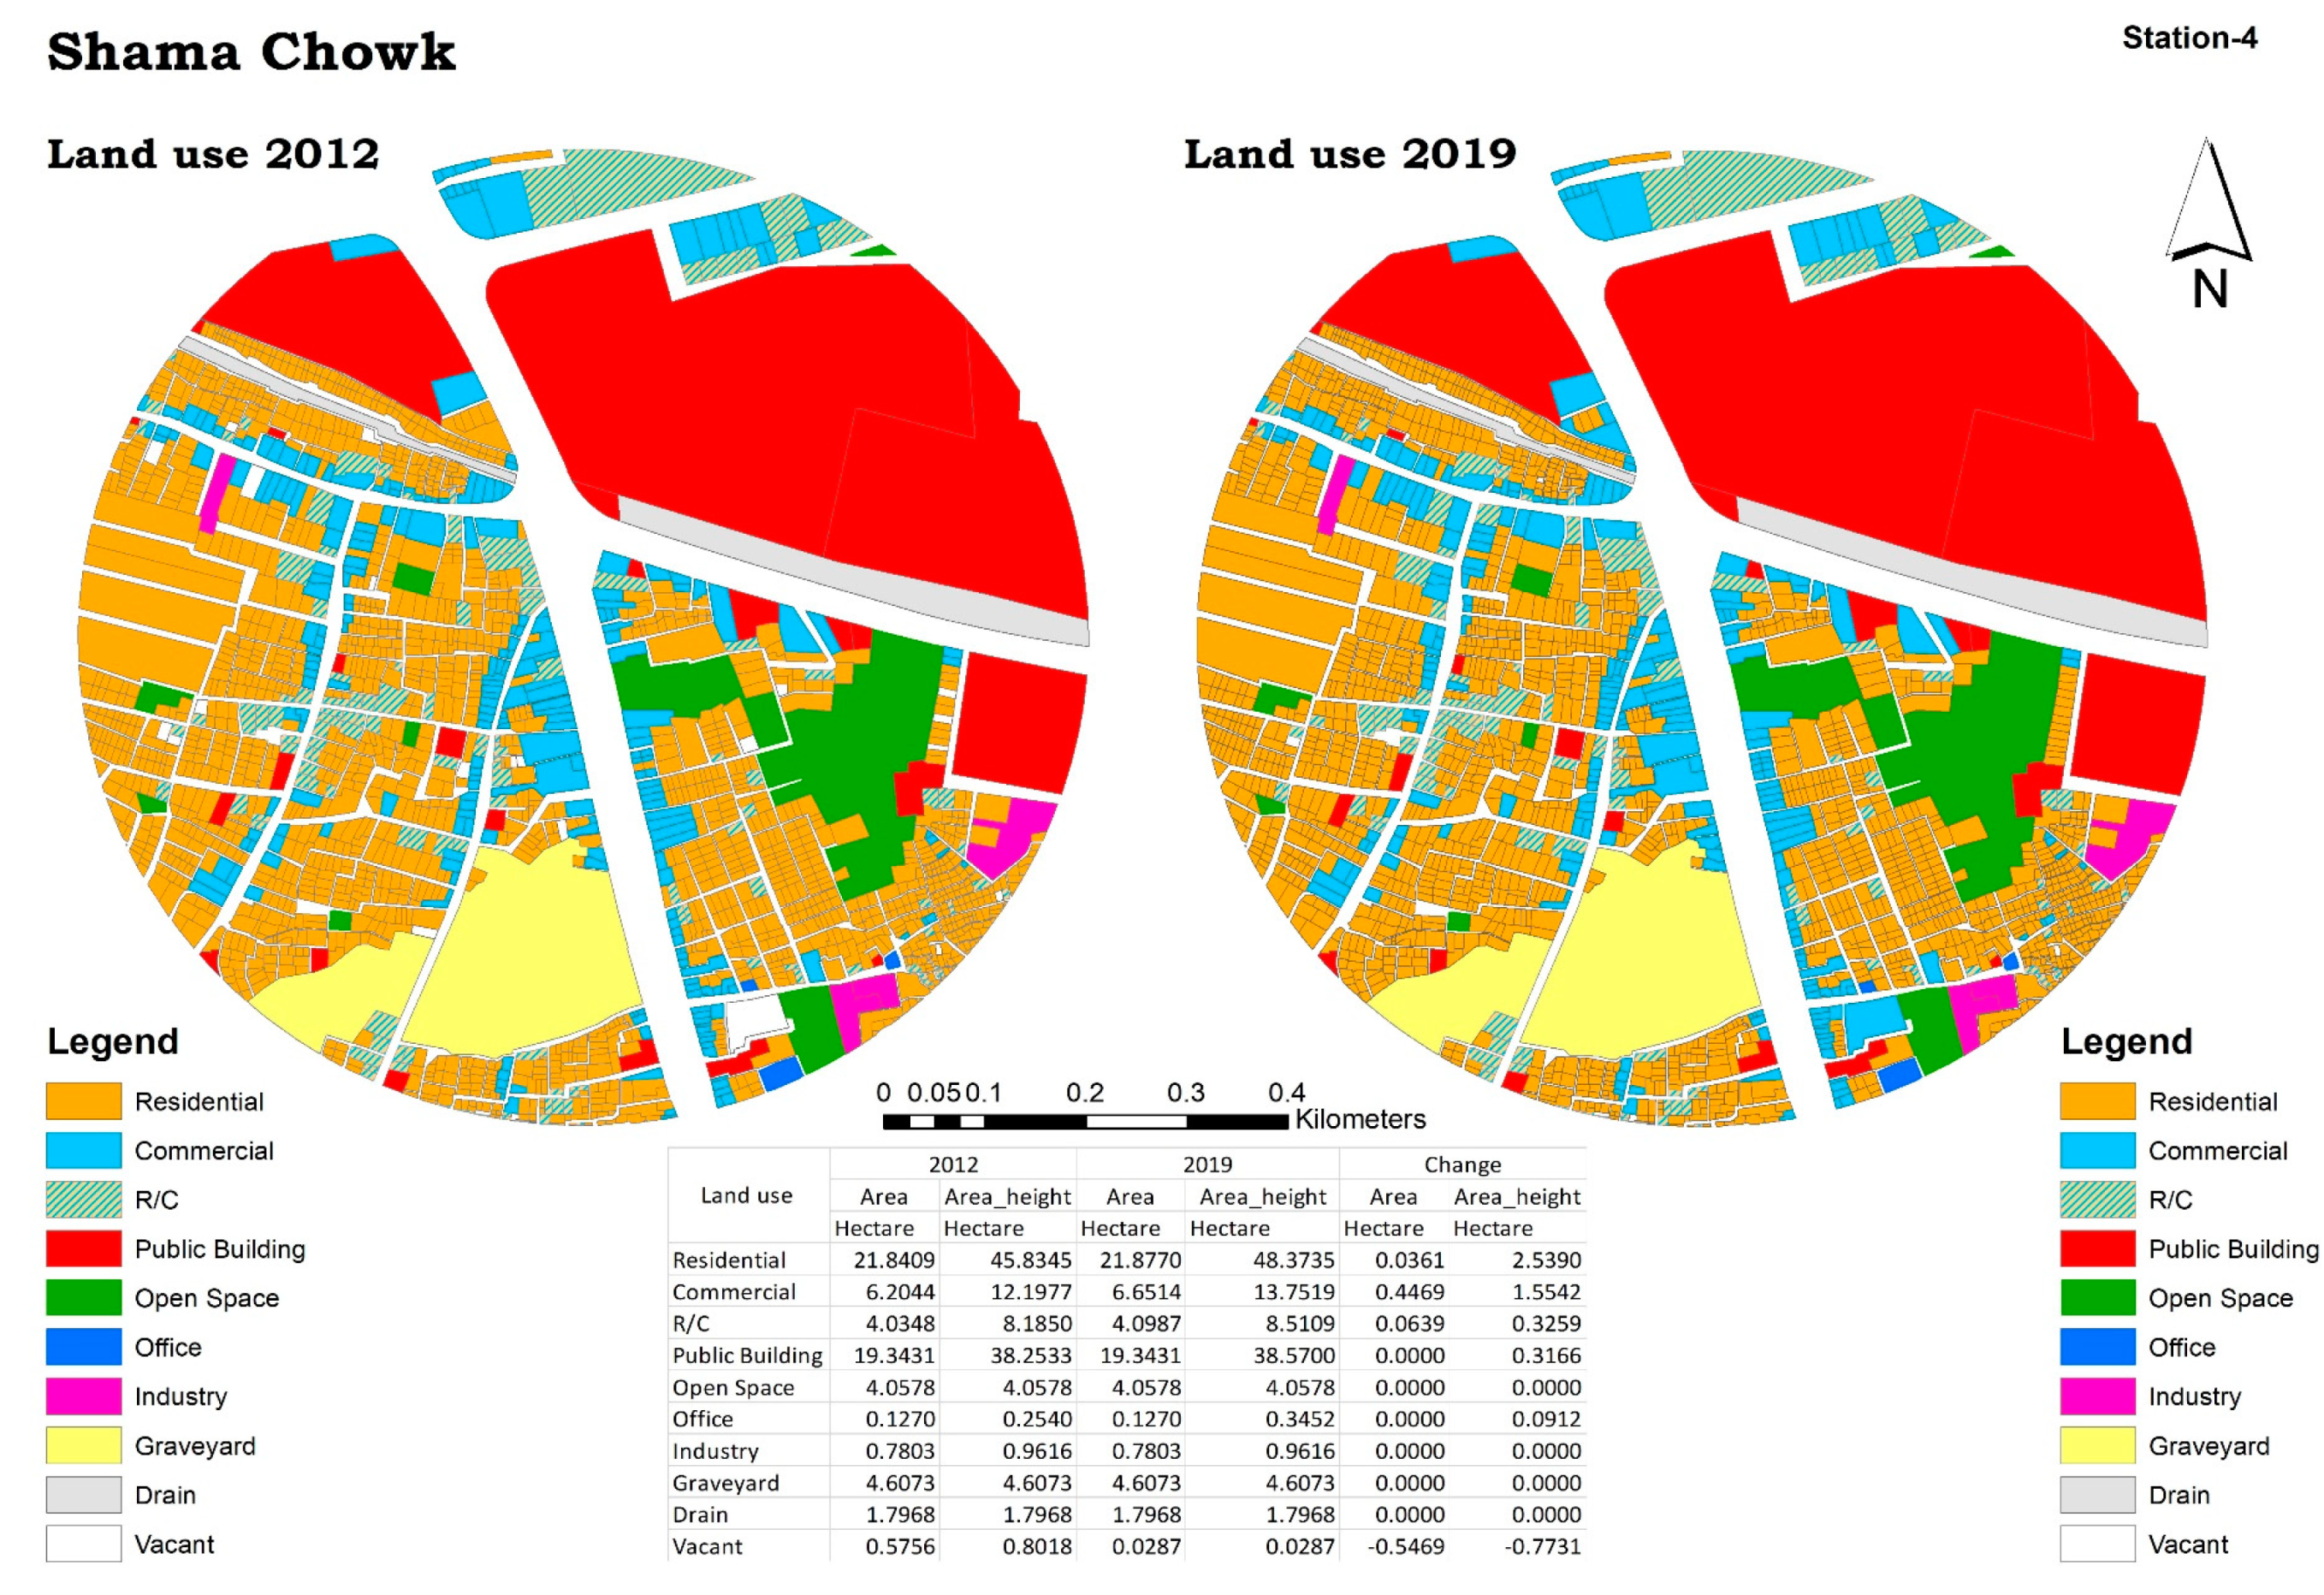
4.1.4. Station-4: Shama Chowk
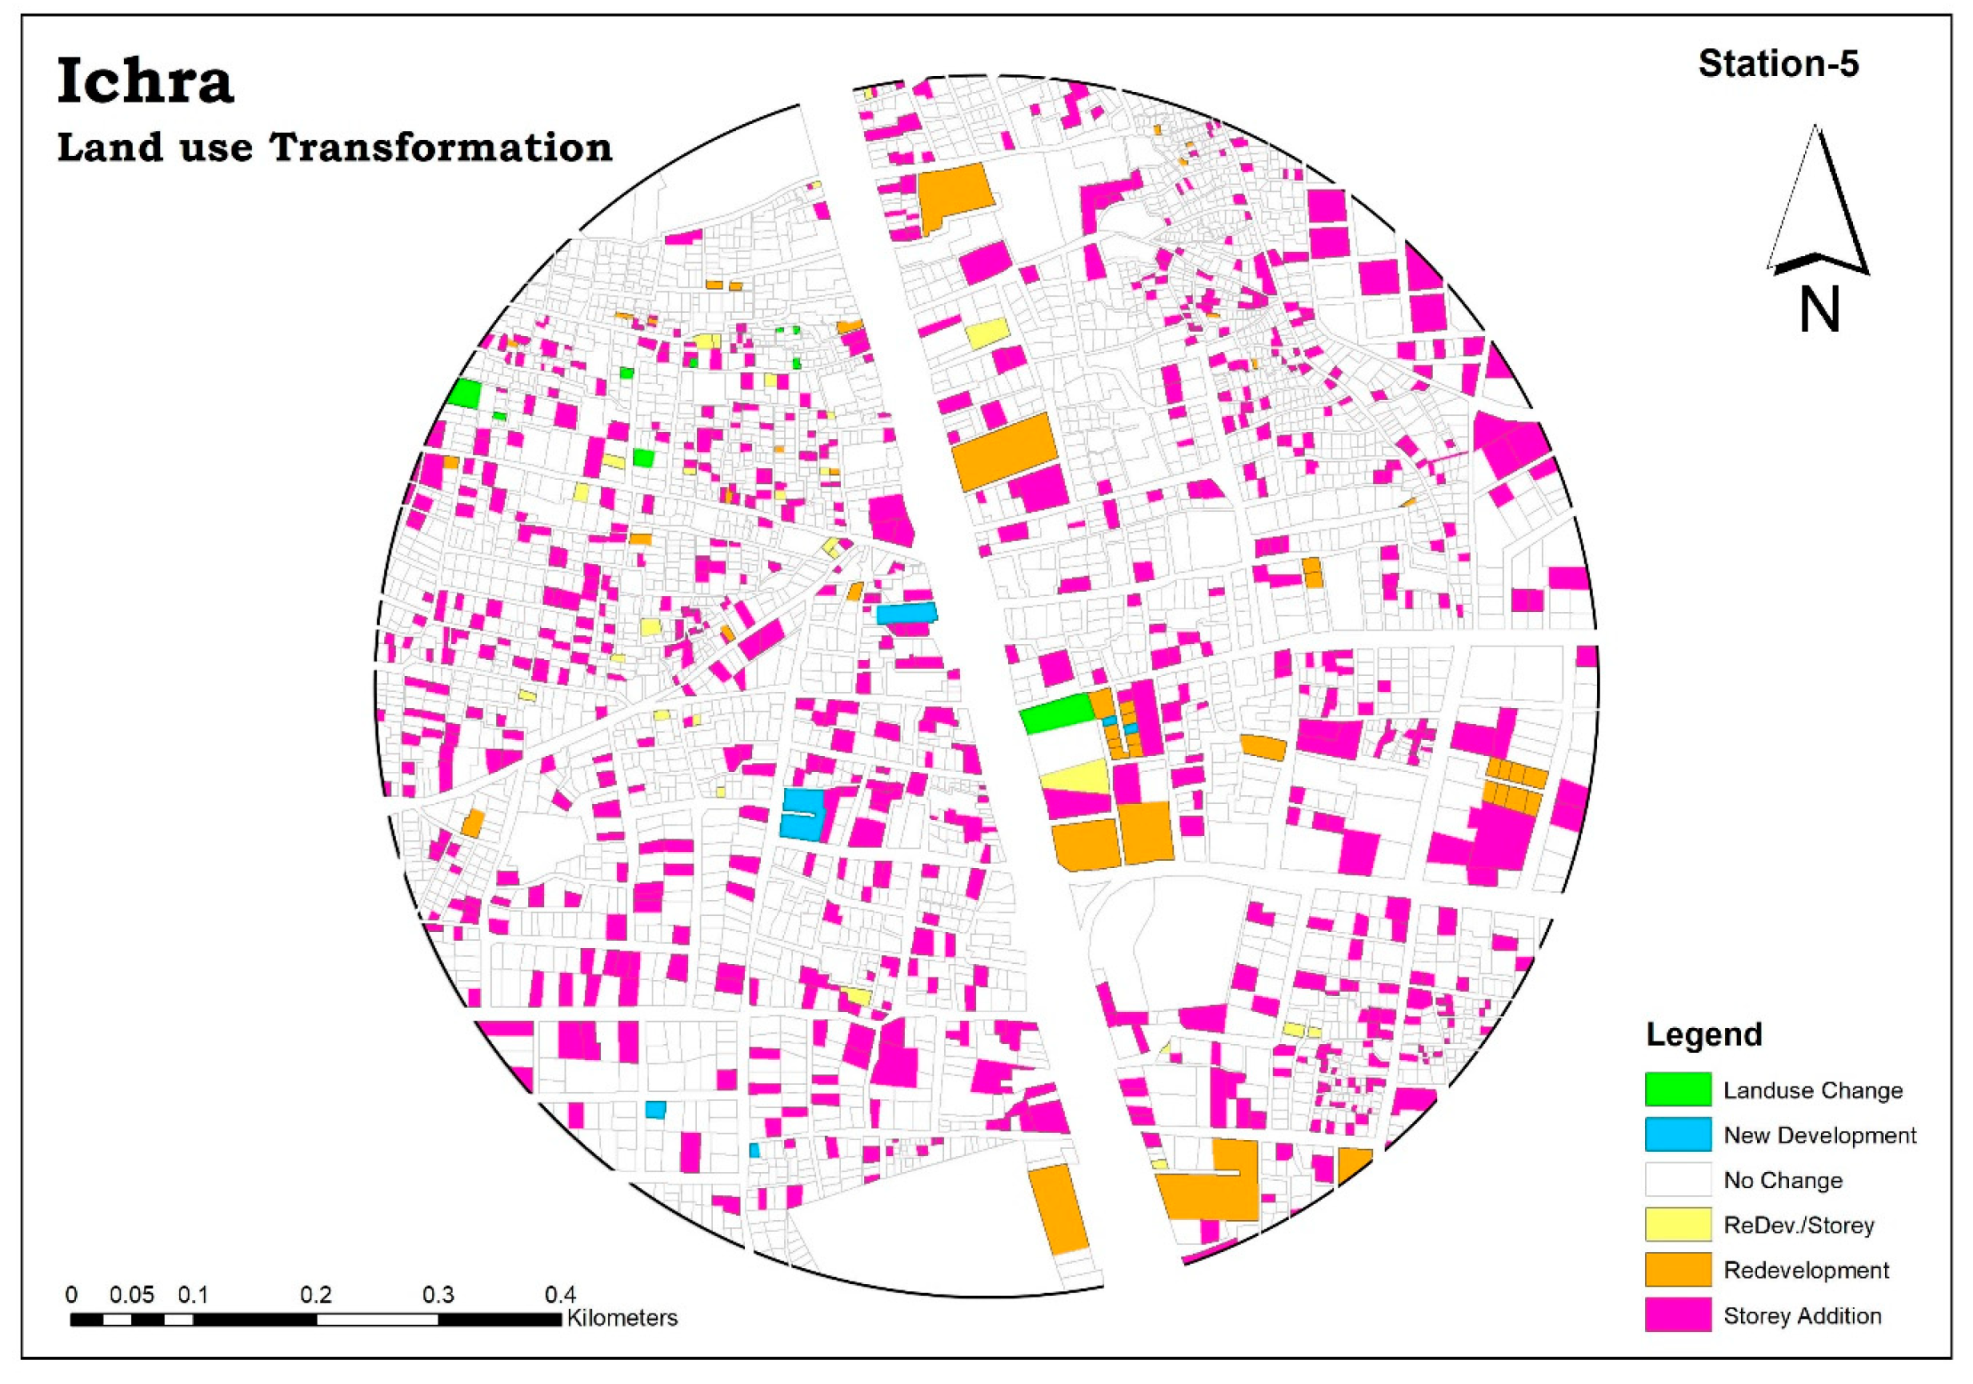
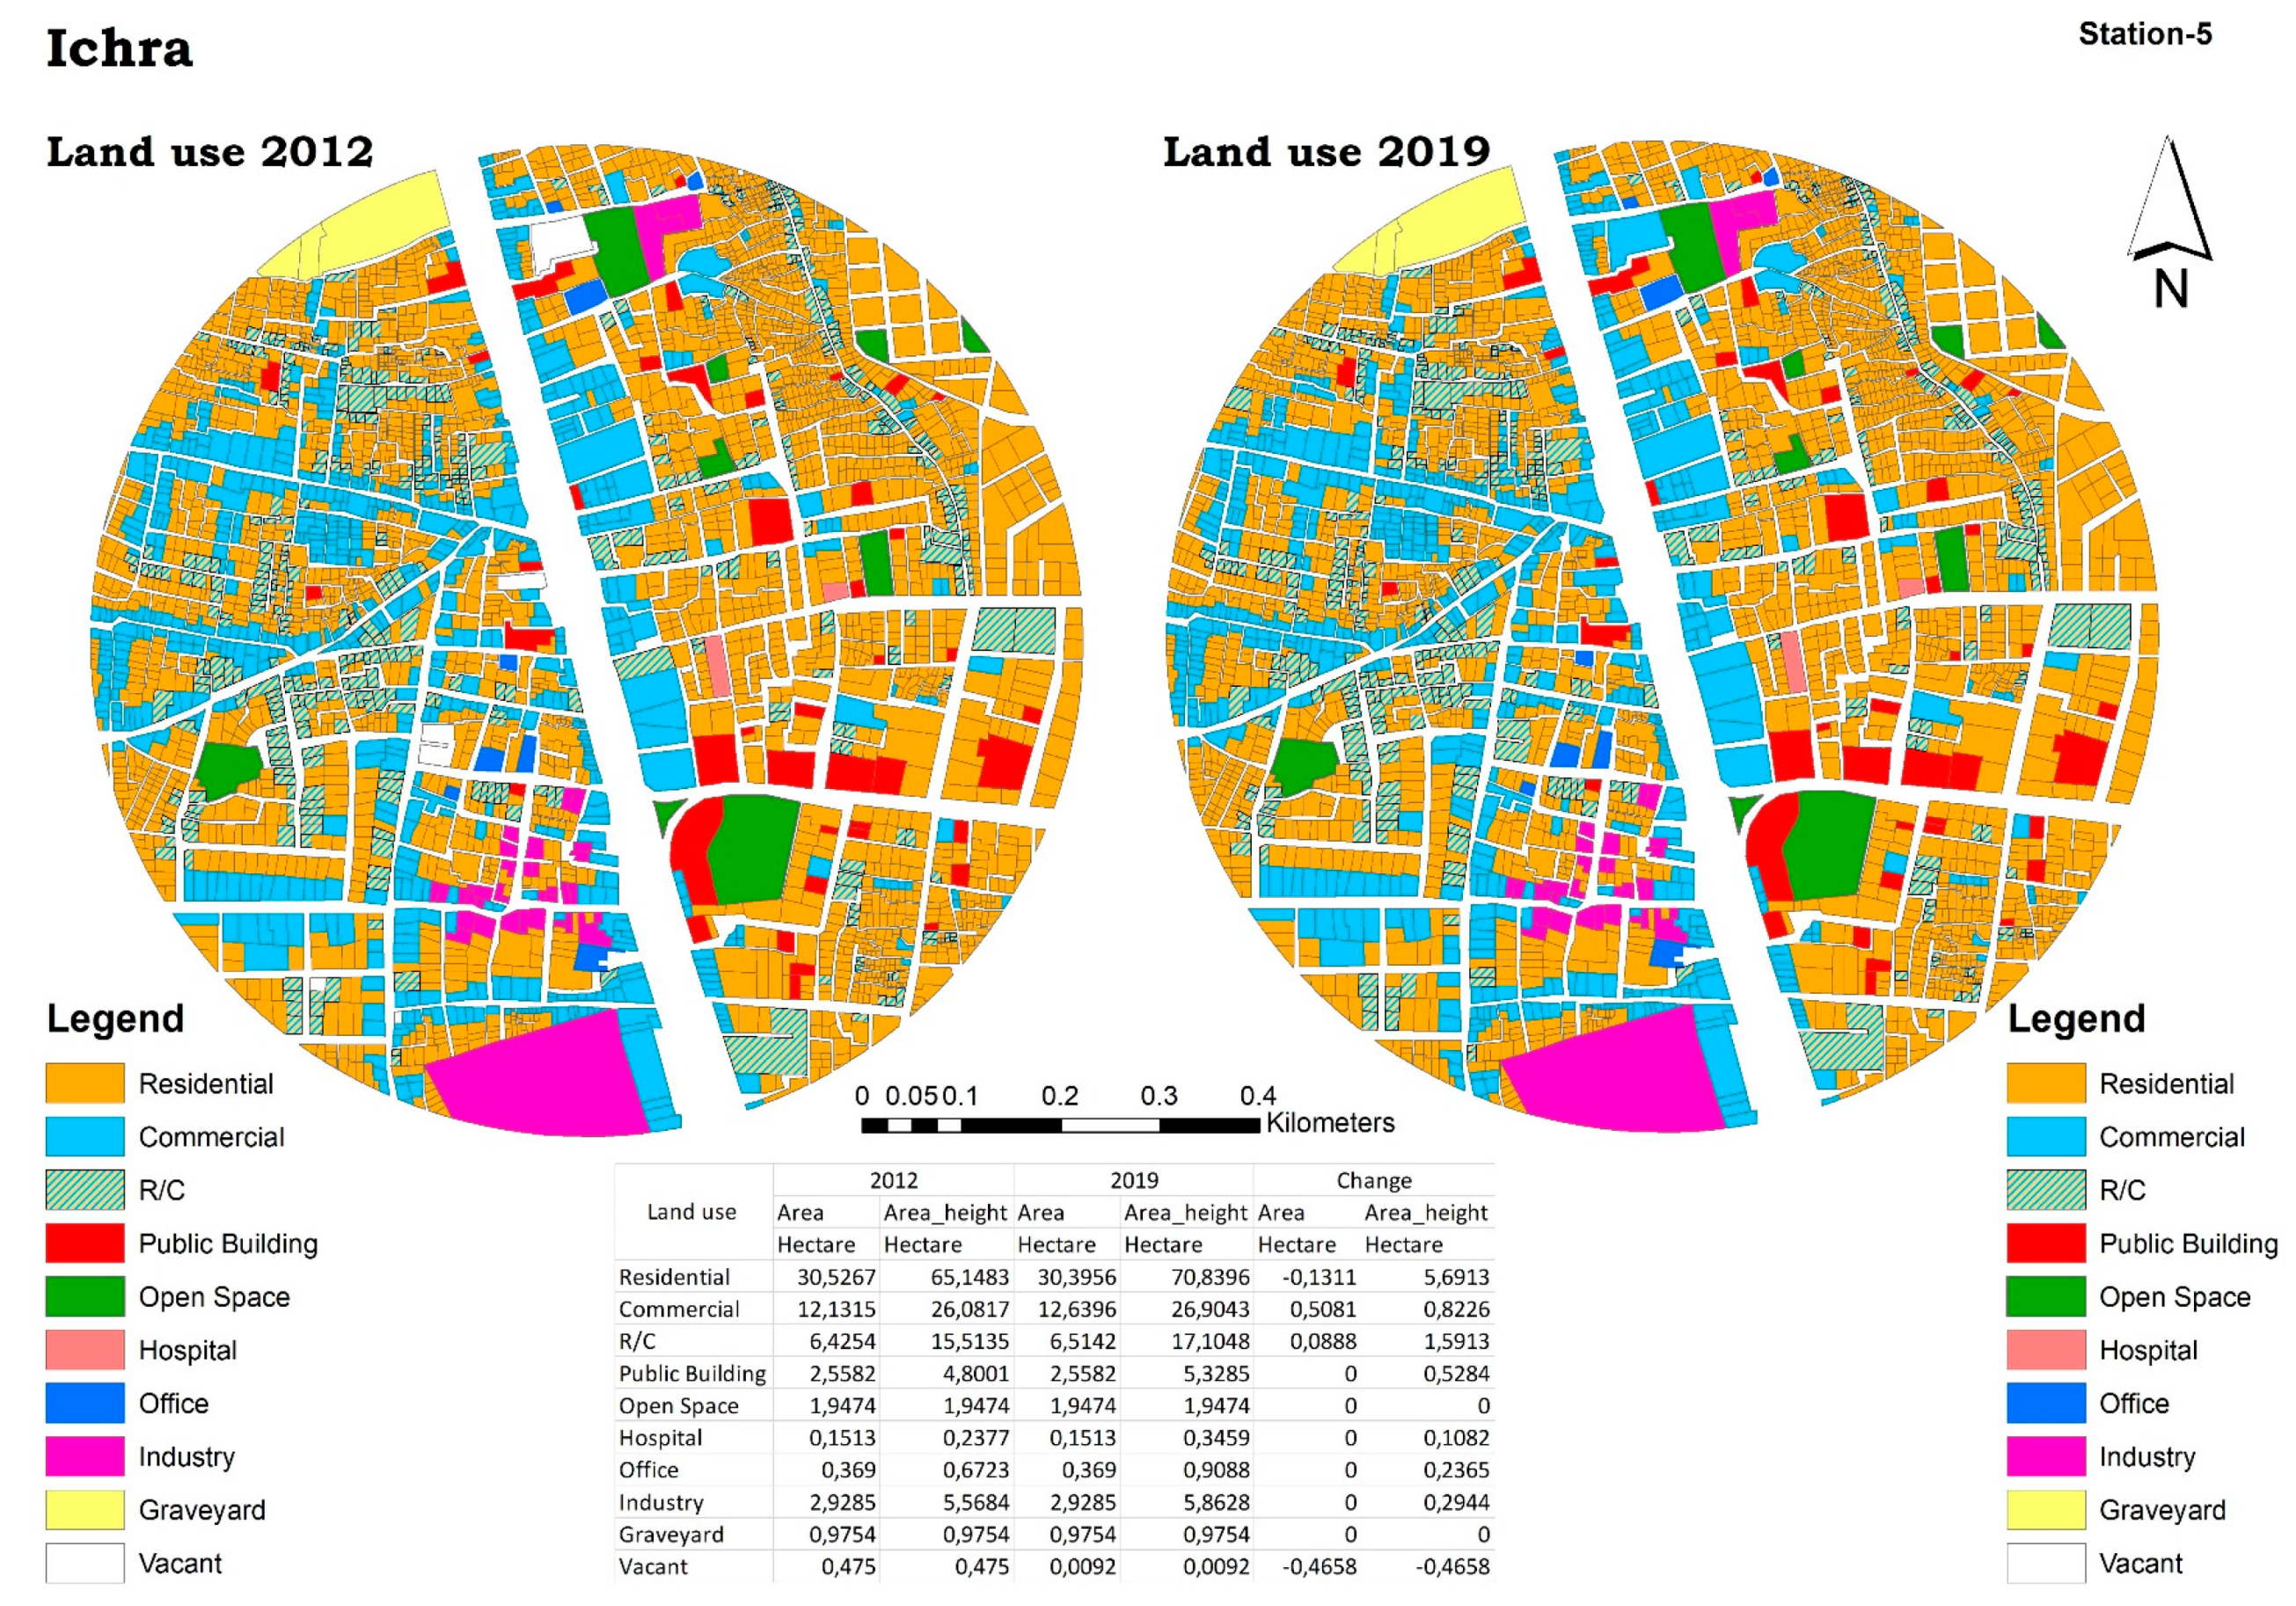
4.1.5. Station-5: Ichra
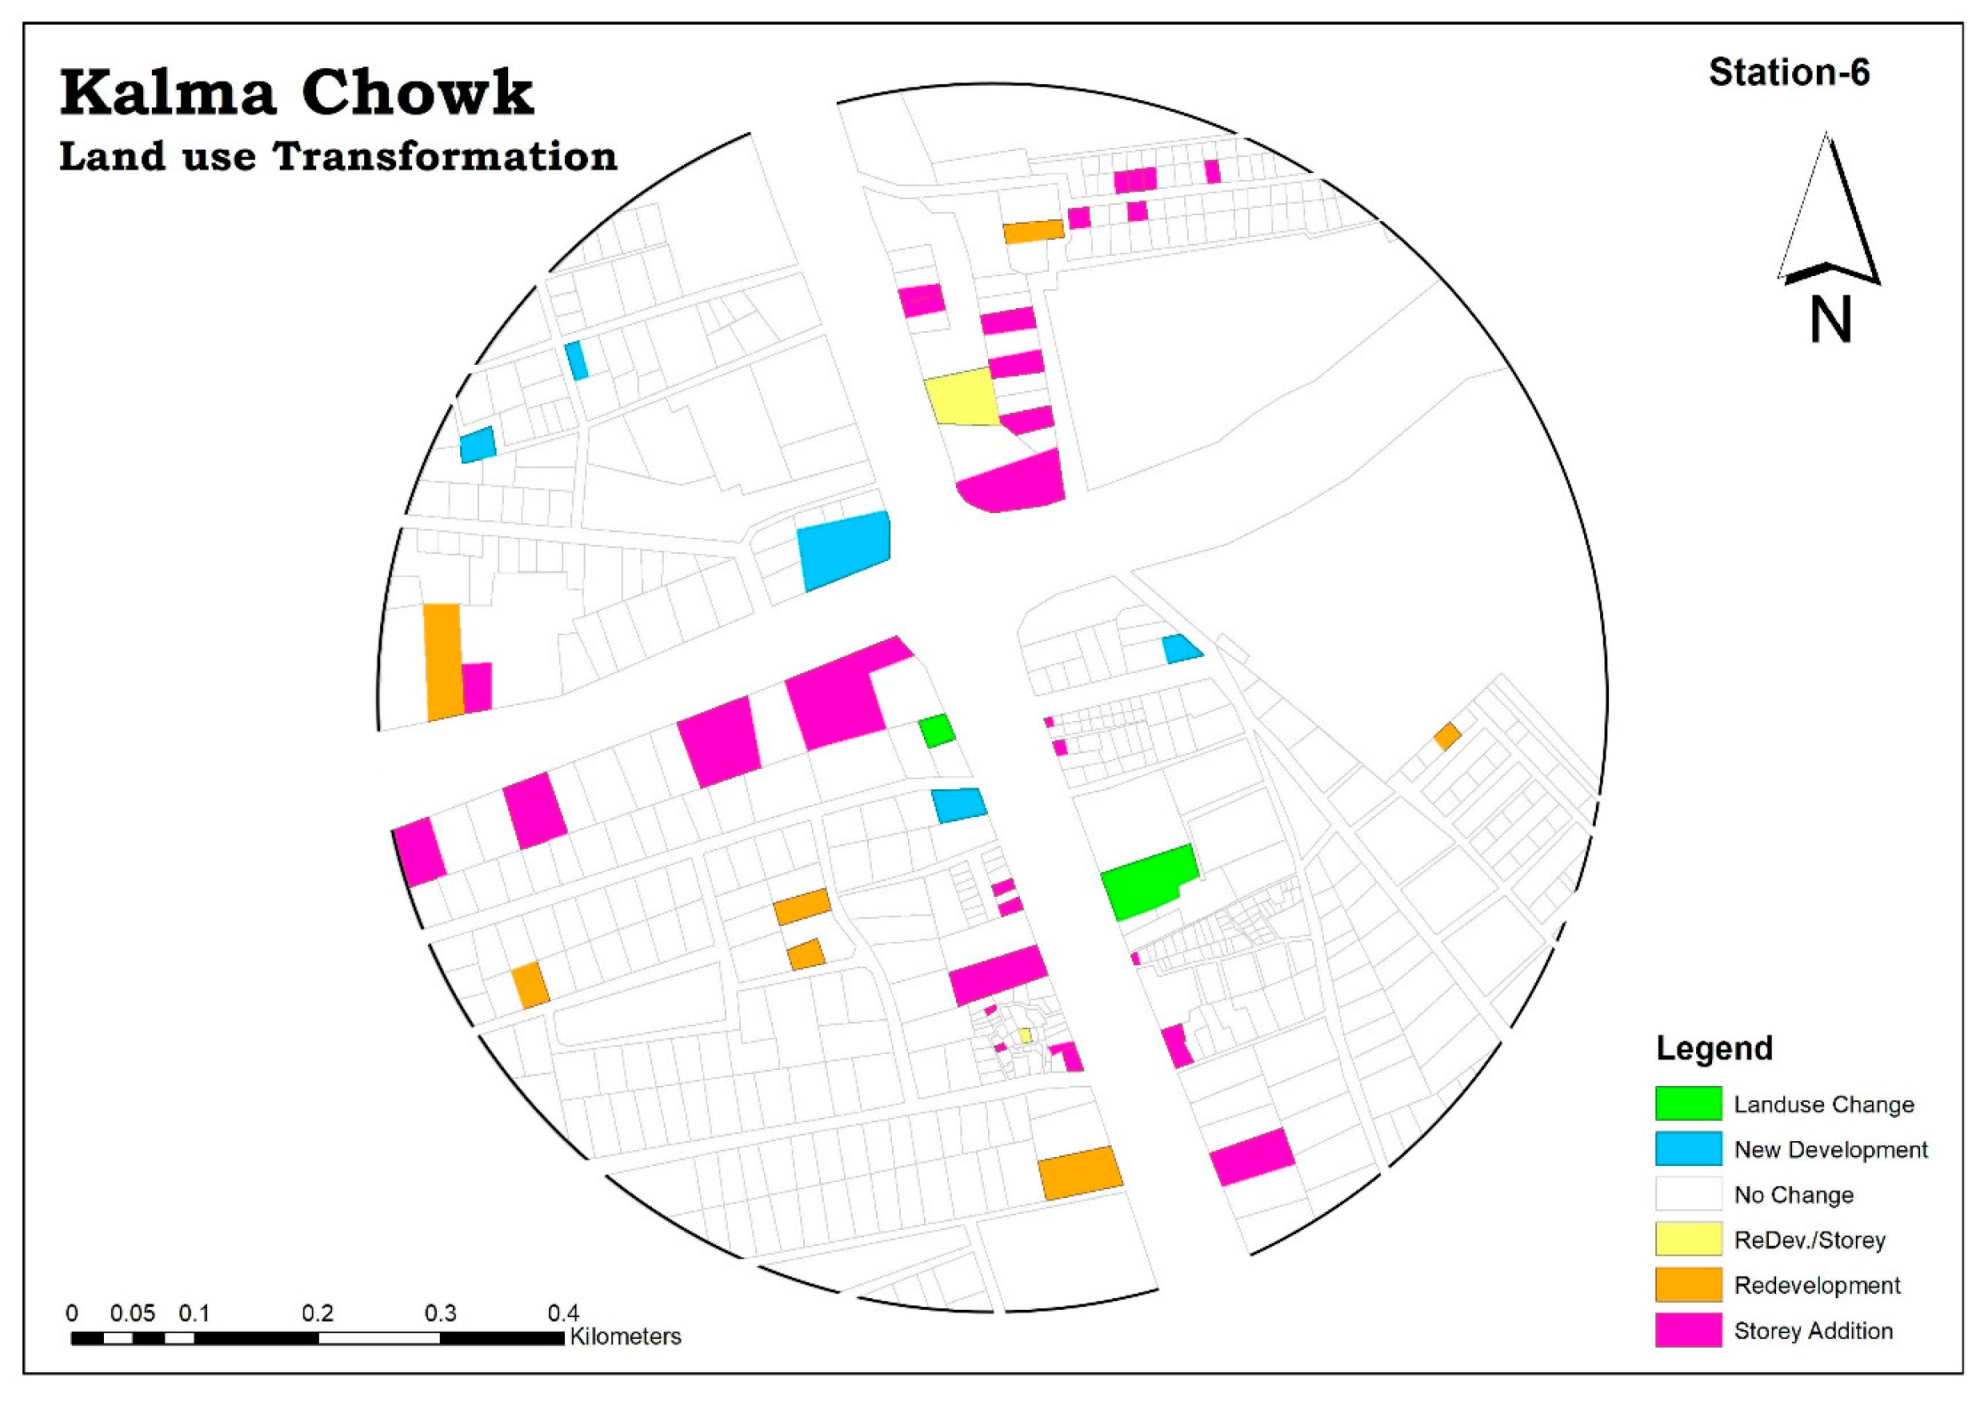
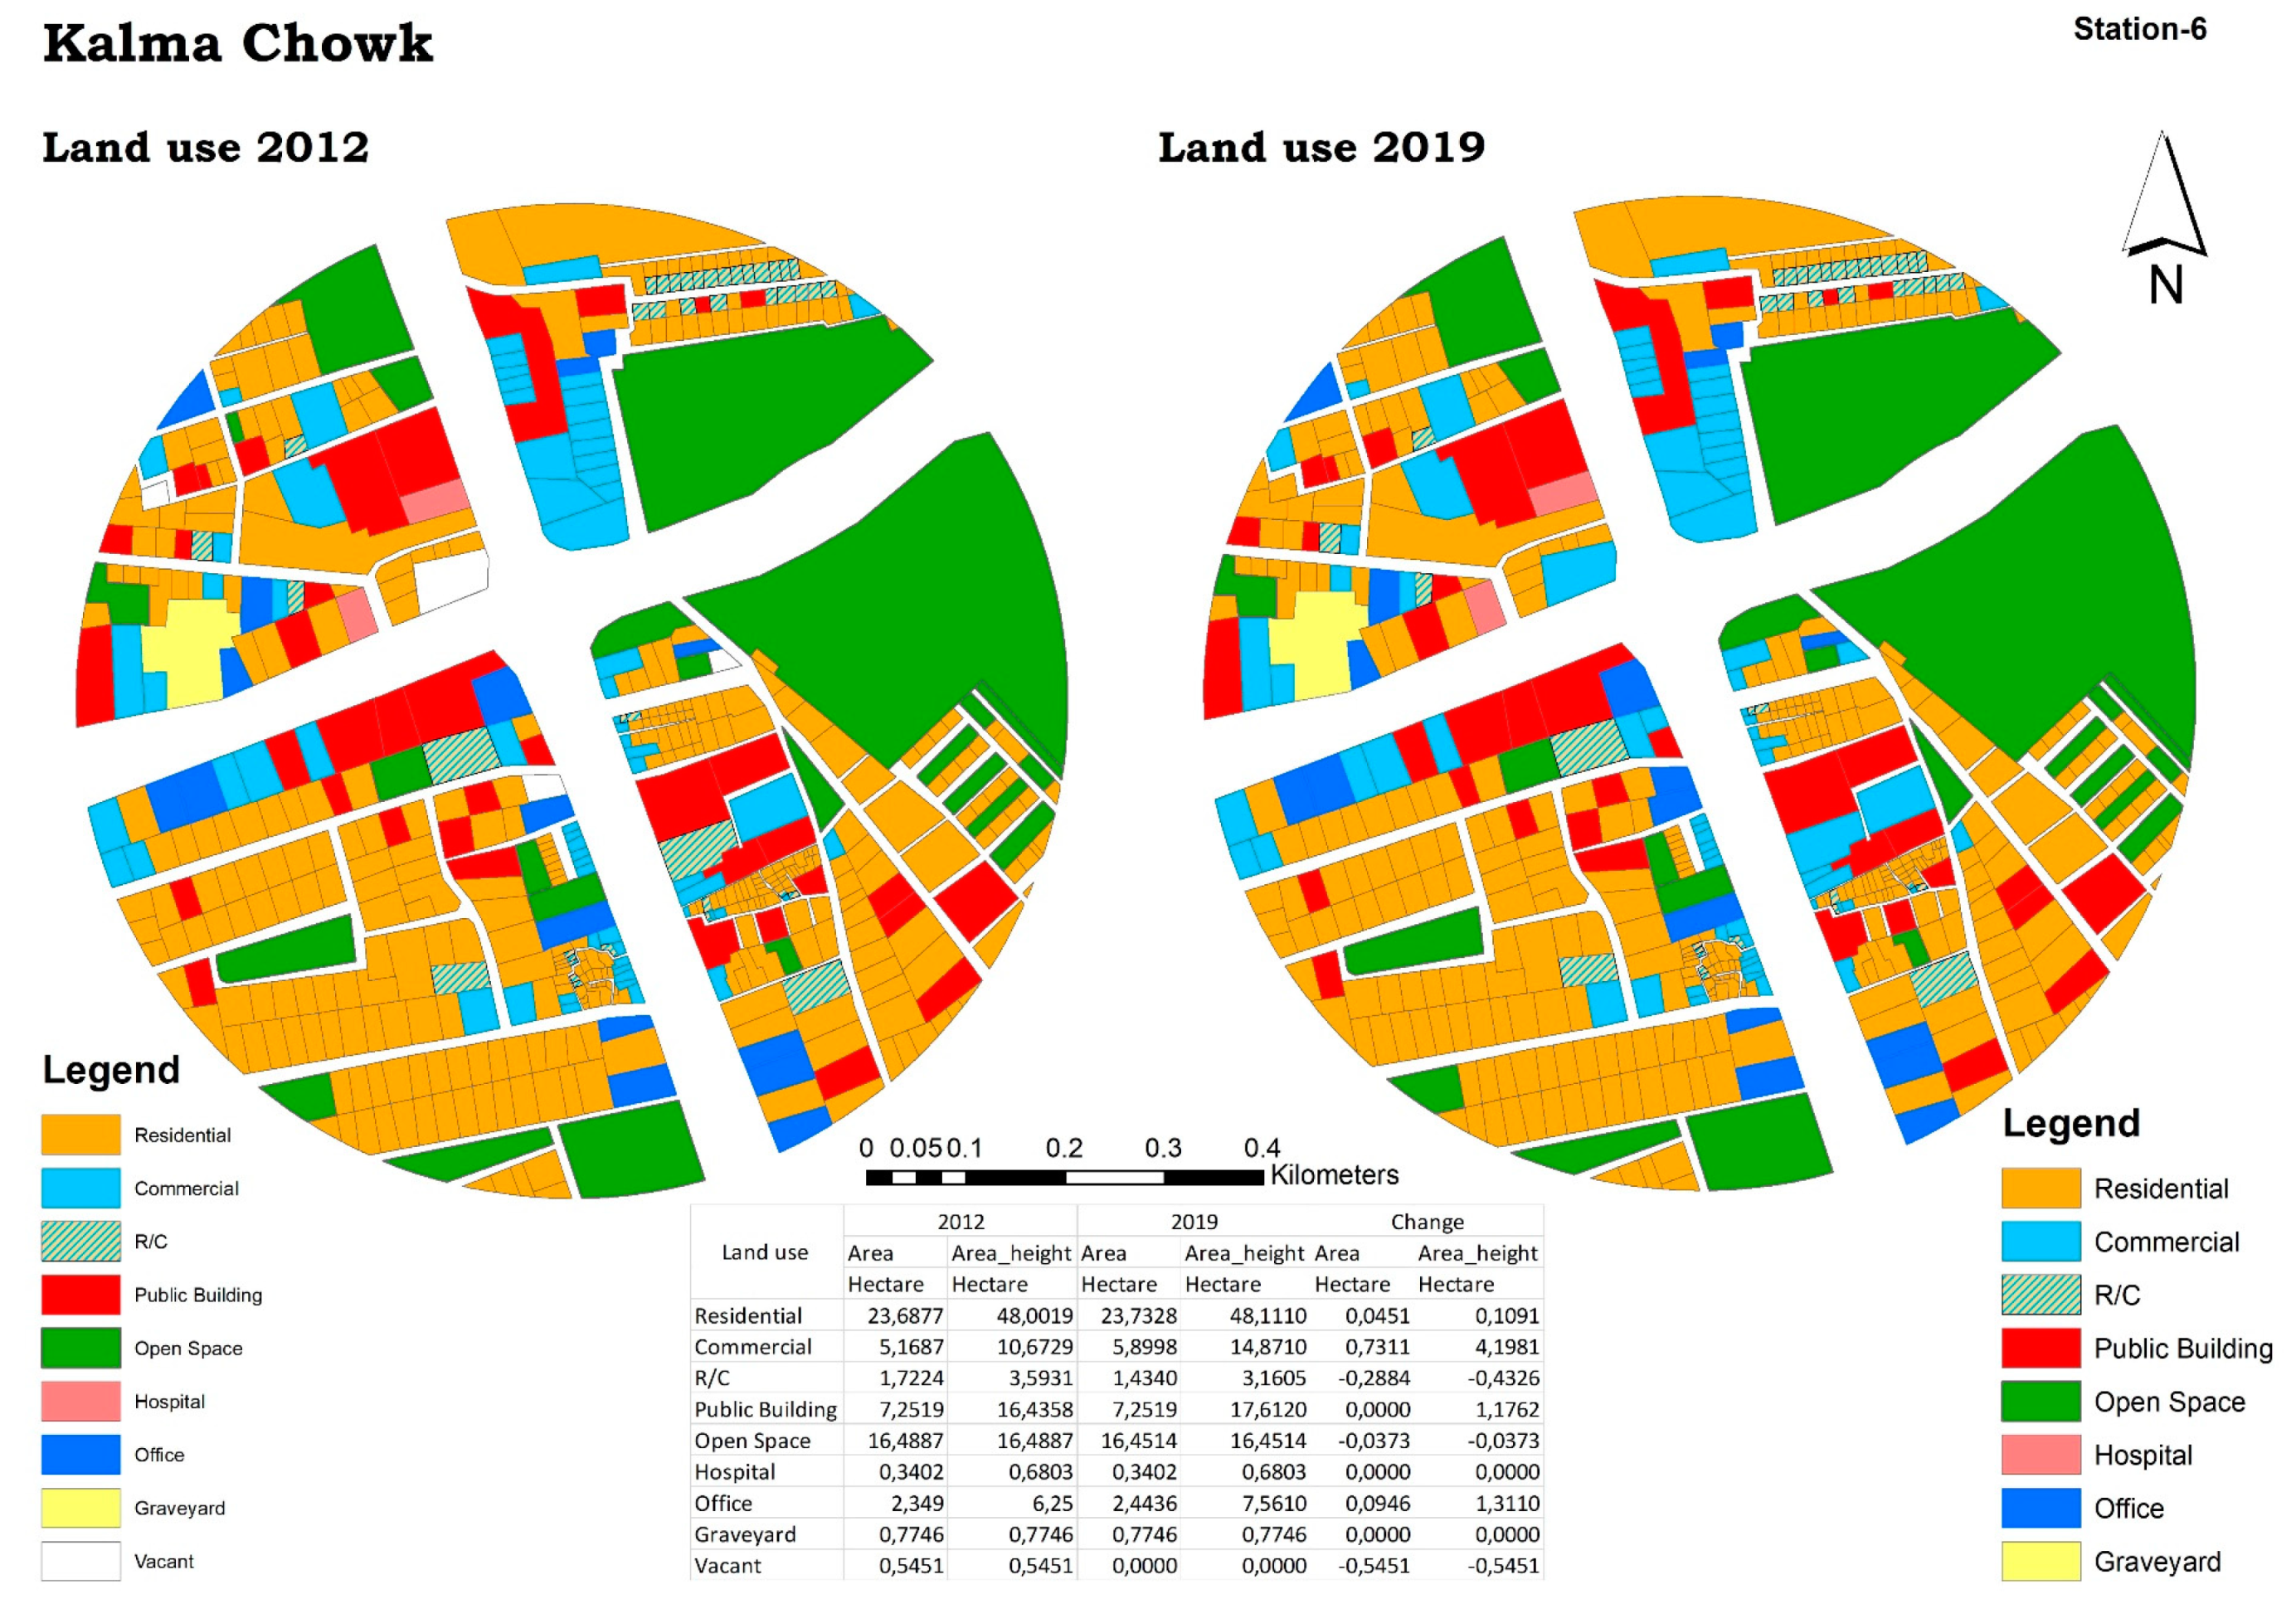
4.1.6. Station-6: Kalma Chowk
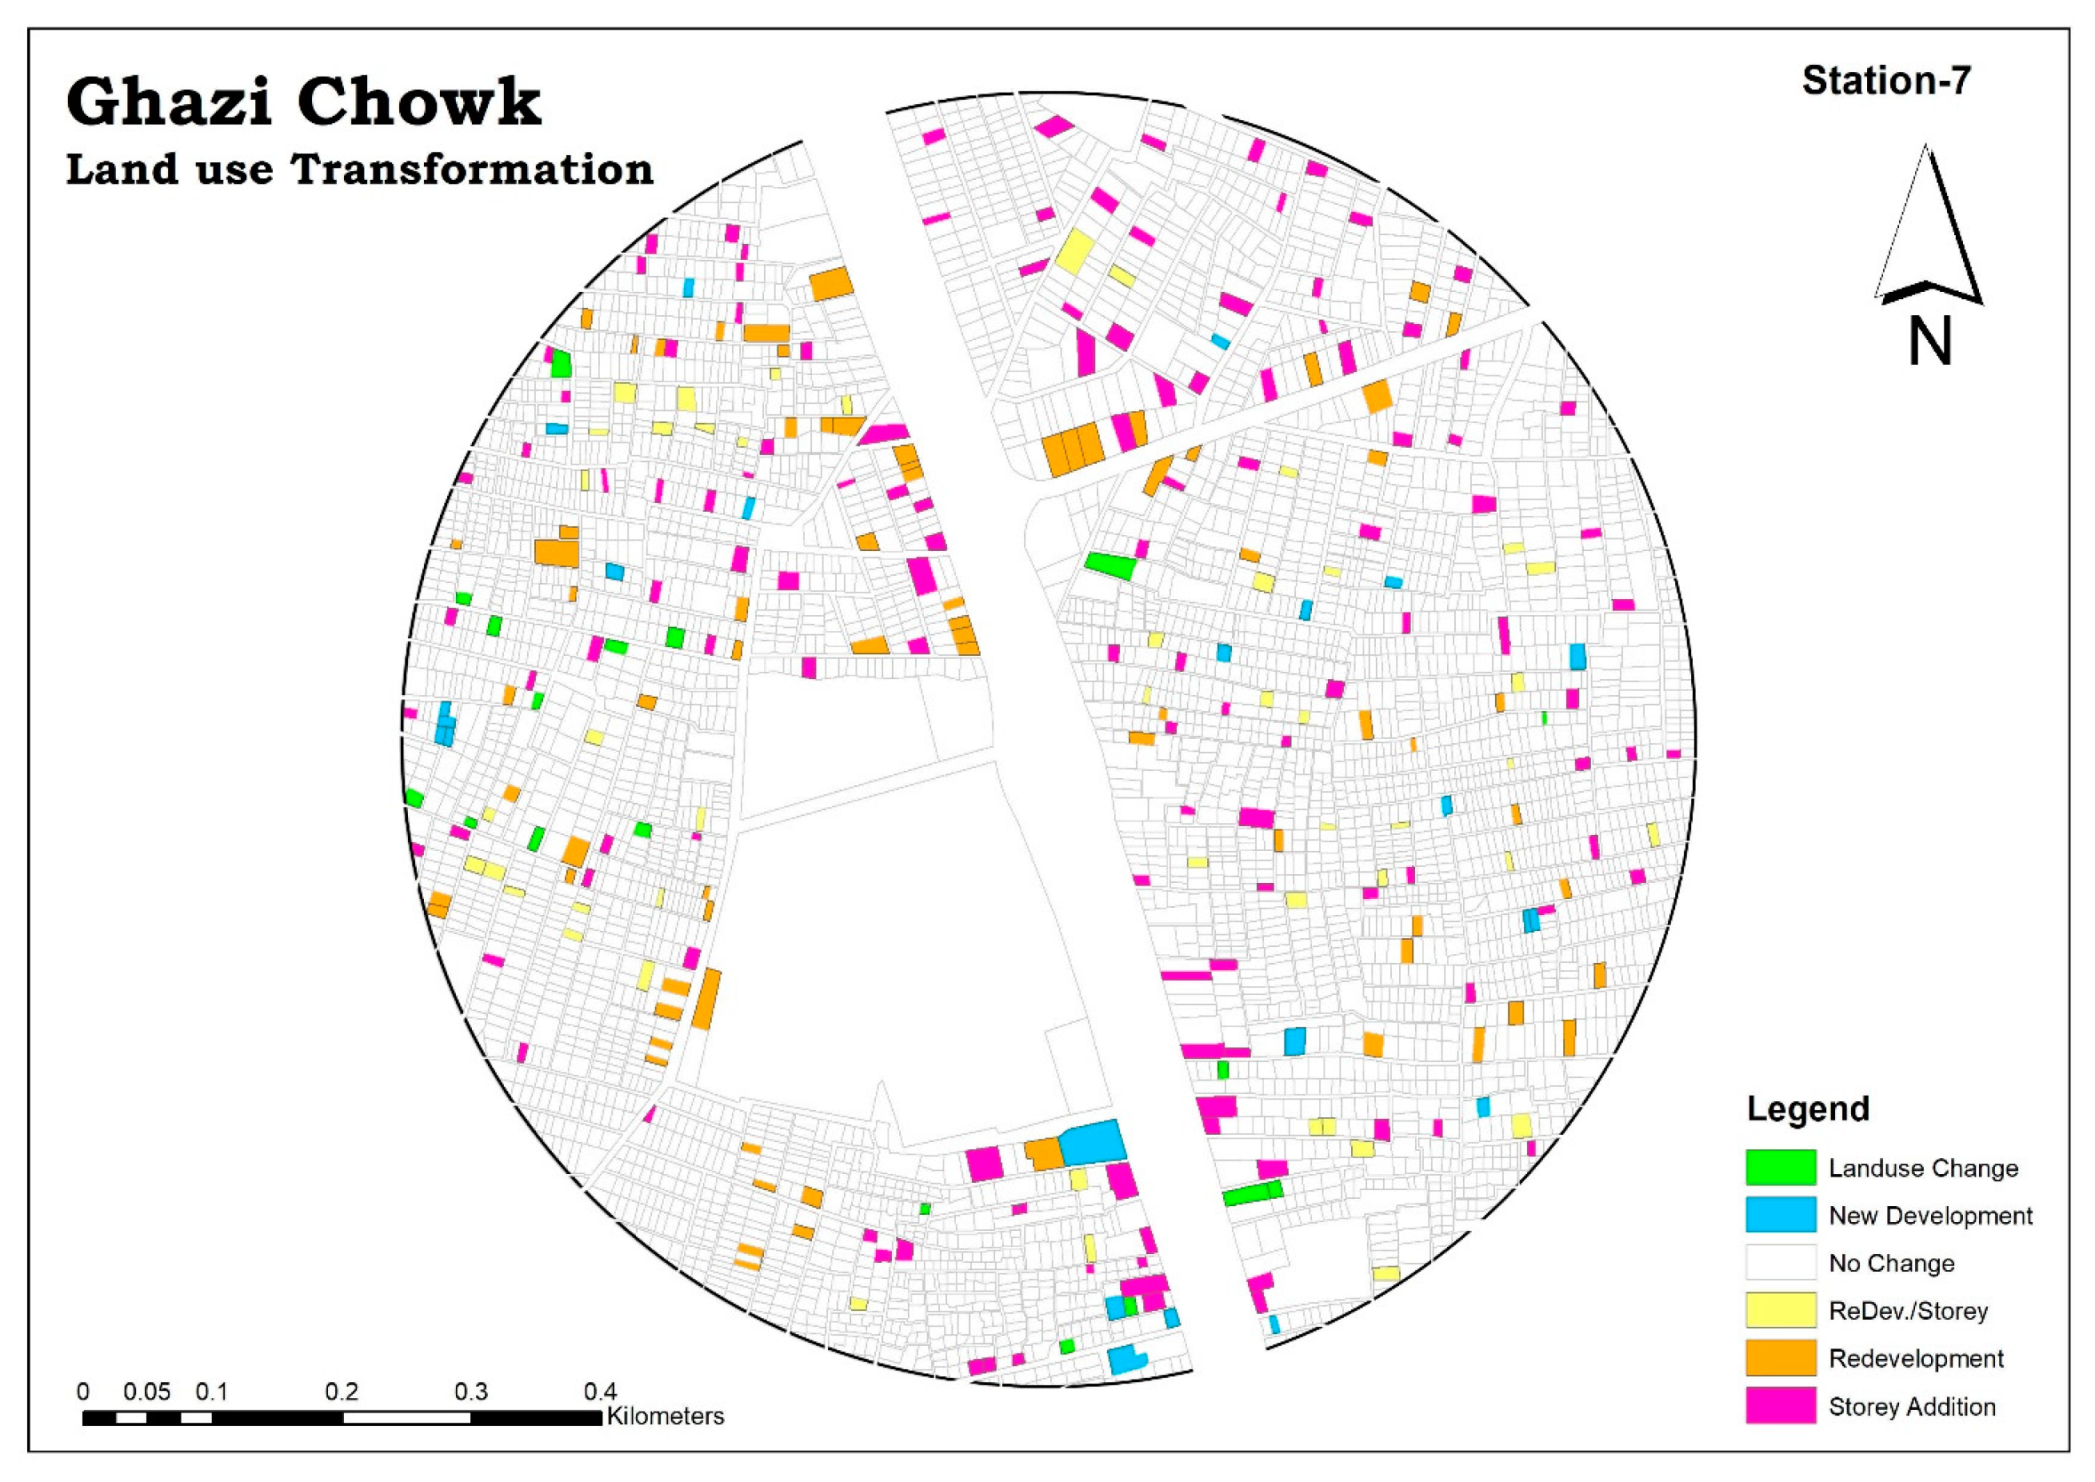
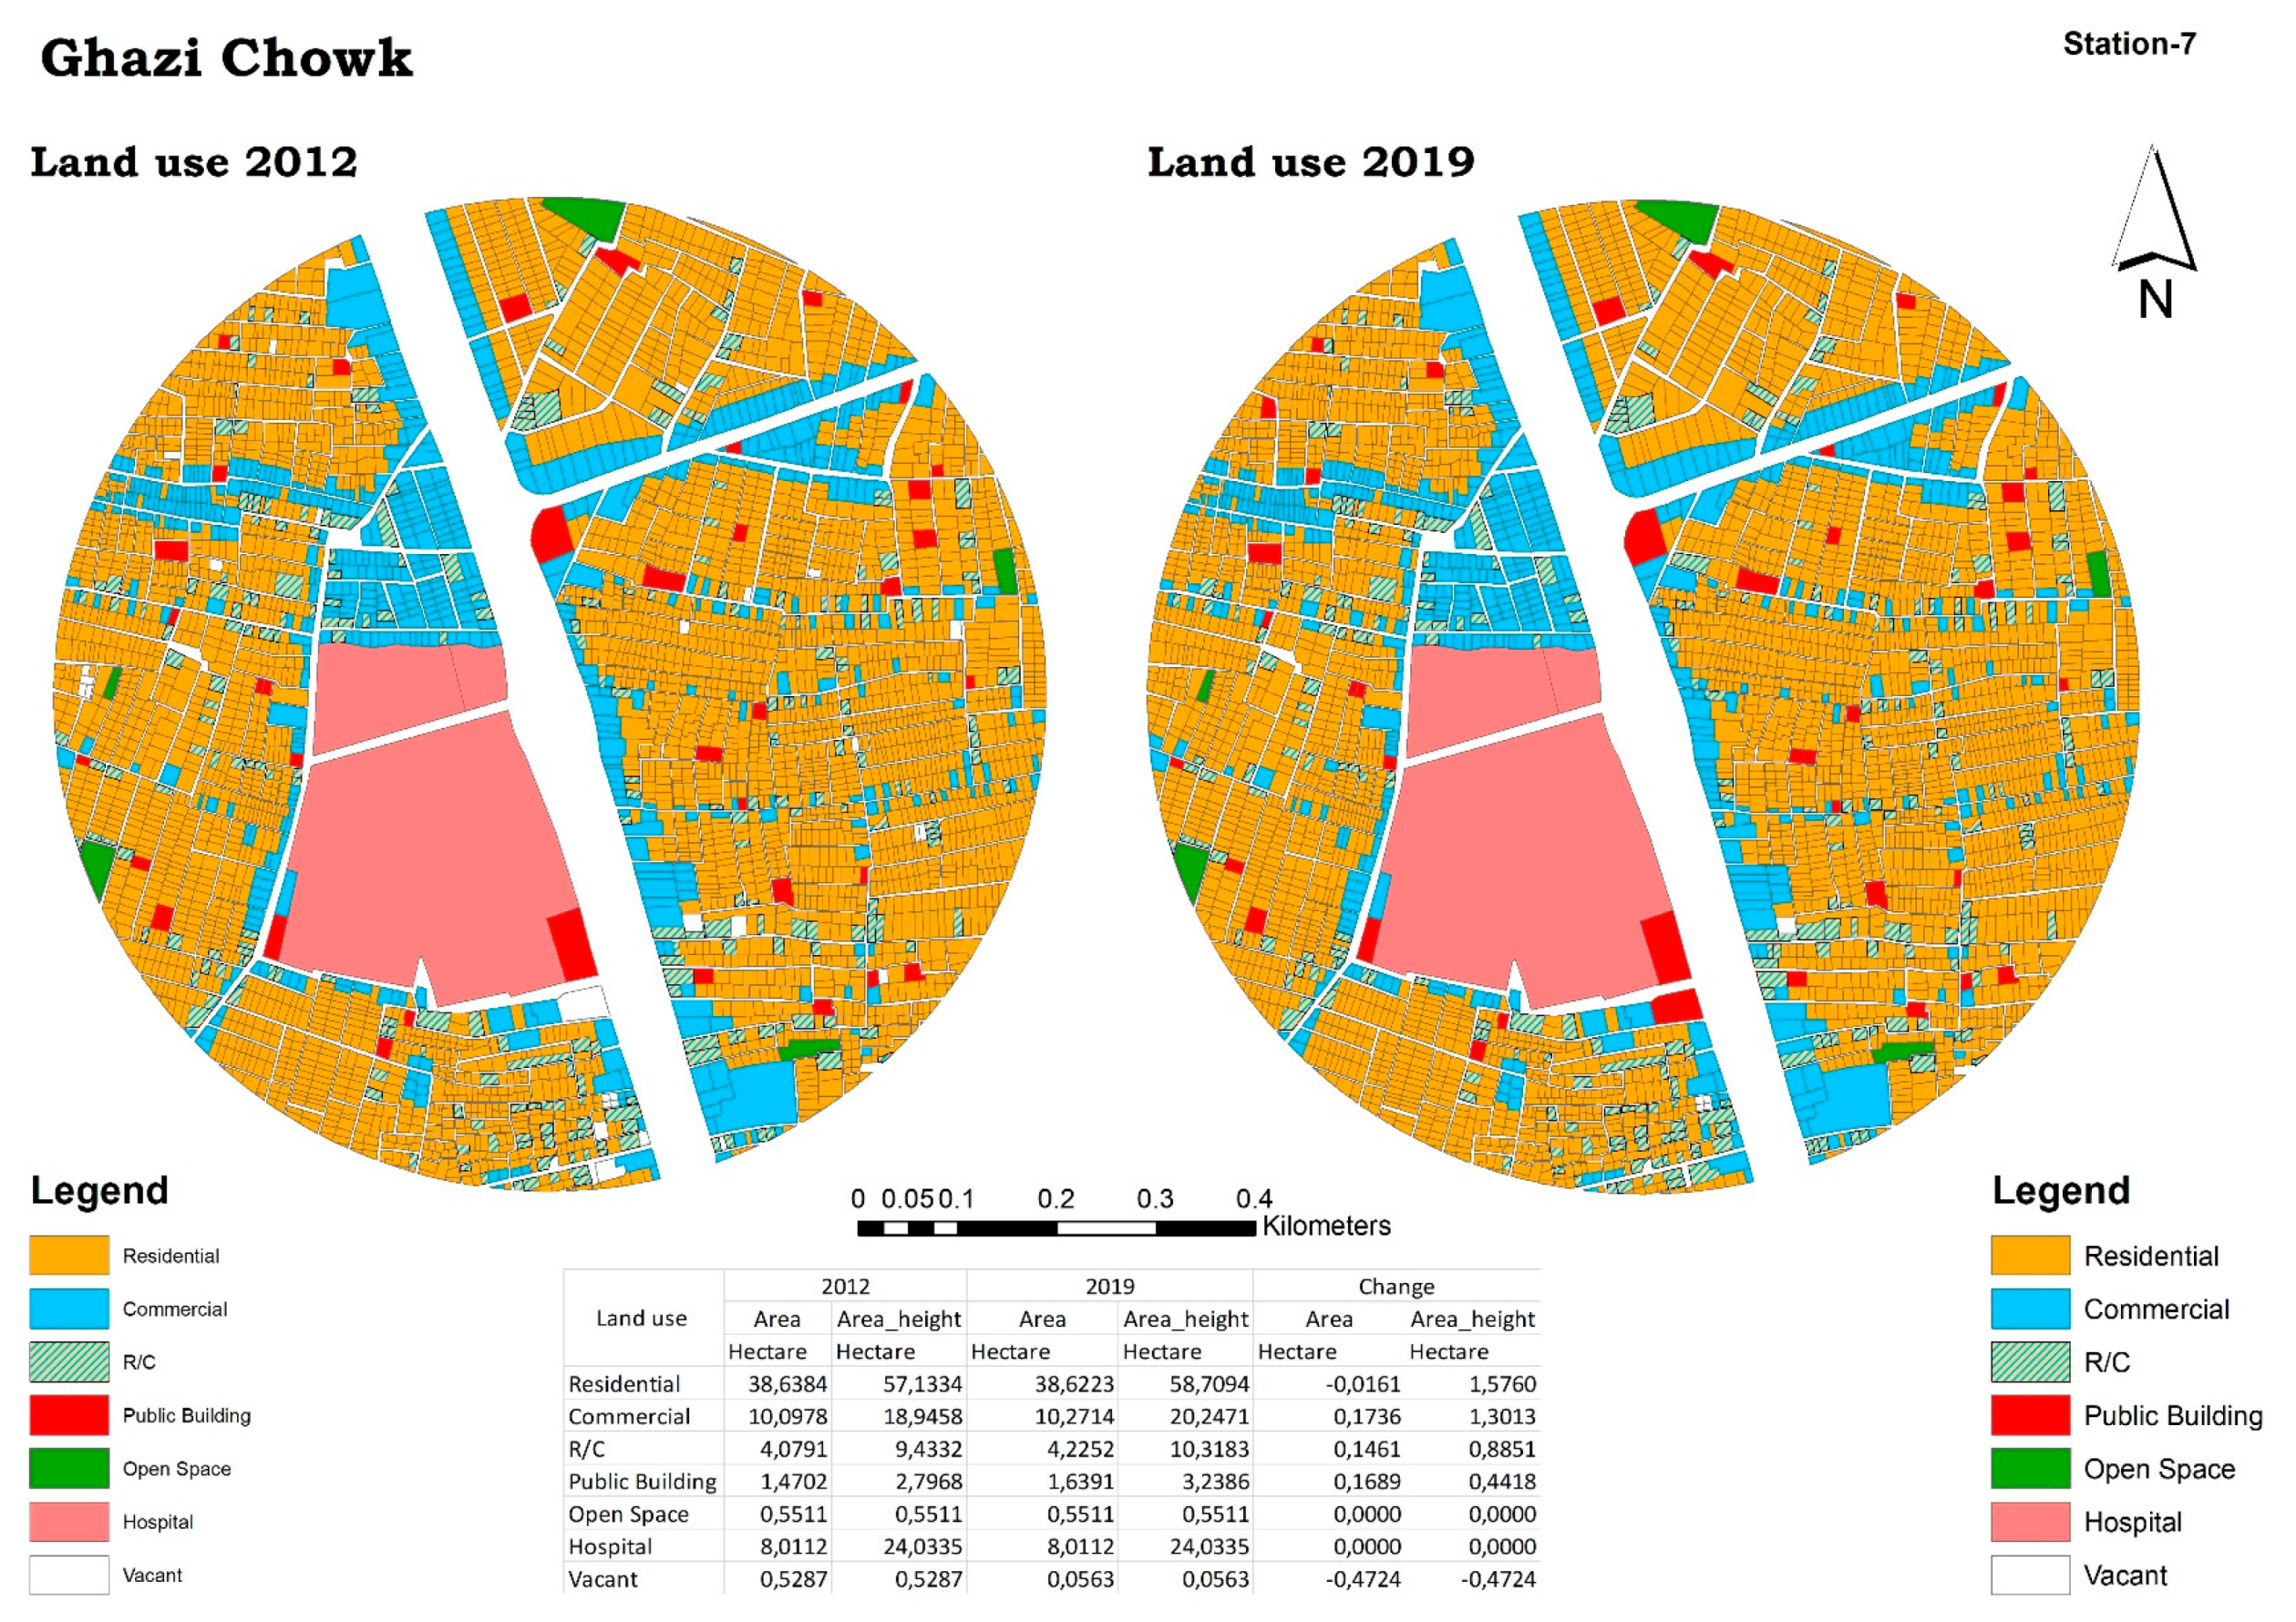
4.1.7. Station-7: Ghazi Chowk
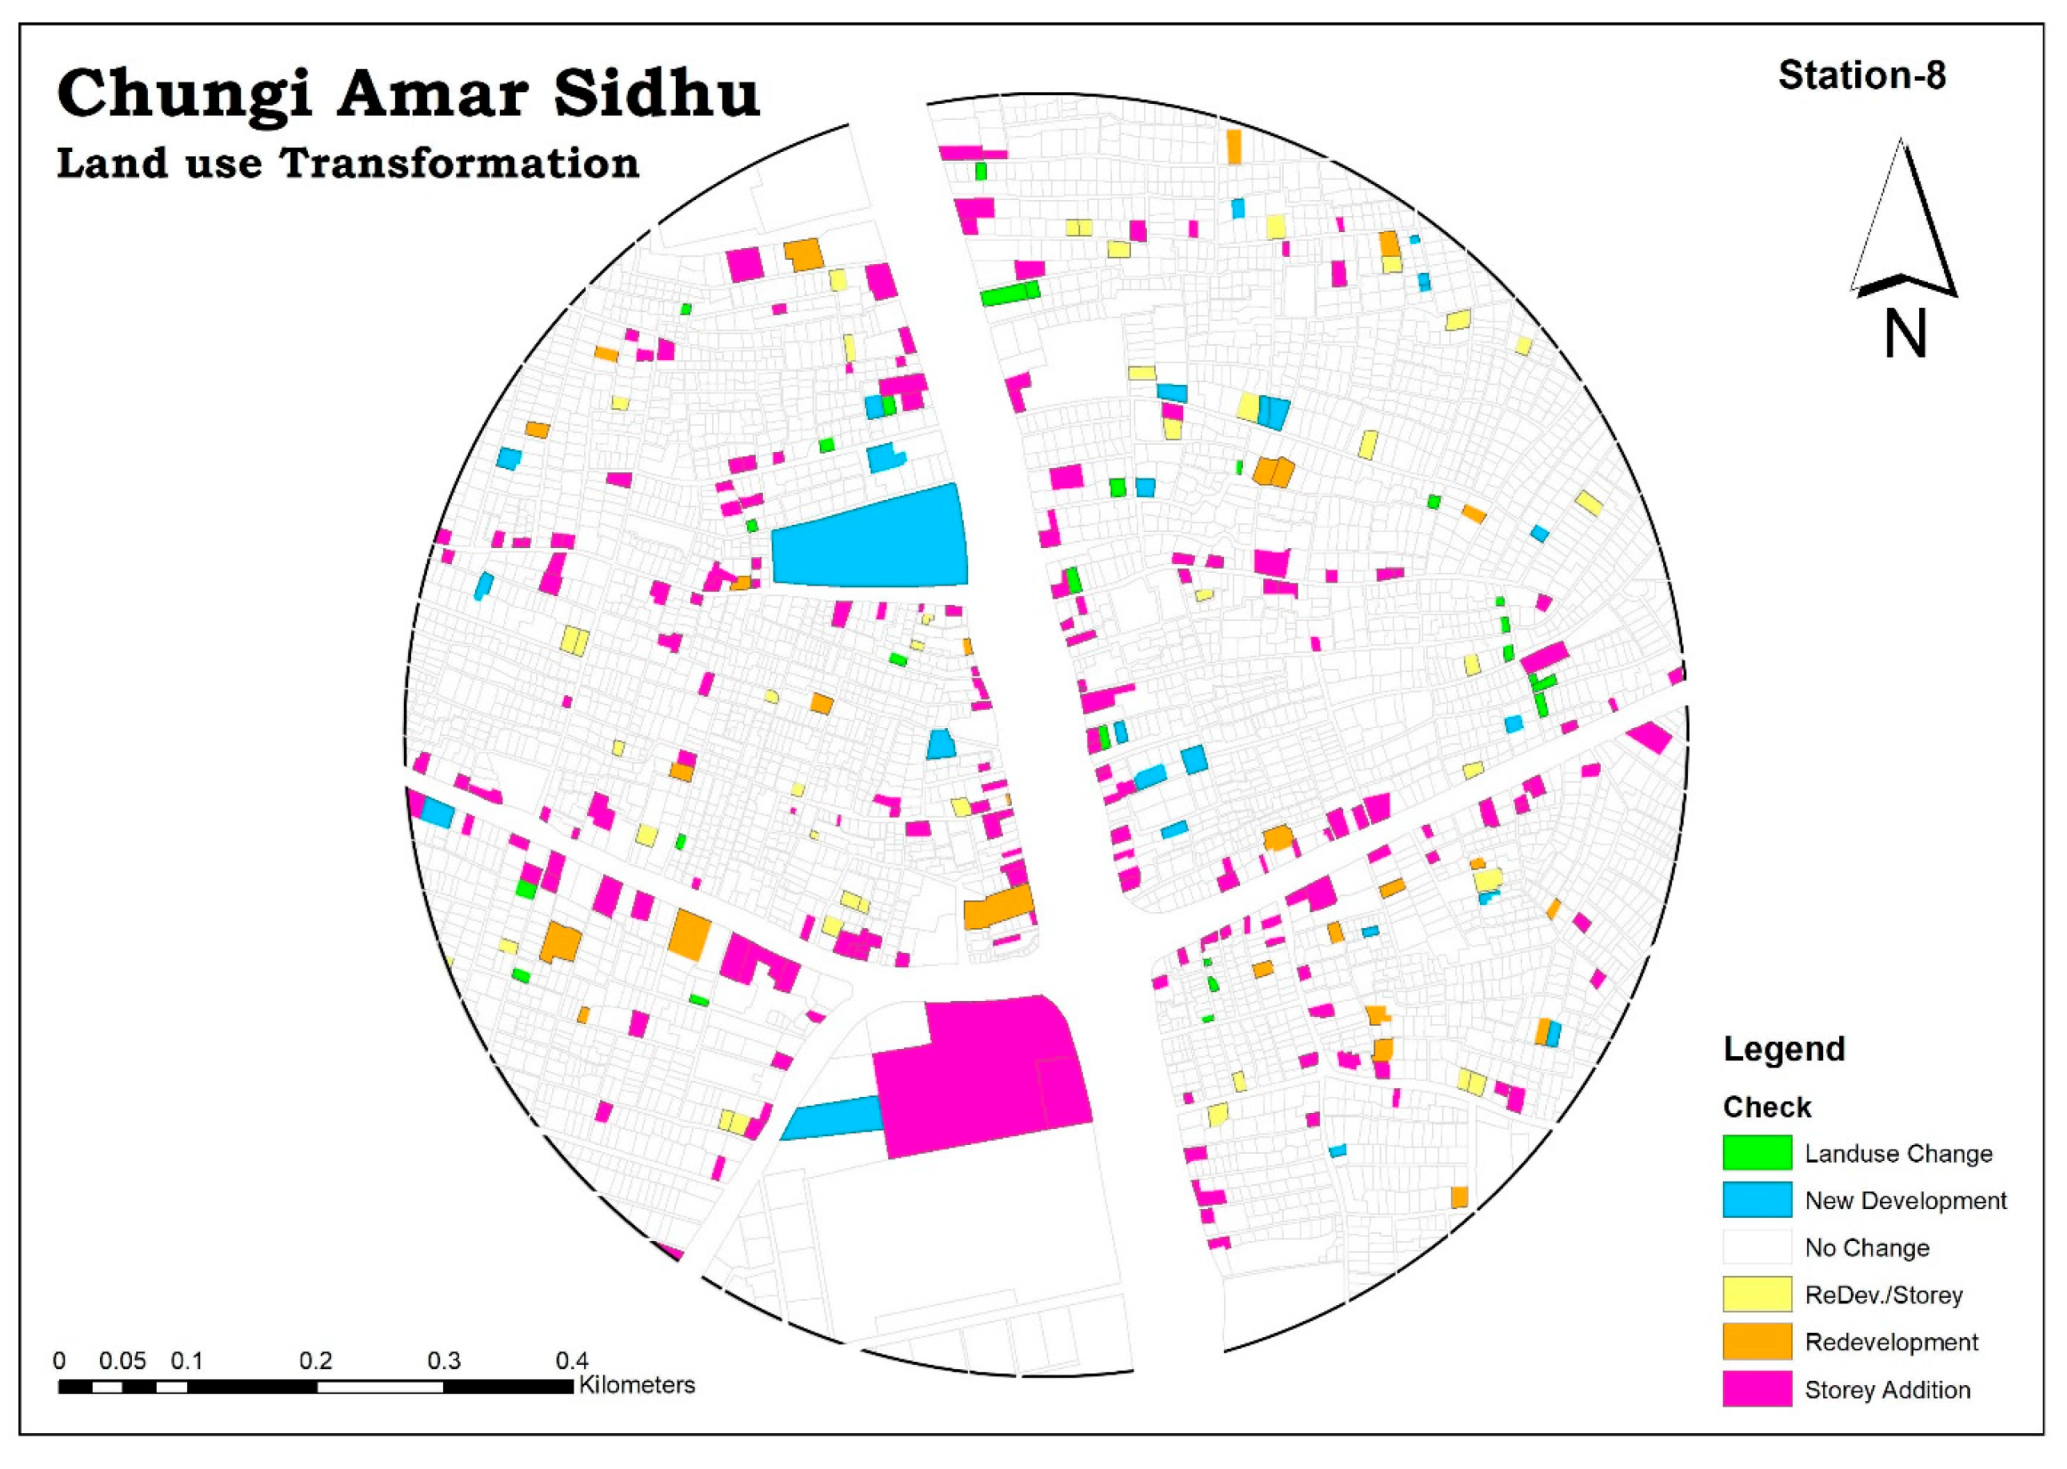
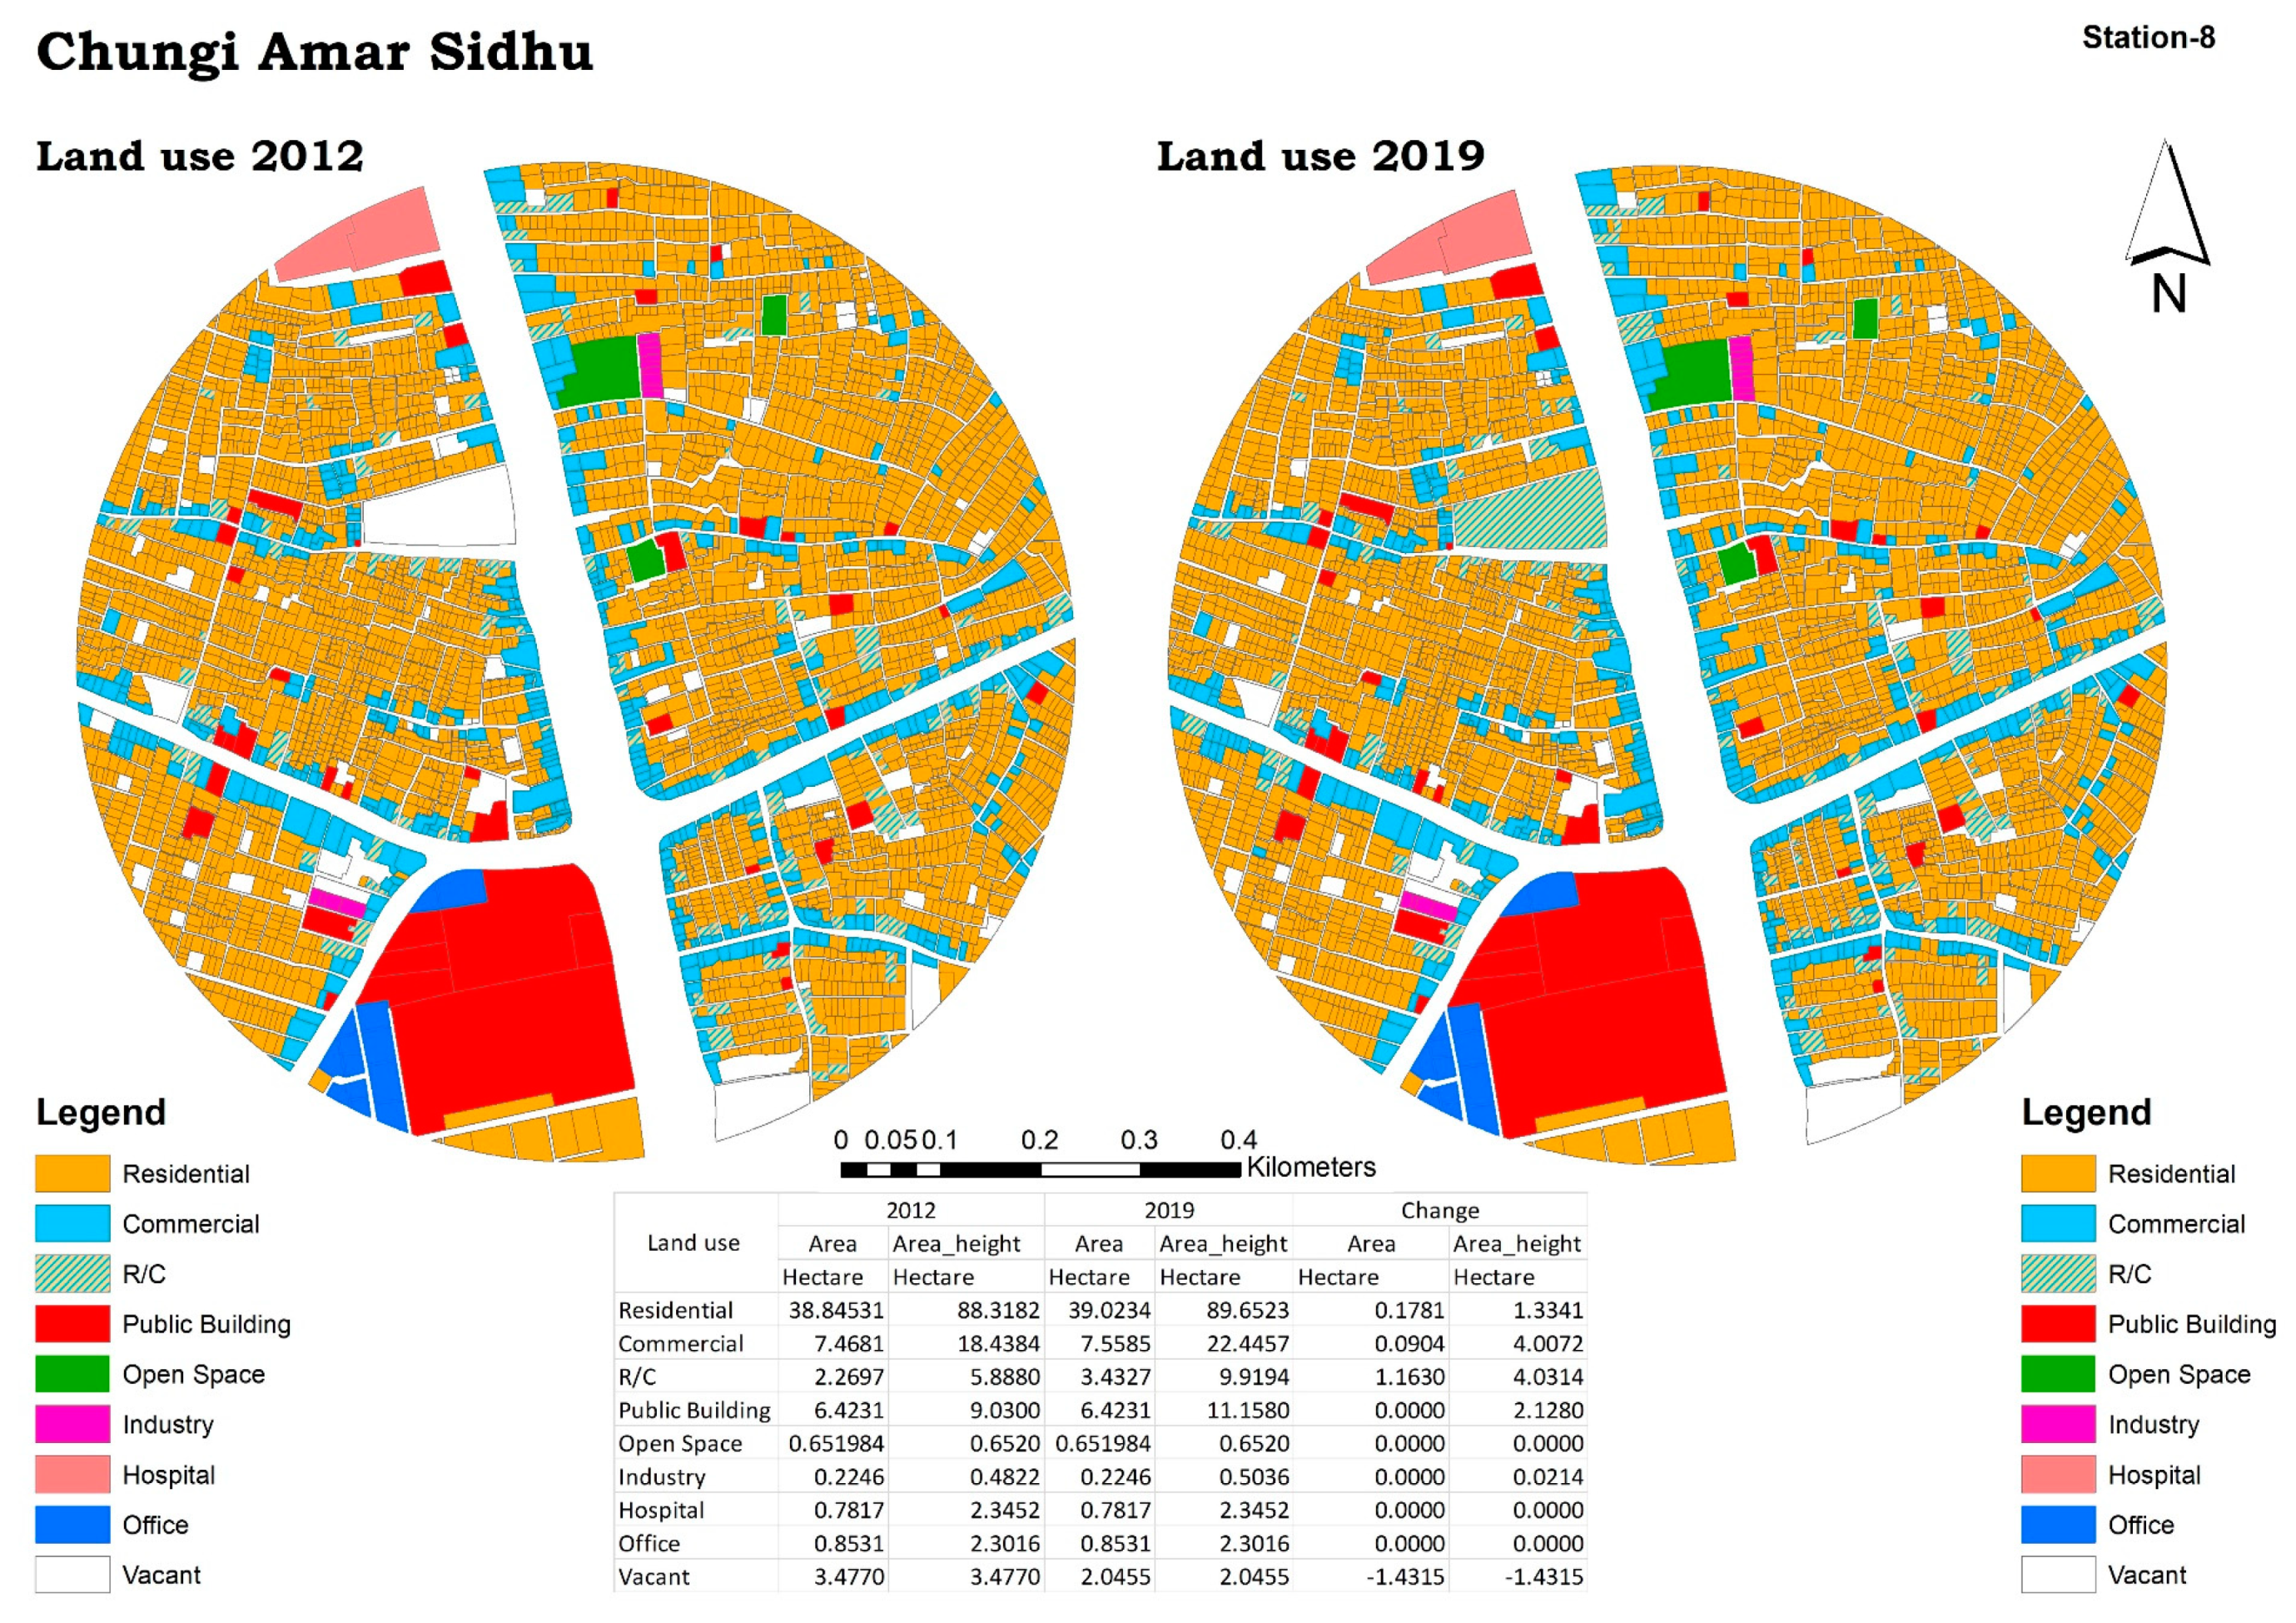
4.1.8. Station-8: Chungi Amar Sidhu
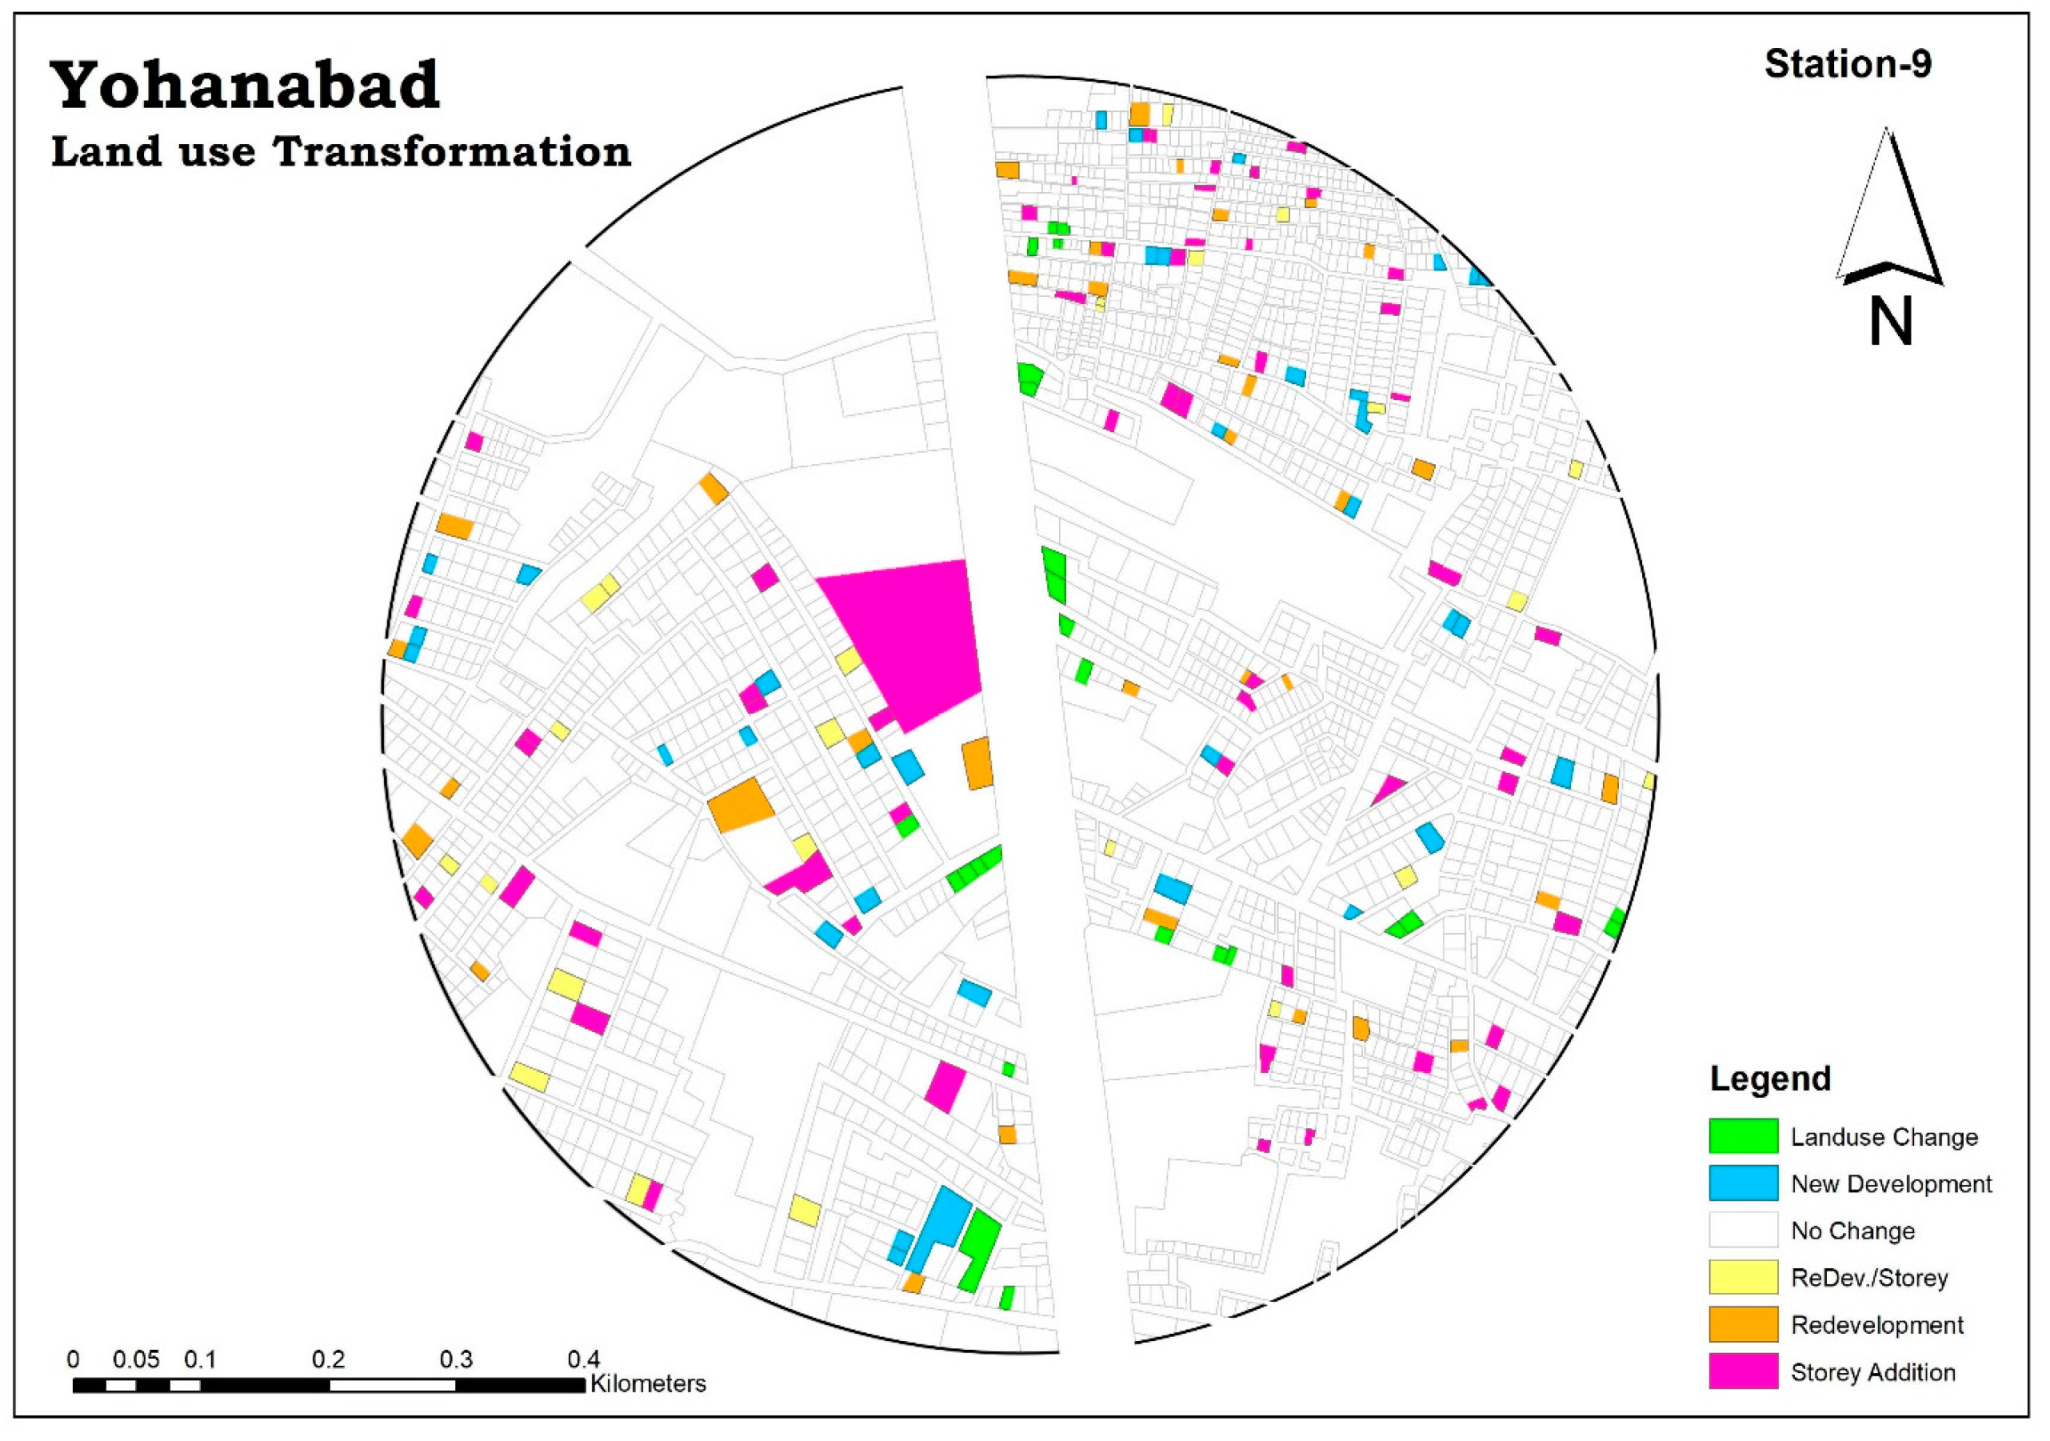
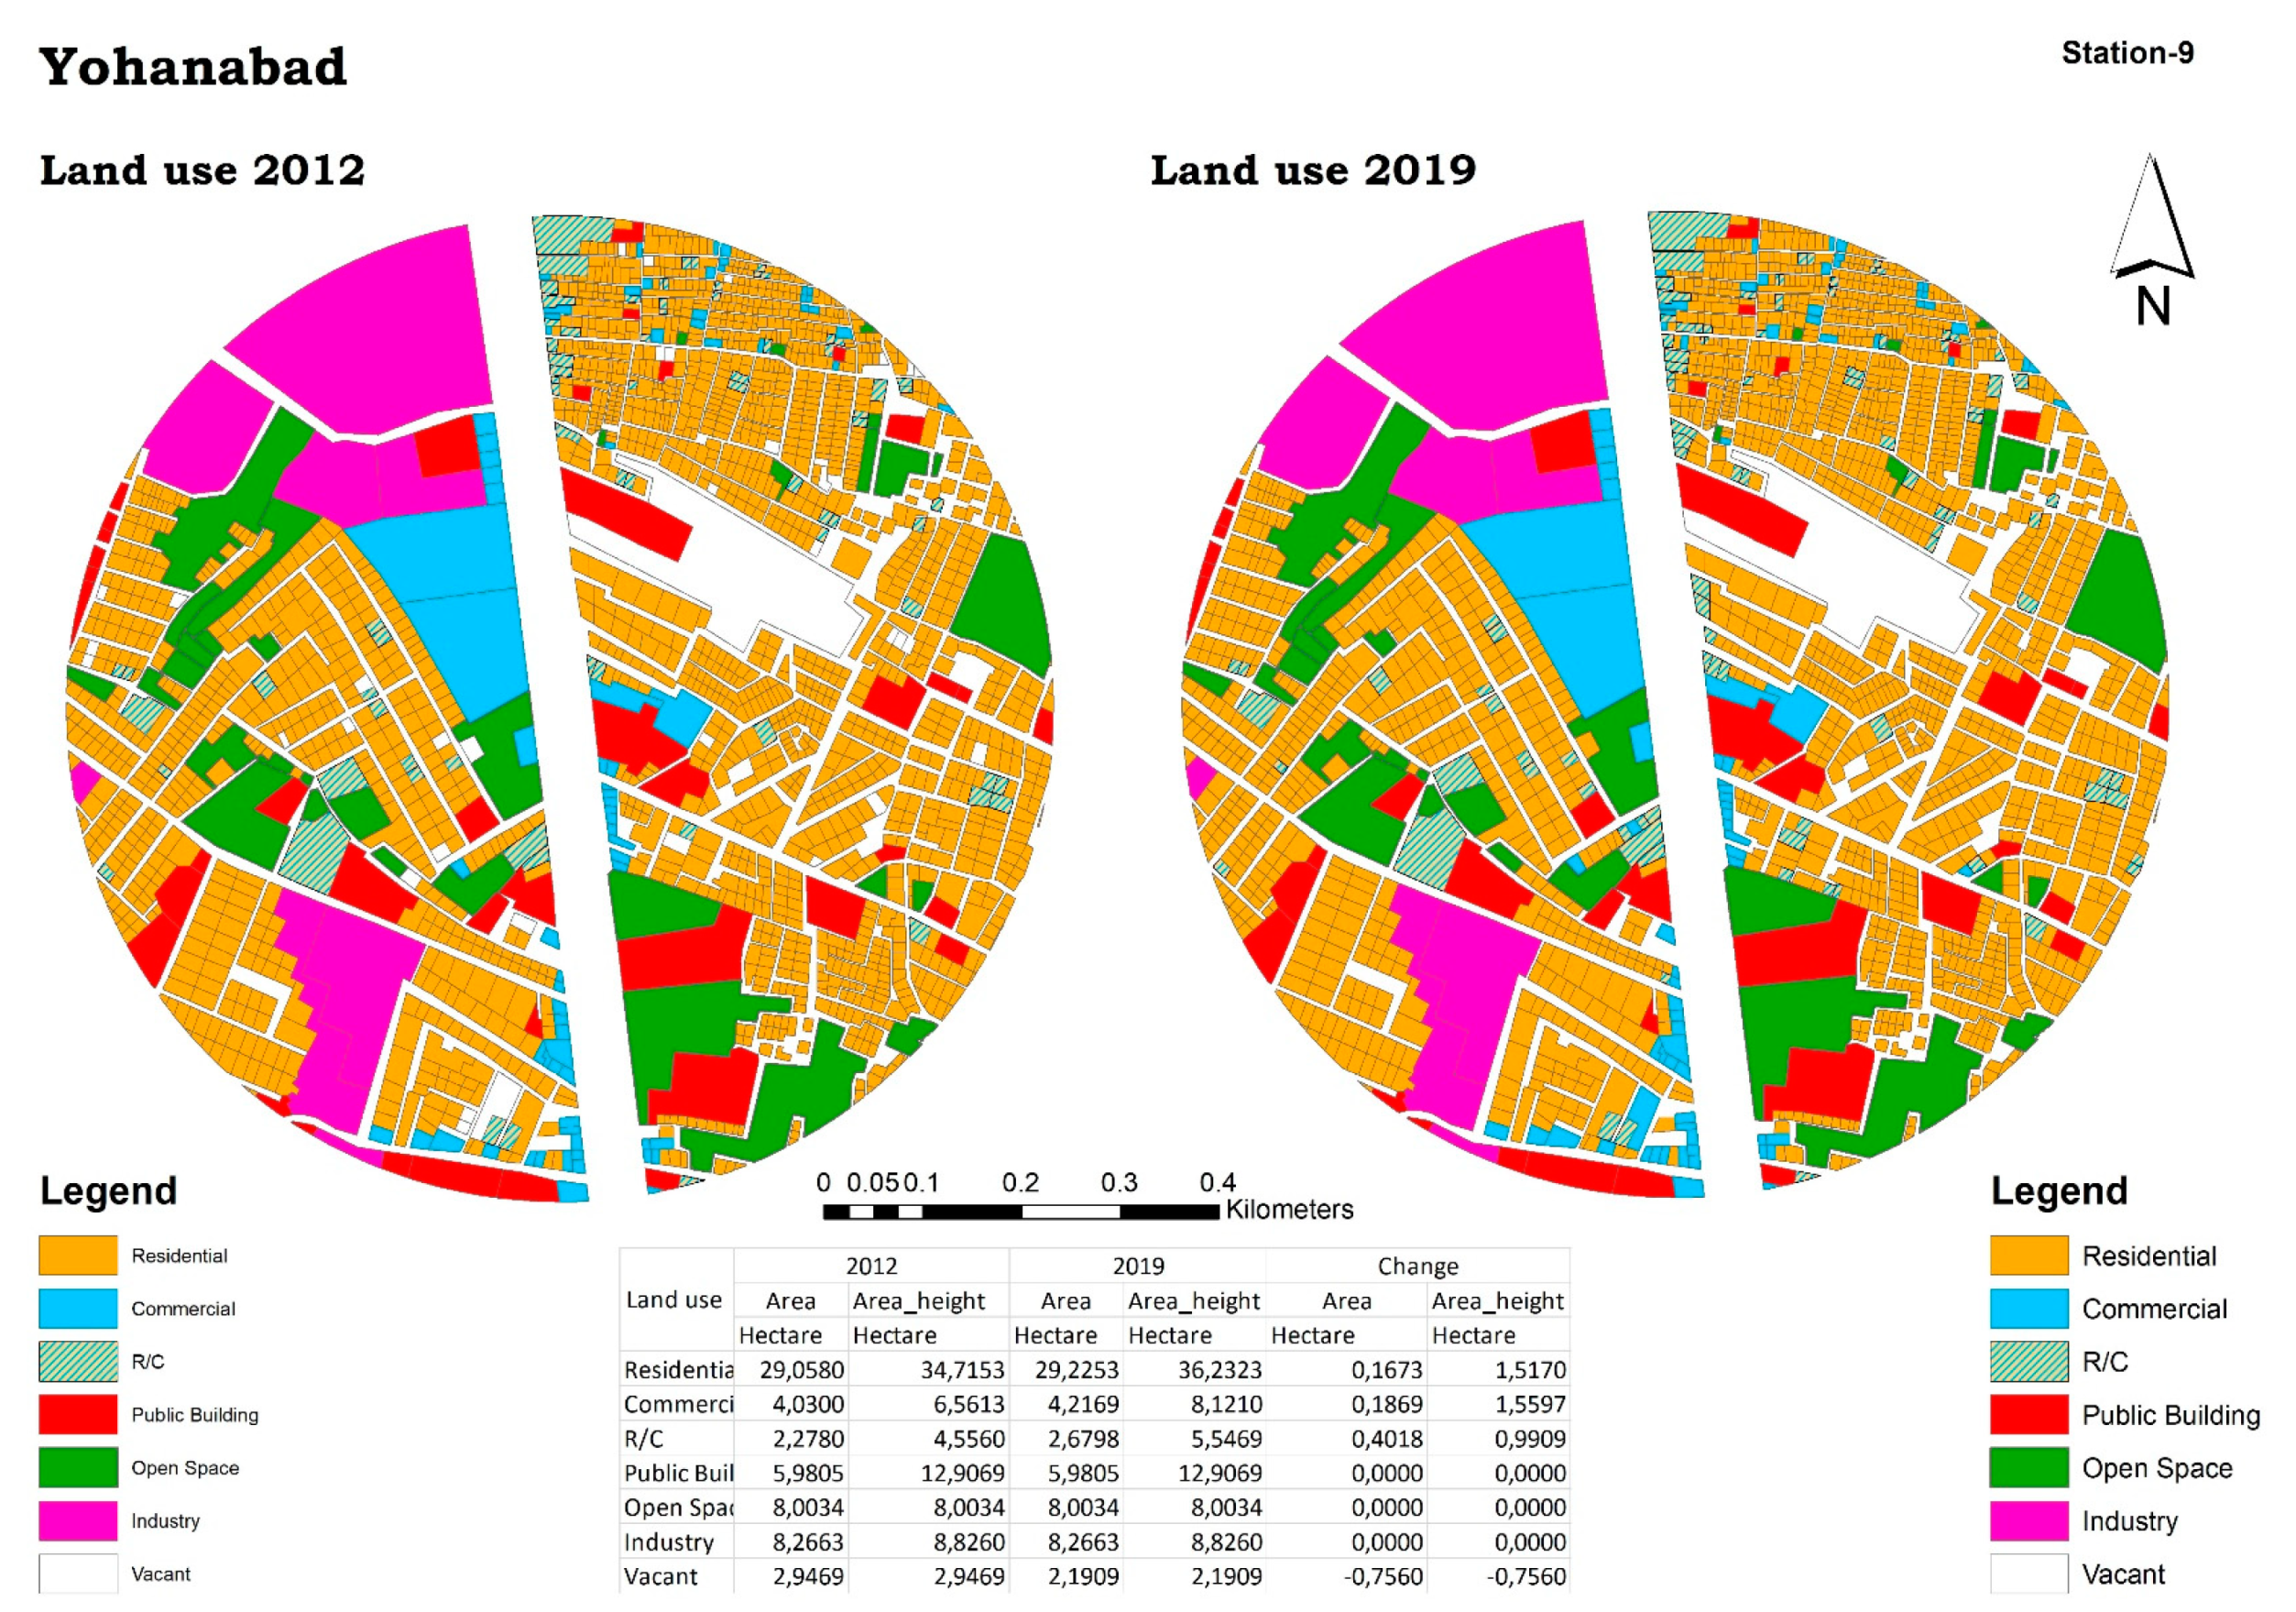
4.1.9. Station-9: Yohanabad
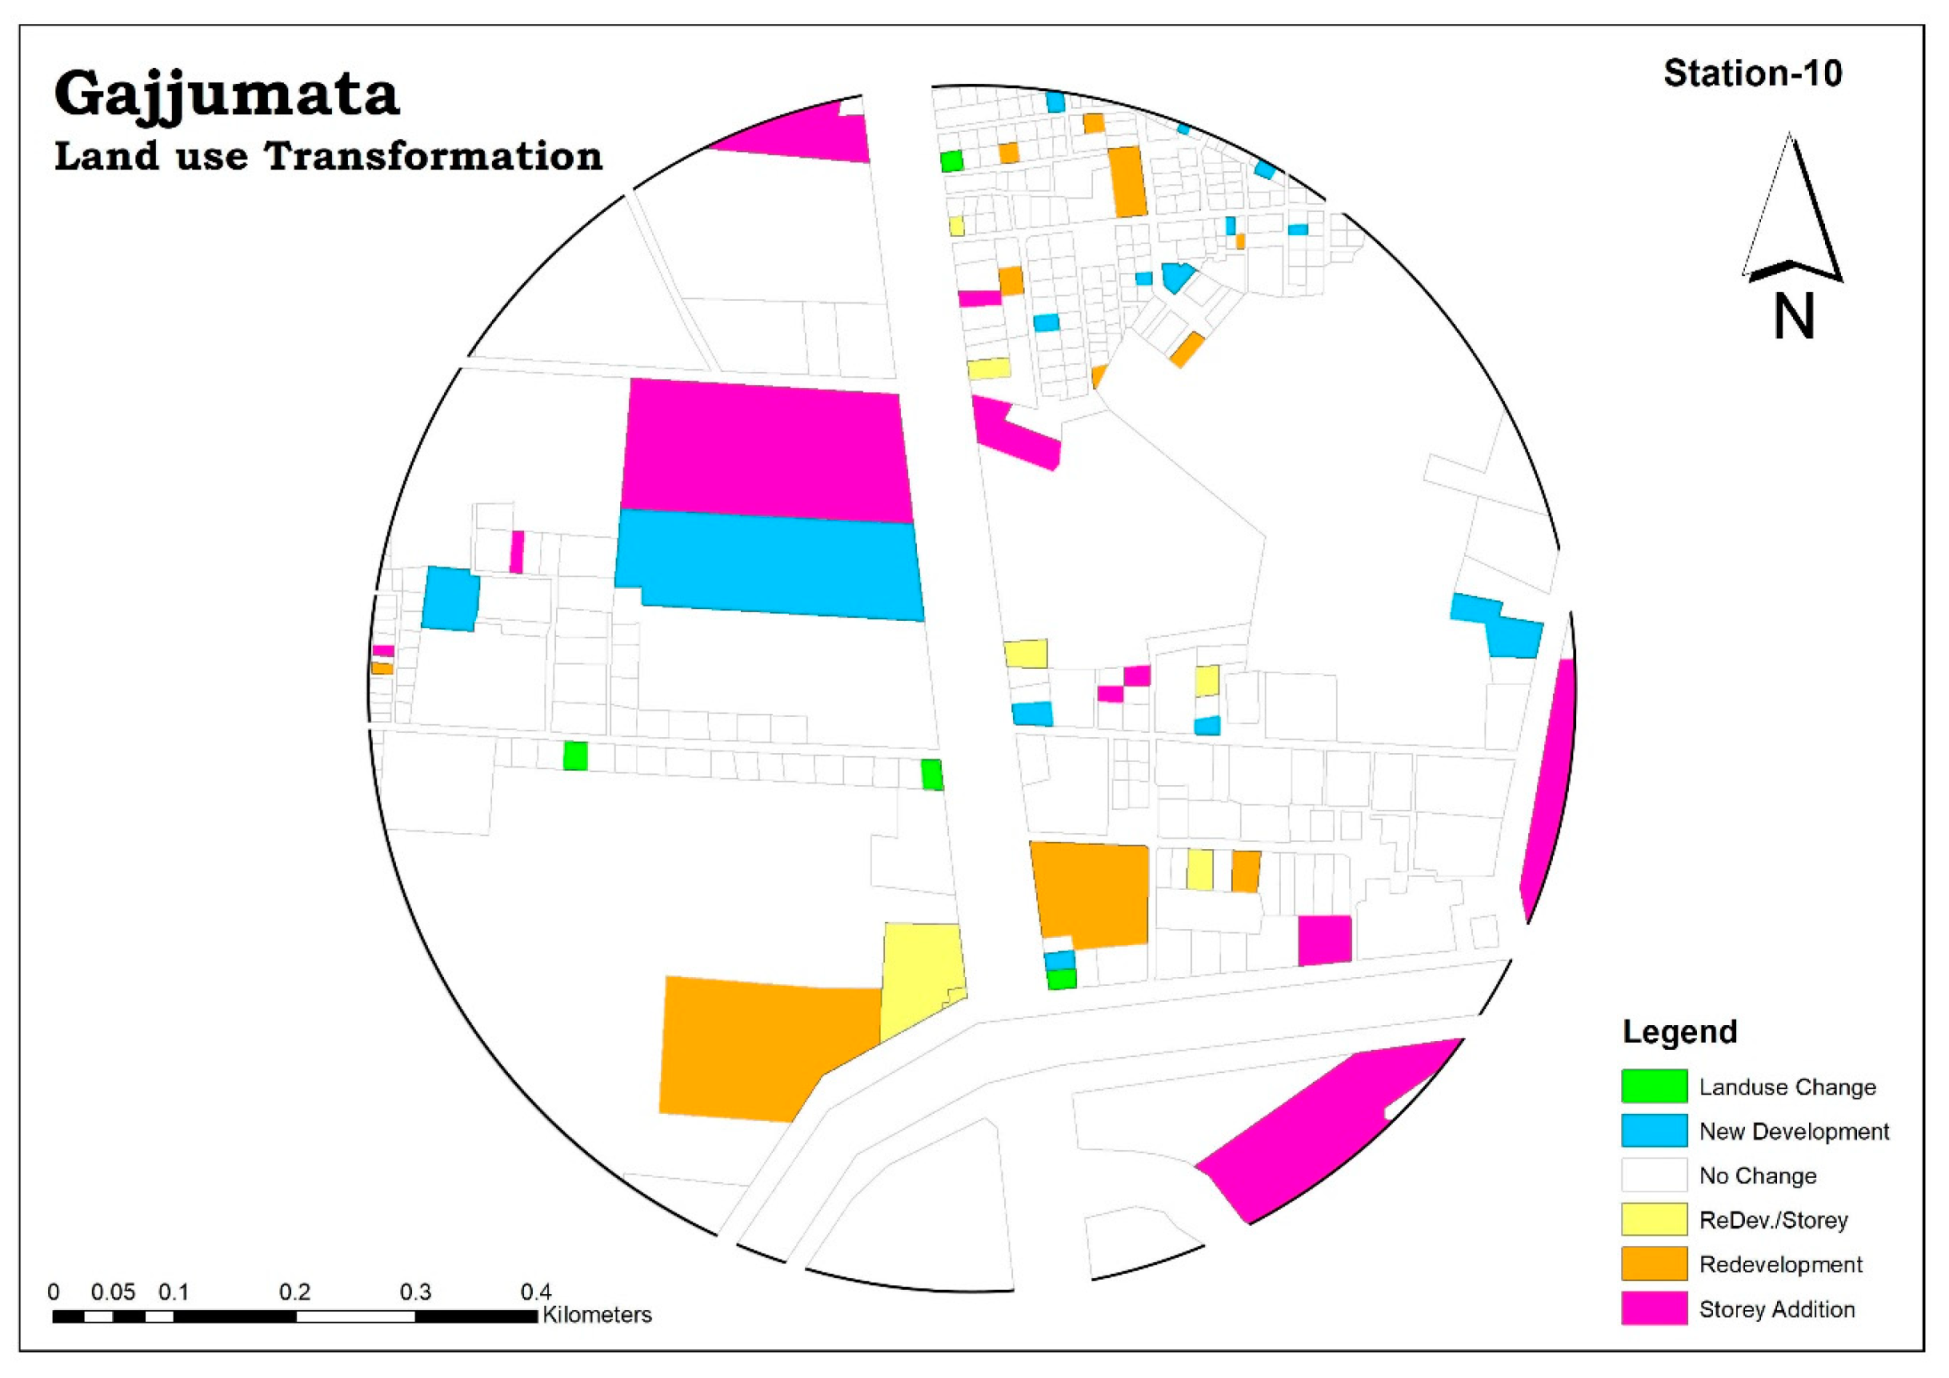
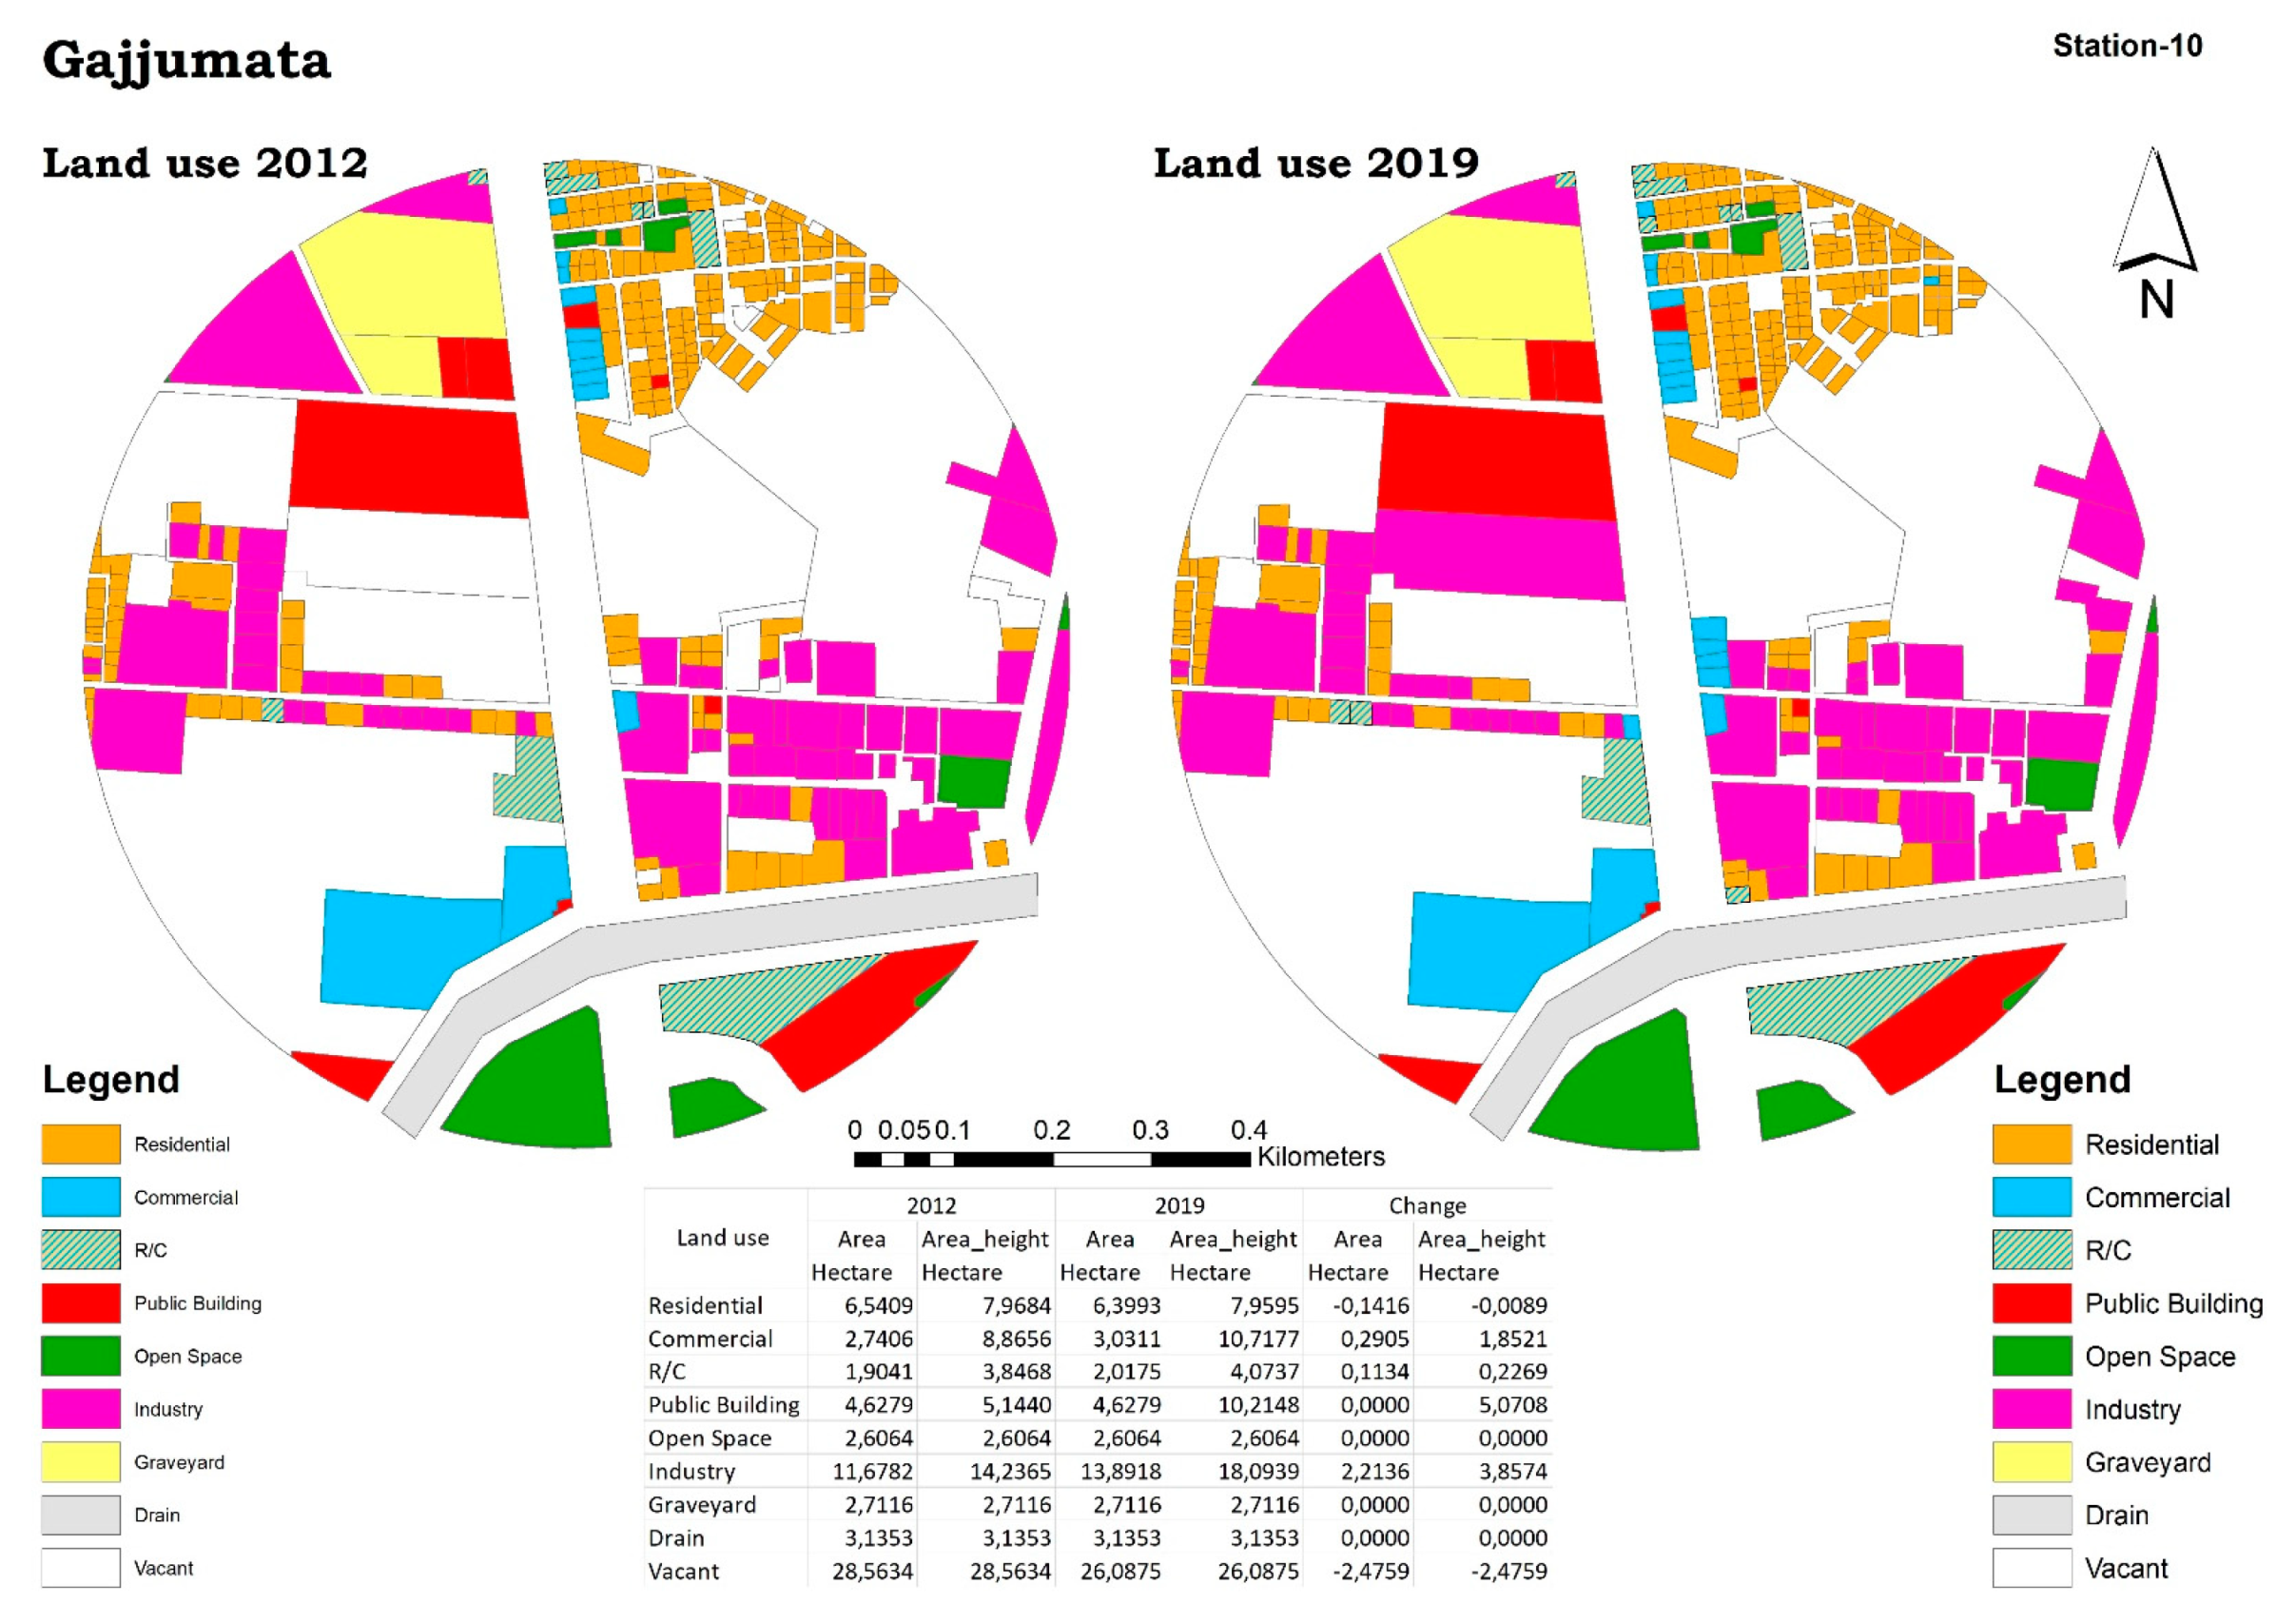
4.1.10. Station-10: Gajjumata
4.2. Impact Categories (Typology)
Functional Change
Structural Change
New Development
Mix Transformation
No Change in Urban Development
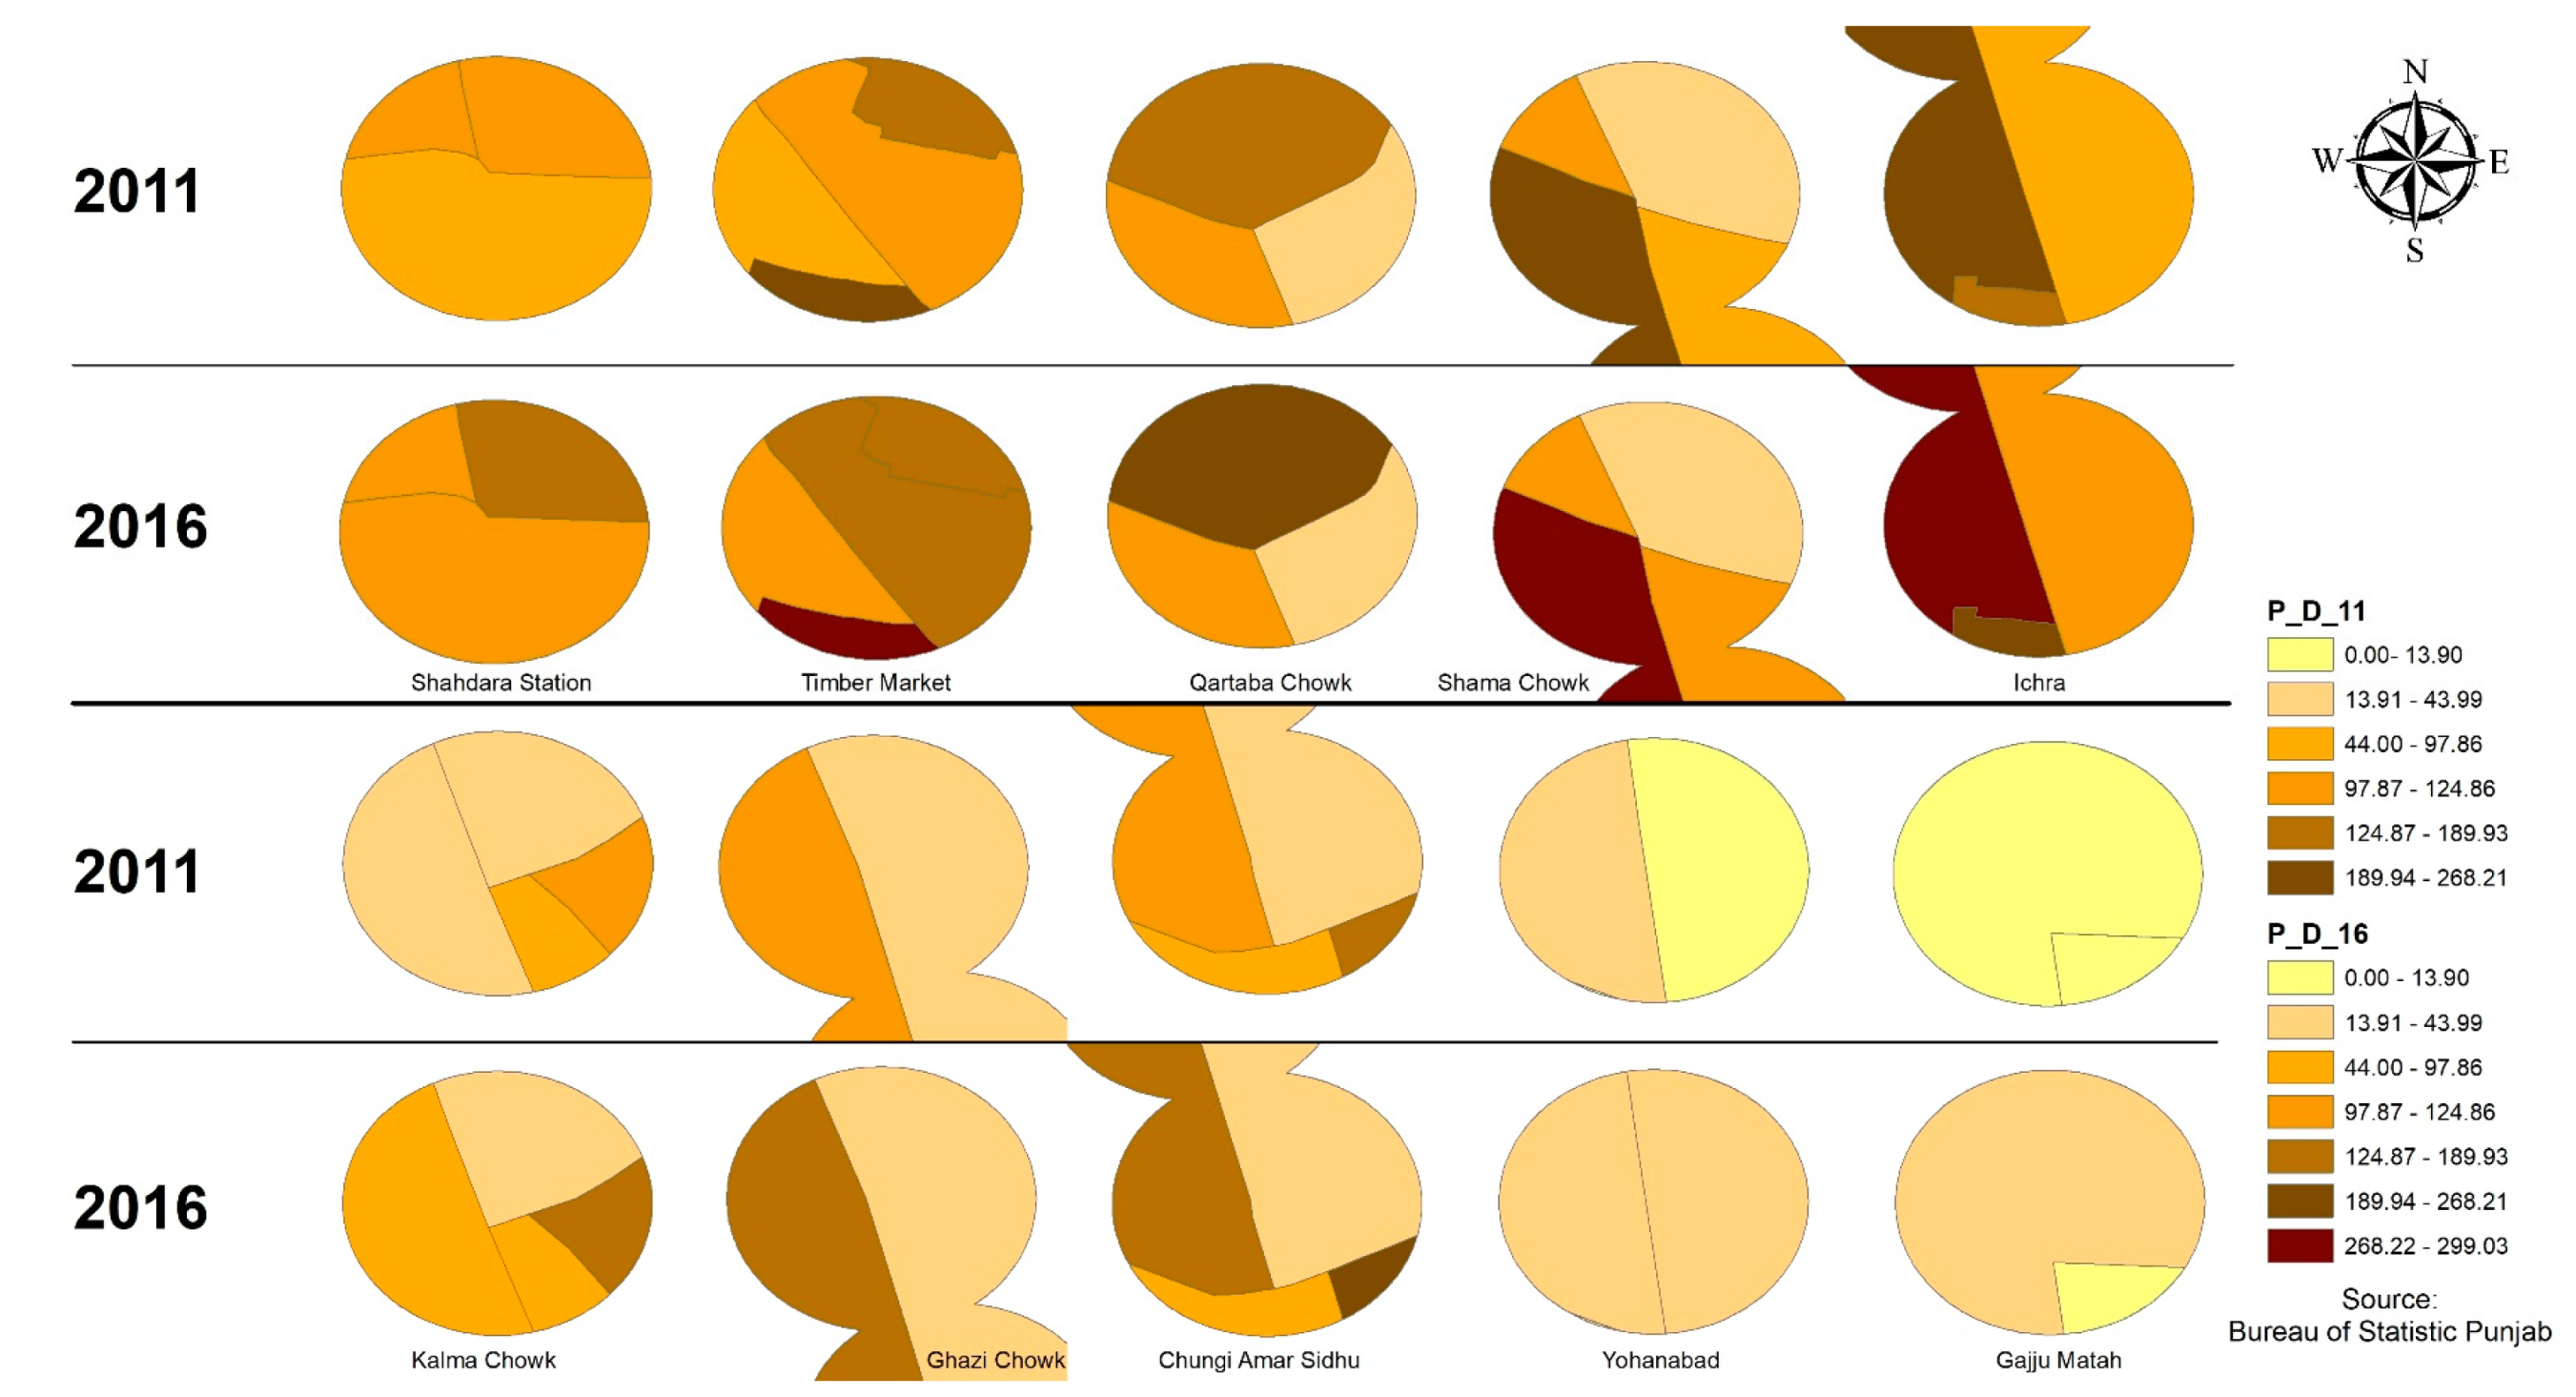
4.3. Urban Density
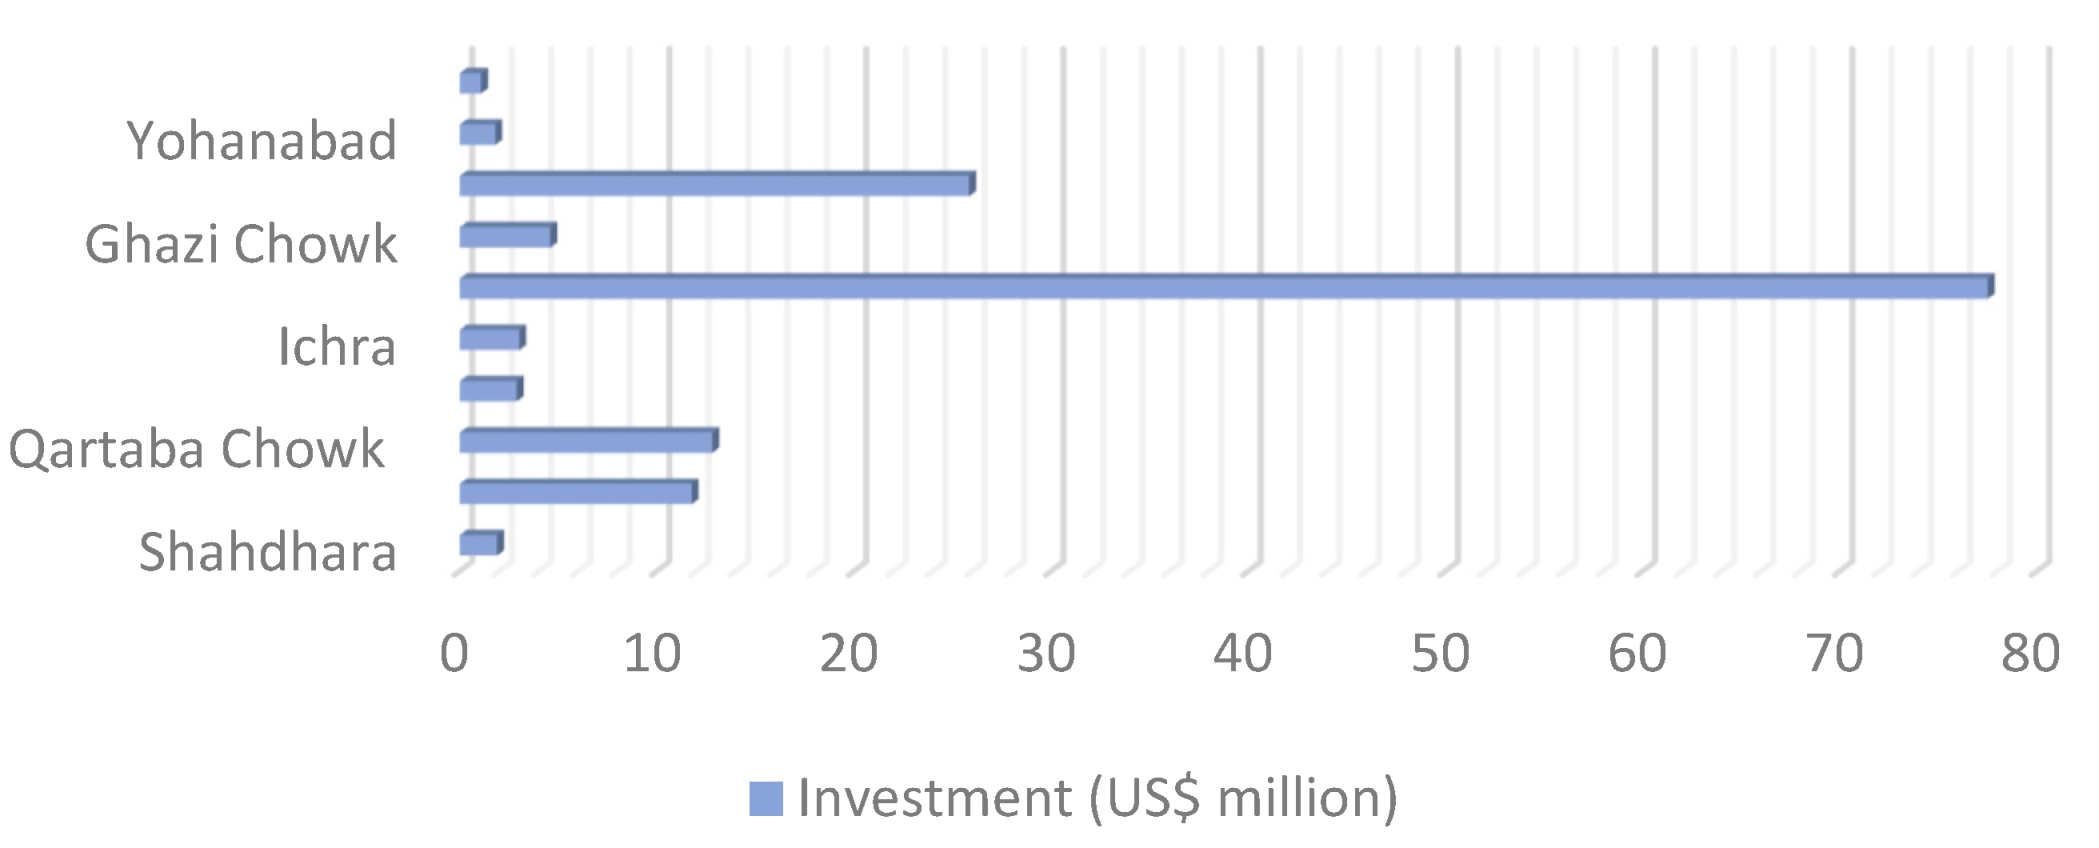
4.4. Inward Investment and Expansion of Labor Market
5. Conclusions
6. Future Recommendations
7. Limitation of the Study
Author Contributions
Funding
Conflicts of Interest
References
- Handy, S. Smart Growth and the Transportation-Land Use Connection: What Does the Research Tell Us? Int. Reg. Sci. Rev. 2005, 28, 146–167. [Google Scholar] [CrossRef]
- Knowles, R.D.; Ferbrache, F. Evaluation of wider economic impacts of light rail investment on cities. J. Transp. Geogr. 2016, 54, 430–439. [Google Scholar] [CrossRef]
- Bocarejo, J.P.; Portilla, I.; Pérez, M.A. Impact of Transmilenio on density, land use, and land value in Bogotá. Res. Transp. Econ. 2013, 40, 78–86. [Google Scholar] [CrossRef]
- Ratner, K.A.; Goetz, A.R. The reshaping of land use and urban form in Denver through transit-oriented development. Cities 2013, 30, 31–46. [Google Scholar] [CrossRef]
- Fan, Y.; E Guthrie, A.; Levinson, D. Impact of light rail implementation on labor market accessibility: A transportation equity perspective. J. Transp. Land Use 2012, 5, 28–39. [Google Scholar] [CrossRef]
- Pereira, R.H. Future accessibility impacts of transport policy scenarios: Equity and sensitivity to travel time thresholds for Bus Rapid Transit expansion in Rio de Janeiro. J. Transp. Geogr. 2019, 74, 321–332. [Google Scholar] [CrossRef]
- Eddington, R. The Eddington Transport Study-The case for action-Sir Rod Eddington’s advice to Government-December 2006. 2006. Available online: http://worldcat.org/isbn/0118404822 (accessed on 11 November 2019).
- Boarnet, M.G. Conducting Impact Evaluations in Urban Transport; World Bank, Poverty Reduction and Economic Management, Thematic Group on Poverty Analysis, Monitoring and Impact Evaluation: Washington, DC, USA, 2007. [Google Scholar]
- Yañez-Pagans, P.; Martinez, D.; Mitnik, O.A.; Scholl, L.; Vazquez, A. Urban transport systems in Latin America and the Caribbean: Lessons and challenges. Lat. Am. Econ. Rev. 2019, 28, 15. [Google Scholar] [CrossRef]
- Rodriguez, D.A.; Vergel-Tovar, C.E. Urban development around bus rapid transit stops in seven cities in Latin-America. J. Urban. Int. Res. Placemaking Urban Sustain. 2018, 11, 175–201. [Google Scholar] [CrossRef]
- Cervero, R.; Kockelman, K. Travel demand and the 3Ds: Density, diversity, and design. Transp. Res. Part D: Transp. Environ. 1997, 2, 199–219. [Google Scholar] [CrossRef]
- Knowles, R.D. Transit Oriented Development in Copenhagen, Denmark: From the Finger Plan to Ørestad. J. Transp. Geogr. 2012, 22, 251–261. [Google Scholar] [CrossRef]
- Law, C.; Knowles, R.; Grime, E.; Senior, L. Metrolink Impact Study; Department of Geography, University of Salford: Manchester, UK, 1996. [Google Scholar]
- Hass-Klau, C.; Crampton, G.; Benjari, R. Economic Impact of Light Rail: The Results of 15 Urban Areas in France, Germany, United Kingdom, and North America; Environmental & Transport Planning: Brighton, UK, 2004. [Google Scholar]
- Gakenheimer, R.; Rodriguez, D.; Vergel, E. Planning for BRT-oriented Development: Lessons and Prospects from Brazil and Colombia; Sustainable Transport and Air Quality Program; Clean Air Institute: Washington, DC, USA, 2011. [Google Scholar]
- Rodriguez, D.; Vergel, E. Bus rapid transit and urban development in Latin America. Land Lines 2013, 25, 14–20. [Google Scholar]
- Munoz-Raskin, R. Walking accessibility to bus rapid transit: Does it affect property values? The case of Bogotá, Colombia. Transp. Policy 2010, 17, 72–84. [Google Scholar] [CrossRef]
- Rodríguez, D.A.; Mojica, C.H. Capitalization of BRT network expansions effects into prices of non-expansion areas. Transp. Res. Part A Policy Pr. 2009, 43, 560–571. [Google Scholar] [CrossRef]
- Cervero, R.; Kang, C.D. Bus rapid transit impacts on land uses and land values in Seoul, Korea. Transp. Policy 2011, 18, 102–116. [Google Scholar] [CrossRef]
- Jun, M.-J. Redistributive effects of bus rapid transit (BRT) on development patterns and property values in Seoul, Korea. Transp. Policy 2012, 19, 85–92. [Google Scholar] [CrossRef]
- Levinson, H.S.; Zimmerman, S.; Clinger, J.; Gast, J. Bus Rapid Transit: Synthesis of Case Studies. Transp. Res. Rec. J. Transp. Res. Board 2003, 1841, 1–11. [Google Scholar] [CrossRef]
- Rodríguez, D.A.; Vergel-Tovar, E.; Camargo, W.F.; Vergel-Tovar, C.E. Land development impacts of BRT in a sample of stops in Quito and Bogotá. Transp. Policy 2016, 51, 4–14. [Google Scholar] [CrossRef]
- Deng, T.; Nelson, J.D. Bus Rapid Transit implementation in Beijing: An evaluation of performance and impacts. Res. Transp. Econ. 2013, 39, 108–113. [Google Scholar] [CrossRef]
- Prayogi, L. Bus Rapid Transit system’s influence on urban development: An inquiry to Boston and Seoul BRT systems’ technical characteristics. In IOP Conference Series: Earth and Environmental Science; IOP Publishing: Medan, Indonesia, 2018. [Google Scholar]
- Banister, D.; Thurstain-Goodwin, M. Quantification of the non-transport benefits resulting from rail investment. J. Transp. Geogr. 2011, 19, 212–223. [Google Scholar] [CrossRef]
- Banister, D. Cities, mobility and climate change. J. Transp. Geogr. 2011, 19, 1538–1546. [Google Scholar] [CrossRef]
- Crocker, S.; Dabinett, G.; Gore, T.; Haywood, R.; Hennebury, J.; Herrington, A.; Townroe, P. Monitoring the Economic and Development Impact of South Yorkshire Supertram; Centre for Regional Economic and Social Research, Sheffield Hallam University: Sheffield, UK, 2000. [Google Scholar]
- Oviedo, D.; Scholl, L.; Innao, M.; Pedraza, L. Do Bus Rapid Transit Systems Improve Accessibility to Job Opportunities for the Poor? The Case of Lima, Peru. Sustainability 2019, 11, 2795. [Google Scholar] [CrossRef]
- Salon, D.; Wu, J.; Shewmake, S. Impact of Bus Rapid Transit and Metro Rail on Property Values in Guangzhou, China. Transp. Res. Rec. J. Transp. Res. Board 2014, 2452, 36–45. [Google Scholar] [CrossRef]
- Cervero, R.; Dai, D. BRT TOD: Leveraging transit oriented development with bus rapid transit investments. Transp. Policy 2014, 36, 127–138. [Google Scholar] [CrossRef]
- Suzuki, H.; Cervero, R.; Iuchi, K. Transforming Cities with Transit: Transit and Land-use Integration for Sustainable Urban Development; The World Bank: Washington, DC, USA, 2013. [Google Scholar]
- Lindau, L.A.; Hidalgo, D.; Lobo, A.D.A. Barriers to planning and implementing Bus Rapid Transit systems. Res. Transp. Econ. 2014, 48, 9–15. [Google Scholar] [CrossRef]
- Vuchic, V.R. Urban Transit Systems and Technology; John Wiley & Sons: Hoboken, NJ, USA, 2007. [Google Scholar]
- Dittmar, H.; Poticha, S. Defining transit-oriented development: The new regional building block. In The New Transit Town: Best Practices in Transit-Oriented Development; Island Press: Washingston, DC, USA, 2004; pp. 19–40. [Google Scholar]
- Cervero, R. Journal Report: Light Rail Transit and Urban Development. J. Am. Plan. Assoc. 1984, 50, 133–147. [Google Scholar] [CrossRef]
- Knight, R.; Trygg, L. Evidence of land use impacts of rapid transit systems. Transportation 1977, 6, 231–247. [Google Scholar] [CrossRef]
- Combs, T.S.; Rodríguez, D.A. Joint impacts of Bus Rapid Transit and urban form on vehicle ownership: New evidence from a quasi-longitudinal analysis in Bogotá, Colombia. Transp. Res. Part A Policy Pr. 2014, 69, 272–285. [Google Scholar] [CrossRef]
- PMA. Punjab Masstransit Authority 2019. Available online: https://pma.punjab.gov.pk/ (accessed on 25 February 2020).
- Deng, T.; Nelson, J.D. The perception of Bus Rapid Transit: A passenger survey from Beijing Southern Axis BRT Line 1. Transp. Plan. Technol. 2012, 35, 201–219. [Google Scholar] [CrossRef]
- Deng, T.; Nelson, J.D. The impact of bus rapid transit on land development: A case study of Beijing, China. World Acad. Sci. Eng. Technol. 2010, 66, 1196–1206. [Google Scholar]
- Al-Mosaind, A.M.; Dueker, K.J.; Strathman, J.G. Light-rail Transit Stations and Property Values: A Hedonic Price Approach. 1993. Available online: http://onlinepubs.trb.org/Onlinepubs/trr/1993/1400/1400-013.pdf (accessed on 18 October 2019).
- Perdomo Calvo, J.A.; Mendoza, C.A.; Baquero-Ruiz, A.F.; Mendieta-Lopez, J.C. Study of the Effect of the Transmilenio Mass Transit Project on the Value of Properties in Bogotá, Colombia; Working Paper No. WP07CA1; Lincoln Institute of Land Policy: Cambridge, MA, USA, 2007. [Google Scholar]
- Cervero, R.; Day, J. Suburbanization and transit-oriented development in China. Transp. Policy 2008, 15, 315–323. [Google Scholar] [CrossRef]
- Vale, D.; Viana, C.M.; Pereira, M. The extended node-place model at the local scale: Evaluating the integration of land use and transport for Lisbon’s subway network. J. Transp. Geogr. 2018, 69, 282–293. [Google Scholar] [CrossRef]
- Pezeshknejad, P.; Monajem, S.; Mozafari, H. Evaluating sustainability and land use integration of BRT stations via extended node place model, an application on BRT stations of Tehran. J. Transp. Geogr. 2020, 82, 102626. [Google Scholar] [CrossRef]


| Data | Years | Values | Source |
|---|---|---|---|
| Urban density | 2011, 2016 | Persons per acre | Bureau of statistics Punjab |
| Land-use Height of buildings | 2012 | Shapefile (GIS format) | Department of City and Regional Planning, UET Lahore |
| Land-use Height of buildings | 2019 | Shapefile (GIS format) | Land-use surveys and Lahore Development authority |
| Inward investment | 2019 | US $ | Field surveys |
| Labor market | 2012, 2019 | − | Field surveys |
| Building/cover area | 2012, 2019 | Hectare | Calculated using ArcGIS |
| Land-Use | Area (Hectare) | |||||||||
|---|---|---|---|---|---|---|---|---|---|---|
| Shahdhra | Timber | Qartaba | Shama | Ichra | Kalma | Ghazi | Chungi | Yohanabad | Gajjumata | |
| Residential | 0.38 | −0.25 | −0.67 | 2.54 | 5.69 | 0.11 | 1.58 | 1.33 | 1.52 | −0.01 |
| Commercial | 10.77 | 7.95 | 2.74 | 1.55 | 0.82 | 4.20 | 1.30 | 4.01 | 1.56 | 1.85 |
| R/C * | 1.47 | −3.11 | 0.51 | 0.33 | 1.59 | −0.43 | 0.89 | 4.03 | 0.99 | 0.23 |
| Public Building | 0.09 | 0.82 | 0.00 | 0.32 | 0.53 | 1.18 | 0.44 | 2.13 | 0.00 | 5.07 |
| Industry | −0.08 | 0.00 | 0.00 | 0.00 | 0.29 | 0.00 | 0.00 | 0.02 | 0.00 | 3.86 |
| Hospital | 0.00 | 0.00 | 0.00 | 0.00 | 0.11 | 0.00 | 0.00 | 0.00 | 0.00 | 0.00 |
| Office | 0.00 | 0.00 | 0.00 | 0.09 | 0.24 | 1.31 | 0.00 | 0.00 | 0.00 | 0.00 |
© 2020 by the authors. Licensee MDPI, Basel, Switzerland. This article is an open access article distributed under the terms and conditions of the Creative Commons Attribution (CC BY) license (http://creativecommons.org/licenses/by/4.0/).
Share and Cite
Basheer, M.A.; Boelens, L.; Bijl, R.v.d. Bus Rapid Transit System: A Study of Sustainable Land-Use Transformation, Urban Density and Economic Impacts. Sustainability 2020, 12, 3376. https://doi.org/10.3390/su12083376
Basheer MA, Boelens L, Bijl Rvd. Bus Rapid Transit System: A Study of Sustainable Land-Use Transformation, Urban Density and Economic Impacts. Sustainability. 2020; 12(8):3376. https://doi.org/10.3390/su12083376
Chicago/Turabian StyleBasheer, Muhammad Aamir, Luuk Boelens, and Rob van der Bijl. 2020. "Bus Rapid Transit System: A Study of Sustainable Land-Use Transformation, Urban Density and Economic Impacts" Sustainability 12, no. 8: 3376. https://doi.org/10.3390/su12083376
APA StyleBasheer, M. A., Boelens, L., & Bijl, R. v. d. (2020). Bus Rapid Transit System: A Study of Sustainable Land-Use Transformation, Urban Density and Economic Impacts. Sustainability, 12(8), 3376. https://doi.org/10.3390/su12083376