1. Introduction
Currently, the need for building a sustainable production system is increasingly evident in the industrial world [
1]. However, the rapidity of the changes and the breadth of the industrial aspects involved make it difficult for business leaders to quickly choose among different potential scenario evolutions [
2]. Simulation software allows us to quantitatively evaluate the impact of today’s choices on future developments with reasonable confidence (e.g., how a certain configuration of resources upstream of the process impacts the total lead time as demand changes) [
3]. However, despite the evolutions in the software field, the use of these tools, along with their setup, is often very complex [
3]. Among the various obstacles to their applicability in industrial contexts are, undoubtedly, the relevant costs in terms of time required to design, calibrate, and validate the process models, and the need for advanced technical modeling skills [
4]. Moreover, another challenge lies in the need to start the simulation project from an accurate and detailed representation of the system to ensure visibility on all sub-process variations [
5]. For these reasons, to date, there is a large gap between the strategic and tactical requirements of the management (e.g., energy reduction, plastic usage reduction, etc.) and the technical operational complexity of the simulation [
6].
Therefore, this research aims to provide a valuable tool for supporting corporate leaders in facing the need to quickly choose optimal configurations in their processes. Indeed, one of the major challenges for the management is to reduce waste in order to reach the sustainability goals of the company.
It is interesting to investigate the existence of a tool capable of guiding a “what if” analysis on the configuration of a production system and allowing us to quantitatively estimate the effects of the variations on the most relevant environmental parameters, e.g., the GHG emission from energy consumption of the line (ton CO
2 eq/unit), the ratio of renewable energy used (%), the total water consumption (ton/unit), the mass of restricted disposals (kg/unit), the noise level outside the factory (dB), etc. [
7]
Above all, lean approaches are considered a necessary condition for practicing sustainable manufacturing. Hence, it is important to investigate which lean tools can help with taking into account sustainability considerations [
8].
In this paper, the possibility to advantageously integrate the Value Stream Map (VSM) and simulation approaches into the analysis of goods and services production systems is investigated. In fact, VSM is one the tools of the so-called “lean philosophy”, and it aims at identifying and reducing wastes through the detection of the non-value added activities. Furthermore, VSM has the key advantage of mapping the end-to-end process [
9]. This advantage allows for a unified representation of the overall process, in which all the inputs for different types of simulations are collected.
In particular, authors investigate how to transform the VSM into a suitable methodology to connect strategic needs with operational ones, guiding the simulation through precise categories of outputs established in the VSM. Indeed, the classical VSM is generally sketched at a very high level, and only the main product transformations are captured [
8]. For this reason, it is necessary to develop an extension of the VSM to guarantee the most complete adherence to the analysed process. With the aim of using VSM as a supporting tool in the modeling definition phase of a production system simulation, a specific approach is proposed.
The proposal is described into two main sections: in the first section a basic criterion through which it is possible to increase the detail level in the VSM is identified; in the second section further criteria for defining the data categories required in input and output for sub-process modeling through an extended VSM (X-VSM) approach are outlined. By defining these data categories, it is possible to guide the simulation so that outputs are matching expectations and required variables.
2. Background
The objective of this research is to investigate how to exploit the VSM to connect the strategic needs of the management to the operational aspects related to production process simulation, first of all, by defining the simulation output requirements to effectively help managers perform a what-if analysis on sustainability issues. The literature on VSM is vast. Restricting the review to the scope of the paper, VSM has been mentioned in the sustainability literature primarily as a tool to measure or reduce wastes. Moreover, it has been associated with process simulation mainly as a tool to support data collection.
2.1. VSM and Sustainability
Lean manufacturing is a well-known production system management philosophy [
10] born after the Second World War in the Toyota Motor Company. Its main goal is to reduce and eliminate waste, increasing the value of the finished product and reducing costs [
9]. Over the last ten years, the target of only improving business results has shifted towards increasing social and environmental responsibility also [
11], and the future of the lean manufacturing approach is to become environmentally friendly, socially impactful, and economically sustainable [
12]. In fact, researchers are proposing new methodologies to integrate green initiatives with the principles of lean manufacturing [
13,
14], and studies are being published on the opportunities of focusing on materials and energy consumption waste reduction [
15,
16].
VSM is a pen and pencil lean manufacturing tool used to represent the main process flow along with all the related activities needed to transform raw materials into final products [
9]. VSM has the primary role of identifying all types of wastes along the so-called “value chain” and eliminating them [
9]. Furthermore, the VSM provides valid support for the optimization decisions of the value chain. Indeed, it gives a common basis for the production process description [
10], which helps the design of the process model and, in turn, potentially feeds the software simulation building [
17]. VSM has been linked with the topic of sustainability in various studies, where VSM variants have been proposed aiming at highlighting wastes in the mapped processes related to water [
18,
19], energy [
18,
20,
21,
22], materials [
18], and emissions [
22].
More recently, Edtmayr et al. [
23] proposed a new approach to capture the environmental impact of resource consumption through VSM using the re-utilization cycle tool. In this approach, the main KPI used by authors is the kg CO
2 eq, further improved by Sunk et al., which also includes time measurement in the process [
24]. To complete and support studies on the application of VSM in the environmental performance field, Garza-Reyes et al. (2018) proposed a new approach based on the Deming’s Plan-Do-Check-Act cycle (PDCA), in order to promote E-VSM research [
25].
In addition to all these valuable contributions that endorse the VSM inherent potential to support sustainability goals, several authors investigated the linking between these new approaches and the simulation.
For example, Pju and Johansson [
26] proposed several sustainability-related indicators based on VSM, linking them to discrete event simulation. Moreover, Sparks [
27] developed a DES model to simulate the supply chain, identifying new metrics to assess economic, societal and environmental sustainability for the supply chain, and introduced visual symbols to easily capture waste.
2.2. VSM and Simulation
Simulation is one of the most effective tools among those conceived to support leaders’ decisions, specifically when it comes to understanding how to optimize processes [
3]. In a discrete manufacturing environment, simulation of discrete-time events is defined as: “a computerized system capable of creating deterministic and stochastic simulations in real- or near-real time, in order to monitor, control and schedule parts and resources” [
28]. This type of simulation allows for dynamic analysis of production systems to identify possible improvements on the “as is” state of the process and the possibility of introducing new technologies [
29] in future scenarios, often referred to as “to be” states.
Although its use at the company level remains limited [
4], several researchers focused their attention on simulation because of its huge potential. Indeed, simulation is a useful tool for analysing complex systems [
30] and allows us both to observe and quantify any variation. In fact, whether the object of simulation is a production line or an operating room, a simulation can be used to evaluate alternative designs or to improve an existing one, allowing savings on cost and reduce lead time [
3]. As a matter of fact, modelling and simulation are emerging as key technologies to support manufacturing in the 21st century [
3].
Lugaresi and Matta [
31] systematized the main contributions proposed in the simulation’s literature to streamline the simulation process design and identify the main related problems. They found out that the main one is related to the representation and data collection activities, which are presented as the more time-consuming phases in the initial steps of the project. Several authors presented some ideas for optimizing the data collection phase: for example, Robertson and Perera [
32] hypothesized anticipating it through an intermediate database between the company information system (ERP) and the setting of the input data, aiming to save time in process modeling; Tavakoli et al. [
33] proposed the base for a flexible data management system applicable to a wide variety of manufacturing contexts.
Additionally, in order to face these problems, different authors have analysed the possibility of using the Value Stream Map as a complementary tool for different phases of the simulation process.
Specifically, Donatelli et al. [
34] discussed the integration of VSM and discrete event simulation, focusing on the contribution of the current and future states of the VSM in the simulation. However, their research does not provide any suggestions on how to extend VSM to make it a reliable representation of the process. Similarly, Dogan and Unutulmaz [
35] used VSM in order to visualize the current and the future states of the process, using simulation to make dynamic maps.
Moreover, Liam and Landeghem [
36] proposed a modified use of VSM according to the typology of the process (e.g., one product static, one product dynamic, multiple products static, etc.). Also, in this research, the authors did not provide any suggestions on how to enhance the classical VSM. Other authors, like Atieh et al. [
37], used VSM as the first step for a discrete event simulation, but only for capturing the potential alerts in the process.
More recently, Barring et al. [
38] hypothesized the possible use of the Value Stream Map as a support tool for data collection for a simulation system. Specifically, they discussed how to gather data for simulation, proposing a classification of data based on its availability. Even if their contribution provides complementary support for future studies, the possibility of extending both data categories and the level of detail of the map is not mentioned.
In the very recent literature, Antonelli and Standnicka [
39] faced the problem of extending data categories in the VSM, presenting a set of necessary data, divided by parameter, input, and output. Even though the authors provided a new categorization of data, the research is focused only on the categories of the number of resources, key time indicators, availability of the workstation and the frequency of operations, without considering all the other categories that describe a process.
Furthermore, Quan Yu et al. [
40] highlighted several limitations of the traditional VSM approach when combined with discrete event simulation. Specifically, they showed how one of the main problems of the traditional VSM is the limited level of detail, which provides a static picture of the process.
As far as the authors know, while several researchers have investigated the possibility of using the VSM as support for simulation tools from several points of view, new procedures to extend the level of detail of the VSM and the standardization of data categories to capture all the process dimensions have not been investigated so far.
In this contest, the focus of this research is on the improvement of the VSM to facilitate the design of the process simulation. Thus, the VSM and simulation are intended as a combined tool to drive the strategic sustainability goals towards practical operational implementation. The VSM support for the management decisions, in terms of process redesign for waste reduction, can be easily evaluated.
3. Methodology
As previously stated, this research aims to investigate the possibility to advantageously extend the VSM in order to make it suitable for simulation. Indeed, as mentioned, business leaders need to be supported by usable and flexible tools in order to face daily decisions regarding how to optimize their company’s processes.
Therefore, two different procedures have been proposed to extend both the representation of VSM and data categories of the process.
In the next section, the algorithm for extending the VSM is described, showing how the X-VSM (extended VSM) helps in capturing all the transformations that occurred during the process. This procedure has been built after a deep analysis of the product value stream and then applied to the value stream of a largely-consumed good in a manufacturing multinational company. To show the value of the X-VSM, an example is proposed. Indeed, the first example shows the difference between the classical VSM and the X-VSM, applied to a specific phase of the value stream. In particular, the comparison highlighted the deeper level of detail that the X-VSM provides. Indeed, while in the VSM the product goes from the supplier to the inventory through the truck, in the X-VSM all the transformations that occurred between the truck unloading up to the storage operation are captured.
Since in the classical VSM there is little data, mainly regarding time consumption of each activity, in the section “a proposal of categories of input and output data for manufacturing processes”, several categories of data have been defined. Specifically, data has been classified in two main categories: input data, which includes all the information necessary to define the operating rules for an activity execution; and output data, i.e., all the quantitative aspects related to the performance of each activity. Both categories have been divided into several sub-categories, taking into consideration different dimensions. In order to show the importance of catching all the relevant aspects of the process, in the second example, all data regarding the truck unloading activity have been considered. This procedure helps in analysing the process from several perspectives, taking into account all the different impacts.
After the description of the model, an application of the X-VSM is presented and discussed. Specifically, the application described the different energy consumption levels between two different process configurations.
3.1. A Criterion for Expanding the Value Stream Map
In this first section, a simple and flexible solution to the problems typically encountered during the definition phase for building a simulation model is proposed. Definition of process blocks is usually performed by those who know the simulation software, who may not have a deep knowledge of the process. In these cases, the designed model may diverge from reality. This undesired situation emerges during the validation phase, invoking time-consuming rework tasks.
On the contrary, starting from the VSM on the process may be very convenient: in fact, beyond being an easily-readable diagram, the VSM is already—or can easily be—shared and validated at the managerial level.
In this sense, the proposed approach is “top-down”. That is, the main processes, representing the core of the simulation model, are discussed and validated by the top management, and then transmitted to the person who builds the simulation blocks. In this way the simulation process is validated upstream, requiring less time.
However, one of the main problems found in considering the VSM as a valid representation of the production process is the level of details; as a strategic tool focusing on the value chain, the VSM traditionally provides few details and puts emphasis on the main activities. Thus, the criteria for expanding the VSM and increasing the level of details must be found. In particular, a basic criterion that originates from focusing on the concept of transformation of the items through the process is proposed.
An item transformation can be of different types, and three types have been considered: state transformation, position transformation, and physical transformation
- -
State transformation criterion: the first transformation refers to a change in the state of an item and it is defined as a process, an activity, an operation, or more generally, an action that generates a variation of an attribute of an item, leaving its physical state and position unchanged. Attributes may be of various types, such as qualitative (e.g., “approved” or “not approved”), informative (“assigned to A area” or “assigned to B area”), etc.
- -
Position transformation criterion: the second transformation refers to a change in the position or location of an item, and it is defined as a process, an activity, an operation, or more generally, an action that generates a change in the spatial position of the item within the reference area. For example, moving the item from the warehouse to the production line.
- -
Physical transformation criterion: the third transformation is defined as a process, an activity, an operation or, more generally, an action that generates a physical change of the component; for example, a change in its shape, temperature, nature, or a change in its loading unit volume, etc. Wherever one of these transformations is implicitly assumed, it must be clearly represented on the VSM as a specific activity.
The decision-making process for choosing whether to extend the classical VSM involves the analysis of every single arrow of a representation. If a single arrow is representative of multiple transformations, and more, if the transformation is relevant and is part of a standard process, then it must be mapped.
In
Figure 1, an example showing the differences between a classic VSM and the extended one (X-VSM) is presented. It can be noticed that, while the classical VSM shows the value stream of the product from the supplier to the warehouse without highlighting any activities in the middle, the X-VSM allows the visualization of all the transformations that occur in each sub-process. Specifically, two transformations occurred between the truck and the warehouse. The first one is a position transformation, i.e., the item is unloaded from the truck; the second one a state transformation, i.e., the item passes from “not-labeled” to “labeled”.
This simple example allows us to understand how the level of detail can be improved through the X-VSM. Indeed, through this extension, a reliable representation of the process can be achieved, providing a valuable input for the simulation.
3.2. A Proposal of Categories of Input and Output Data for Manufacturing Processes
In order to make the VSM a valid tool for supporting and guiding process simulation, it is also necessary to define data categories to be included in the description of each activity. Indeed, when designing a process model, several data must be inputted into the simulation software and shall be collected in advance. Data categories are divided into two main groups: input data and output data.
3.2.1. Input Data
Input data includes all the information, attributes, or variables necessary to define the operating rules for an activity execution and influence the activity execution performance. In other words, the information, attributes or variables which do not affect an activity execution performance are excluded from the input data set and may not be specified in the extended VSM.
Input data can be classified into four categories:
Input data related to resources: i.e., any data related to the resource needed for the execution of the activity (e.g., resource capacity). Resources can be divided into:
human resources;
technical resource (machines, tools, etc.);
raw material (plastic, water, etc.);
energy (electricity, gas, etc.);
Input data related to conditions: i.e., any data related to the factors or circumstances directly or indirectly affecting a resource performance. These factors or circumstances are mainly of two different natures:
environments (e.g., humidity conditions causing inefficiency in human workers or in the equipment performance);
items (e.g., the quality condition of a specific material causing slowdowns of a manufacturing phase);
Input data related to planning: i.e., any organizational factor related to planning and/or scheduling of the execution of the activities (e.g., resource capacity allocation over time, master planning, etc.);
Input data related to the output of other activities.
3.2.2. Output Data
Output data include all the quantitative aspects related to the performance of each activity. Output data can be classified into four categories:
Time data: all the key performance indicators (KPIs) measuring the performance of an activity in terms of time consumed for its execution (lead time, waiting time, etc.);
Quality data: all the KPIs measuring the performance of an activity in terms of quality aspects (scrap ratio, first-pass yield, etc.);
EHS (environmental health and safety) data: all the KPIs measuring the performance of an activity in terms of environment, health, and safety (energy consumed by the work unit over time, number of accidents, etc.);
Cost data: all the KPIs measuring the performance of an activity in terms of the cost of the activity execution. This data category includes figures which typically transform the data in all the previous categories into monetary terms.
Each input or output data in the analysed categories shall be defined at least along with its quantitative aspects; in some cases, a single number may be sufficient; however, defining a couple of values (average and standard deviation; min/max range values; target value and confidence interval, etc.) is advisable.
In this section, an example of data construction for a position transformation activity is proposed. In
Figure 2, the unloading of the item from the truck to the plant is considered. Eight types of data were identified to be included in the table belonging to the categories explained above.
This example aims to show how, when collecting a wider set of data, the process can be analysed from different perspectives. Indeed, the new data categories allow us to consider different types of waste in the value chain. Moreover, some data, like the weight of the item or the humidity condition, can be used for thoroughly analysing the process.
4. Advantages of the X-VSM
The classical VSM does not have the characteristics of representativeness and functionality to support a simulation model. In particular, it does not have a sufficient level of detail to be a good starting point for a simulation model. The type of data presented in the VSM blocks has only the purpose of highlighting the nonvalue-added activities and does not describe each of the single variables of the process. However, and since it is a simple tool widely used at the company level, the proposed improvements of the VSM aims to make it a valid connection element between the managerial requests and the technical requirements.
In particular, five fundamental criteria are proposed for evaluating the sustainability of a simulation model:
Representativeness—that is, to represent the process faithfully;
Simplicity of construction—that is, little effort in terms of FTE (full-time equivalent), skills, and calculation capacity;
Easy maintenance—that is, little effort to keep it updated;
Intelligibility of the data obtained—that is, the possibility of using the data in a productive way;
Simplicity of data collection, in terms of effort.
These criteria must be used as quantitative data to evaluate the improvement of the X-VSM model from the VSM model as a valid input tool for simulation models.
5. Application on a Real Case
It is well acknowledged that managers need to quickly understand the impacts of different choices on key process indicators, including sustainability KPIs [
41]. This proposal focuses on reducing the existing gap between the managers’ requirements and the technical complexity of building a reliable process simulation.
Previous researches attest that VSM may become a suitable tool for guiding process simulation [
42]. Indeed, it gives a clear vision of the end-to-end process, highlighting which are the main outputs of the sub-processes [
3]. Here, a real industrial case is discussed. The example takes cues from the management request to understand the differences, in terms of energy consumption, between two different configurations of a mixing phase in the liquid production facility of a multinational consumer goods company.
As shown in
Figure 3, the two configurations are shown with a VSM notation; specifically, the table that collects input and output process data is presented.
In the first case, one worker is dedicated to unique mixer equipment (mixer 1), while in the second configuration, the worker is also managing a second mixer (mixer 2); therefore, in the second case, the worker must supervise two pieces of equipment. The different configurations have, among other different characteristics, different energy consumptions for the mixing phase.
During the mixing phase, the bulk material undergoes a specific thermal cycle: it is first heated; then kept at a precise temperature for a minimum of twenty minutes. Finally, to finish the thermal cycle, the process heating needs to be manually re-activated by the worker.
The distribution of time that elapses between the minimum time (20 min) and the actual time in which the worker reactivates the heating is the main difference between the two configurations: indeed, in the first configuration, where the worker is assigned to only one mixer, the reactivation is performed promptly after the 20-min cut-off. However, in the second configuration, the worker may reactivate the thermal cycle only after he has finished managing the second mixer. This can introduce a delay in the re-activation, with the consequence that the bulk material is kept under heating for a longer period, with associated energy waste.
During this period, when the bulk material is kept at a constant temperature, a variable quantity of energy is consumed. More specifically, the consumption of energy is calculated as:
In Equation (1),
k is the heat transfer coefficient of the mixer;
S is the area of the mixer; ∆
T is the difference between the environmental temperature and the bulk material temperature, and ∆
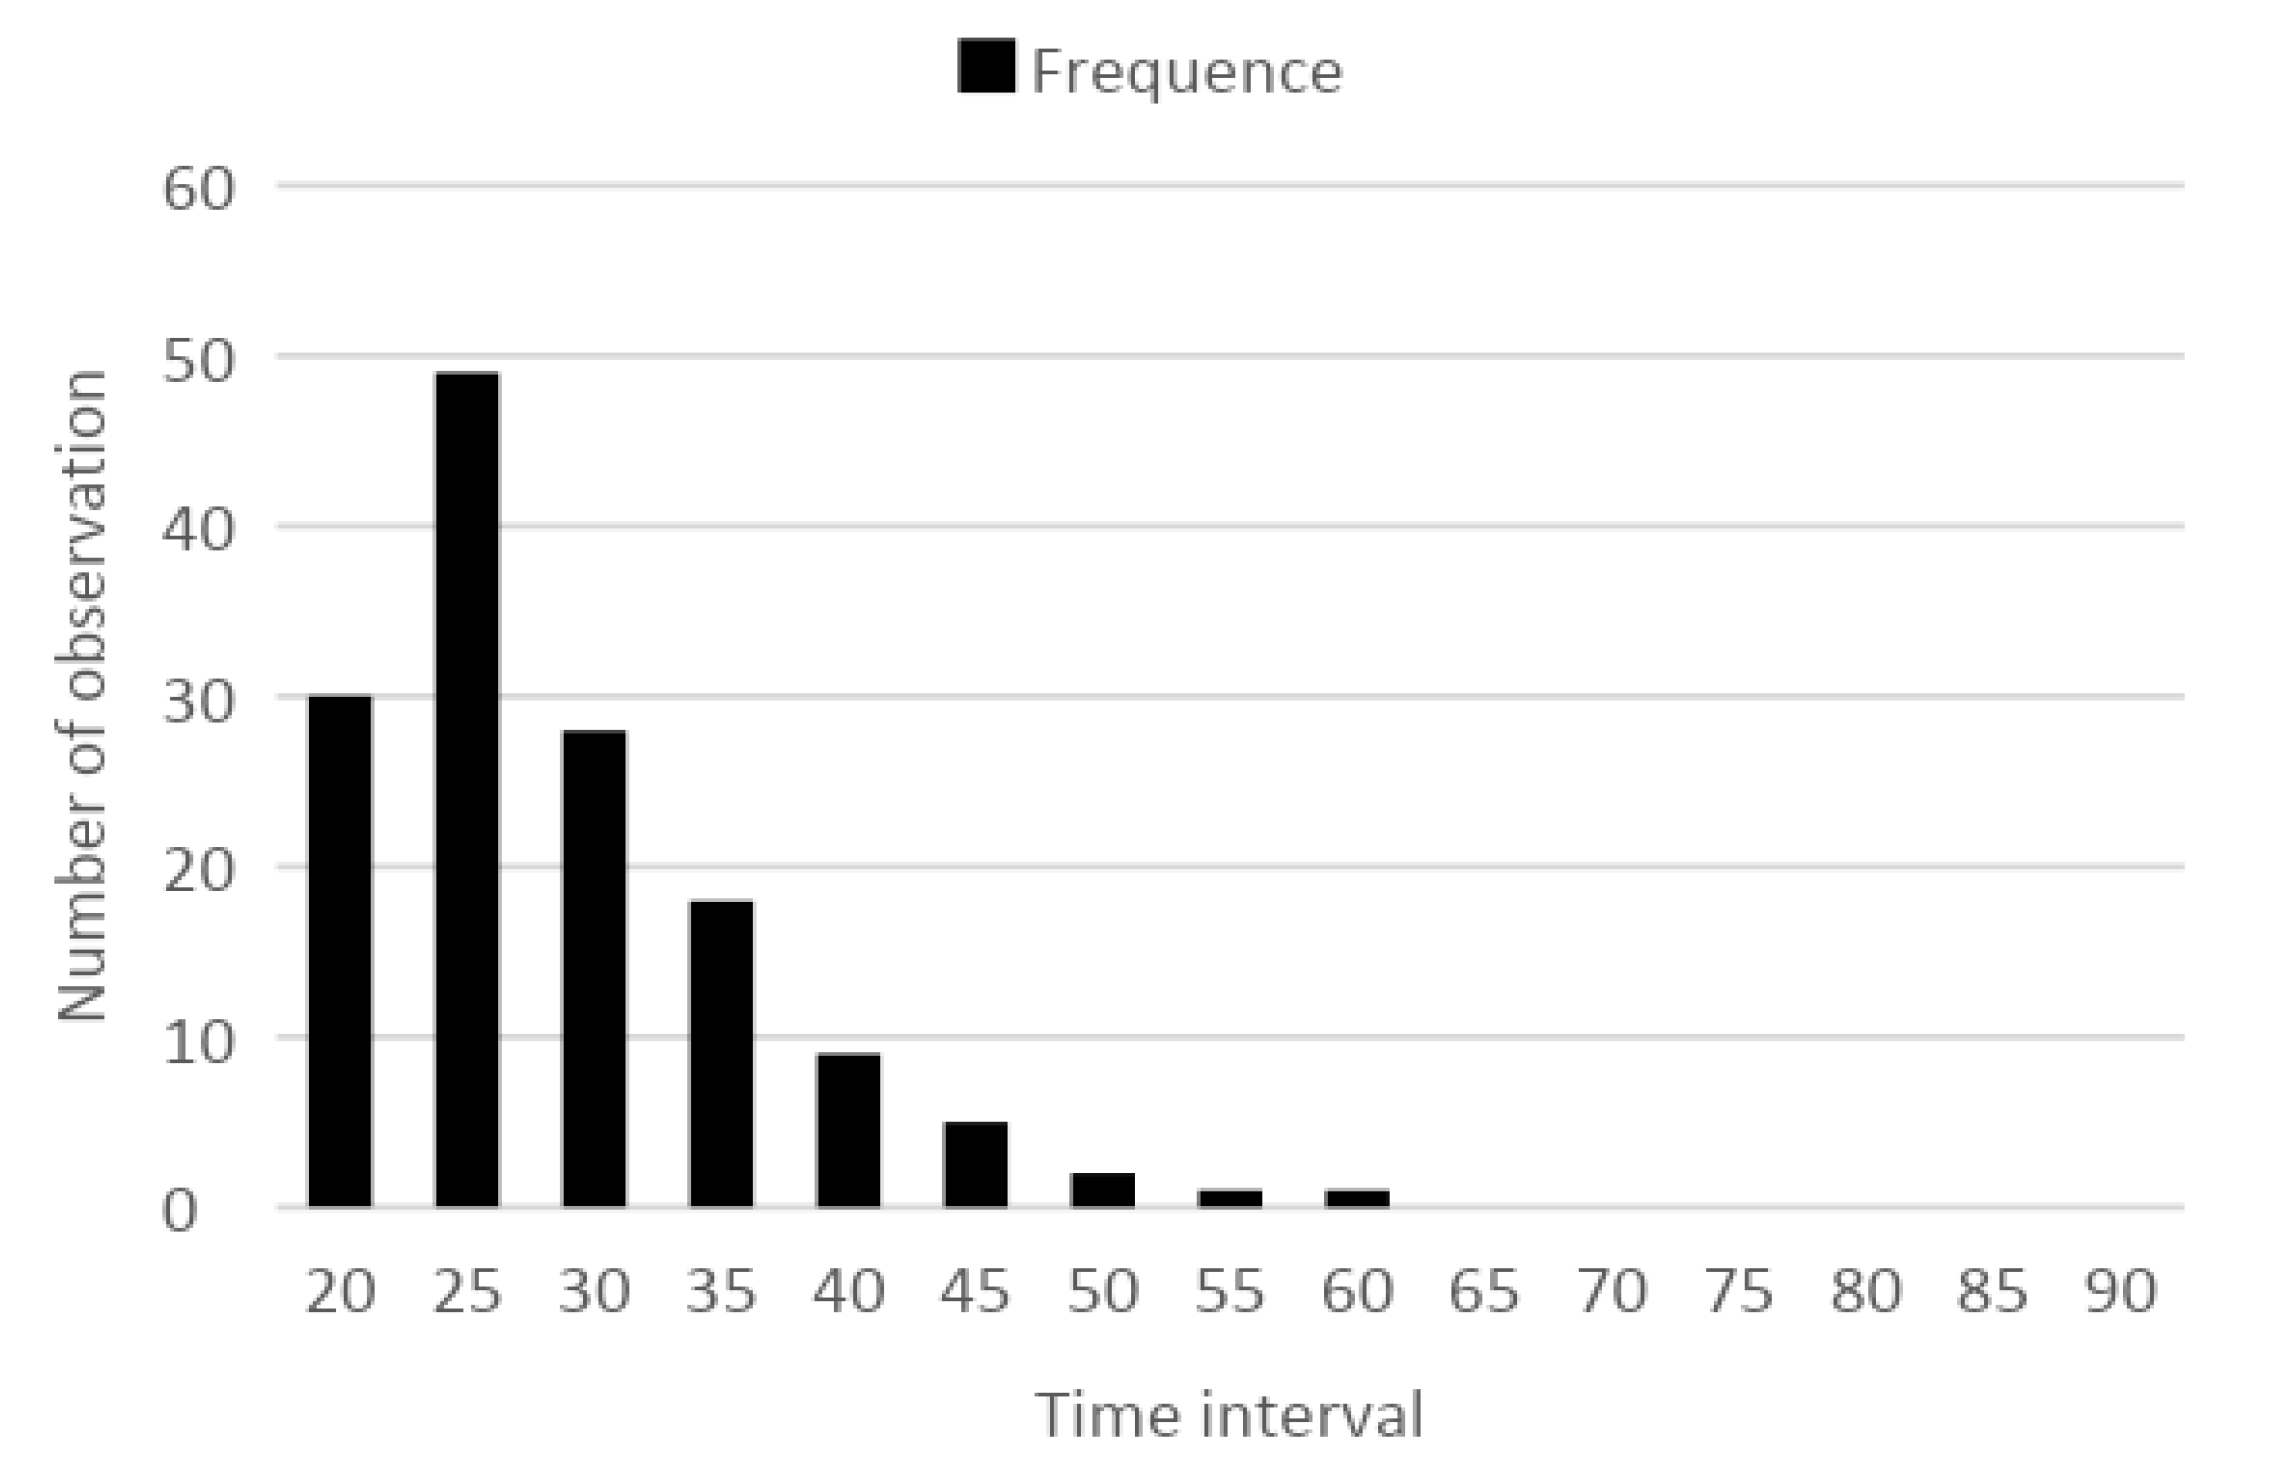
t the period in which the temperature is constant. As shown in
Table 1, ∆
t of mixer 1 were collected in 143 observed cases, both when the worker was managing two mixers (conf. 1) and when he was managing mixer 1 only (conf. 2).
In the first configuration, the average ∆
t is about 41 min, with a standard deviation of 12.6 min, while on the second configuration, the average ∆
t value is 29 min, with a standard deviation of 14.6 min.
Figure 4 and
Figure 5 show the distribution frequency for the recorded ∆
t.
The output of the analysis shows that the consumption of energy in conf. 1 is greater than in conf. 2; specifically, in conf. 1, the total energy consumption for the analysed process is 142% of that in conf. 2, which is 204% the minimum energy consumption obtainable with ∆t = 20 min.
6. Discussion
The application highlights the potential of the model. Indeed, this example shows how, starting from a management request, the X-VSM provides valid support for the simulation, helping the data collection, and also a clear guide for the analysis of waste reduction.
Moreover, as shown in
Figure 6, the process information evolves as the following scheme:
The top management has a deep knowledge and visibility on the overall process and, through the X-VSM, gives a full and clear vision on the process to the technical specialist;
Technical specialist uses the X-VSM to deeply understand the process sequences and to collect all the data needed to answer the management requests;
Lastly, the top management uses the output of the simulation in order to analyse the current configurations and evaluate how to implement improvement in the process.
In this flow of information, X-VSM has a key role:
It gives the visibility of the overall process with a new level of detail, allowing technical specialists to start the simulation from a reliable representation of the process;
Provides a sequence of categories in order to support the collection of all data that characterize the process;
Directly guides the simulation, highlighting which are the outputs needed from the management.
Besides the advantages coming from the presented approach, the X-VSM itself improves the usage of the classical VSM from several points of view. First, the level of detail of the VSM has been considerably increased, achieving a more reliable description of the process. Consequently, in the X-VSM, more activities are captured, allowing managers to better identify process wastes. Secondly, through the definition of a wider range of data categories, managers can use the X-VSM to capture not only time waste but other waste categories too, e.g., wastes of materials or water.
Despite the strong potential of the VSM in the field of simulation, its use suffers from some limitations. Clearly, despite being taken from a real case, the process segment presented in this paper is just an example, and analysing an end-to-end entire production process would require much more effort in data gathering. However, the effectiveness of the proposed method in identifying waste reduction opportunities justifies the endeavor in representing a complex X-VSM. Further research may focus on analysing how to combine literature results and industrial practice to overcome these limitations.
7. Conclusions
Process simulation is a widespread approach for analysing the behaviors of manufacturing systems. However, difficulties always arise from building the process model on the simulation software to design the environment. This often complex and time-consuming phase can be streamlined through the exploitation of effective tools.
Value Stream Maps—the well-known lean production added-value analysis tools—are often used in manufacturing companies and can be used to guide the simulation process, provided these are enriched with more details. This article proposes simple and easily-applicable criteria for extending the level of detail of the traditional VSM in order to have a broad and complete view of the whole process. Furthermore, several categories of input and output data, including the one to capture energy, material and water waste, for guiding simulation towards a strategic view have been defined. In fact, the main purpose of the management is to visualize how the main outputs change based on input variations. In the section on the real-case application, a potential use of the tool is shown. In particular, it is demonstrated that starting from a management requirement, the X-VSM helped with the easier collection of the appropriate input elements to guide a simulation. This easy approach is very useful for management.
There is little literature on this different use of the VSM. In fact, the most common use of it is capturing waste during the flow. This tool is a valid candidate to guide the different simulations on sub-processes due to its feature of representativeness of the whole process. Across this role, it brings greater value for the management by supporting it in the process of decision-making for different configurations. VSM and simulation are intended as a combined tool to drive the strategic sustainability goals towards practical operation implementation, and VSM here is used to ease the design of process simulation so that management decisions in terms of process redesign aimed at waste reduction can be easily evaluated.
This proposal should be considered as an early-stage research contribution to discuss how to advantageously improve the VSM, in order to make it a suitable support for the process simulation. For this reason, this paper is only focused on a simple process segment: future research may extend the analysis to a more complex industrial case.
The application of the X-VSM in the field of simulation may present some challenges. The first one is the process of gathering the large quantities of data needed to build a reliable simulation. Moreover, the X-VSM offers the opportunity for unifying in a single representation all the requirements needed for deterministic and stochastic simulation. However, stochasticity shall be represented indicating its deviation metrics along with the average values (e.g., indicating the standard deviation of the represented variables, or a confidence interval), since the VSM approach (and X-VSM, as a consequence) yields a static representation of the process by definition.
The findings of this study have shown the potential of the X-VSM combined with simulation in the analysis of waste reduction opportunities within a production process, along with its benefits for a company.


