Article

Adsorption of Mercury from a Cyanide Leaching Solution Using Various Activation Rates of Granular Activated Carbon: A Laboratory- and Industrial-Scale Study

1
Department of Mining Engineering, Science and Research Branch, Islamic Azad University, Tehran 16846-13114, Iran
2
School of Mining, College of Engineering, University of Tehran, Tehran 16846-13114, Iran
3
Minerals and Metallurgical Engineering, Dept. of Civil, Environmental and Natural Resources Engineering, Luleå University of Technology, SE-971 87 Luleå, Sweden
*
Author to whom correspondence should be addressed.
These authors contributed equally to the study.
Sustainability 2020, 12(8), 3287; https://doi.org/10.3390/su12083287
Submission received: 30 March 2020 / Revised: 12 April 2020 / Accepted: 14 April 2020 / Published: 17 April 2020
(This article belongs to the Section Sustainable Engineering and Science)

Abstract

:
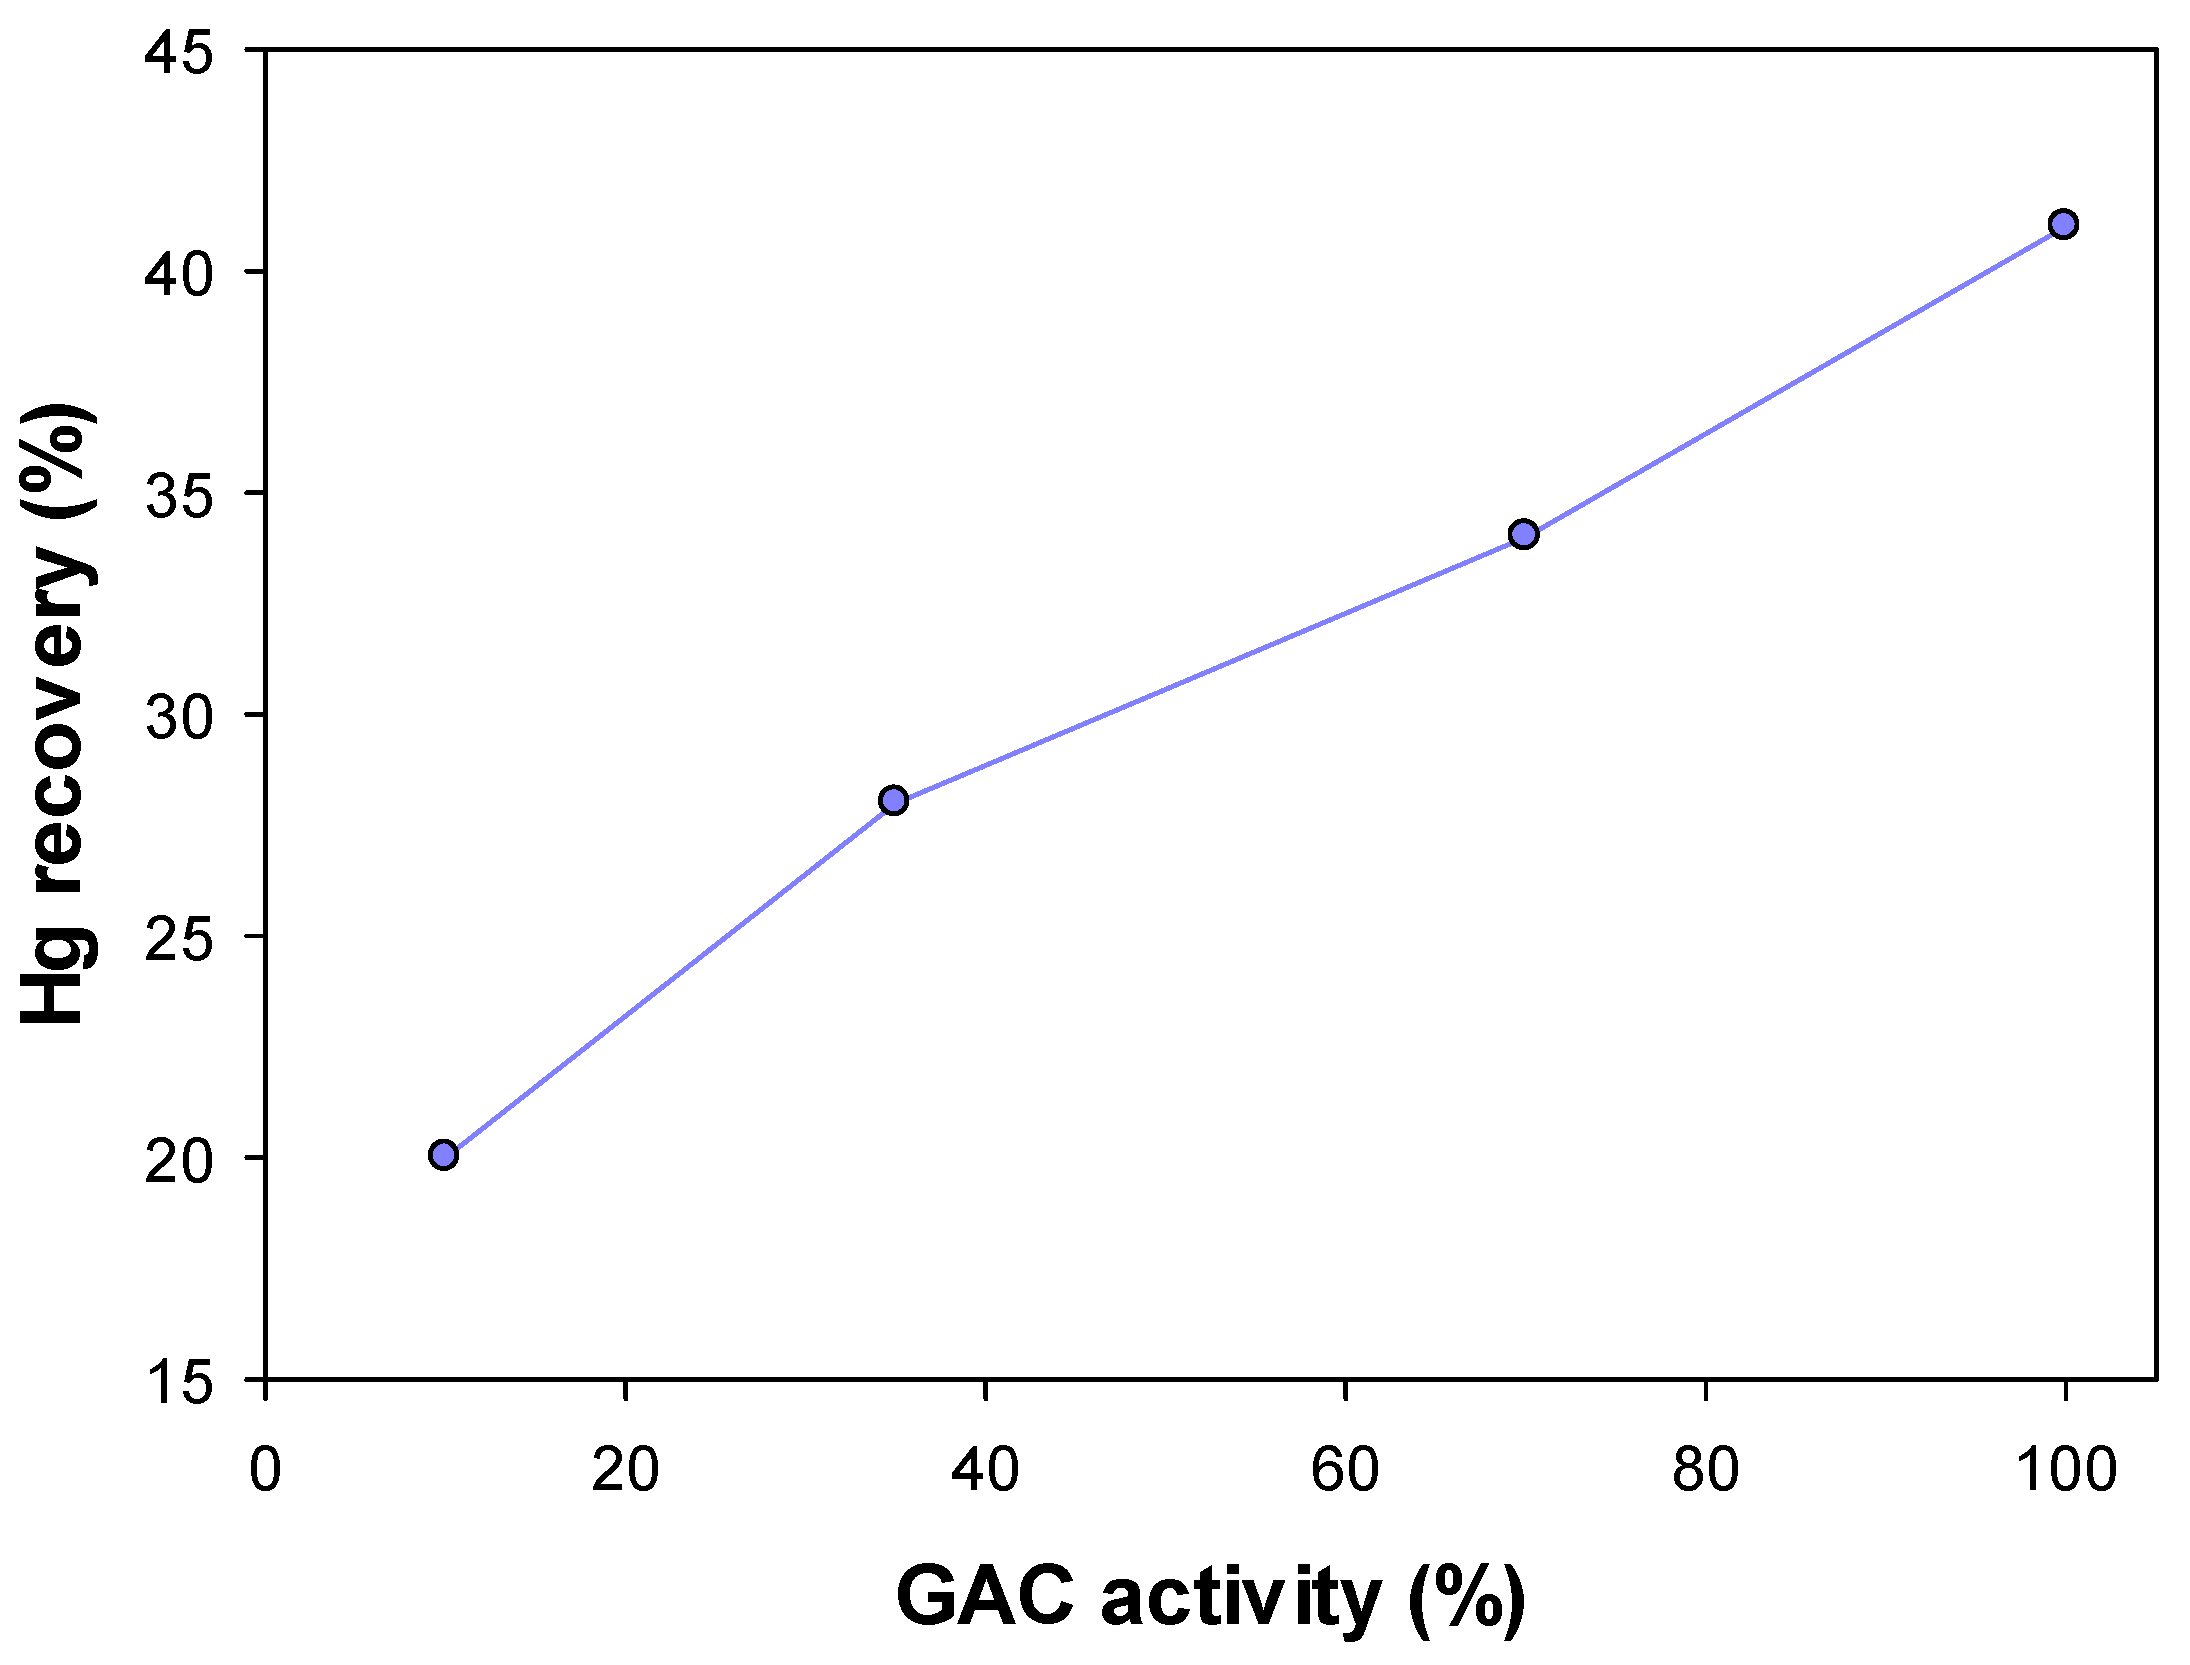
The use of granular activated carbon (GAC) is a typical and sustainable technique for recovering precious metals from a cyanide leaching solution (CLS). The level of GAC activity is a fundamental factor in assessing the rate of precious metal adsorption; thus, it is essential to determine the efficiency of carbon elution for reproducing GACs. Since mercury (Hg) adsorption plays a critical role, economically and environmentally, in GAC efficiency, we conducted various laboratory and industrial experiments to explore the effect of different rates of GAC activation (10%, 35%, 70% and 100%) on Hg adsorption from CLS. Assessments of laboratory test results showed a direct relationship between the Hg adsorption and GAC activity; by increasing the GAC activity from 10% to 100%, the recovery of Hg was increased from 20% to 41%. Kinetic modeling results indicated that the Hg adsorption for all GAC activities followed chemisorption mechanisms. There was good agreement between the laboratory test results and the results of experiments on the industrial scale (that used a continuous circuit). These outcomes indicate that by increasing the frequency of carbon reactivation and using GAC with a high level of activity in the first tank, Hg desorption was meaningfully decreased and recovery was improved (for 10% GAC activity vs. 35% GAC activity, recovery was 40% vs. 90%, respectively).

1. Introduction

Recovery of precious metals from cyanide leaching solution (CLS) by granular activated carbon (GAC) is a typical process in gold processing plants [1,2]. Compared with other methods, using GAC has such advantages as high selectivity for the adsorption of precious metals, ease of elution and reactivation, high adsorption capacity, and fast filtration due to the large GAC particle size [3,4,5]. Adsorption from CLS has been found to be affected by various conditions (pH, Cynide (CN) and target metal concentration [6]), carbon properties (such as particle size, free surface area, ash content and moisture [7,8,9]) and operation conditions (such as contacting time, agitation rate and the carbon concentration in the CLS [10,11,12]).
In the gold extraction process, the activity of GAC decreases due to repulsive forces between the adsorbed metal ions and the incoming sorbate and also due to the limited number of available sites on the GAC surface for occupation over the processing time. The spent carbon should be replaced with virgin or reactive carbon (elution products) [13]. Thus, it is essential to withdraw carbon for elution and steam-reactivation in the kiln [14,15]. Kilning is a thermal process in the presence of gases that removes the organic phase [16]. Elution is a process that desorbs metals from the GAC surface to reactivate it. The carbon reactivation is controlled by the number of elutions. Through the process, by increasing the carbon usage and energy consumption, the production costs are increased [16]. Therefore, it is essential to understand the effect of the frequency of carbon reactivation on precious metals adsorption in gold extraction plants. Understanding adsorption rates onto GAC with different activities may help processors to strike an economical–technical balance in precious metals recovery in CLS plants.
A previous investigation indicated a positive correlation between GAC activity and the rate of gold/silver adsorption (by increasing the GAC activity, the gold and silver adsorption rates were increased) [17]. Moreover, it was found that a minor amount of poisoning in the GAC could affect the type and rate of precious metal adsorption significantly [17]. Since some of the mercury (Hg) present in the precious metal ores may dissolve in the CLS, its recovery also has to be considered. Adsorption of Hg from CLS is important from an economic point of view. Hg is a valuable metal with different applications in the medical, cosmetic and electronic industries. On the other hand, Hg is a toxic element and should be removed from the leaching solution. Therefore, adsorption of Hg from the solution is important not only for economic reasons but also to save the environment and make the process sustainable. Although several investigations have been done on Au and Ag recovery from CLS, due to their high price, few studies have explored Hg adsorption.
Thus, it is essential to study Hg removal from CLS by using GAC with different levels of activity. A “comparative method” was applied to produce GAC with different levels of activity. In other words, GAC activity refers to the adsorption of a gold cyanocomplex under fixed adsorption conditions. This study explores the effect of various rates of GAC activity (10%, 35%, 70% and 100%) on recovery of Hg from CLS on two different scales. The first is a kinetic study of Hg adsorption onto the GAC surface on a laboratory scale. Kinetic modeling is a good method for exploring both the adsorption rate and its mechanisms, and kinetic studies are important for determining adsorbent capacity [18]. The second is Hg adsorption onto GAC at a continuous circuit in a plant (industrial scale).

2. Experimental Procedures

2.1. Ore and Adsorbent

All of the experiments (laboratory and industrial tests) were performed at the “Pouya Zarcan Agh-Darreh” plant, Takab, Iran. The initial concentration of Hg in the cyanide leach solution was 18 mg/L. The X-ray diffraction (XRD) analysis showed that quartz and calcite were the major gangue minerals in the feed. In the plant, the feed was ground to d80=45 μm with a semi-autogenous mill (SAG-mill), which was worked in a circuit closed by a hydrocyclone. Cyanide (400 g/t) was added to the SAG-mill to extract precious metals. After this step, the overflow of hydrocyclone was fed to seven carbon-in-leach (CIL) tanks, which were continuously working. For laboratory tests, samples were taken from the overflow of hydrocyclone. Experiments were conducted in laboratory reactors, while industrial tests were carried out in a 670 m3 tank, which was continuously working in the plant. “GoldSorb® 6000” coconut shell charcoal activated carbon was used in all laboratory and industrial tests. The carbon particle size is 6 mesh and the surface area is 1150 m2/g (on average).

2.2. Laboratory Tests

To produce GAC with different activities, 500 g of fresh GAC was added to 50 (l) pulp with solid content and a pH similar to the pulp in the plant. An amount of 5 g of GAC was withdrawn daily from the pulp and added to the 250 mL standard solution with 10 mg/L Au. Following this, the adsorption reaction took 15 minutes. The adsorption capacity was calculated based on the following reaction [19]:
q e = C i C e M V
where C i (mg/L) and C e (mg/L) are the concentrations of metals in the solution before and after adsorption, respectively. V is the volume of solution (L) and M is the mass of sorbent (g). The ratio of calculated adsorption capacity for each day to the adsorption capacity for fresh carbon (100%) shows the level of GAC activity. Figure 1 shows the level of GAC activity on different days. The GAC activity was calculated according to the following equation:
A G A C = q f q x q f × 100
where AGAC is the activity of the granular activated carbon, qx is the gold adsorption and qf is the gold adsorption with fresh activated carbon. The Hg adsorption from CLS was carried out with various GAC activities: 10%, 35%, 70% and 100%. Laboratory tests were performed in a 10-liter reactor with a mechanical mixer, which contained 5 (l) pulp with a pulp density of 40% and 1.5 g of GAC. The pH and CN concentration were adjusted to 10.5 and 120 g/t, respectively. Each test continued for 24 hours. An amount of 50 mL of pulp (without carbon) was withdrawn from the output of the tank in the selected intervals and, after the measurement of the mercury in the solution, the Hg adsorption was calculated based on Equation (1) at different reaction times. The metal concentrations were analyzed using atomic absorption spectroscopy (Varian 220). Chemical analysis of the pregnant solution showed that the concentration of Au, Ag and Hg was 0.8, 1.1 and 18 (mg/L), respectively (Table 1). The Hg recovery was calculated based on the difference between primary Hg concentration in the solution and its concentration at the end of the process. In the plant, carbon activities were determined daily by removing 5 g of carbon, transferring it to fresh pulp, and mixing it with 250 mL of a standard solution that contained 10 mg/L Au for 15 minutes. After this step, GAC was filtered and separated from the solution. The Au adsorption was calculated based on Equation (1) and the difference in the Au concentration in the solution was measured before and after the process. The ratio of calculated Au adsorptions onto the GAC was recorded every day as an index for GAC activity (throughout 20 days). Au was selected to evaluate the GAC’s quality as Au was the main product of the plant and other metals (Ag and mercury) were the by-products.

2.3. Modeling

Kinetic modeling can be used to explain adsorption mechanisms [20,21]. According to the pseudo-first-order model (Equation (3)), the adsorption rate was dependent on the number of effective adsorption sites [22].
q t = q e [ 1 exp ( k f t ) ]
where q t is the amount of Hg adsorbed at time t (mg/g), q e is the adsorption capacity at equilibrium (mg/g), k f is the pseudo-first-order rate constant (min−1) and t is the contact time (min).
The pseudo-second-order model is described based on the following equation [23]:
q t = k s q e 2 t 1 + k s q e t
where q e is adsorption capacity at equilibrium (mg/g) and k s is the pseudo-first-order rate constant (g/mg.min).
The Elovich equation, which describes the chemisorption mechanism, is [24]:
q t = ( 1 β ) ln ( α · β ) + ( 1 β ) ln ( t )
where α is the initial adsorption rate (mg/g.min), β is the desorption constant (g/mg) and t is time (min). Finally, the intra-particle diffusion model, which describes mass transfer in an amorphous and homogeneous sphere, is defined based on the following equation [25]:
q t = k i d t + C
where C is the intercept and k i d (mg/g.min−1/2) is the intra-particle diffusion rate constant.

2.4. Industrial Scale Test

GAC activity at the industrial scale can be controlled by changing the frequency of carbon elution and steam-activation in the kiln. The adsorption unit in the “Pouya Zarcan Agh-Darreh” plant (with 7 tanks) works in a countercurrent format, which means that the last tank in the circuit has the highest GAC activity level and that the first tank has the lowest level. The first tank was selected to study the effect of GAC activity on an industrial scale because, as mentioned, the plant works in a countercurrent format, and the concentrations of metals in this tank are significantly higher than those in other tanks. Regular sampling (a 5 g sample every day) from this tank was conducted to calculate the GAC activity. To take samples, a bottle roll was turned off every day for a short time, and the carbon was withdrawn using a screen. The size of the screen was 800 µm. An amount of 5 grams of carbon was taken and the rest was returned to the bottle. Investigation of the plant indicated that by increasing the frequency of elution from 12 to 30 times and the number of steam-activations from 6 to 15 per month, the activity increased from 10% to 35% in the tank. In an elution event, 6.3 t of GAC is removed from this tank (the volume of the elution cell equals 6.3 t of GAC) and sent to the kiln after elution (more than 30 hours). In order to study the effect of GAC activities, the concentration of Hg was measured in the samples before and after increasing the activity.

3. Results and Discussion

3.1. Laboratory-Scale Studies

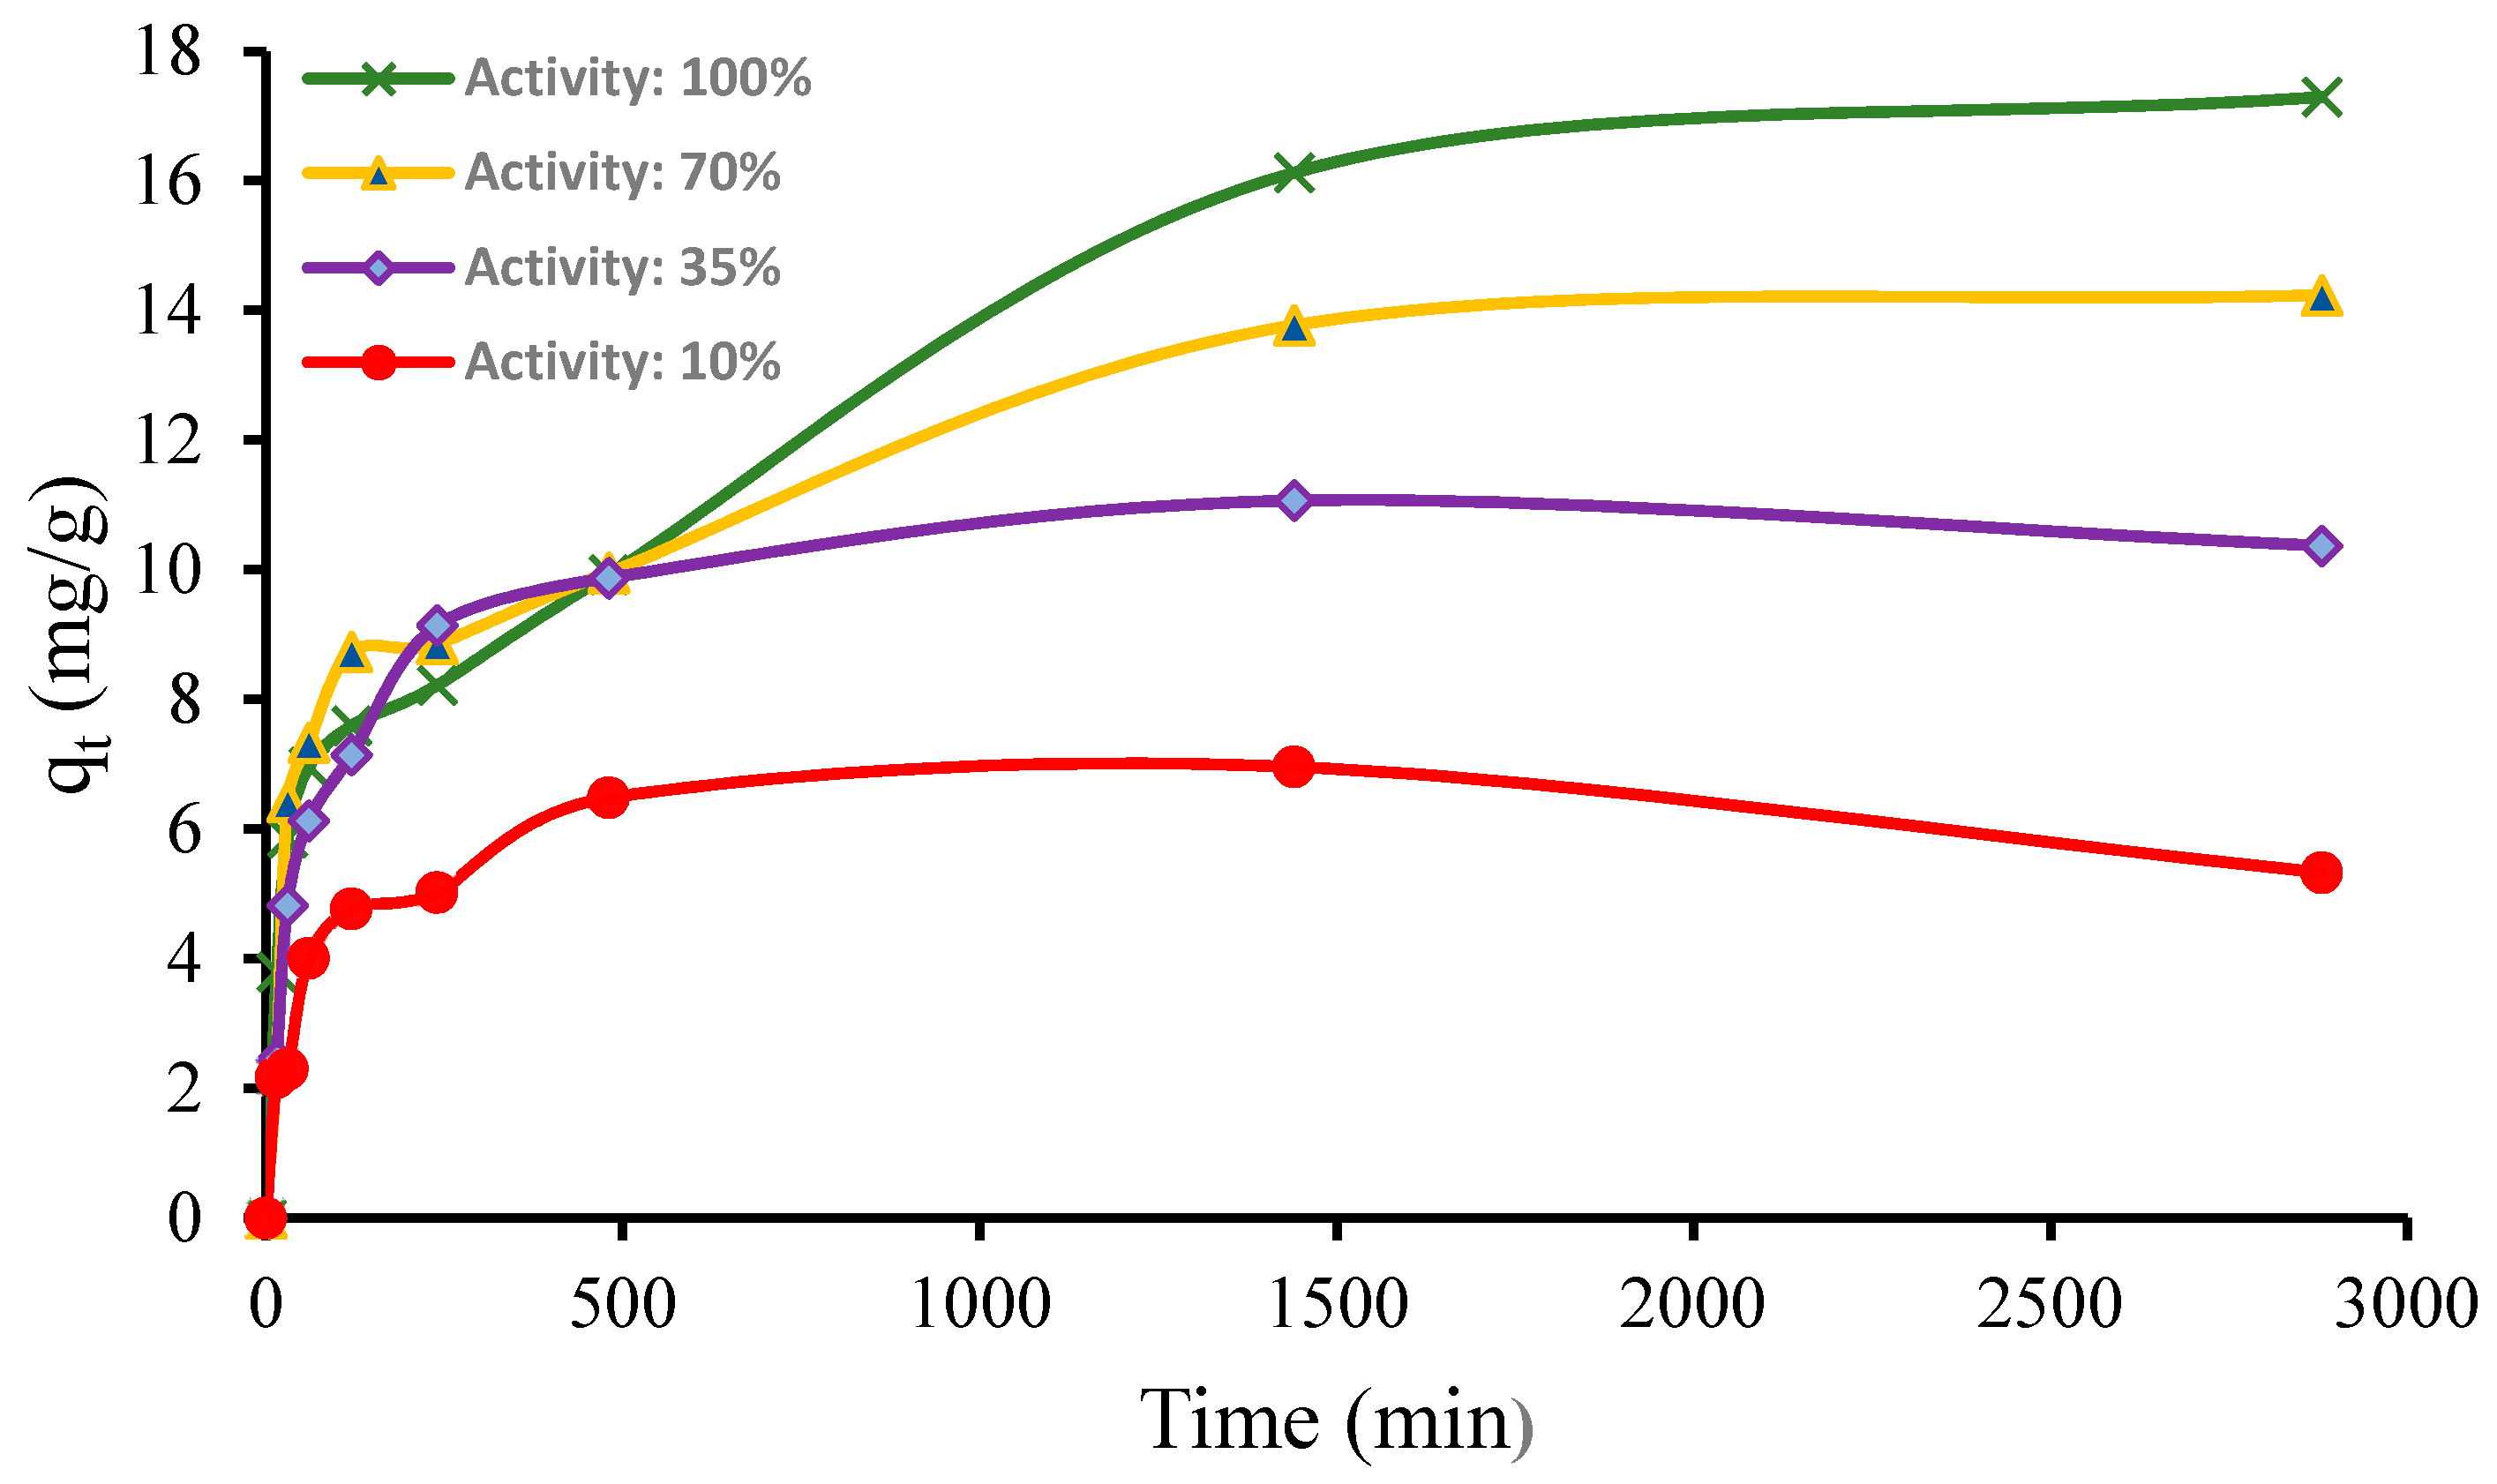
As was expected, analyses indicated that fresh GAC (100% activity) has the highest Au and Ag adsorption. While after 48 hours GAC with 10% activity adsorbed 1.33 mg/g Au, fresh GAC adsorbed 1.75 mg/g Au (a 24% increase). This increase was 43.6% for Ag adsorption (0.972 and 1.724 mg/g for 10% and 100% GAC activity, respectively). Figure 2 shows the Hg adsorption (based on Equation (1)) onto the surface of GAC with different activities at various times. These results indicate that increasing the activity can increase Hg adsorption. The Hg loading on the GAC with 10% activity is 5.33 mg/g, while it is 17.29 mg/g for the GAC with 100% activity. These variations show that Hg adsorption was increased by 224% by increasing the GAC activity from 10% to 100% and that the Hg recovery significantly increased (Figure 3). Generally, the laboratory results illustrated that the kinetics of adsorption are very fast during the initial minutes while they dropped significantly after a few minutes. This phenomenon occurs due to a large number of sites on GAC surfaces that are available for adsorption at the initial stage of the process [26].

3.2. Modeling

Four different models, including pseudo-first-order, pseudo-second-order, chemisorption, and intra-particle diffusion models, were fitted to the laboratory data (Figure 4). The calculated parameters for each model are listed in Table 2.
Outcomes of the modeling demonstrated that the pseudo-second-order model has the highest correlation of determination (R2) for Hg adsorption onto GAC surfaces for 10% and 35% activities while the chemisorption model was fitted to the data at 70% and 100% activities. These results suggest that the rate-limiting step may be chemical adsorption involving valent forces, i.e., through sharing or the exchange of electrons between the adsorbent and divalent metal ions [27] at 10% and 35% activities. Additionally, for 70% and 100% activities, the chemisorption mechanism (formation of a chemical reaction between the surface and the adsorbate) leads to Hg adsorption onto the GAC surface. This phenomenon could be due to the fact that most free sites were occupied by contaminant components in the low-activity GAC. The initial sorption rate (h0, expressed in mg/g×min) can be obtained when t approaches zero, based on Equation (7):
h 0 = k s q e 2
h 0 can be increased by increasing the GAC activity, which shows the direct proportion of Hg adsorption during the initial minutes of reaction. In fact, the Hg adsorption rate is higher for GAC with higher activity at the first stage of the reaction. It should be noted that the low R2 for the intra-particle diffusion model indicates that Hg diffusion to the GAC surface cannot be controlled by carbon activity (Table 2).

3.3. Industrial-Scale Studies

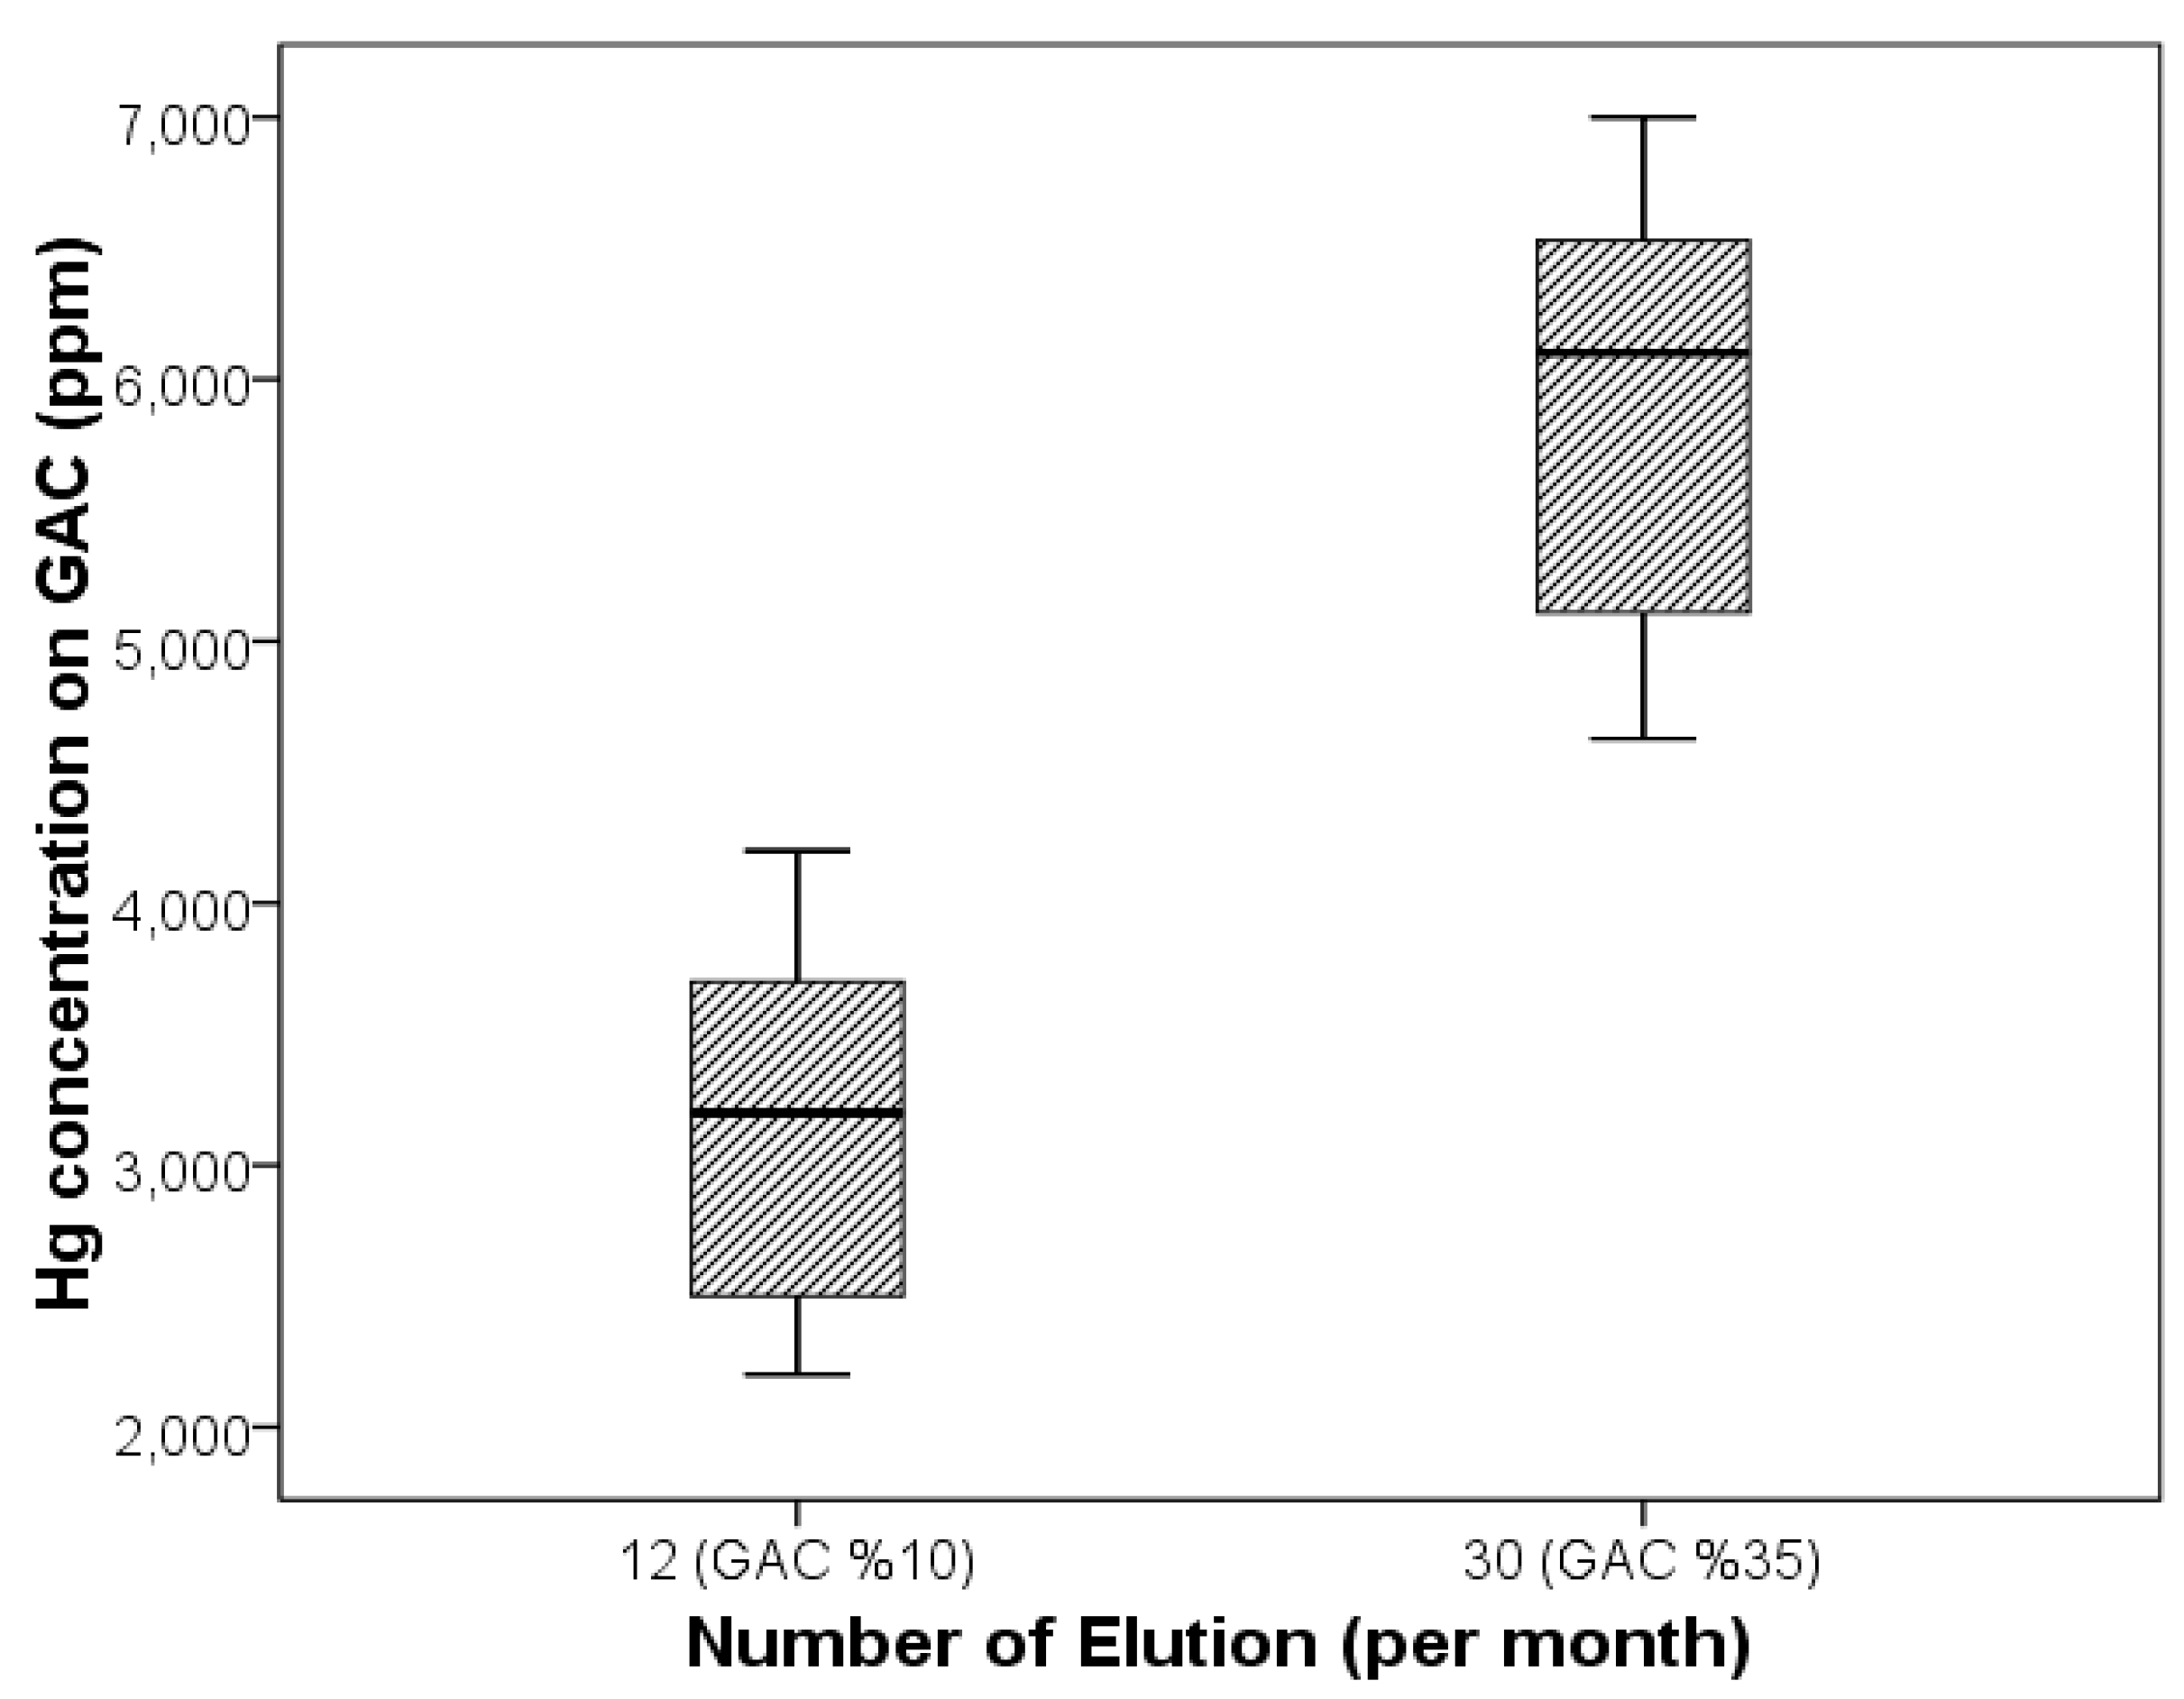
To study the effect of these activities on the industrial scale by 12 and 30 elutions, the GAC activity in the first tank was set to ~10% and ~35%, respectively. The Hg concentrations in the CIL feed and liquid residual were analyzed (Table 3). The Au and Ag concentrations in the CIL process feed (hydrocyclone overflow) and in the residual (the feed of the second tank) are presented in Table 4. In agreement with the laboratory test results, there was a direct relationship between Hg concentration and GAC activities; upon increasing the frequency of elution, the Hg adsorption on the GAC significantly increased (Figure 5). The results of the industrial experiments show that a quite high amount of dissolved Hg remains unrecovered when GAC with 10% activity is used (40% recovery). Increasing the activity to 35% significantly promoted the Hg recovery (90% recovery). In fact, increasing the frequency of elution from 12 to 30 times increased the Hg adsorption from the solution by 4.68 mg/g (from 4.32 to 9 mg/g). These results indicate that by using GAC with a high level of activity in the first tank (and increasing the number of elutions), the kinetics of absorption can be improved and the desorption can be decreased significantly.

4. Conclusions

The effect of GAC activity on Hg adsorption from the cyanide leach solution was investigated. The laboratory experiments were carried out for GAC with 10%, 35%, 70% and 100% activity. The results indicated that increasing the activity of GAC increases the Hg adsorption. In fact, increasing the GAC activity from 10% to 100% increased the Hg adsorption by more than 224%. The kinetic modeling with laboratory data showed that Hg adsorption follows the pseudo-second-order model at the 10% and 35% activities and the Elovich equation (the chemisorption mechanism) at the 70% and 100% activities. Both of these models showed that Hg adsorption follows the chemisorption mechanism; however, the adsorption changes are sharper at high levels of activity due to the logarithmic format of the Elovich equation. The GAC activity can be controlled by changing the frequency of reactivation and steam-activation. The industrial experiments indicated that the GAC activity increases from 10% to 35% by increasing the number of elutions from 12 to 30 and the number of steam-activations from 6 to 15 per month. These results suggest that using a higher GAC activity (35%) in the first tank can meaningfully promote Hg adsorption.

Author Contributions

S.B. and A.S. conceived, and performed the experiments; S.C.C. designed the experiments; S.C.C., S.B. and S.G. analyzed the data and statistically assessed them; S.C.C. and S.G. generated figures and wrote the paper. All authors have read and agreed to the published version of the manuscript.

Funding

There was not any specific funding available for this research.

Acknowledgments

The authors would like to thank you Tommy Karlkvist who help to improve the language of article.

Conflicts of Interest

The authors declare no conflicts of interest.

References

  1. Yanuar, E.; Suprapto, B. Leaching and adsorption of gold from lape-sumbawa rocks (Indonesia) by hypochlorite-chloride. Procedia Chem. 2015, 17, 59–65. [Google Scholar] [CrossRef] [Green Version]
  2. Wadnerkar, D.; Tade, M.O.; Pareek, V.K.; Utikar, R.P. Modeling and optimization of Carbon in leach (CIL) circuit for gold recovery. Miner. Eng. 2015, 83, 136–148. [Google Scholar] [CrossRef]
  3. Gupta, H.; Singh, S. Kinetics and thermodynamics of phenanthrene adsorption from water on orange rind activated carbon. Environ. Technol. Innov. 2018, 10, 208–214. [Google Scholar] [CrossRef]
  4. Souza, C.; Majuste, D.; Dantas, M.S.S.; Ciminelli, V.S.T. Effect of zinc ion on copper speciation and adsorption on activated carbon. Hydrometallurgy 2018, 176, 78–86. [Google Scholar] [CrossRef]
  5. Qu, W.; Yuan, T.; Yin, G.; Xu, S.; Zhang, Q.; Su, H. Effect of properties of activated carbon on malachite green adsorption. Fuel 2019, 249, 45–53. [Google Scholar] [CrossRef]
  6. Chandra, M.Z.; Mubarok, S. On the use of lignin-based biopolymer in improving gold and silver recoveries during cyanidation leaching. Miner. Eng. 2016, 89, 1–9. [Google Scholar] [CrossRef]
  7. Yang, X.; Yi, H.; Tang, X.; Zhao, S.; Yang, Z.; Ma, Y.; Feng, T.; Cui, X. Behaviors and kinetics of toluene adsorption-desorption on activated carbons with varying pore structure. J. Environ. Sci. 2018, 67, 104–114. [Google Scholar] [CrossRef]
  8. Saleh, T.A.; Adio, S.O.; Asif, M.; Dafalla, H. Statistical analysis of phenols adsorption on diethylenetriamine-modified activated carbon. J. Clean. Prod. 2018, 182, 960–968. [Google Scholar] [CrossRef]
  9. Zhou, L.; Yu, Q.; Cui, Y.; Xie, F.; Li, W.; Li, Y.; Chen, M. Adsorption properties of activated carbon from reed with a high adsorption capacity. Ecol. Eng. 2017, 102, 443–450. [Google Scholar] [CrossRef]
  10. Jiang, L.; Roskilly, A.P.; Wang, R.Z. Performance exploration of temperature swing adsorption technology for carbon dioxide capture. Energy Convers. Manag. 2018, 165, 396–404. [Google Scholar] [CrossRef] [Green Version]
  11. Radhik, R.; Jayalath, T.; Rekh Krishnan, G.; Jacob, S.; Rajeev, R.; George, B.K. Adsorption performance of packed bed column for the removal of perchlorate using modified activated carbon. Process Saf. Environ. Prot. 2018, 117, 350–362. [Google Scholar] [CrossRef]
  12. Di Natale, F.; Orefice, M.; La Motta, F.; Erto, A.; Lancia, A. Unveiling the potentialities of activated carbon in recovering palladium from model leaching solutions. Sep. Purif. Technol. 2017, 174, 183–193. [Google Scholar] [CrossRef]
  13. AWWA Standard B605-07. Reactivation of Granular Activated Carbon. Foreword Ixexi., n.d.; American Water Works Association: Denver, CO, USA, 2007. [Google Scholar]
  14. Effry, K.; Pleysier, M.; Bunney, R. Elution behaviour of metals from carbon. In Proceedings of the Hydrometallurgy Conference, Muldersdrift, South Africa, 24–26 February 2009; The Southern African Institute of Mining and Metallurgy: Johannesburg, South Africa, 2009. [Google Scholar]
  15. Snyders, C.A.; Bradshaw, S.M.; Akdogan, G.; Eksteen, J.J. Determination of the equilibrium and film diffusion constants of the platinum cyanide anions during the elution from activated carbon. Miner. Eng. 2015, 80, 57–68. [Google Scholar] [CrossRef]
  16. Dong, L.; Liu, W.; Jiang, R.; Wang, Z. Study on reactivation cycle of biological activated carbon (BAC) in water treatment. Int. Biodeterior. Biodegrad. 2015, 102, 209–213. [Google Scholar] [CrossRef]
  17. Seyedhakimi, A.; Bastami, S.A.; Ghassa, S.; Razavi, H.; Chehreh Chelgani, S. Exploring relationships between various activations of granular activated carbon on silver and gold adsorption: A kinetic and equilibrium study. Sep. Sci. Technol. 2019, 54, 1710–1721. [Google Scholar] [CrossRef]
  18. Xu, B.; Li, K.; Li, Q.; Yang, Y.; Liu, X.; Jiang, T. Kinetic studies of gold leaching from a gold concentrate calcine by thiosulfate with cobalt-ammonia catalysis and gold recovery by resin adsorption from its pregnant solution. Sep. Purif. Technol. 2019, 213, 368–377. [Google Scholar] [CrossRef]
  19. Ibrahim, M.N.M.; Ngah, W.S.W.; Norliyana, M.S.; Daud, W.R.W.; Rafatullah, M.; Sulaiman, O.; Hashim, R. A novel agricultural waste adsorbent for the removal of lead (II) ions from aqueous solutions. J. Hazard. Mater. 2010, 182, 377–385. [Google Scholar] [CrossRef]
  20. Syafiuddin, A.; Salmiati, S.; Jonbi, J.; Fulazzaky, M.A. Application of the kinetic and isotherm models for better understanding of the behaviors of silver nanoparticles adsorption onto different adsorbents. J. Environ. Manag. 2018, 218, 59–70. [Google Scholar] [CrossRef]
  21. Moosakazemi, F.; Ghassa, S.; Mohammadi, M.R.T. Environmentally friendly hydrometallurgical recovery of tin and lead from waste printed circuit boards: Thermodynamic and kinetics studies. J. Clean. Prod. 2019, 228, 185–196. [Google Scholar] [CrossRef]
  22. Lagergren, S. About the theory of so-called adsorption of soluble substances. K. Sven. Vetensk. Handl. Band 1898, 241, 1–39. [Google Scholar]
  23. Ho, Y.; McKay, G. Pseudo-second order model for sorption processes. Process Biochem. 1999, 34, 451–465. [Google Scholar] [CrossRef]
  24. Low, M. Kinetics of chemisorption of gases on solids. Chem. Rev. 1960, 60, 267–312. [Google Scholar] [CrossRef]
  25. Weber, W.M.J. Kinetics of adsorption on carbon from solutions. J. Sanit. Eng. Div. 1963, 86, 31–60. [Google Scholar]
  26. Asuquo, E.; Martin, A.; Nzerem, P.; Siperstein, F.; Fan, X. Adsorption of Cd(II) and Pb(II) ions from aqueous solutions using mesoporous activated carbon adsorbent: Equilibrium, kinetics and characterisation studies. J. Environ. Chem. Eng. 2017, 5, 679–698. [Google Scholar] [CrossRef] [Green Version]
  27. Konicki, W.; Hełminiak, A.; Arabczyk, W.; Mijowska, E. Adsorption of cationic dyes onto Fe@graphite core–shell magnetic nanocomposite: Equilibrium, kinetics and thermodynamics. Chem. Eng. Res. Des. 2018, 129, 259–270. [Google Scholar] [CrossRef]
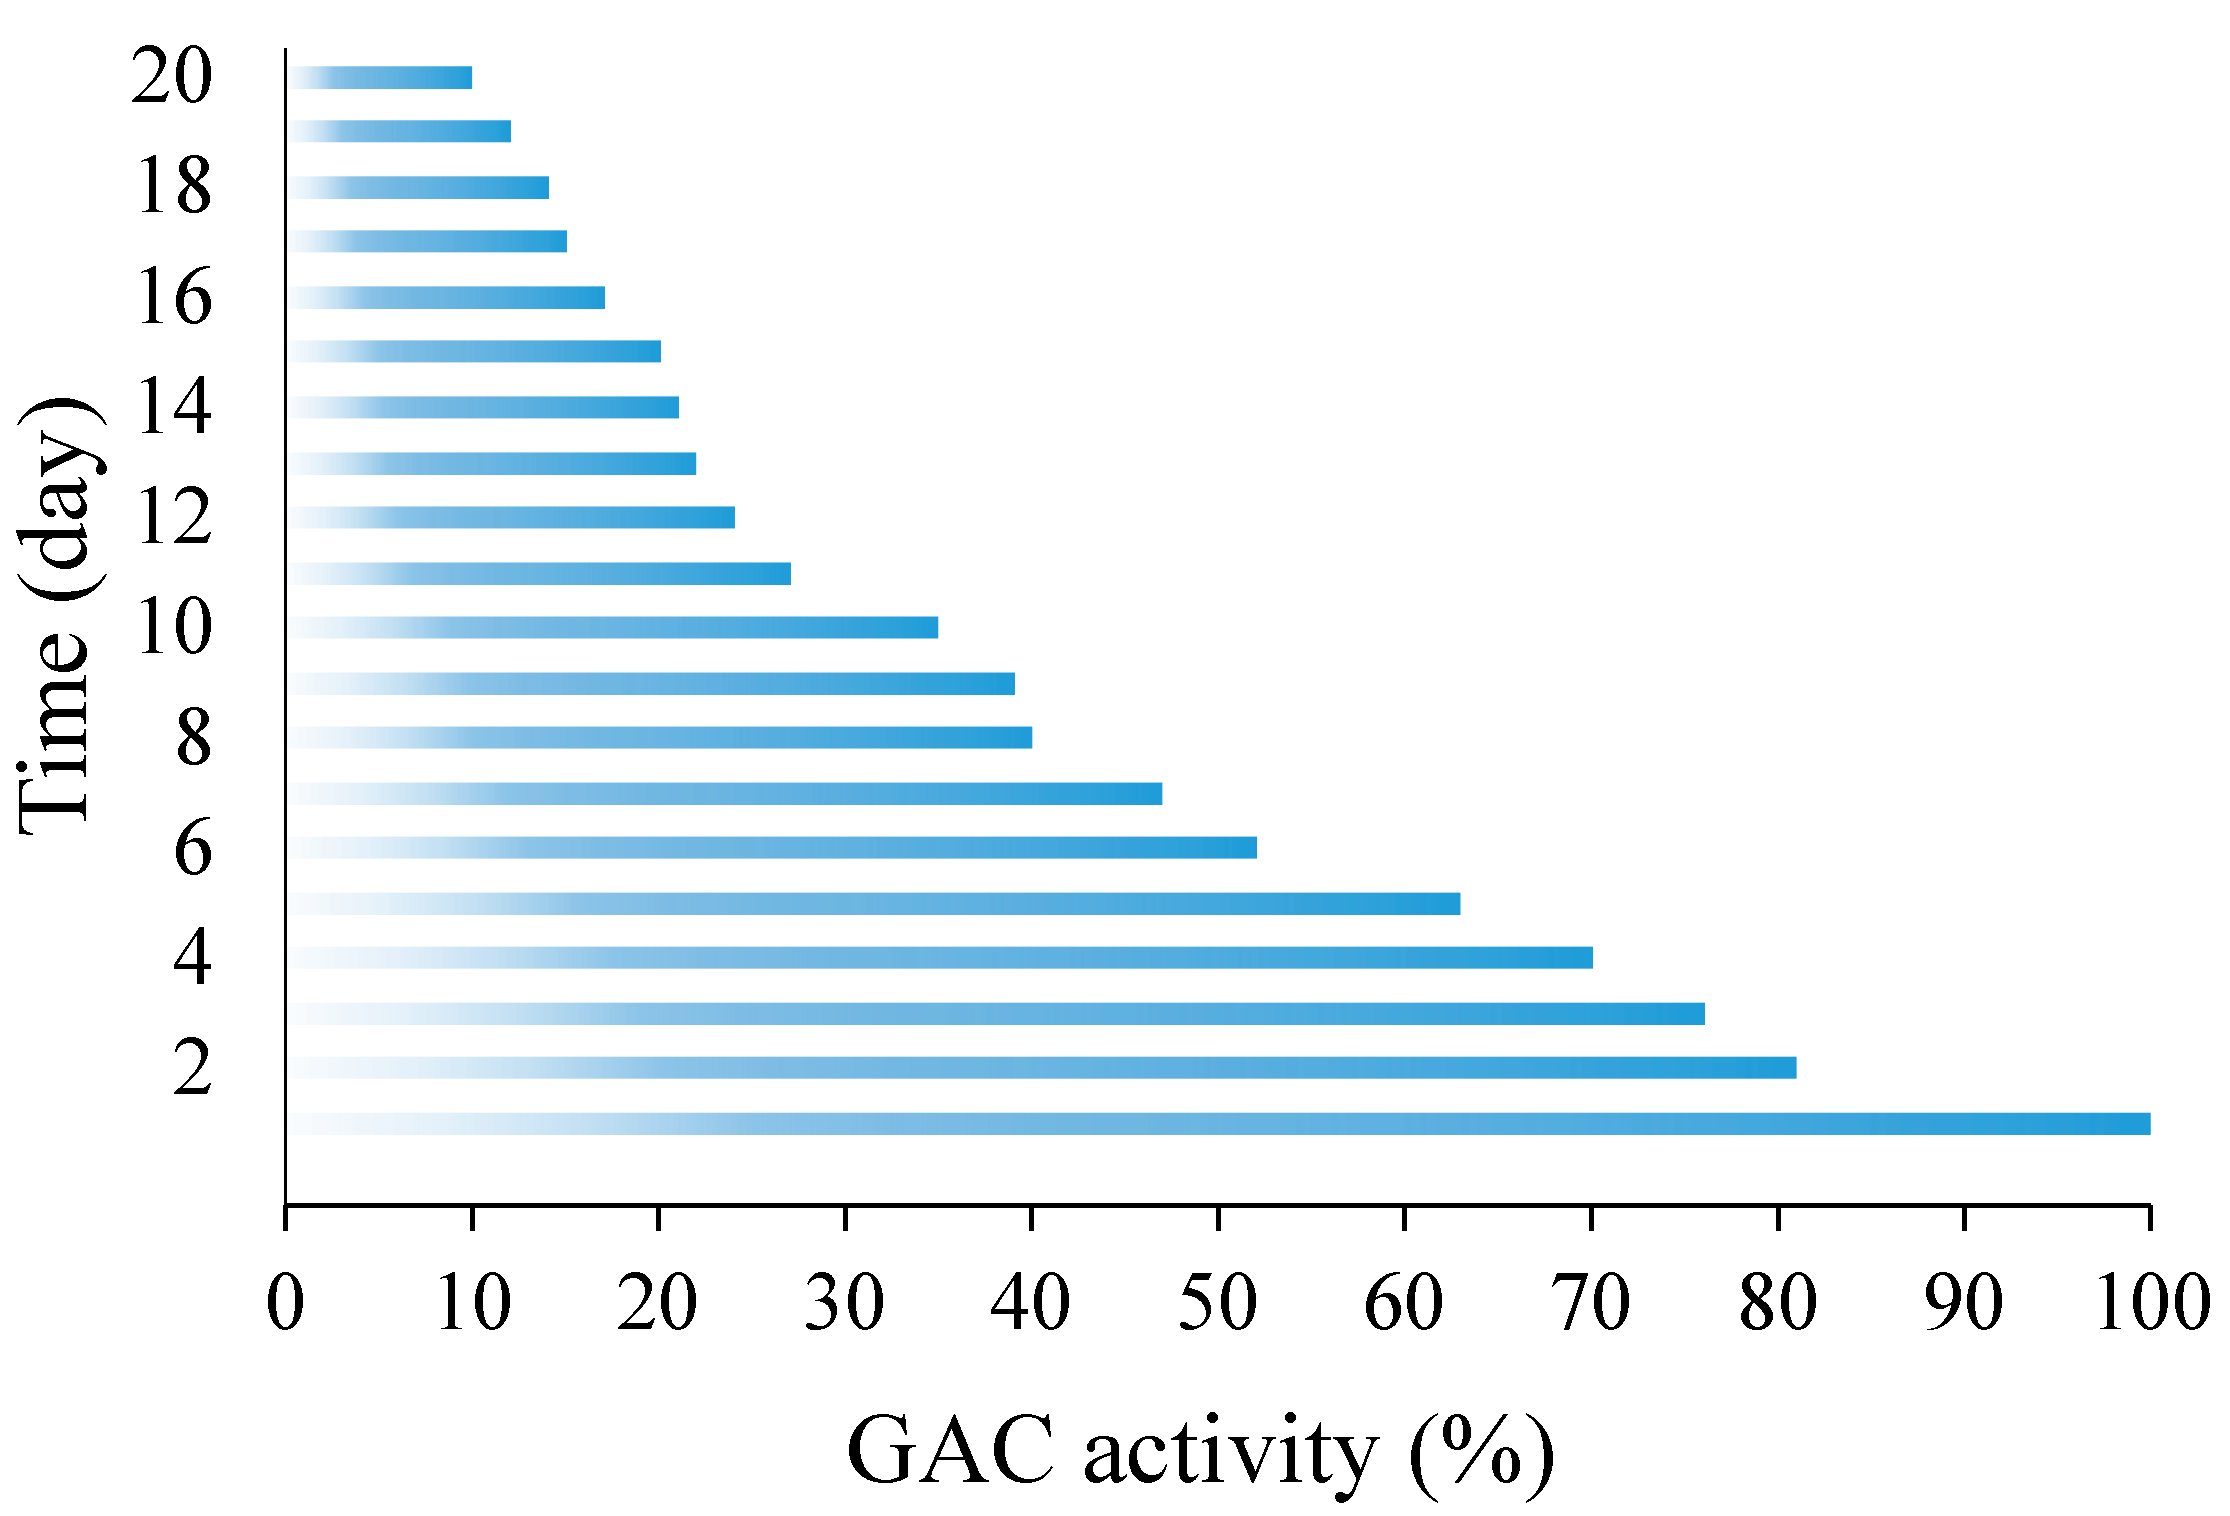
Figure 1. The granular activated carbon (GAC) activities on different days.
Sustainability 12 03287 g001
Figure 2. The effect of activation on mercury adsorption onto GAC.
Sustainability 12 03287 g002
Figure 3. Relationship between GAC activity and Hg recovery at the lab scale.
Sustainability 12 03287 g003
Figure 4. Curves of the rate of mercury adsorption onto the GAC with (a) 10%, (b) 35%, (c) 70% and (d) 100% activity.
Sustainability 12 03287 g004
Figure 5. Hg adsorption capacity of GAC with 10% and 35% activity in the industrial tests.
Sustainability 12 03287 g005
Table 1. The concentration of various metals in the pregnant solution (PLS) (mg/L).
AuAgHgFeCuZnSbPbCN
0.81.1181.13.337.51.20.06120
*The concentrations of Cr, Cd, As, Cl and SO42− were below the detection limit.
Table 2. Pseudo-first-order, pseudo-second-order, chemisorption, and intra-particle diffusion model constants and correlation coefficients for different activities.
Activity (%)ModelConstantsCorrelation Coefficients
10Pseudo-first-orderkf (1/min)0.01170.9192
qe (mg/g)5.9258
Pseudo-second-orderks (g/mg. min)241.54230.9393
qe (mg/g)0.1622
h0 (mg/g.min)6.3547
chemisorptionα (mg/g.min)1.19940.8712
β (g/mg)1.2118
Intra-particle diffusionkid (mg/g.min0.5)0.09030.5084
35 Pseudo-first-orderkf (1/min)0.01520.9593
qe (mg/g)10.0568
Pseudo-second-orderks (g/mg. min)202.04940.9893
qe (mg/g)0.2318
h0 (mg/g.min)10.8564
chemisorptionα (mg/g.min)1.10040.9485
β (g/mg)0.6407
Intra-particle diffusionkid (mg/g.min0.5)0.17100.6382
70 Pseudo-first-orderkf (1/min)0.01630.8522
qe (mg/g)11.6868
Pseudo-second-orderks (g/mg. min)0.00140.9237
qe (mg/g)0.1303
h0 (mg/g.min)12.04
chemisorptionα (mg/g.min)0.90290.9658
β (g/mg)0.4935
Intra-particle diffusionkid (mg/g.min0.5)0.23260.7792
100Pseudo-first-orderkf (1/min)0.00470.7641
qe (mg/g)15.2671
Pseudo-second-orderks (g/mg. min)894.33410.8604
qe (mg/g)0.1341
h0 (mg/g.min)16.0826
chemisorptionα (mg/g.min)0.58300.9482
β (g/mg)0.3986
Intra-particle diffusionkid (mg/g.min0.5)0.29570.9115
Table 3. The concentration of metals in the cyanide leaching solution (CLS) before and after adsorption onto GAC with 10% and 35% activity in the plant.
ActivityNo. of Elutions (per Month)No. of Activations (per Month)Hg Recovery (%)Hg (mg/L)
InitialTenor
10126401810.8
35301590181.8
Table 4. The concentration of metals in the carbon-in-leach (CIL) feed and residual before and after changing the GAC activity.
ActivityNo. of ElutionsNo. of ActivationsGold (ppm)Silver (ppm)
FeedResidualFeedResidual
101260.70.0121.20.25
3030150.60.0031.120.03