1. Introduction
In developing countries, adequate transportation planning is generally not carried out [
1], leading to congestion problems and high costs and travel times; therefore, sustainable urban mobility is a significant challenge in rapidly urbanizing medium- and low-income cities [
2]. While in some of these urban areas the problem is related to congested and inefficient Public Transport (PT) systems [
3,
4], there are other cities where high rates of motorization and private car use tend to occur, causing economic, social and environmental problems [
5]. In Mexico, the latter is a common scenario, since immigration flows in the last years have induced an intense urbanization process in small- and medium-size cities [
6], and the use of automobiles has been encouraged by eliminating taxes and mandatory insurance [
7]. This led to a 6.32% annual motorization rate growth and the use of the car to triple from 1990 to 2010 [
8].
Therefore, there is a private vehicle dependency in some Mexican cities, such as the metropolitan areas of Monterrey and Ciudad Juarez, where 50% of daily trips are made in this mode [
9]. The situation is even more critical in Mexicali, since the last official document of the city in terms of mobility and transport indicates that 84% of daily trips are made in private cars [
10]. This has serious environmental consequences since 68% of the city’s air pollution is caused by transport [
11], and Mexicali has the highest rates of air pollution in the Mexico and the North America region, and is the sixth city in terms of worst air quality in the entire continent [
12].
Mexicali is located in the northwest of the country, right on the international border with California, the United States. It has a low population density of 40.8 hab/ha, with an urban area extension of 183.7 km
2 and a population of 746,123 inhabitants [
13]. There are two international border cross points in the city and an international airport. The city is distinguished by its potential for development due to its geographical position on the border and an economy with greater access to foreign markets, which has facilitated the population acquiring private cars.
The motorization rate is 400 automobiles per thousand inhabitants, the second-highest in the country only behind Tijuana. The kilometer-vehicle indicator per capita journey reaches 6000 km per inhabitant, and it is by far the highest in the country, followed by the metropolitan areas of Guadalajara, Monterrey and Mexico’s Valley, all of them with values approaching 4000 km per inhabitant [
14]. Thus, the city of Mexicali exhibits a level of private vehicle use that is comparable to metropolitan areas of the United States such as Chicago, Las Vegas and New York, the transportation sectors of which are considered unsustainable [
14]. This scenario is presented without the country having mobility policies such as those that developed countries implemented before having motorization rates even lower than in Mexico [
14].
The previous problem needs to be addressed by promoting sustainable urban mobility, prioritizing the use of PT systems [
15,
16]. Nevertheless, these services are implemented most of the time before evaluating the facts that most influence the decision of users [
17]. This situation is common in developing countries since there is usually no mechanism to assess whether the PT services are accomplishing their expected functions and the established standards; in most of the cases, such standards do not even exist [
18]. Therefore, PT systems in Mexico have evolved slowly, with stagnant operation and administration standards, and a service quality that has progressively diminished [
9]. This has resulted in several cities with very low PT ridership, such as the case of Mexicali, where the system attends to less than 12% of the daily weekday trips [
10], while the national average is 65% [
9].
The PT in Mexicali works with a scheme of individual concessions and has historically been defined through a reactive decision-making process, seeking to meet very specific demands through direct services, without a comprehensive design under a system approach. This has made the system currently have 41 routes operated by 11 different companies. The PT service is made up of an extensive network of 935 km; however, 80% of these are overlapping, and the average sinuosity index of the network is 1.77. In most of the urban area, there are no official bus stops established, and the scheme of individual concessionaires that compete to attract passengers encourages continuous and random stops. This causes the PT service to have low reliability since the time headway between buses in each route is not constant. The PT service cost is one of the highest in the country (approximately 0.63 US dollars per trip) [
19], and bus transfer is not free, due to competition between different companies and the direct service design. Thus, Mexicali has an inefficient PT network with high operating costs and a constant demand decrease, which leads to a dependence on private vehicles that represent a barrier to sustainable urban mobility.
To accomplish having people change their means of transport to more sustainable modes, it is necessary to make a comprehensive analysis of the different aspects of the urban area mobility and transport system [
20]. The improvements should be raised considering the variables that current users value the most, and how these variables might act in facilitating their decision to shift from private vehicles to PT [
21,
22]. While a lot of research has been conducted to understand the mobility patterns of many cities in developed economies [
23,
24,
25,
26], studies of this type for cities of developing countries are infrequent, and are generally carried out in large metropolitan areas, so urban mobility data in medium and small cities of the Global South are scarce. Furthermore, resources are generally limited in medium and small Mexican cities, and data collection and studies on urban mobility are not a priority, so a complex scenario is presented in these cities, where it is necessary to take advantage of the few data and studies available [
27,
28,
29].
Despite the complexity involved in analyzing transport systems, there is a basic principle proposed by Manheim [
30]. It is based on the existence of three fundamental macro-variables that represent mobility determinants: The transport system (T), which has a physical infrastructure, vehicles, operation and governance; the activities system (A), that is, the pattern of social and economic activities that develop in the area, which can be related with factors such as population, income or employment; and the flow patterns (F), in other words, origin, destination and traffic volumes in the roadways.
These macro-variables can reflect three types of interrelations: An immediate and evident one where the flow pattern depends on both the transport system and the activities system; secondly, in the medium and long term, changes in the transport system due to the flow patterns; and finally, in the long term, the flow pattern ends up causing changes in the social and economic activities of the population [
31]. Thus, analyzing the possible relations between the elements included in these macro-variables allows identifying the mobility determinants [
32]. This approach is relevant in contexts where mobility data and studies are scarce.
In this regard, the purpose of this research is to deliver a methodological proposal to analyze low PT ridership in cities of developing countries based on existing studies. This is achieved through the selection of available indicators related to Manheim’s macro-variables and identifying which of these has more incidence on PT ridership, so they can be considered by agencies responsible for the planning of the city’s transportation system of developing countries, as well as the different stakeholders, to promote a change from the traditional planning process towards a proactive and holistic approach. For this, the city of Mexicali is used as a case study.
3. Materials and Methods
3.1. Methodological Proposal
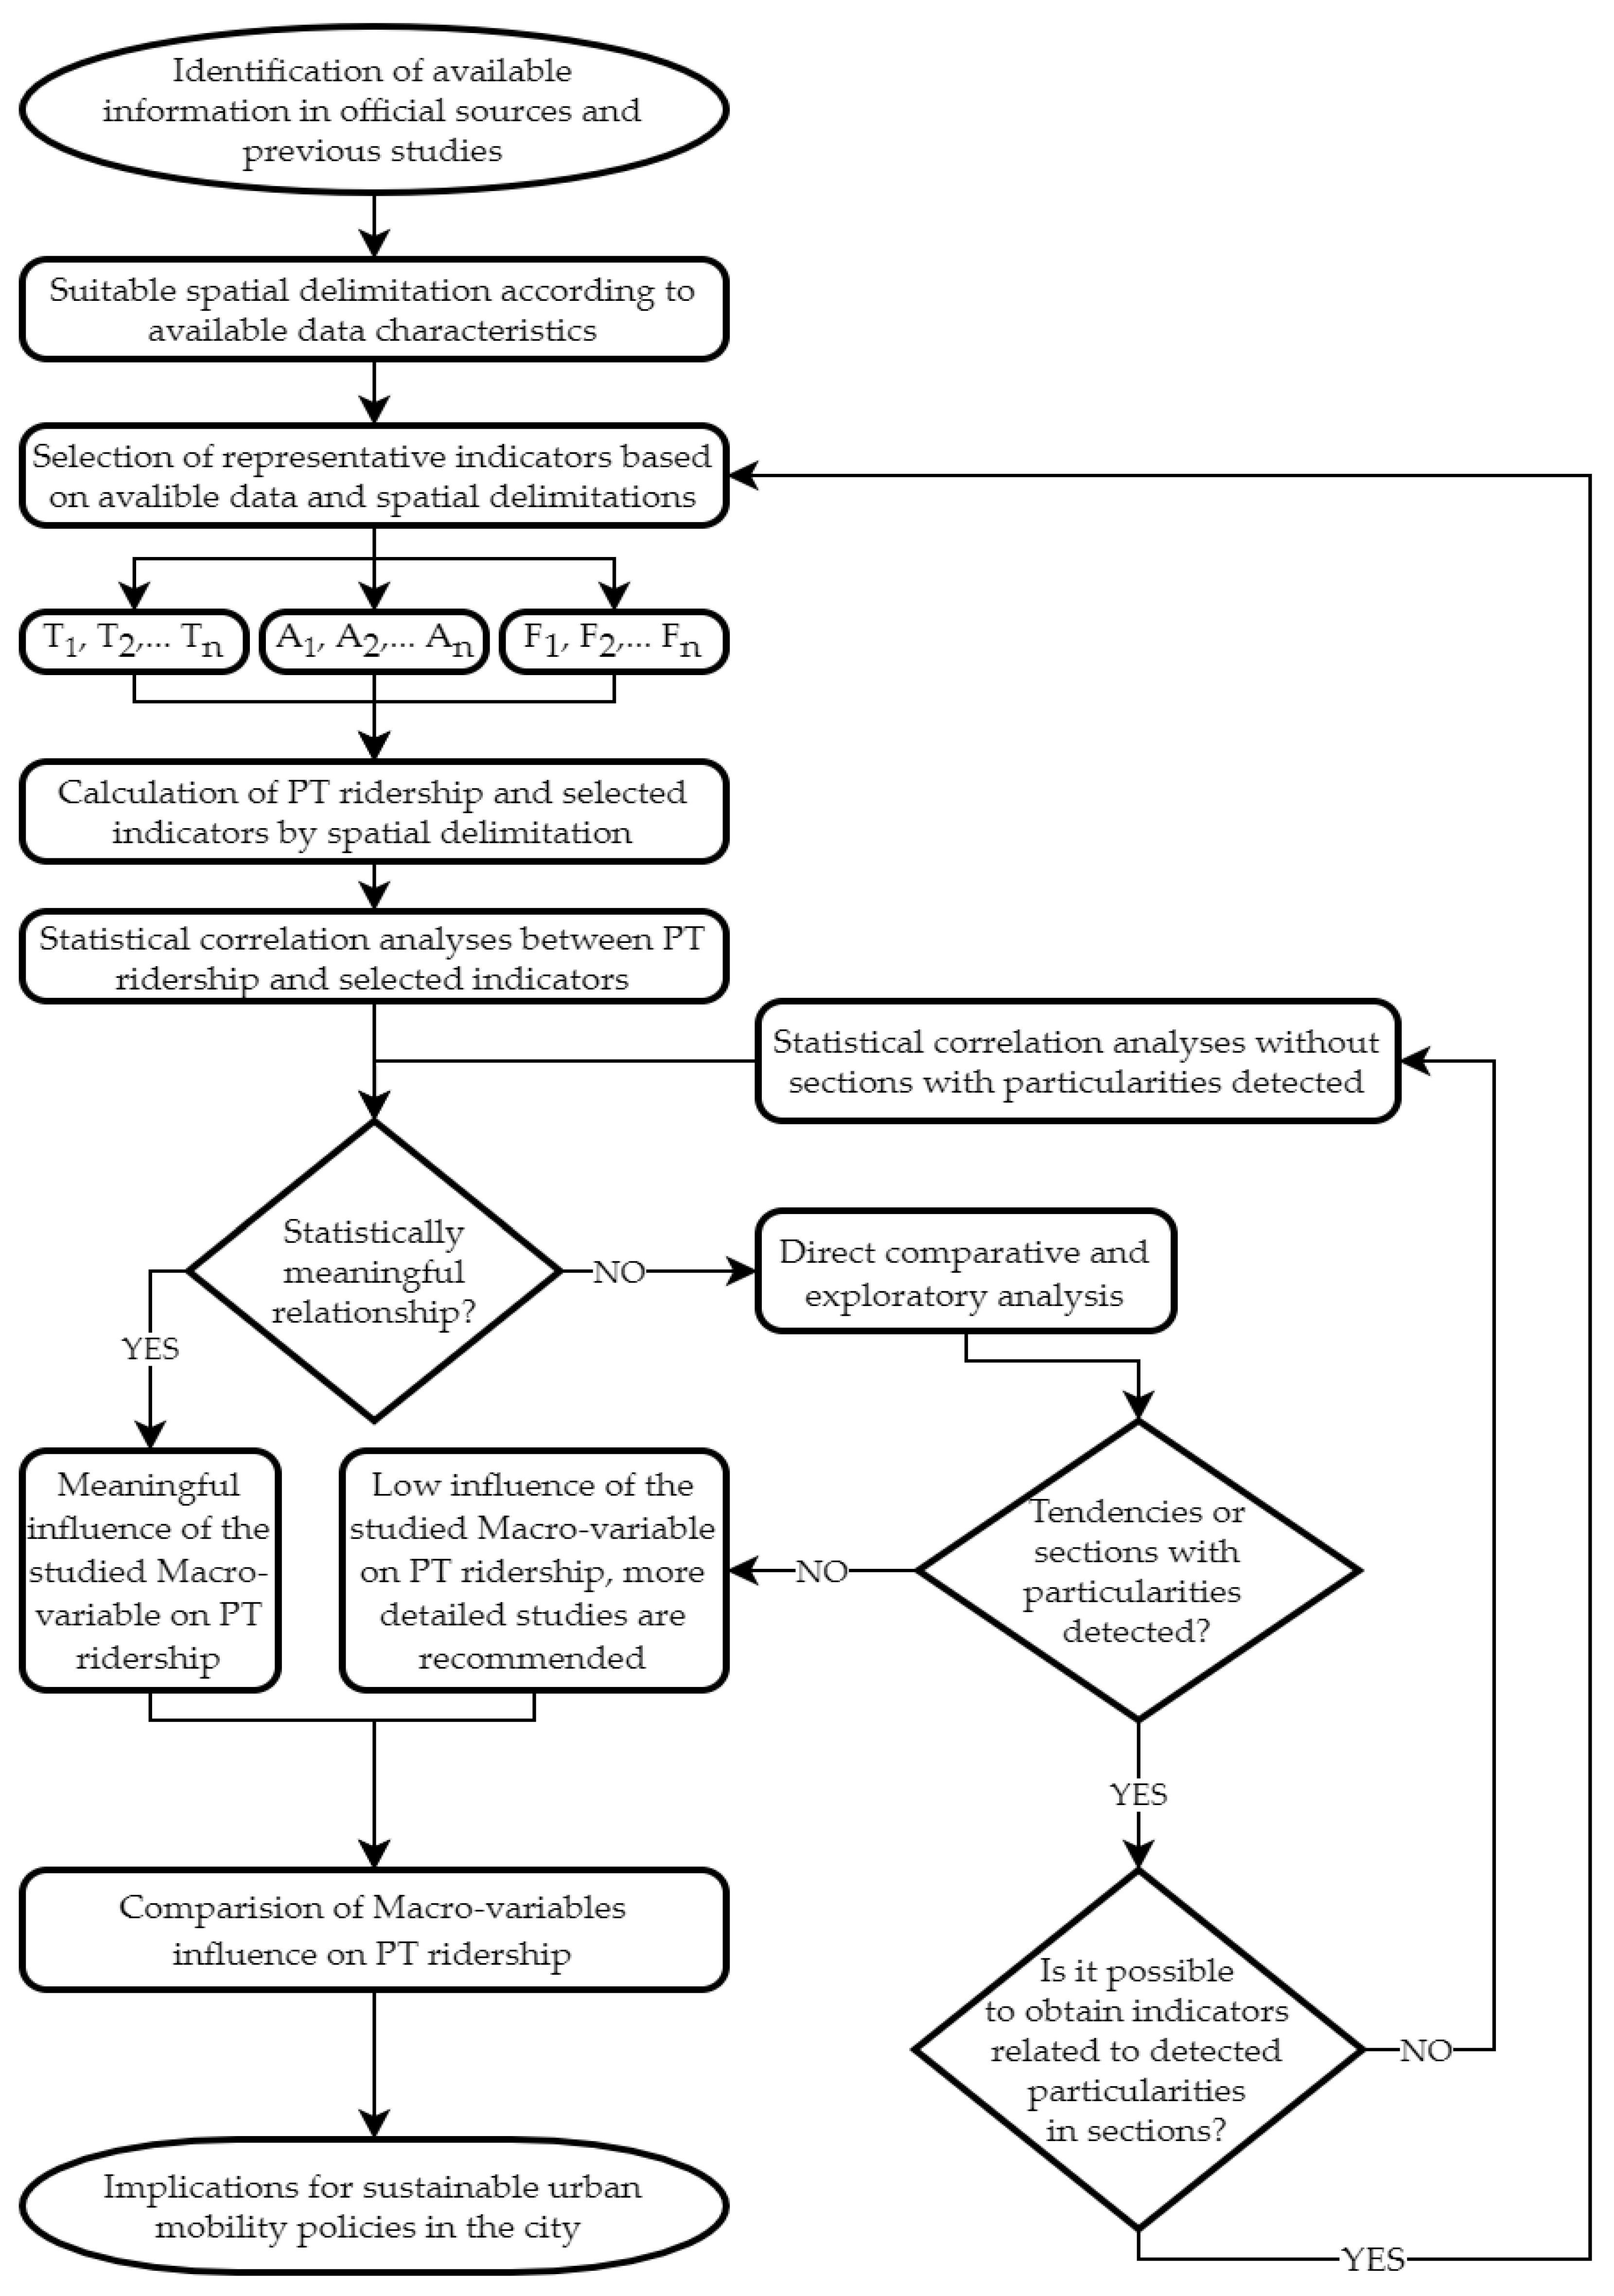
The methodological proposal developed for this research is presented in
Figure 1. Firstly, the available information from existing studies, as well as from official sources, is identified. Then, a suitable spatial delimitation of the study area is carried out considering the level of aggregation of the available data. Spatial delimitations are defined trying to coincide as far as possible with the official zoning of the city established in the masterplan and seeking for the resulting areas to be homogeneous concerning land use [
80,
81], population density [
80,
82,
83] and connectivity with the city’s transportation network through main roads [
80,
81,
84,
85].
Afterward, representative indicators for each Manheim’s macro-variable (T, A and F) are selected taking into account the data available on existing studies and official sources, the literature review, the local context of the city and its transport system, as well as the spatial delimitations defined in the previous step. The existing data from previous studies and from official sources is used to calculate PT ridership and the selected indicators in each spatial delimitation or origin–destination (OD) pair, depending on the type of variable (e.g., PT coverage should be calculated by each spatial delimitation, while travel time should be obtained by OD pairs).
Subsequently, bivariate statistical correlation analyses to assess the relationship between each selected indicator and PT ridership are carried out. If the relationship is evaluated through categorical or quantitative variables, the chi-square index (χ2) and the Cramer coefficient are calculated, while the Pearson and Spearman indices are used if working with quantitative variables.
If a statistically meaningful relationship is obtained, it can be understood that results represent the incidence that the corresponding macro-variable has in PT usage. However, if results indicate no meaningful relationship, a direct comparative exploratory analysis that allows identifying if trends or areas with particularities exist is carried out.
When the exploratory analysis does not find any general trend or particular sections with special behavior, then it is understood that the corresponding macro-variable has a low incidence in the use of public transport, and likewise more detailed studies with indicators associated with this macro-variable are recommended. On the other hand, if the exploratory analysis identifies that there are certain spatial delimitations that have particular behavior and are out of tendency, two things can be done: If possible, obtain from the existing information new indicators associated with this Macro-variable in the identified areas; otherwise, perform the statistical correlation analyses without considering these spatial delimitations.
Once the three macro-variables have been tested with all the indicators that the existing data allows to calculate, a comparison of the influence each macro-variable has on PT ridership allows understanding the implications these results have in the design of sustainable urban mobility policies in the city, specifically for increasing public transport demand.
3.2. Case Study Background: Available Data and Selected Indicators
The city of Mexicali is the capital of the state of Baja California, Mexico. It is located in the northwest of the country, and it is a border city with Calexico, California, United States. It has a population of 746,123 inhabitants with an annual growth rate of 2.7%, and the Economic Active Population (EAP) represents 43.9% (327,670 inhabitants) [
86]. The geographical position of Mexicali, just at the Mexican side of the international border, provides development potential to the city and facilitates access to the US market to both businesses and city residents. This encourages commercial and migratory flows, as well as transboundary cargo and tourism movements that affect the operation of the city’s transport infrastructure.
As established in
Section 1, Mexicali has the highest air pollution rates in the Mexico and North America region and is sixth among cities in terms of worst air quality in the entire continent [
12], with the transportation sector being responsible for 68% of the city’s air pollution [
11]. Thus, it is mandatory to achieve sustainable urban mobility in the city, where currently the daily displacements are characterized by private vehicle dependency and a PT service that barely attends to 12% of the daily weekday trips.
The PT service in Mexicali is provided by buses and the like in most Mexican cities [
14], the system operates under a scheme of individual concessions. Currently, the PT network has 41 routes operated by 11 different companies, with an extension of 935 km. Contrasting this value with the 183.7 km
2 of urban area, it could indicate that Mexicali has an extensive public transport network that provides good accessibility throughout the city; nevertheless, 80% of the network kilometers overlap; in some sections of the network even up to eight routes compete for the same demand. In addition, most of the routes are winding, and the average sinuosity index of the network is 1.77. This is a consequence of the historical conformation process of Mexicali’s PT system, which, as in many Latin American cities, has been defined by a reactive decision-making process.
While the paths of the routes are defined, some aspects of the system’s operation are not regularized and exhibit a lack of control. On the one hand, official bus stops are only established in the central part of the city, while in most of the urban area there are no official passenger pick-up and drop-off points. Thus, the PT scheme of individual concessionaires that compete to attract more passengers encourages continuous and random stops in most of the city. Even so, the Municipal Transport System (SIMUTRA from its acronym in Spanish), which is the agency responsible for the planning and administration of PT in the city, has a record of the areas commonly used to get on or off buses. Currently, the network only has 180 official bus stops and 1666 informal and unofficial passenger pick-up and drop-off points. On the other hand, the random stops and a lack of control cause the public transport service to have low reliability. The time headway between subsequent buses in each route is not constant, and there are occasions when less than 6 min may pass for the next bus and then more than 15 min may have to pass for the one after. Finally, the PT service has a cost of 15.50 Mexican pesos (approximately 0.63 US dollars) per trip, which is one of the highest in the country [
19]. Moreover, bus transfer is not free due to the scheme of individual concessions and the competition between the 11 companies, so it is unattractive for users to use two or more buses to get to their destination.
The previous scenario translates into an inefficient network with high operating costs and a constant decrease in public transport demand. According to SIMUTRA, currently in Mexicali only 140,000 daily trips are made on PT. Considering that the EAP should make at least two trips a day, this exhibits low PT demand. Thus, the daily displacements of the city represent a barrier for sustainable urban mobility, and it is necessary to implement transport policies and strategies to encourage the population to change their means of transport and achieve a shift from private vehicles to PT.
Despite the above, in Mexicali there are no specific analyses or official documents seeking to understand the low PT ridership problem and achieve a modal shift. Even so, there have been studies with other purposes from which certain data on the urban mobility of the city can be obtained, like the Employment Center Mobility Survey applied by the Autonomous University of Baja California (UABC) in 2017, as part of a research project centered on the identification of opportunity areas for EAP daily displacements. While the survey was not carried out in order to specifically understand the problem of public transport in the city, it contains some questions related to this phenomenon, so these are used to carry out this research. This is in accordance with the approach of the methodological proposal.
The survey was applied in 2017 in the main employment centroids of the city and achieved a total of 1620 responses. Considering the total EAP of Mexicali of the National Institute of Statistic and Geography (INEGI, in its Spanish acronym) 2010 population and housing census [
86], the sample size has a level of confidence of 90% and a 2.6% margin of error. The survey included questions related to the profile of the interviewee, characteristics of their home and general patterns of local mobility. Thus, taking into consideration the literature review, it was possible to harness six variables of the existing survey to analyze the public transport problem in Mexicali: Home location, workplace location, type of work, travel mode, travel time and perception of PT service. Unfortunately, this survey did not include questions about socioeconomic characteristics such as income level and vehicle possession.
In order to carry out this research, three types of general variables were also obtained from official sources: The routes of the 41 public transport concessions, which are operated by 11 different companies were identified from the city council website; the spatial distribution of the inhabitants of Mexicali from the INEGI 2010 population and housing census [
86] that reports this data for each AGEB; and the spatial distribution of the employment centroids of the city, from the National Statistical Directory of Economic Units (DENUE, in its Spanish acronym) [
87]. To complement the PT supply analysis SIMUTRA’s databases of bus stops (official and informal) and of average headway of PT routes were used.
Considering the literature review, the available data in official sources, as well as the variables selected from the existing survey, indicators for the analyses were selected as established in the methodological proposal. Thus, the base indicator for this research is the PT ridership; the macro-variable transport system (T) is evaluated through the PT network density, bus stop coverage and time headway; the flow structure (F) is analyzed using the difference in travel time between private vehicles and PT, and the perception of the service and the activity system (A) by type of work and population density.
The PT ridership, type of work and perception of PT service were identified directly from the survey observations. Type of work was classified into four categories: Industrial, commercial, services and government activities, while PT service perception was classified in five: Very bad, bad, regular, good and excellent. On the other hand, the difference in travel time between private car and PT in the main origin–destination (OD) pairs of the city was calculated from the survey responses regarding home location, workplace location, travel mode and travel time. For the network density calculation, a coverage area of 200 m of each side of the route axis was considered since the 2004 Master Plan of Roads and Transportation of Mexicali B.C. indicates that a PT user walks on average 201 m to board a bus [
88]. Finally, the population density was calculated using the inhabitants reported by AGEB in the INEGI 2010 population and housing census [
86].
4. Results and Discussion
4.1. Territorial Delimitation and PT Ridership in Mexicali
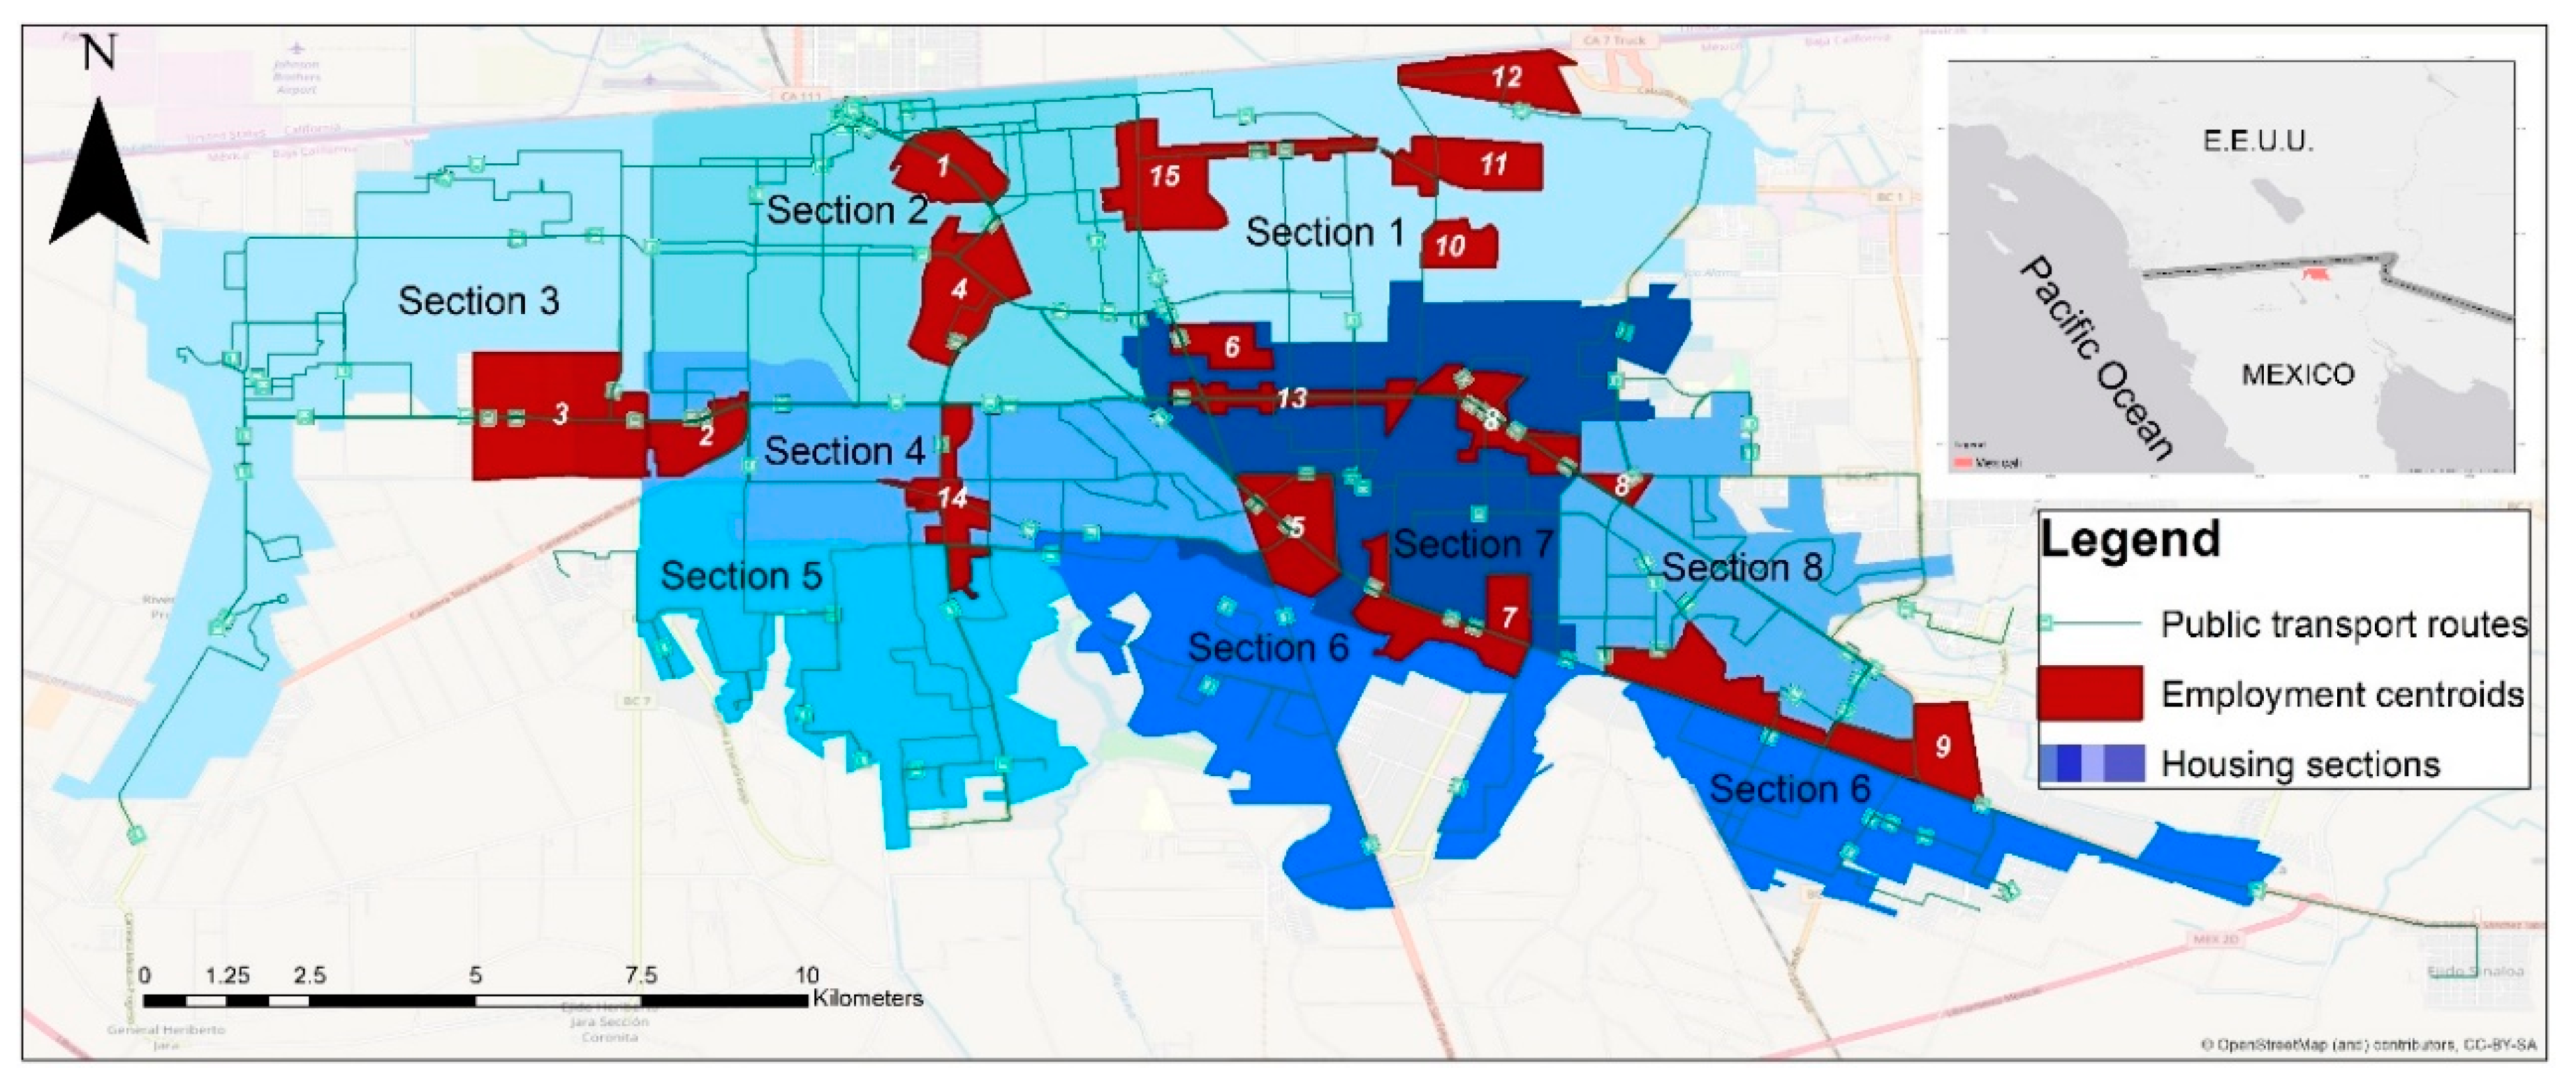
For the case of Mexicali, two territorial delimitations were done in order to develop a spatial analysis of the indicators. One identifies the main centroids of employment concentration in the city based on the National Statistical Directory of Economic Units (DENUE, in its Spanish acronym) of the National Institute of Statistic and Geography (INEGI, in its Spanish acronym) [
87]. Likewise, to delimit the places of concentration of employment, accessibility to them through the main roads of the city was considered.
The other delimitation was made to divide the city into different housing sections. These were defined trying to coincide as far as possible with the official zoning of the city established in the 2025 Program of Urban Development of the Population Center of Mexicali B.C. (PDUCP in its Spanish acronym). This was done seeking that the results can be incorporated or associated with the city’s sectoral development plans. The PDUCP reports six main zones and 14 sectors, but some of these include some rural areas that are not part of this study. Likewise, this delimitation was carried out using the information of the Basic Geo-Statistical Areas (AGEB, in its Spanish acronym), which are the basic unit of the National Geostatistical Framework of Mexico.
Using DENUE information, 15 employment centroids were delimited, which concentrate most of the jobs in Mexicali. These employment concentrations are located in different zones of the urban area. Thus, the city of Mexicali presents a polycentric structure, with trip attractor centroids distributed in a large part of the city. On the other hand, the urban zone was divided into eight housing sections; four of these (1, 2, 4 and 7) are located on the central part of the city and concentrate 12 of the 15 employment centroids.
Figure 2 shows the location of the 15 employment centroids and the eight housing sections, as well as the tracing of the 41 PT routes.
The results of the survey indicate that PT ridership for work purposes is 20.9%.
Table 1 shows the PT usage in each territorial delimitation. In employment destinations, the average of users is not uniform and ranges from 3.8% in centroid 6 to 44.3% in centroid 1. When considering the EAP distribution in the different centroids of employment concentration, number 7 stands out since it draws in around 17% of the HW trips in the city and therefore draws in almost a quarter of the PT trips for work purposes. On the other hand, in the origins of the HW trips, uniform behavior is not appreciated either, since the use of PT ranges from 17% in section 1 to 46% in section 3.
4.2. Transport System (T) Macro-Variable: PT Ridership
This section presents the results of the analysis of the relationship between the use of PT and the selected indicators to represent the Transport system (T) macro-variable. These are network density, stop points (official and informal) and time headway between buses (
Table 2).
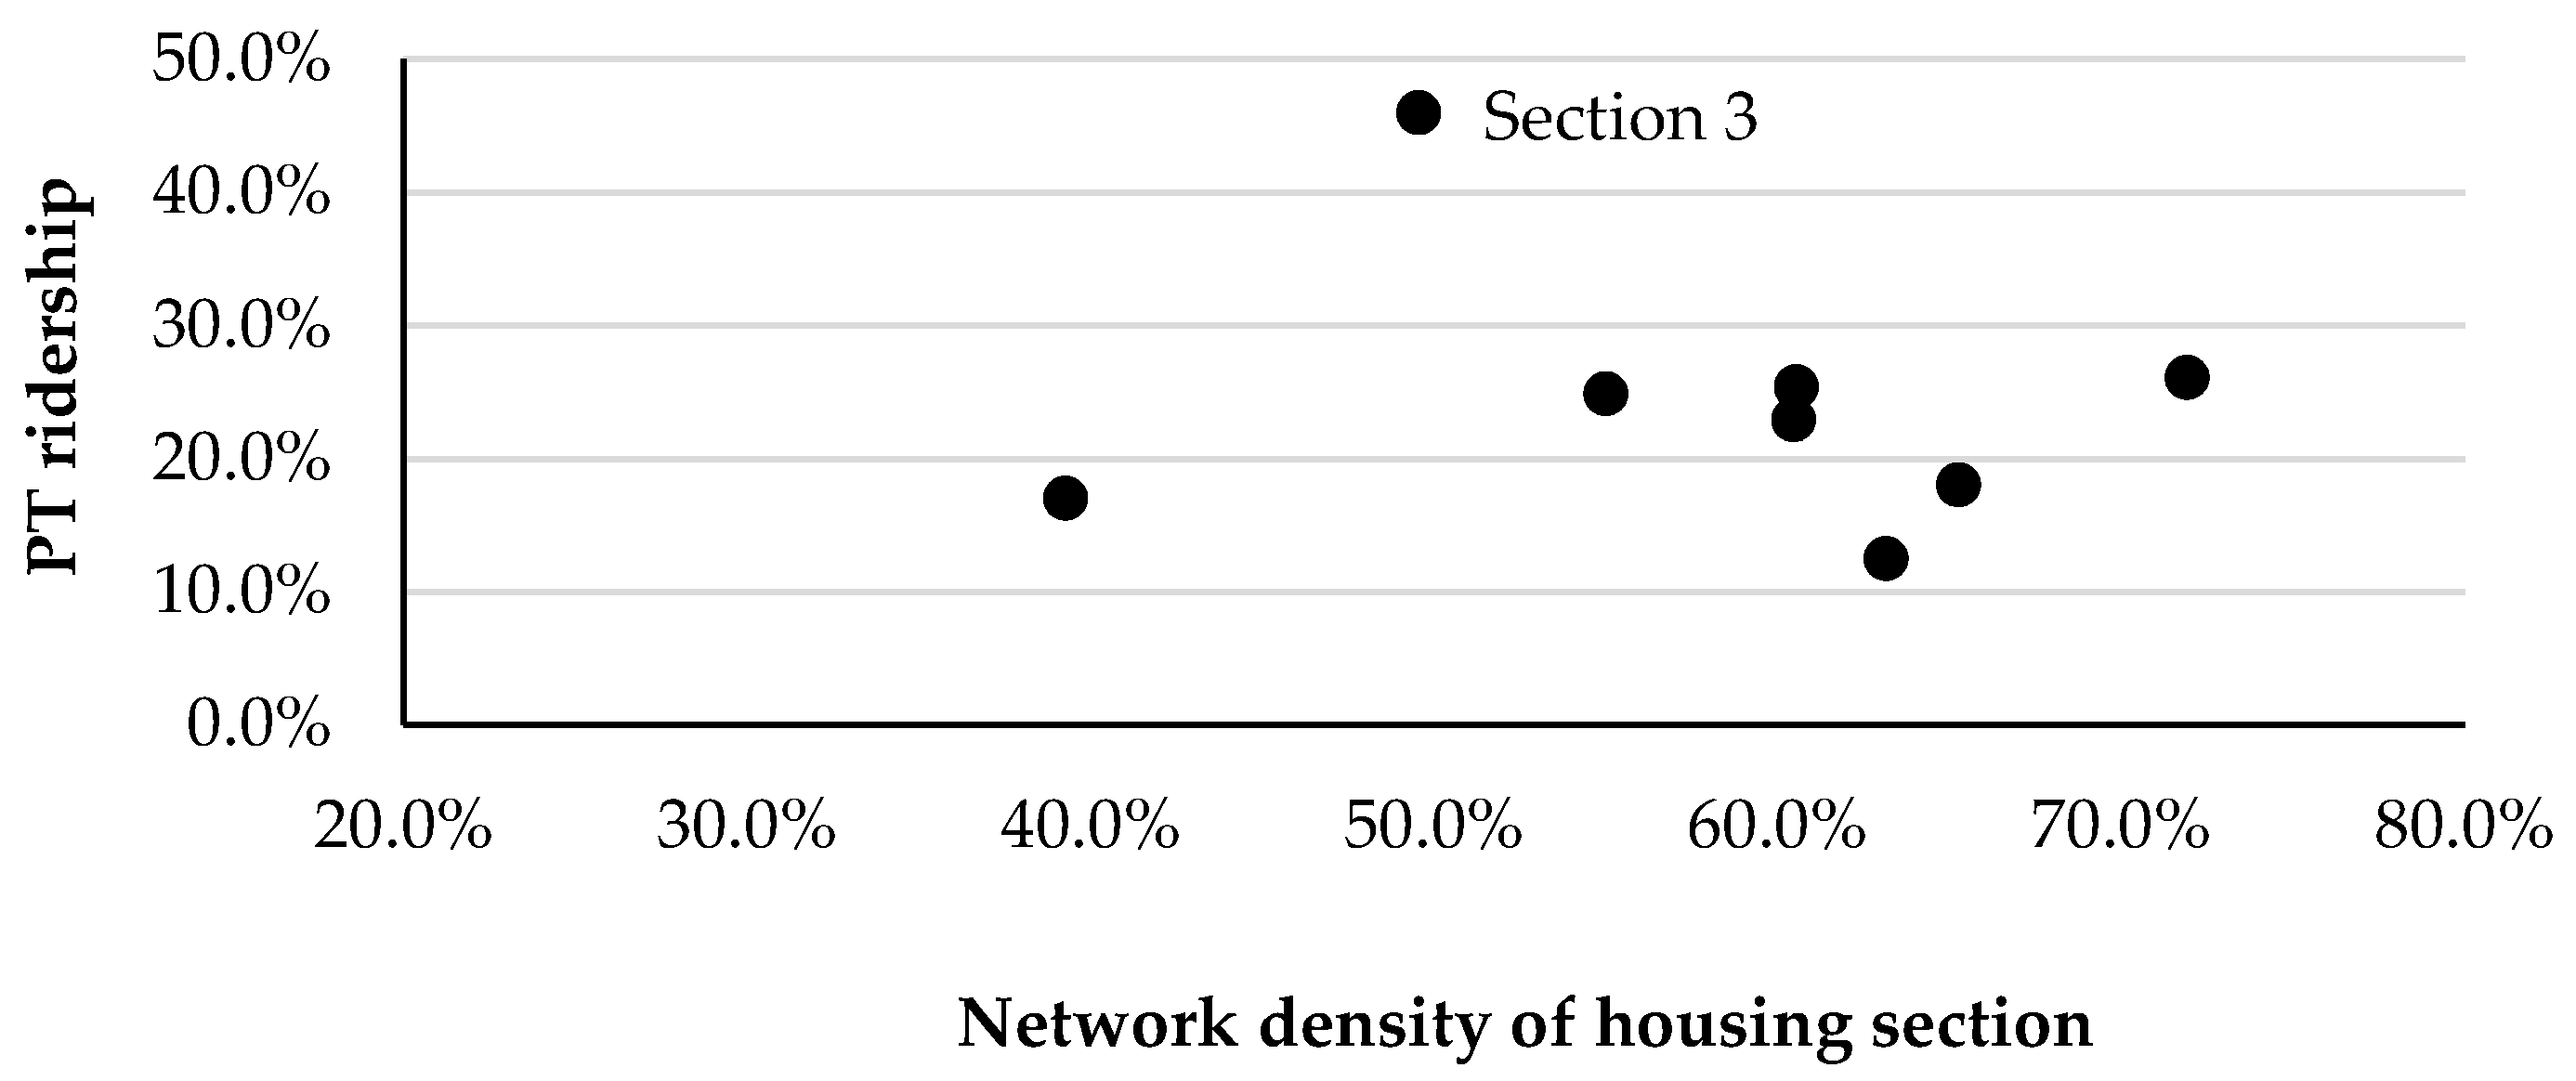
The coverage analysis of the 41 PT routes indicates that Mexicali has a network density of 56.7%. In order to analyze the relationship with PT ridership, the network density was calculated for each housing section and employment centroid. For the chi-square test, three categories of network density were defined: Low, medium and high. In the case of housing sections, the analysis indicates an χ2 value of 16.57 and a critical of 5.99. However, the Cramer contingency coefficient is 0.10, indicating a low level of association. In the low- and high-density categories the PT ridership is near 25%, while in the medium it is barely 17%. While this situation allows rejecting the independence hypothesis, it does not give information to obtain a conclusion for the alternative hypothesis that explains the relationship in a better way, if it exists.
For the quantitative association analysis, the PT ridership for each housing section is compared with the corresponding network density value. It is shown that a tendency exists and section 3 is outside of it since it has the second worst network density (49.5%) and the highest rate of use (46%) (
Figure 3).
Section 3 is located at the western end of the city and the population of this area has on average a lower socioeconomic level than the rest of the city. Iracheta [
89] and Sobrino [
90] indicate that the population residing in the peripheries of the cities of Mexico are generally of unfavorable socioeconomic conditions, so they travel with less frequency and use PT because it is their only option. Taking into account that only 5.4% of HW trips originate in this section, the correlation analysis is carried out without considering section 3. Results indicate a Pearson correlation of R = 0.26 with a significance of 0.57, which shows that, while it is not a linear relationship, a trend exists. Therefore, except for special circumstances in which people do not have a mode choice alternative, there is a tendency for more use of PT with better network densities.
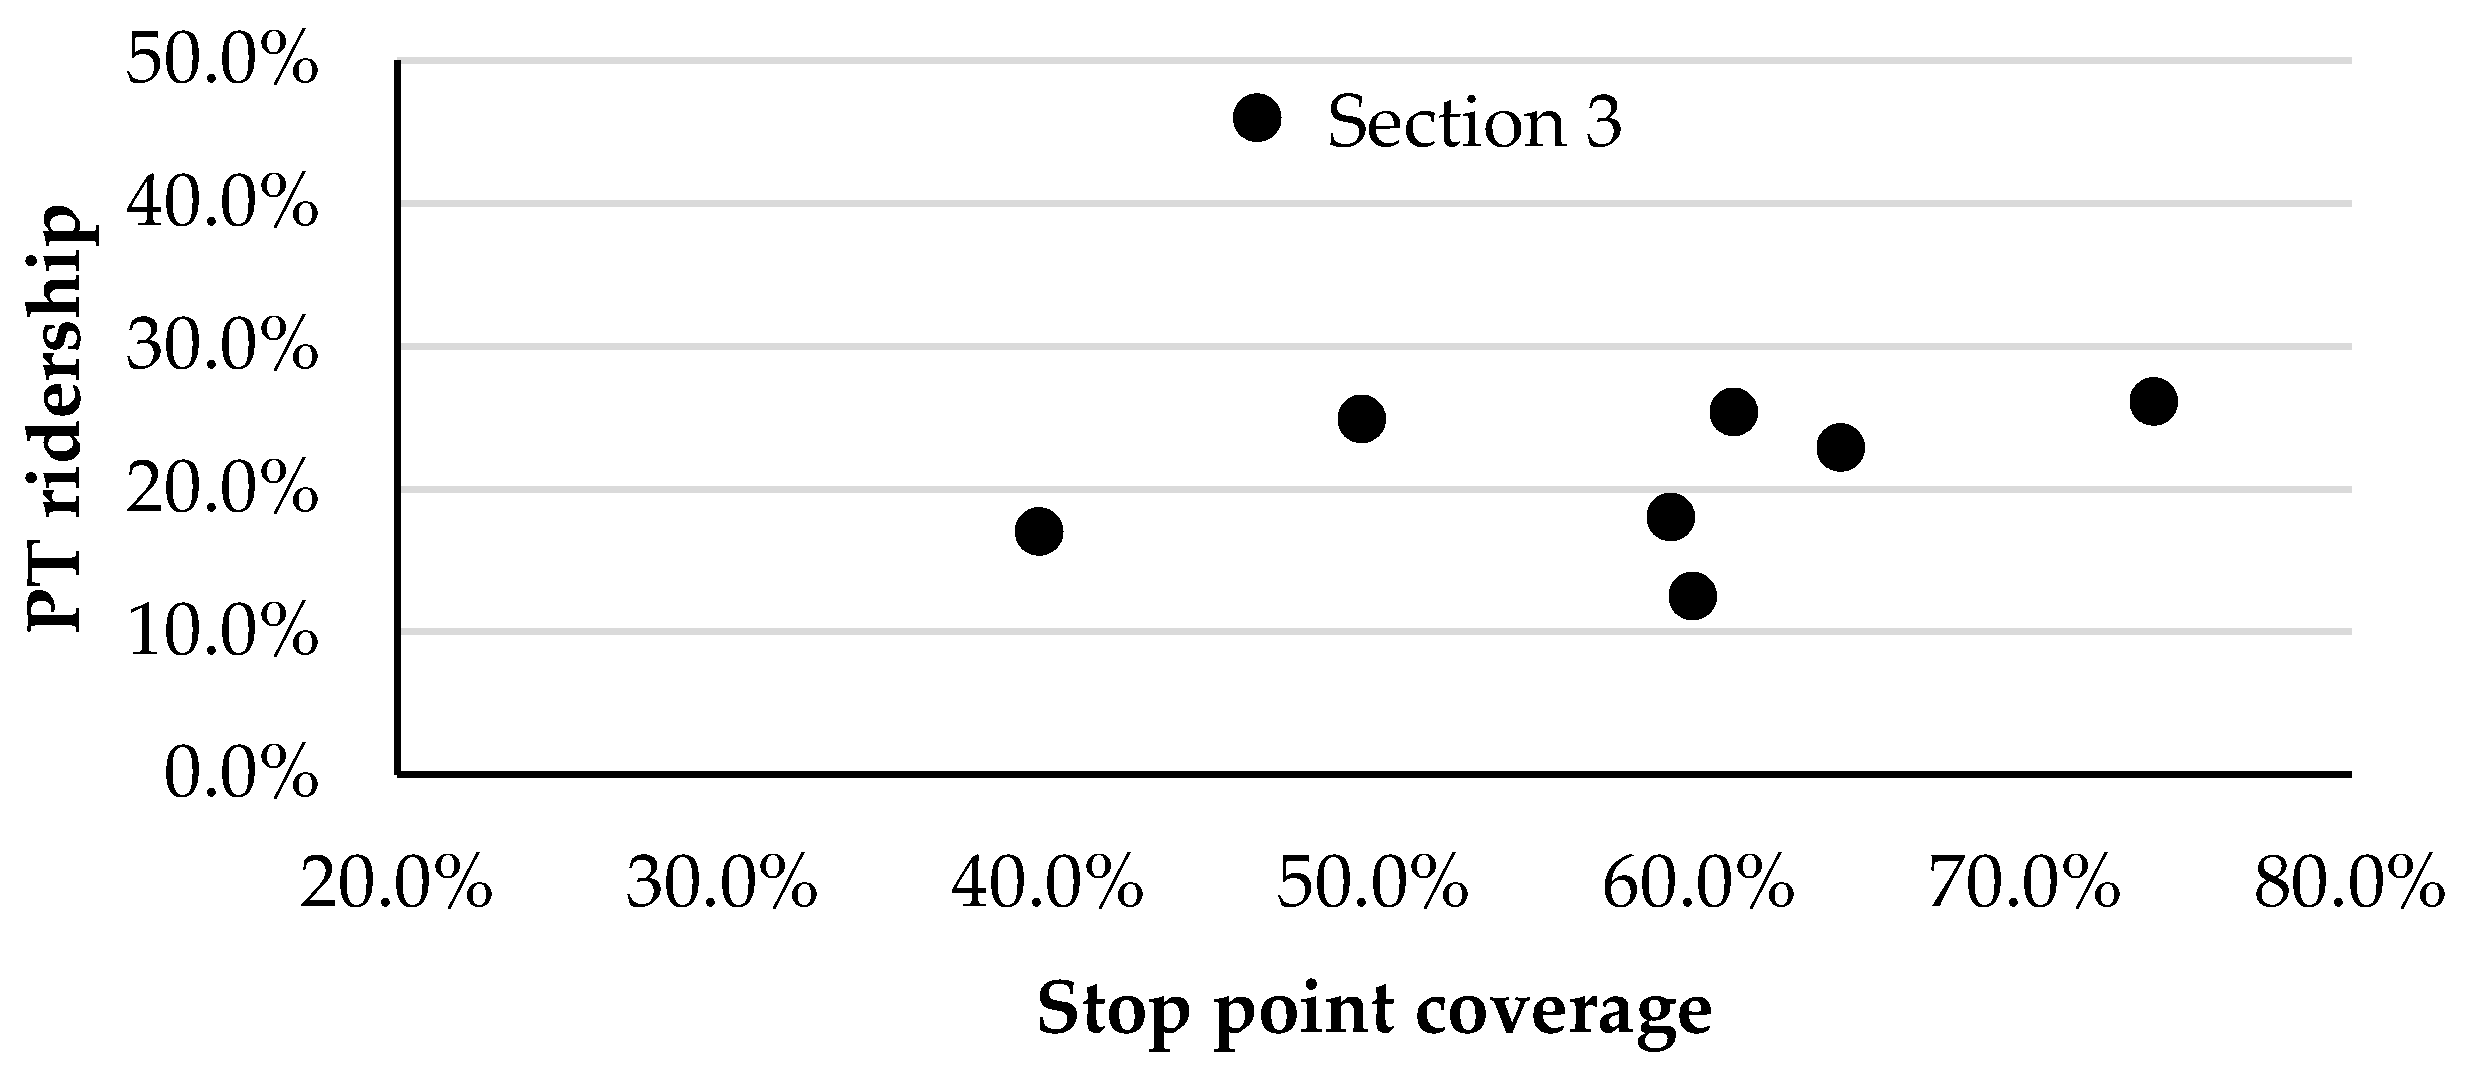
Meanwhile, considering a 300 m radius of coverage for stop points, barely 55% of the urban area of Mexicali is attended. This value is in contrast to that indicated in the PDUCP [
11], where it is established that the system covers 91% of the urban area considering that the bus stops have a coverage radius of 300 m. These coverage results are similar to the ones obtained by the network density analysis. Thus, section 1 has the lowest accessibility with barely 39.7% of its area attended while section 8 has the best coverage with 73.9%.
The correlation analysis between PT ridership and bus stop coverage also gave similar results to the ones obtained by network density. That is, no relation was found by the first statistical tests, but the exploratory analysis identified a tendency with only section 3 outside of it (
Figure 4). Then, the statistical analysis without this section indicated a Pearson correlation of 0.38. Thus, there is not a direct relation among bus stop coverage and PT usage; it is rather a tendency. This is because only 10% (180) of the bus stops are official, while 90% (1666) of the points included in the analysis are informal and based on average locations obtained by SIMUTRA that represent places where buses generally stop but not always; in some cases buses may not stop or choose another point to pick up or drop off passengers.
The previous scenario with random and continuous stops causes instability in time headways on the different PT routes. That is why in the analysis no statistical relation or tendencies were identified that allowed establishing a relationship between the average time headway of the PT service in each section and PT use. However, it is worth noting that the headway time, besides being unstable, is very high in all sections and diminishes the accessibility of the PT system in the entire city.
4.3. Flow Pattern (F) Macro-Variable—PT Ridership
From the survey results, an average travel time for HW trips in Mexicali of 30 min was obtained. This contrasts with Velandia [
91], who indicates that in a Mexican capital, inhabitants invest between two and three hours a day to get to their destination.
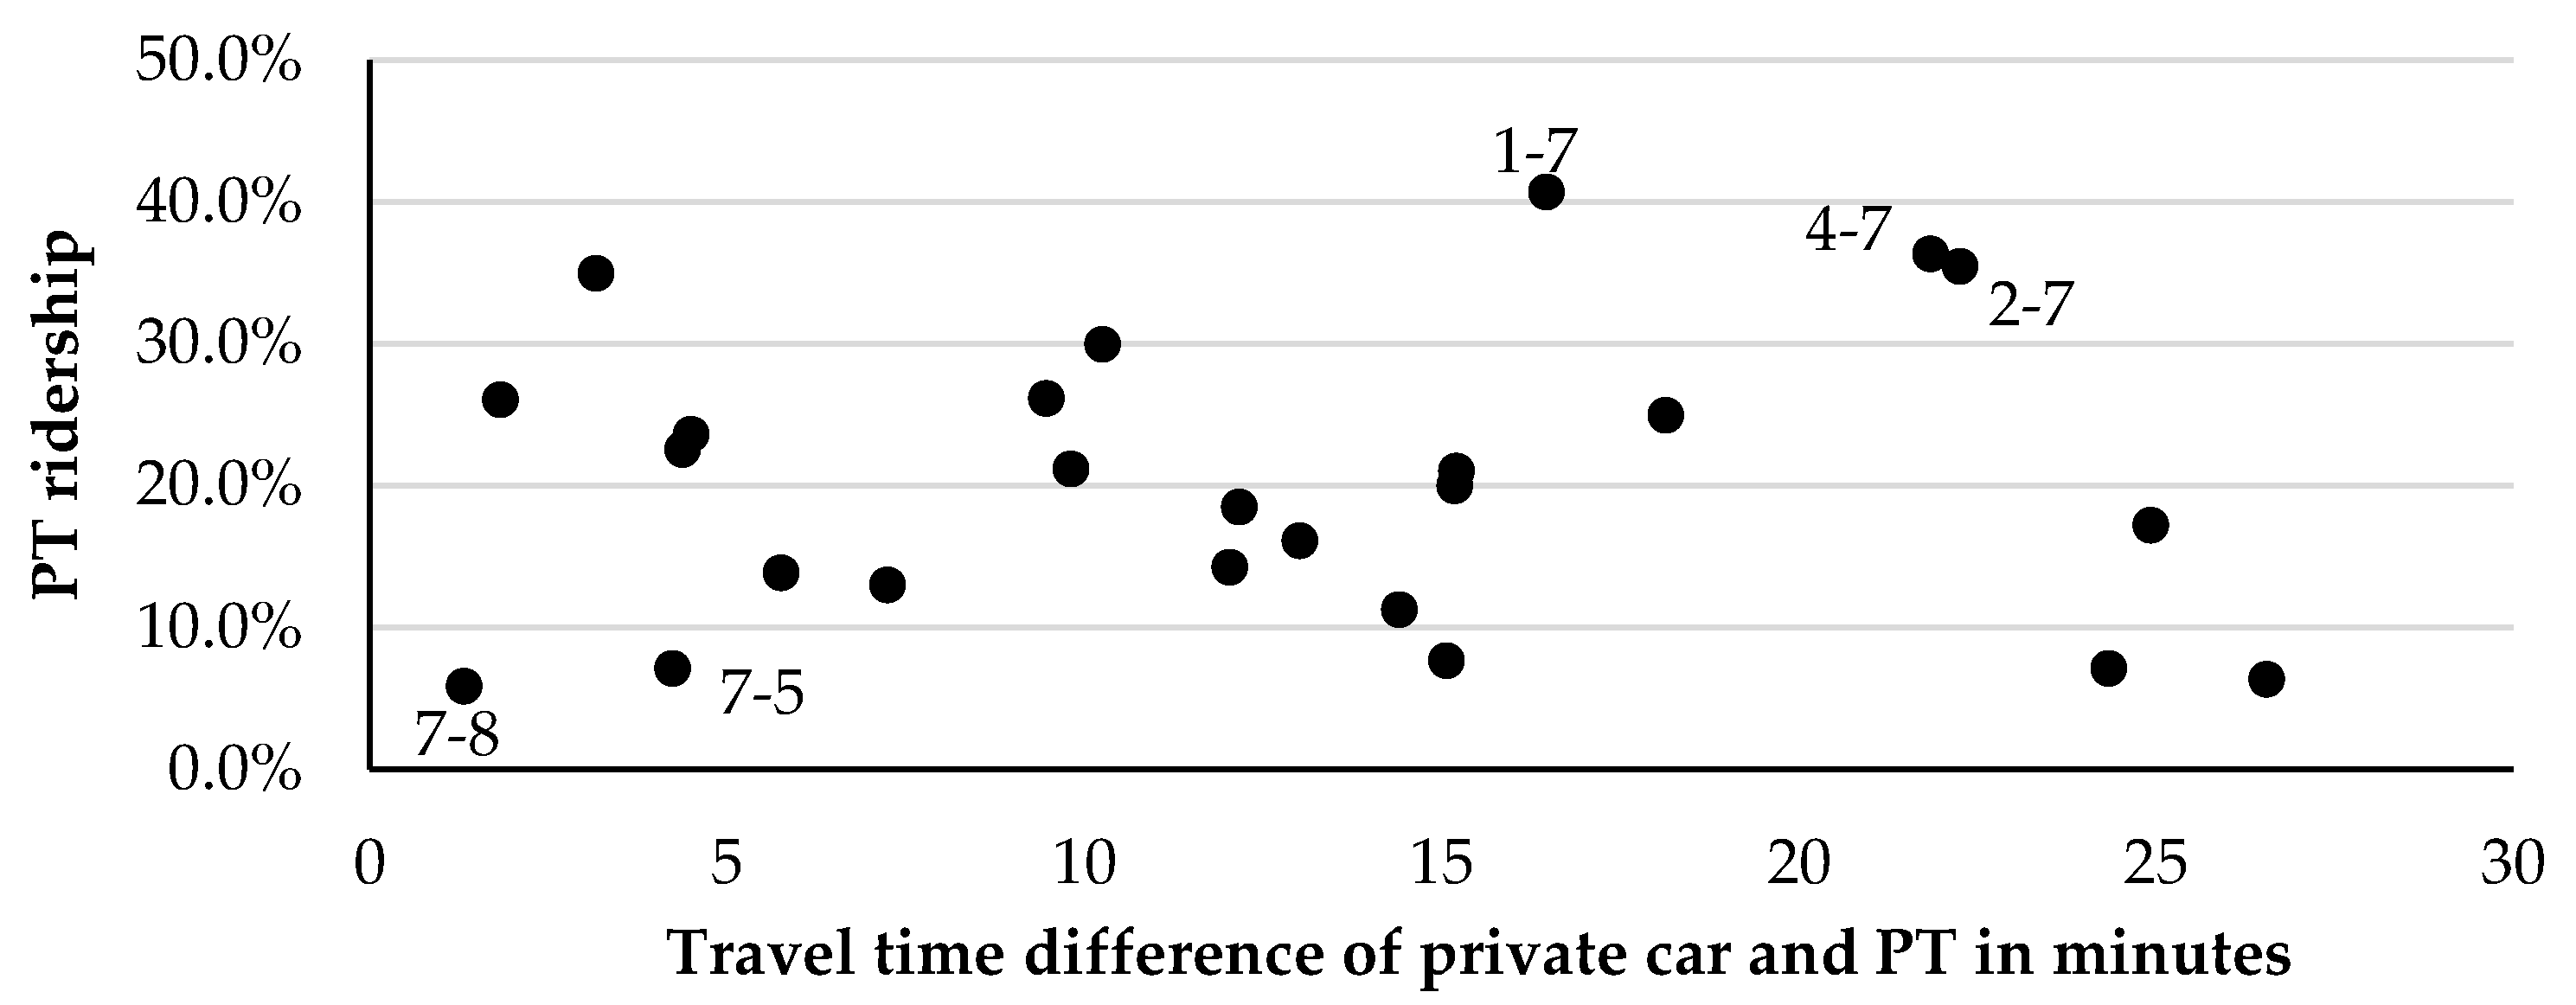
An exploratory analysis of the 26 main OD pairs that concentrate more than 50% of the HW trips of the city shows a slight relationship between the difference in travel times offered by the private vehicle and the PT, with the use of the latter, but it also allows detection of particular travel behavior in two areas: Housing section 7 and the employment centroid 7 (
Figure 5).
All OD pairs with their origin in section 7 report low PT ridership. This could be logical considering that section 7 is by far the one with the lowest use of the system in the whole city; however, in pairs 7 and 8 and 7 and 5 the travel time differences between automobile and PT are very low (1.3 and 4.2 min, respectively), and even so the use of the latter is minimal (5.9% and 7.1%, respectively). It seems that in this section, despite the similarity in travel time that the PT can offer with respect to the private vehicle, users always prefer the second of those. Meanwhile, centroid 7 has the highest concentration of jobs in the city (17%) and draws in a quarter of the HW trips in PT, thus in pairs 4 and 7, 2 and 7 and 1 and 7, despite the considerable time differences, PT use exceeds 35%.
Thus, it seems that the choice of mode of the EAP in housing section 7 and employment centroid 7 is determined by circumstances that have to do with the activities system of the city and not by the travel time. When doing a Pearson correlation analysis without considering these two delimitations, a −0.63 R coefficient is obtained with a 0.002 significance and a Spearman correlation of −0.60. This indicates an inexact relation between travel time difference and the use of PT, and rather a medium relation. Thus, there is a tendency that exhibits that more people could change to public transport if travel time by this mode were comparable with travel time by car, but not necessarily equal, since other PT benefits could compensate small travel time differences (e.g., no parking fees, no tolls or using travel time by bus for working or relaxing).
Regarding the perception of public transport service, observations indicate that 46.2% of users consider the PT service as regular, 22.6% think it has a good or of excellent quality, while 31.3% disagree, showing a bad or very bad perception. This is similar to the perception of public transport users in the city of Hermosillo, Sonora, a city comparable in terms of population and extension to Mexicali, and where 55% of the users consider the PT service as regular, 30% as excellent or good, and 15% as bad [
92]. On the other hand, the results contrast with Mexico City, where 67% of the users consider the PT as uncomfortable [
93] and despite this the percentage of trips in this modality is much higher. This represents an area of opportunity for Mexicali, since the perception is not as negative as in other cities of the country.
The first analysis with qualitative variables to determine if there is a relationship between the perception and the use of PT indicates a low association level, which could be due to the behavior of a specific group of the surveyed population. Therefore, each category was analyzed, and the one of excellent perception stands out. This category represents only 3.4% of the data, so it was grouped with the “good” category to get a new “positive perception” category. A new chi-square test was carried out, and results indicate an χ2 value of 2.87 and a critical one of 7.81. Thus, there was no significate evidence to reject the independence hypothesis and hence it is established that service perception does not influence PT ridership.
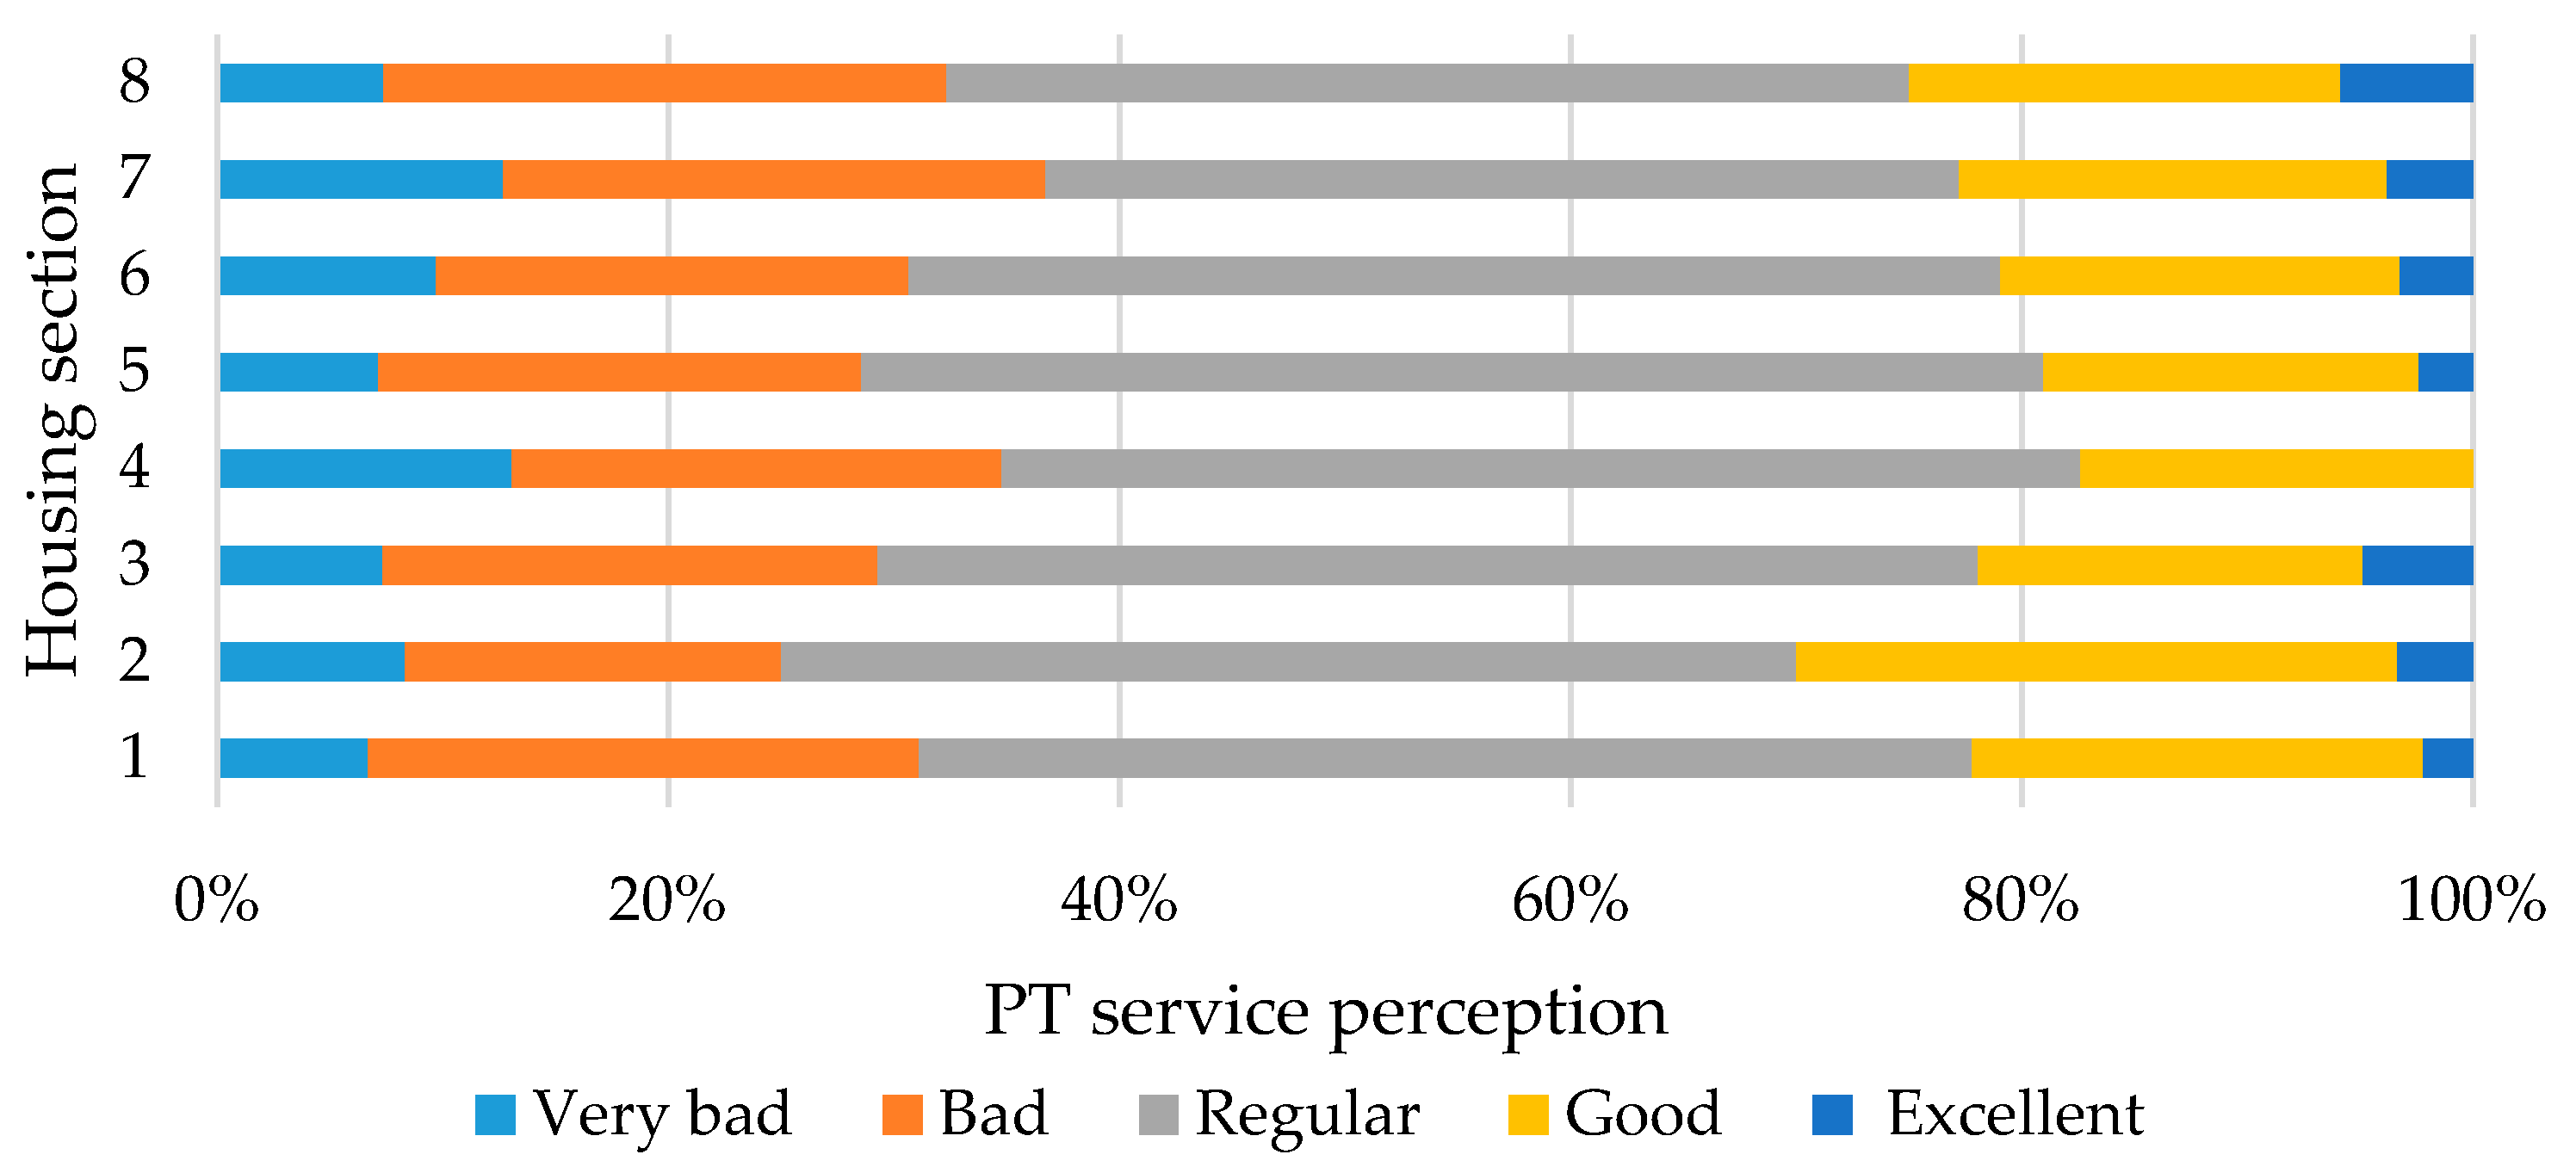
For the quantitative association analysis, the perception of each of the housing sections was considered. Results are similar in all sections, indicating the regular perception category as predominant in all cases (
Figure 6).
Perception is a subjective variable and individuals might have different expectations for each category of the analysis. Therefore, in order to better interpret the results, the perception was grouped into positive (good or excellent) and negative (bad or very bad).
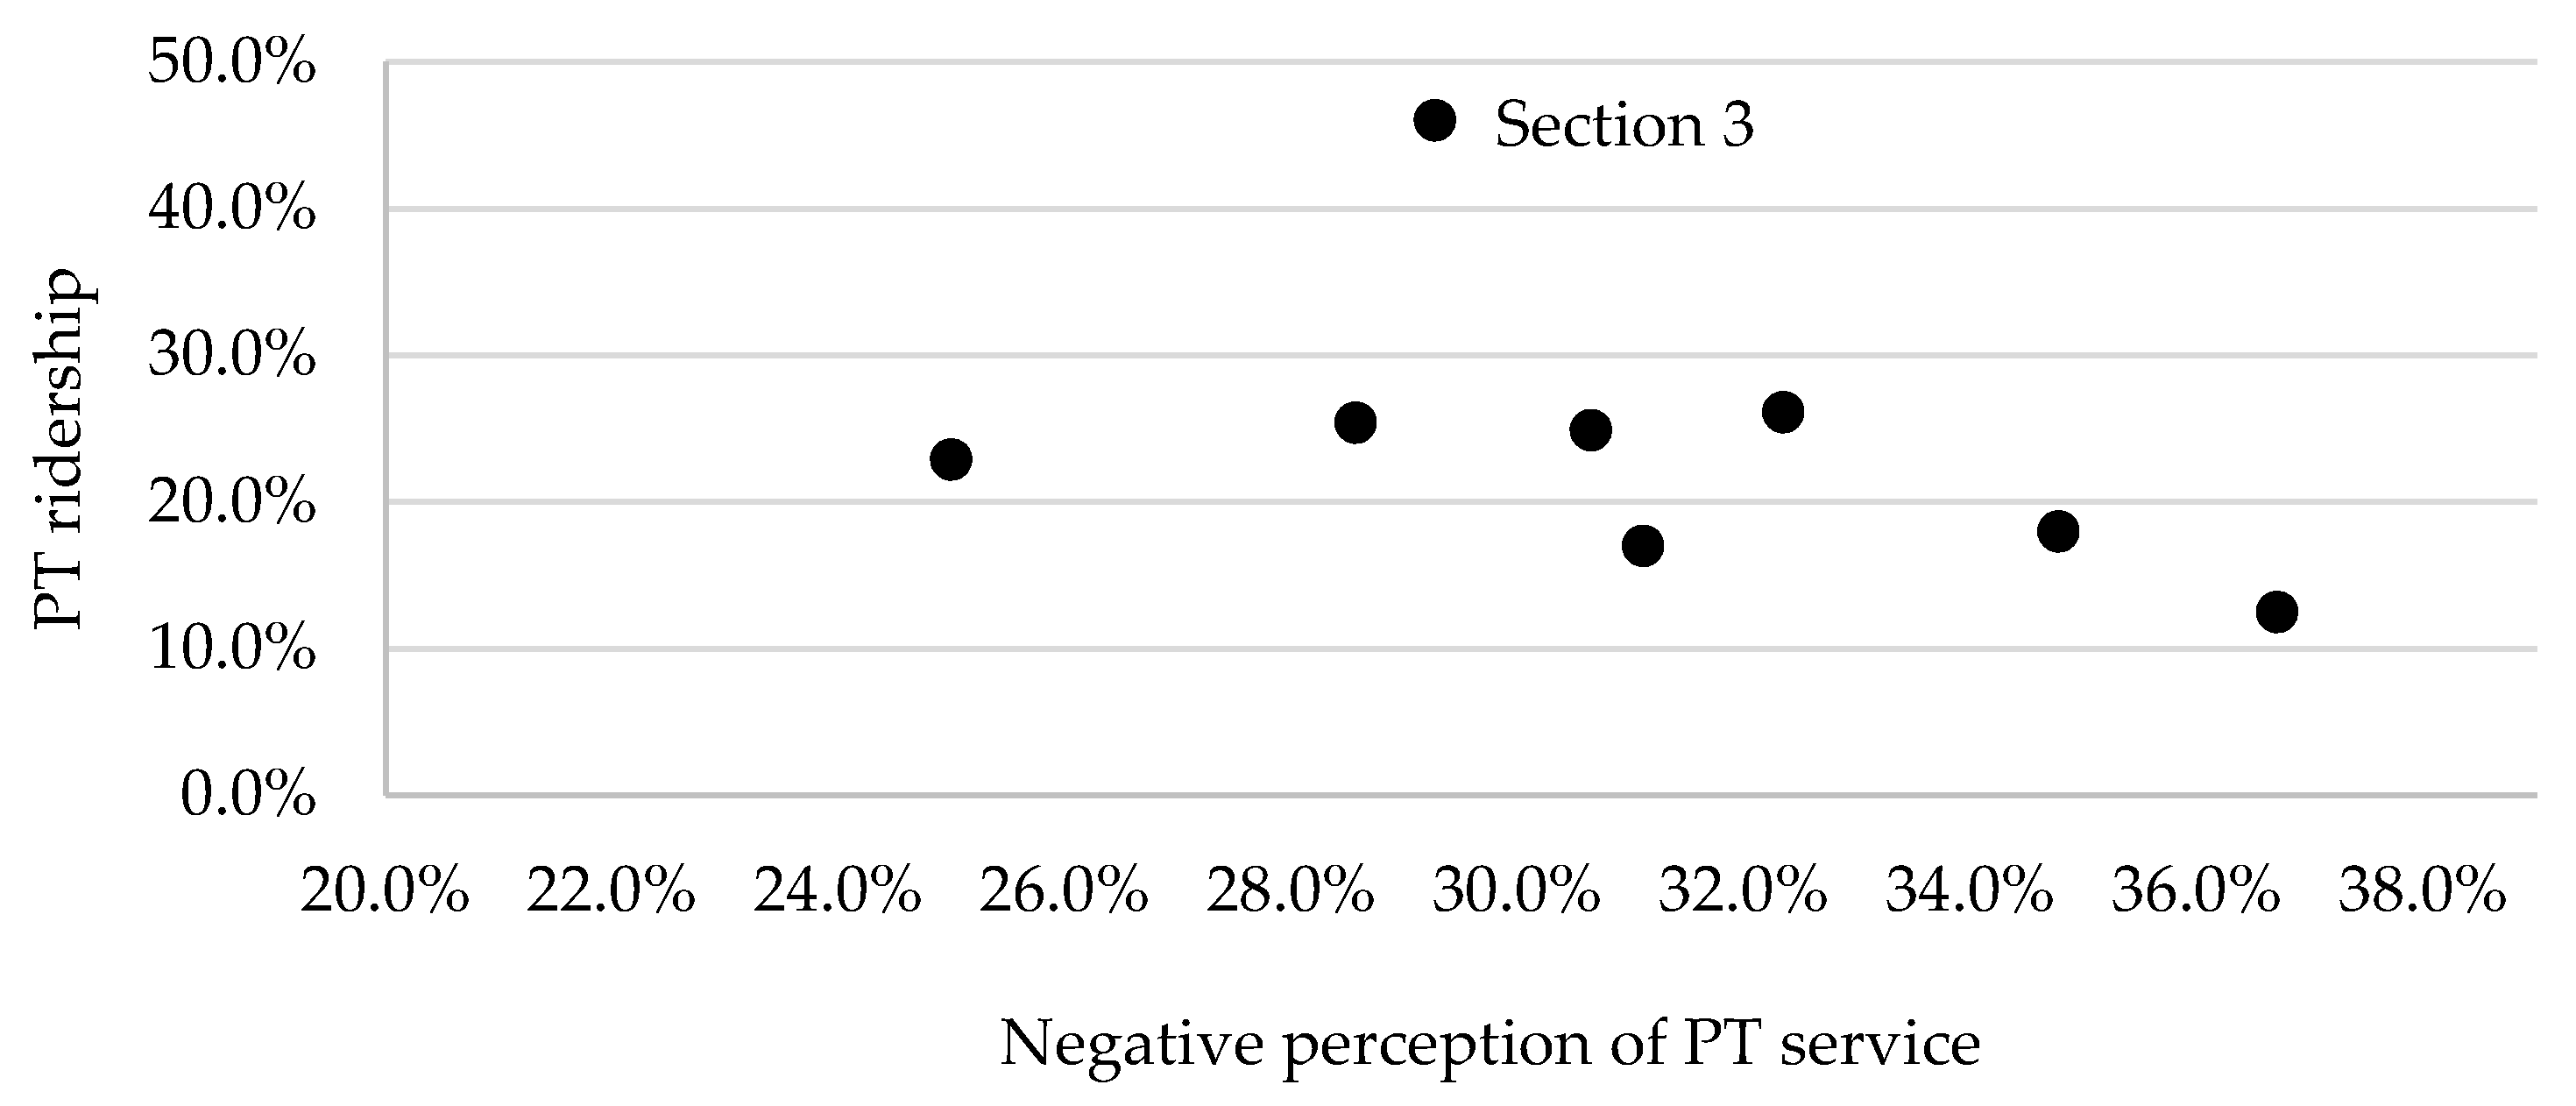
For the positive perception, it was not possible to reject the independence hypothesis and it is established that the positive perception of the PT service in Mexicali is not related to its level of use. In the meantime, for the negative perception, a Pearson correlation of −0.47 and a significance of 0.24 were obtained, so the analysis must be deepened. In this sense, the behavior of each section was analyzed, and it is appreciated that there exists a tendency and only section 3 is outside of it. In this section there is a high PT ridership, with more than 45%; this despite it having the lowest network density of all sections (49.7%) and it being the second in terms of showing excellent service perception (
Figure 7).
The particularity of section 3 can be explained by what is established by Thevathasan and Balachandran [
37], who suggest that the demographic characteristics of the PT users influence the evaluation they make of the service. As previously established, the population that resides in these areas has, in general terms, a limited capacity to purchase an automobile, so it is forced to use the PT service. Thus, section 3 has high PT ridership due to the socioeconomic characteristics of its population and not because of the mobility supply characteristics and the assessment they have of it.
In addition, the HW trips of section 3 represent less than 6% of the total city, so the correlation analysis was performed excluding this section of the calculation and a Pearson coefficient of −0.64 was obtained.
4.4. Activity System (A) Macro-Variable—PT Ridership
For the type of work analysis, four categories were defined: Industrial, commercial, services and government activities. From the total of the surveyed workers, the majority indicated that their job was in the industrial sector, with 42.5%. Subsequently, the most recurrent type of work was services with 24.2%. Commercial jobs represented 18.4% of the sample, and only 14.9% corresponded to the government sector.
A first analysis comparing PT ridership in each work type category detected that the “government” category represents barely 8.3% of the users, while the other three have very similar values near 23%. A chi-square analysis indicates that the PT use is independent of the industrial, commercial and service types of jobs. Thus, these three categories are grouped into a single non-government category and a new chi-square test is carried out, obtaining a 27.56 χ2 value, a 3.84 critical value, a P-value of 1.5 × 10⁻⁷, and a 0.13 Cramer coefficient. This allows establishing that “The proportion of PT users that work in a government sector is significantly lower than those who work in the industrial, commercial or service sector, however, among these three, the proportion of users is the same and does not depend on the type of work”.
On the other hand, for the qualitative association analysis, the variables of PT ridership and percentage of the types of work per employment centroid were compared (
Table 3). The results indicate that there is no relation between PT usage and the industrial and service types of work. For the commercial work type, it is appreciated that there is a positive relationship of medium magnitude. Finally, the government type of work exhibits a negative correlation confirming the results obtained in the chi-square test presented previously.
Regarding the population density variable, the city has an average of 40.8 hab/ha. The sections with the highest concentration of inhabitants are 4, 5 and 8, all with densities over 50 hab/ha. The first two are in the center-south part of the city, while the last one is in the east end. On the other hand, sections 1, 2, 6 and 7 represent more than 56% of the extension of the urban area of Mexicali and have average densities between 35 and 39 hab/ha. Finally, section 3, located in the west end of the city, has the lowest density, with less than 31 hab/ha.
The chi-square test between population density and PT ridership considers three categories: Low, medium and high. The results of the first calculation reject the independence hypothesis; nevertheless, the low category contributes 85% to this conclusion and corresponds only to section 3, which, as previously established, has unusual behavior.
A new analysis considering only the high and medium density categories was carried out. The results also showed evidence to reject the independence hypothesis, since the p-value is lower than 0.05 and the chi-square χ2 is 4.06, superior to the critical 3.84. On the other side, the measure of the dependency detected was barely 0.05 according to the Cramer coefficient, so it is not strictly a linear relationship; rather, it is a tendency. This is logical due to the nature of the phenomenon and since the analysis was done with aggregate population density data. Therefore, it is established that “except for specific cases, where the socioeconomic characteristics of the population determine the use of the PT, there exists a significantly positive tendency between the proportions of users of this system with the population density of the housing area of the workers”.
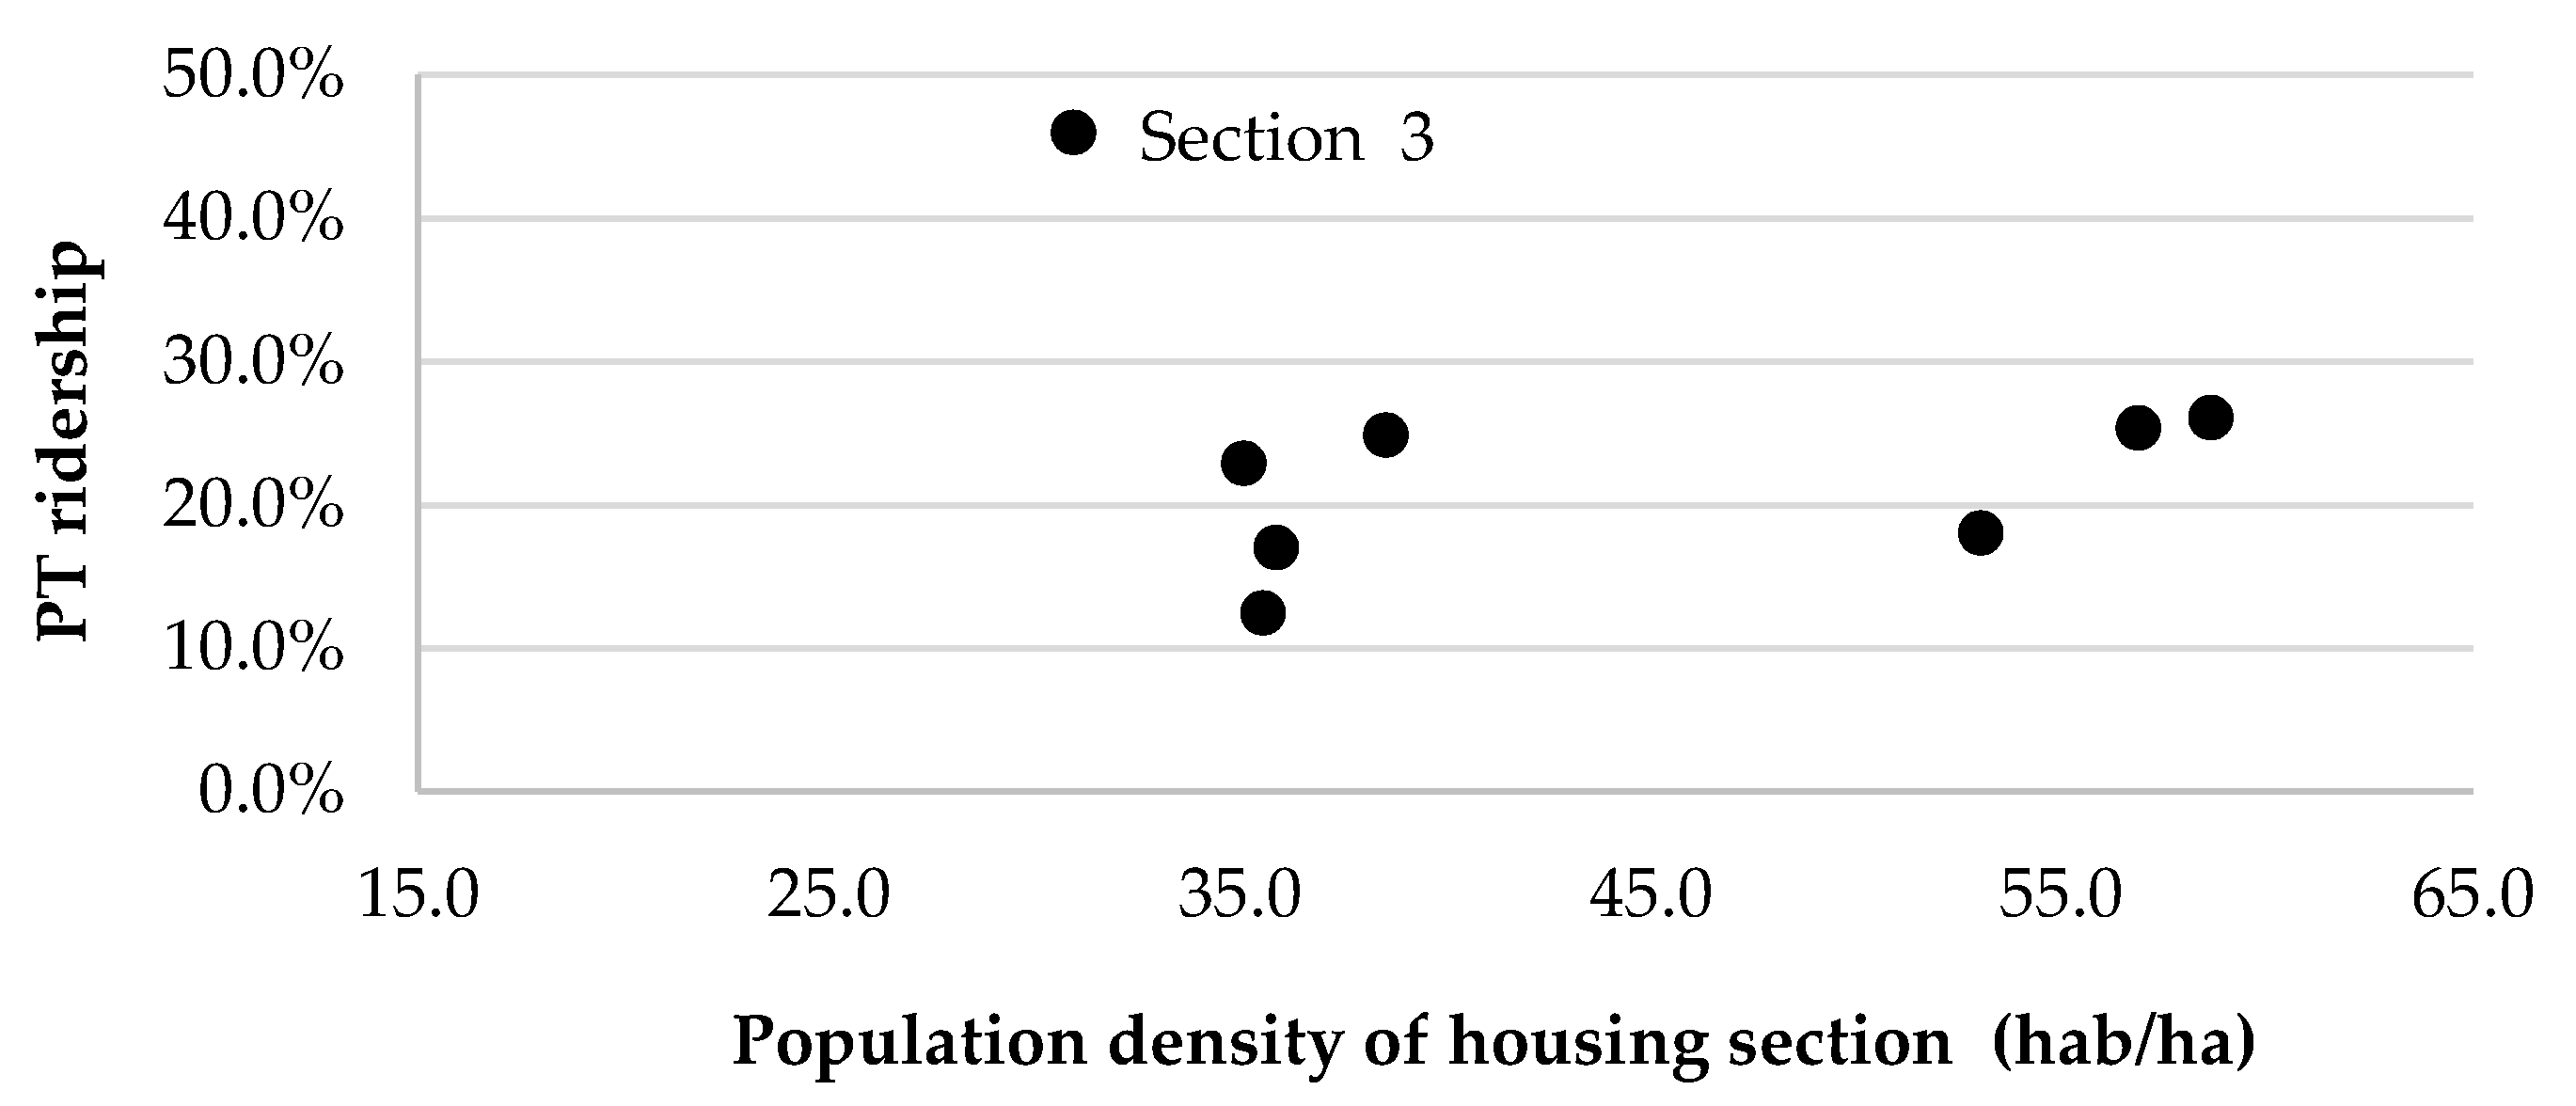
For the quantitative correlation analysis, the PT ridership of each housing area was contrasted with its population density.
Figure 8 shows that only section 3 is out of tendency. This phenomenon is in congruence with that established in the qualitative test, as well as in the study of the relationships of PT ridership among other variables such as network density and the service perception, where section 3 should have been excluded from the respective analyses due to its unusual behavior determined by the socioeconomic characteristics of its inhabitants. The correlation analysis without this section results in a Person coefficient of 0.51 and a Spearman correlation of 0.71.
5. Conclusions
This investigation delivers a method to analyze PT ridership in cities where it is significantly low and where no actualized information about mobility dynamics exists, a common scenario in small- and medium-size cities of developing economies. Therefore, the method is based on taking advantage of the existing information from previous studies, and in the selection of available indicators related to Manheim’s macro-variables to identify which of these has a greater influence on PT usage.
The method was applied in Mexicali using the available indicators: PT ridership; PT network density, bus stop coverage and average time headway between buses for the macro-variable transport system (T); difference in travel time between private vehicles and PT, and service perception of PT for the flow structure (F) macro-variable; and type of work and population density for the activity system (A) macro-variable. The results provide information that helps to understand the causes of the low PT ridership in the city and also have implications for the sustainable urban mobility planning of the city.
It was found that currently the spatial coverage provided by Mexicali´s PT system has a low incidence in demand, since in both network density and bus stop coverage analyses a direct relation was not found with PT ridership. Instead, a slight tendency to more users was detected when the coverage improves; however, there are also areas that, despite having poor spatial coverage, show greater use of the system, specifically section 3.
As in the case of many public transport systems worldwide, however, physical availability does not necessarily equate to use [
3]. Thus, even if the population of Mexicali has access to the PT service trough coverage, it does not mean greater attraction of users. This may be because of the existence of a gap between the destinations of the routes and the destinations required by the population of different zones of the city. Therefore, the origins and destinations of daily travelers should be analyzed and contrasted with the route paths to align them.
Meanwhile, it seems the average time headway of the PT service currently has no relation with the use of the system. However, it was found that random and continuous stops made by public transport operators to get more passengers have made it so that currently the PT system has very unstable headway times in all the routes. In that sense, the average values used in this analysis reflect only the general situation. Thus, a particular analysis of the variation of frequencies by area of the city is recommended for future research. However, the analysis in this research represents a first effort to understand this bus headway problem in Mexicali´s PT system and allows identifying that, regardless of the instability, the headway times are considerably high in the whole system. This is undoubtedly a deficiency of the system that must be addressed promptly, and most likely contributes to increasing users.
The indicators associated with the flow structure (F) macro-variable exhibit a certain level of incidence with the use of the public transport system. On the one hand, the general and the positive perception of the service show no relation with PT ridership, while the negative perception does show a correlation that can be considered a medium one. The fact of only having found a relationship between the negative perception of the service and the use of PT indicates that a decrease in the quality offered will cause a reduction in users. However, since this relationship does not appear in the opposite direction, although the service can be improved comprehensively, that does not mean that the market share in this mode will increase. On the other hand, a medium relation and a tendency were identified for more PT users when the difference in travel time between this mode and the car decreases. This means that, for people considering using PT, it is not necessarily the travel time of this mode that has to be equal to the one by car, but it has to be similar or comparable. That is because small differences in travel time could be compensated with other benefits of PT, such as not having to find a parking spot or pay for one, or taking advantage of the travel time by bus to do other things like work or relax.
The previous results on the relationship between travel time and perception with PT usage suggest a coincidence with Redman et al. [
17], who indicate that, to attract car users, it is not enough to improve PT system characteristics. The new conditions must be comparable with the ones that can be provided by cars. In that sense, as Leo et al. [
7] recommend, the mobility strategies that are designed should include measures to discourage the use of private cars, such as parking fees, mandatory insurance and an adequate collection of taxes for vehicle possession.
Regarding the activity system (A) macro-variable, it was found that the proportion of PT users that work in a government sector is significantly lower than those who work in the industrial, commercial or service sector; however, among these three the proportion of users is the same. Meanwhile, population density reflects a strong relationship with PT ridership in Mexicali, so mobility dynamics of the city coincide with studies that suggest that the dispersed structures do not favor mobility when the residence place has not been chosen based on the workplace [
13,
79], as has happened in recent years in Mexicali, where the real state sector has determined the disorderly urban growth [
46]. Regarding this, the United Nations Environment Program [
94] points out that compact cities use automobiles less, and Medina and Veloz [
8] establish that the implementation of mass transit systems is unfeasible in cities with densities under 100 hab/ha, so the dispersed structure of Mexicali, with a density of 40 hab/ha, seems to condition PT demand. Thus, the activities system (A) macro-variable is the one that has a major influence on the current PT ridership in Mexicali, the flow pattern (F) macro-variable has a medium influence and the transport system (T) macro-variable has a lower incidence.
A major influence of the activities system (A) macro-variable shows a gap between urban development and transport in Mexicali since, as in many Mexican cities, the planning and decision-making related to these two aspects is carried out by personnel who are distributed in different government offices, and there is no efficient communication between them [
95]. This is reflected in the transport and urban development master plans of the city. On the one hand, in the 2011 Master Plan of Roads and Transportation of Mexicali B.C. [
10], projects and strategies are established; however, to define these, indicators that have to do with the activities system (A) of the city are not considered. On the other hand, in the 2025 Program of Urban Development of the Population Center of Mexicali B.C. [
11], the mobility and transport system are barely mentioned. Therefore, it is necessary to integrate urban planning (activity system), with mobility and transport, in order to promote a change in the urban and mobility planning process, from the traditional reactive process towards a proactive and holistic approach.
The analysis based on territorial delimitations also allowed to identify particularities in the case study. On the one hand, two areas of opportunity were identified: (1) In the northeast of the city, specifically in section 1, the network density is low and the differences in travel time exceed, in most of the cases, 25 min; (2) to improve the connectivity and travel time between zone 1, 2 and 4 with centroid 7 would benefit a large number of users, since the latter draws in a high quantity of trips; however, the travel time differences between PT and private car are considerable. Moreover, it is concluded that section 3, located in the west end of Mexicali, deserves a special analysis since it seems that, in this section, the socioeconomic characteristics of the population conditions the transport mode choice, regardless of the supply.
In order to deeply understand the transportation phenomena in a specific urban area, the literature suggests to carry out disaggregated and detailed analyses. Nevertheless, in Mexicali and various Global South cities, obtaining update transportation data is a difficult task, since there are no official agencies that regulate the gathering of this type of dynamic information. Therefore, it is challenging to generate analyses with a higher level of detail. Undoubtedly, the lack of an exhaustive and constantly updated database is a limitation that affected the spatial delimitation process in this study. Therefore, for future research about Mexicali’s transport system and mobility, it is recommended to carry out specific data collection that allows a more disaggregated spatial delimitation.
Finally, since the proposed methodology to understand PT ridership is based on the use of available data, it simplifies the analysis processes. This could enable various Global South cities to have evidence that allows them to promote policies for sustainable urban mobility, specifically for increasing public transport demand. While the proposal does not consider complex analysis with numerous variables, its application in the case study shows that, in an urban mobility context with such obvious and drastic problems as the modal split in Mexicali, it allows one to understand the causes of the problem in a general way and identify opportunity areas. As mentioned earlier, in various Mexican cities, the few personnel related to urban mobility planning are dispersed in various government offices and have little impact on decisions, which are often carried out centrally by non-specialists. The methodological proposal of this research is an alternative that adapts bettr to these scenarios; since it is based on simple analyses, the results are easily interpreted, even by non-specialists, so conclusions obtained can be considered by those who make decisions about mobility and transport in this type of city. In that sense, the results of this research show information about the variables that have a major influence on Mexicali’s PT ridership, and it is expected that these will help as a guide in the planning exercises of the mobility and transport of the city.


 ,
, 


