Assessing Neighborhood Satisfaction and Social Capital in a Multi-Cultural Setting of an Abu Dhabi Neighborhood


Abstract
1. Introduction
2. Open Space in Abu Dhabi
3. Benefits of Public Open Space
3.1. Physical Activity and Public Health
3.2. Neighborhood Satisfaction
3.3. Social Capital
3.4. Accessibility to Open Space
4. Method
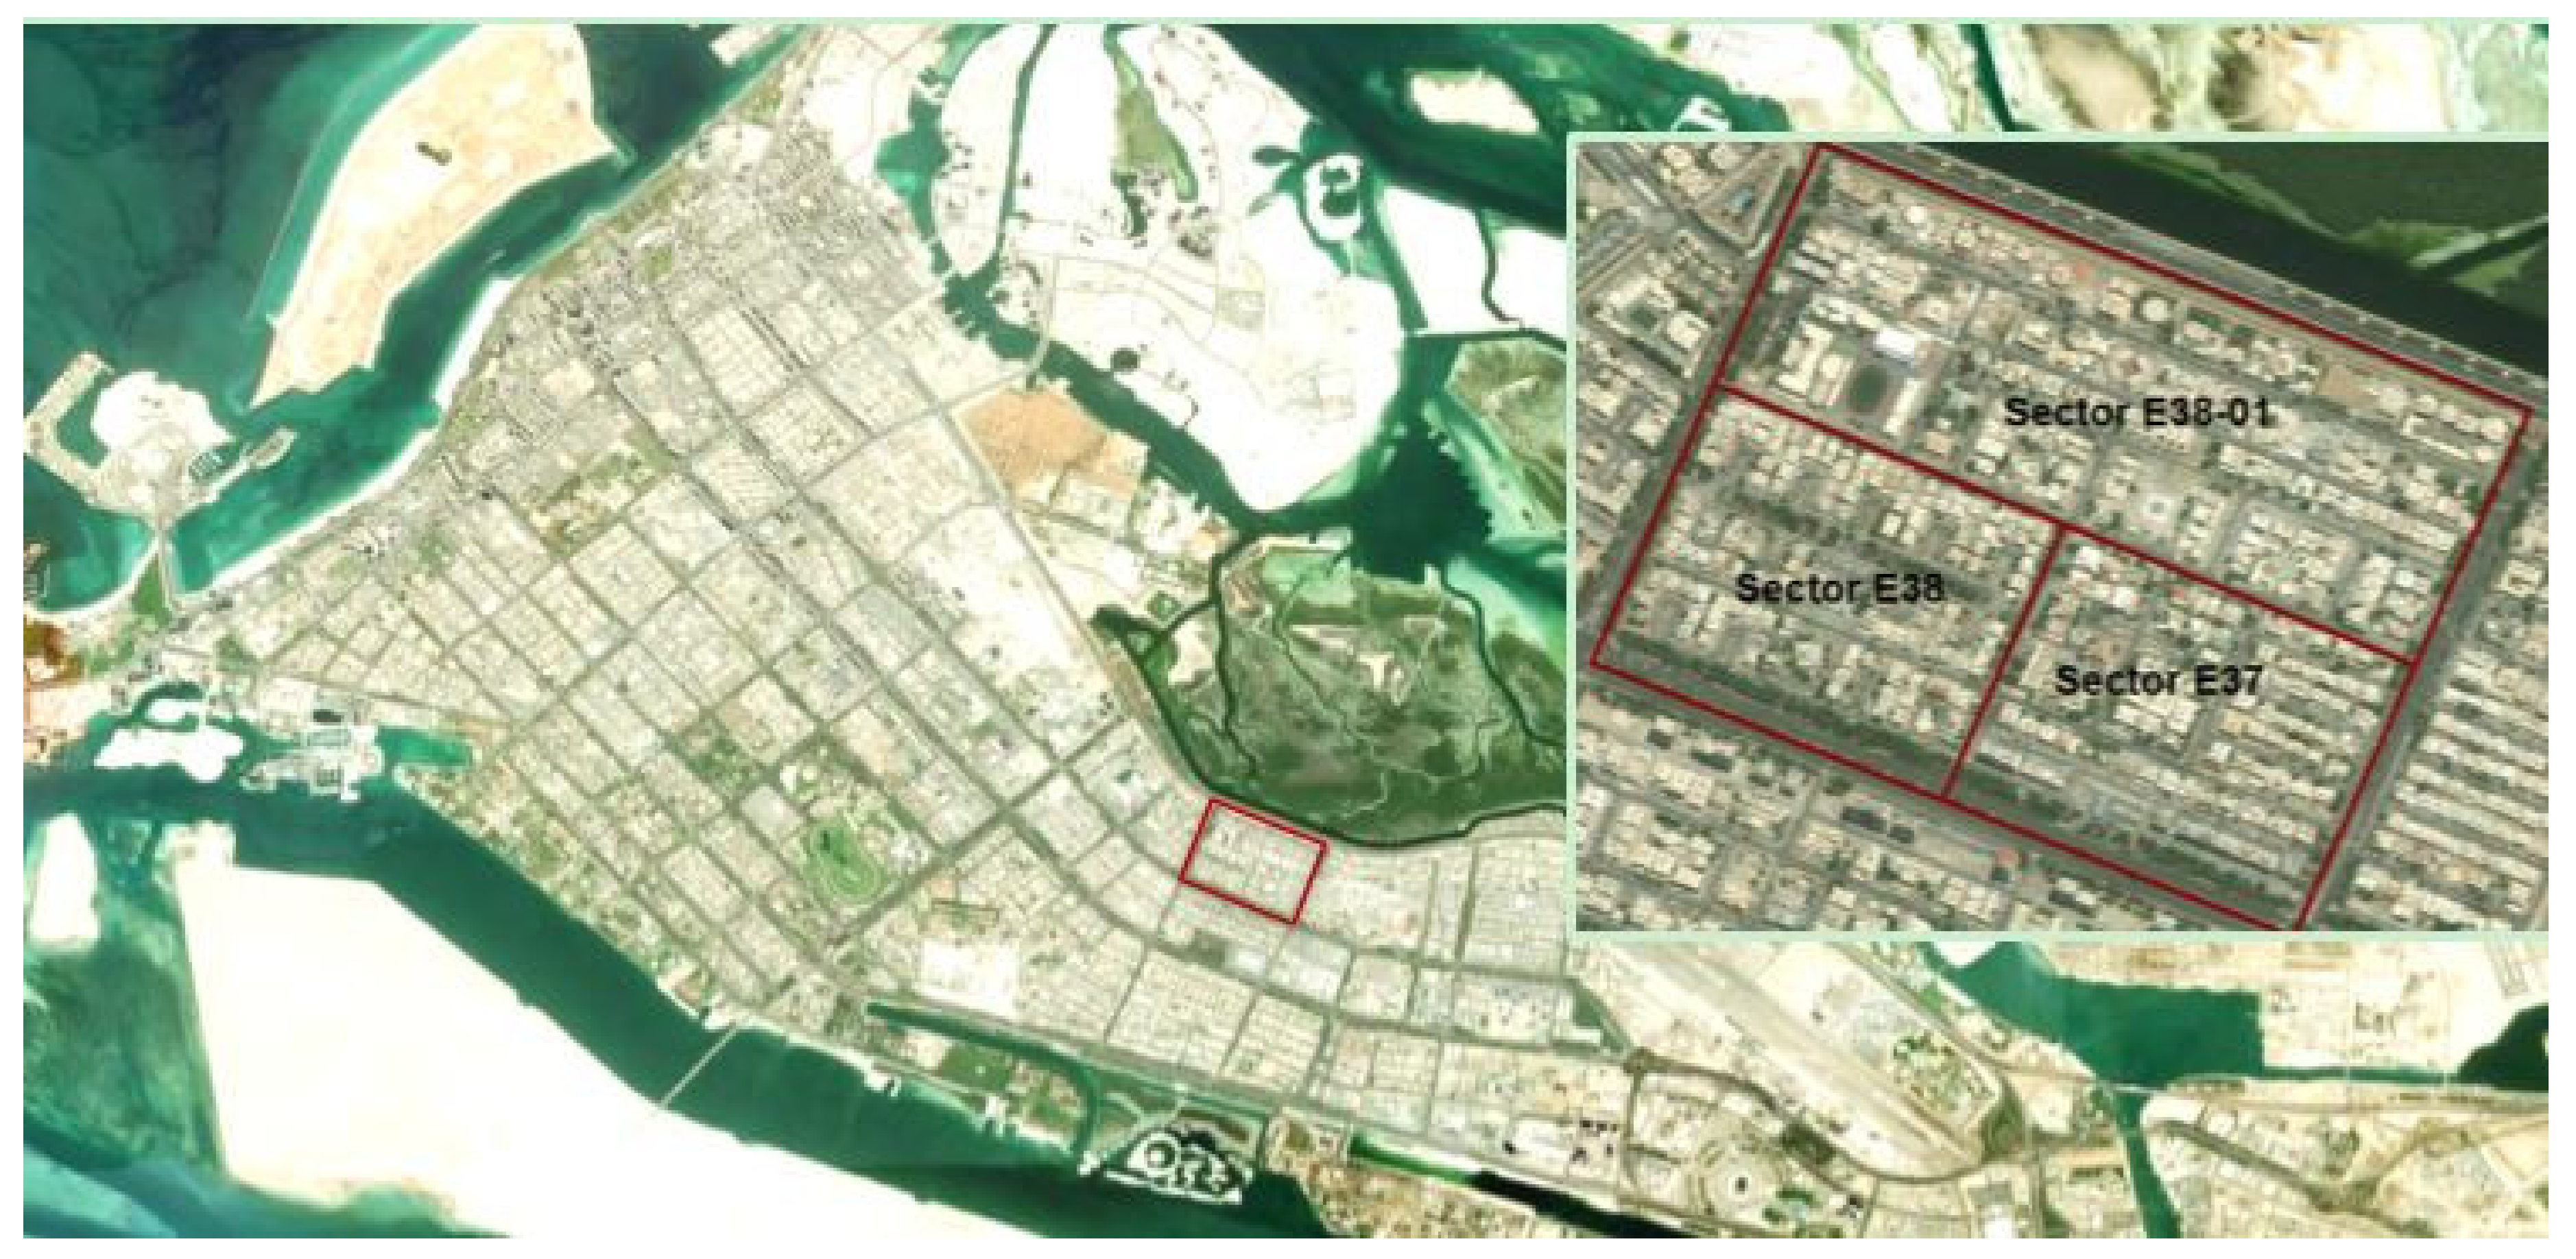
4.1. Study Area
4.2. Survey Content and Administration
4.3. Statistical Analyses
5. Results and Discussion
5.1. Respondents Characteristics
5.2. Principle Component Analysis
5.3. Regression Analysis
5.3.1. Predicting Neighborhood Satisfaction
5.3.2. Predicting Social Capital
5.4. Analyzing Neighborhood Surroundings: Spatial Analysis and Environmental Audit
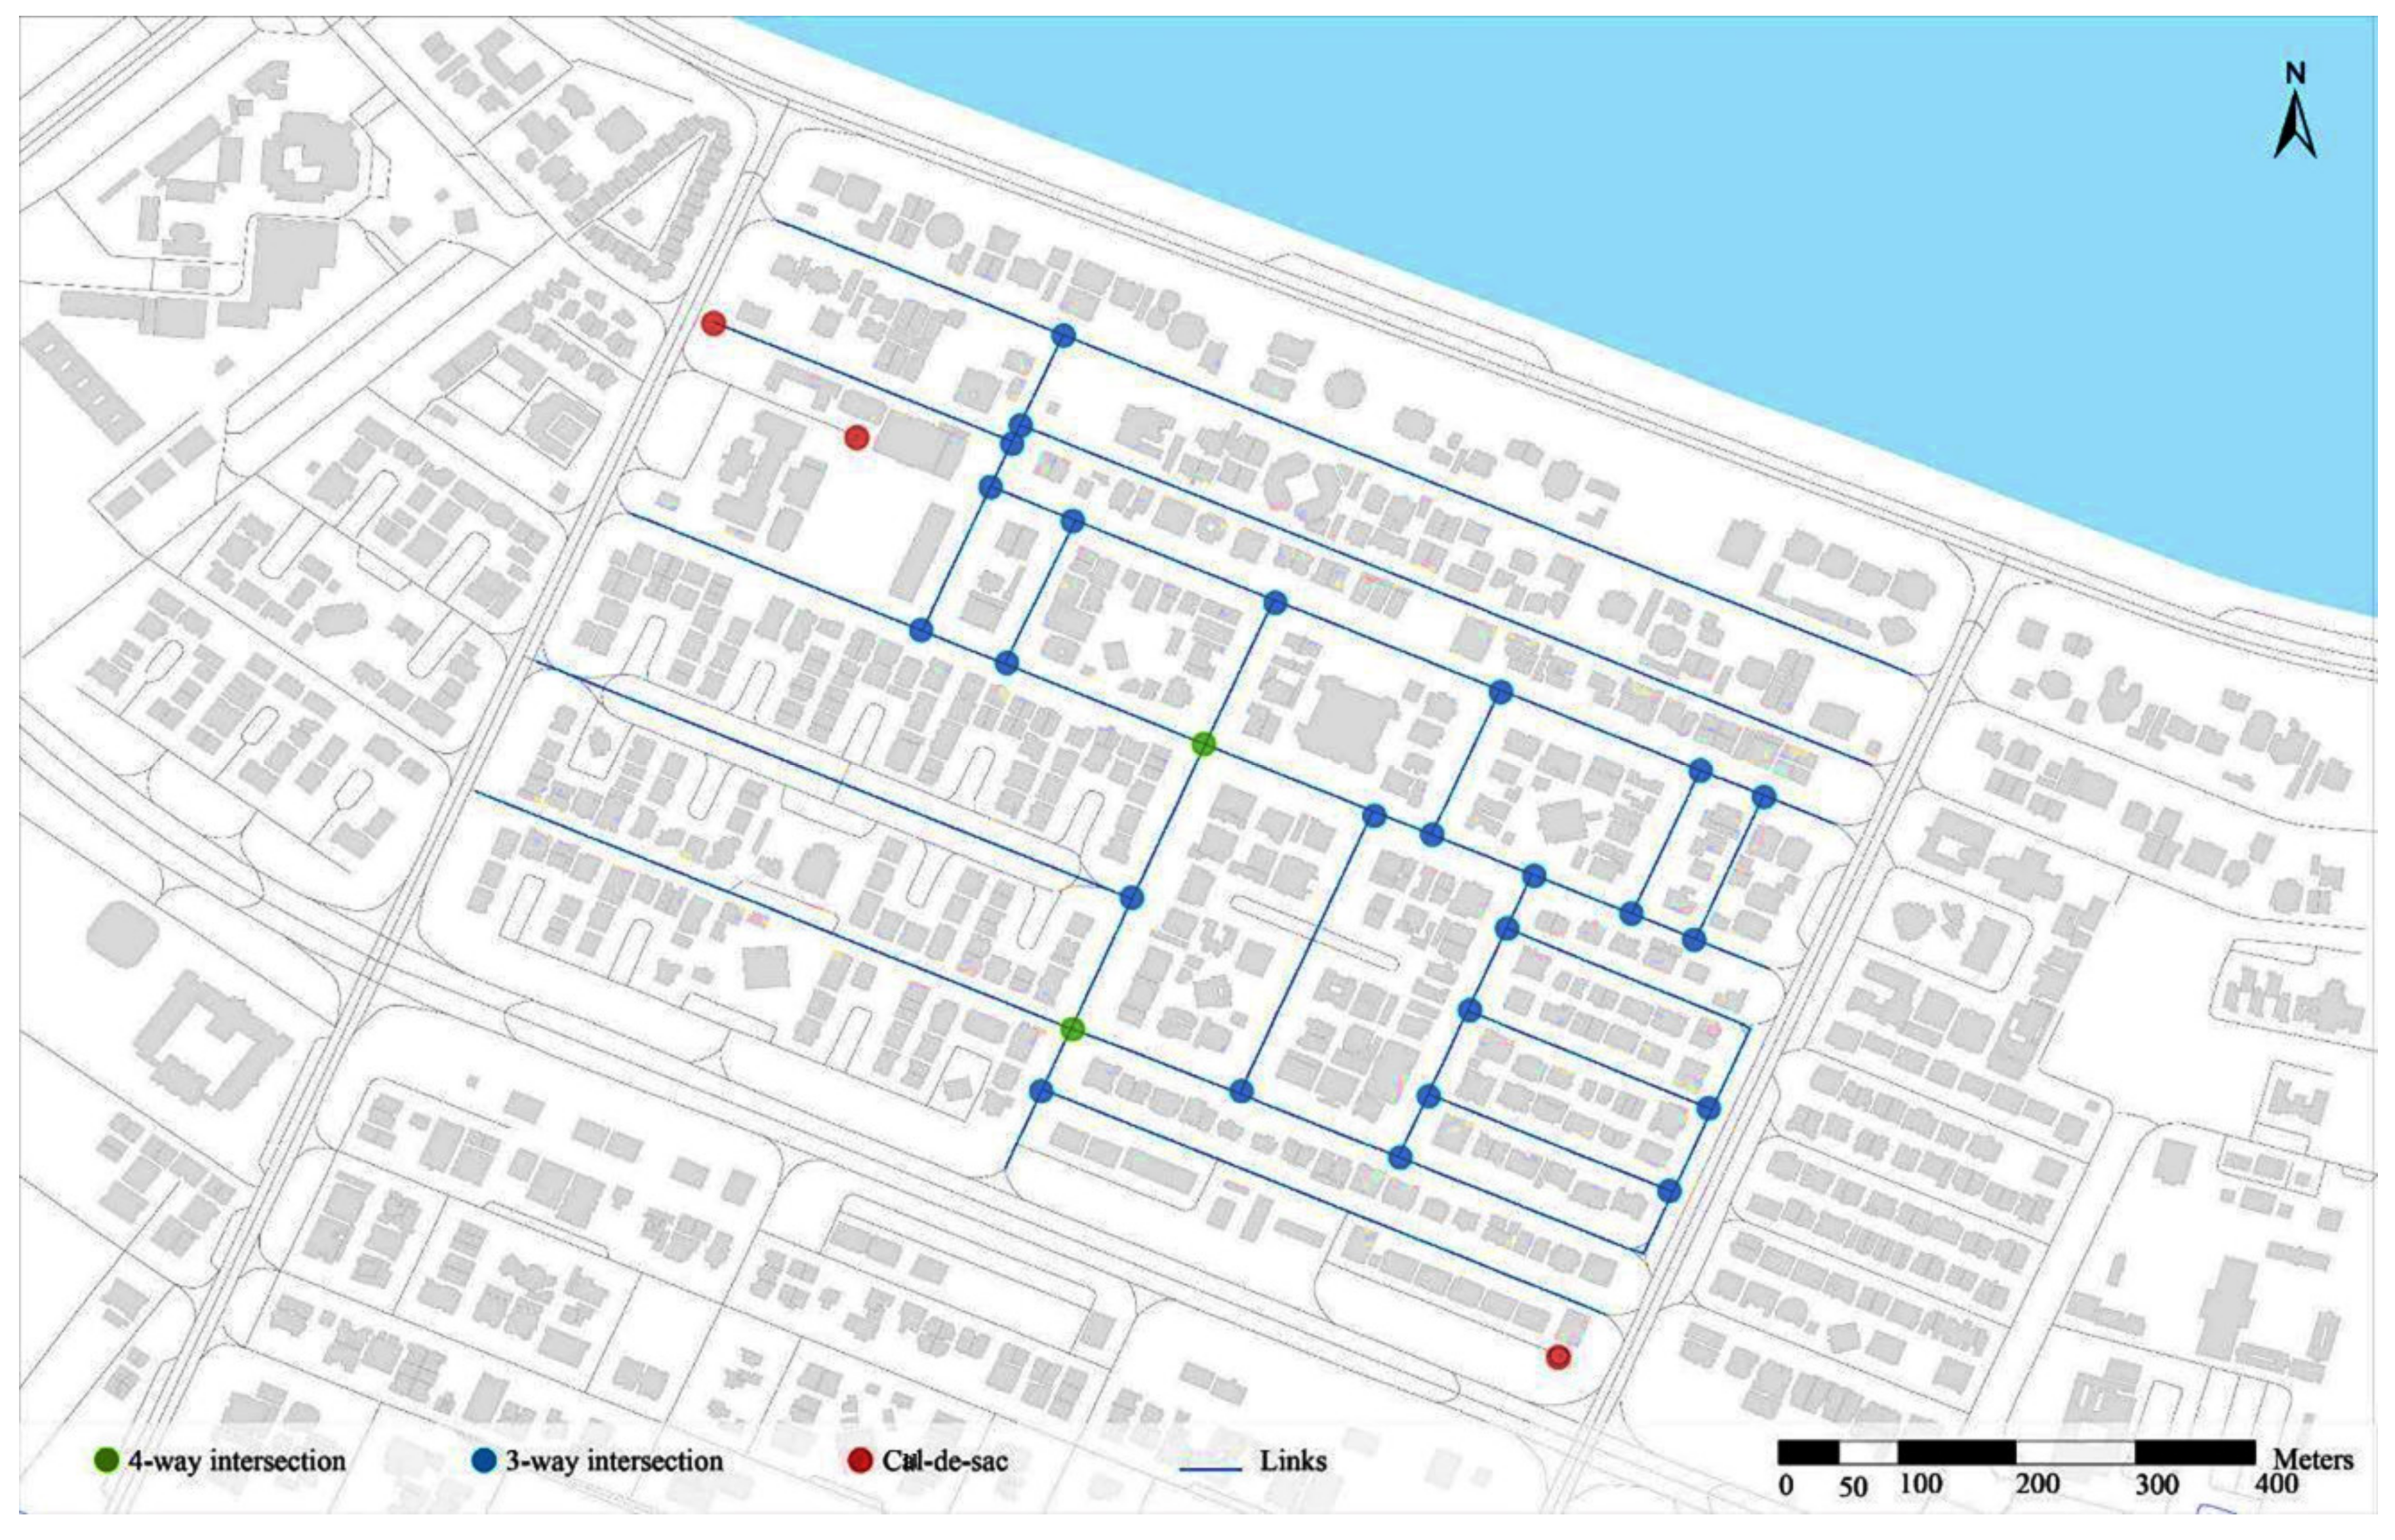
5.4.1. Spatial Assessment
Land-Use Mix
Connectivity
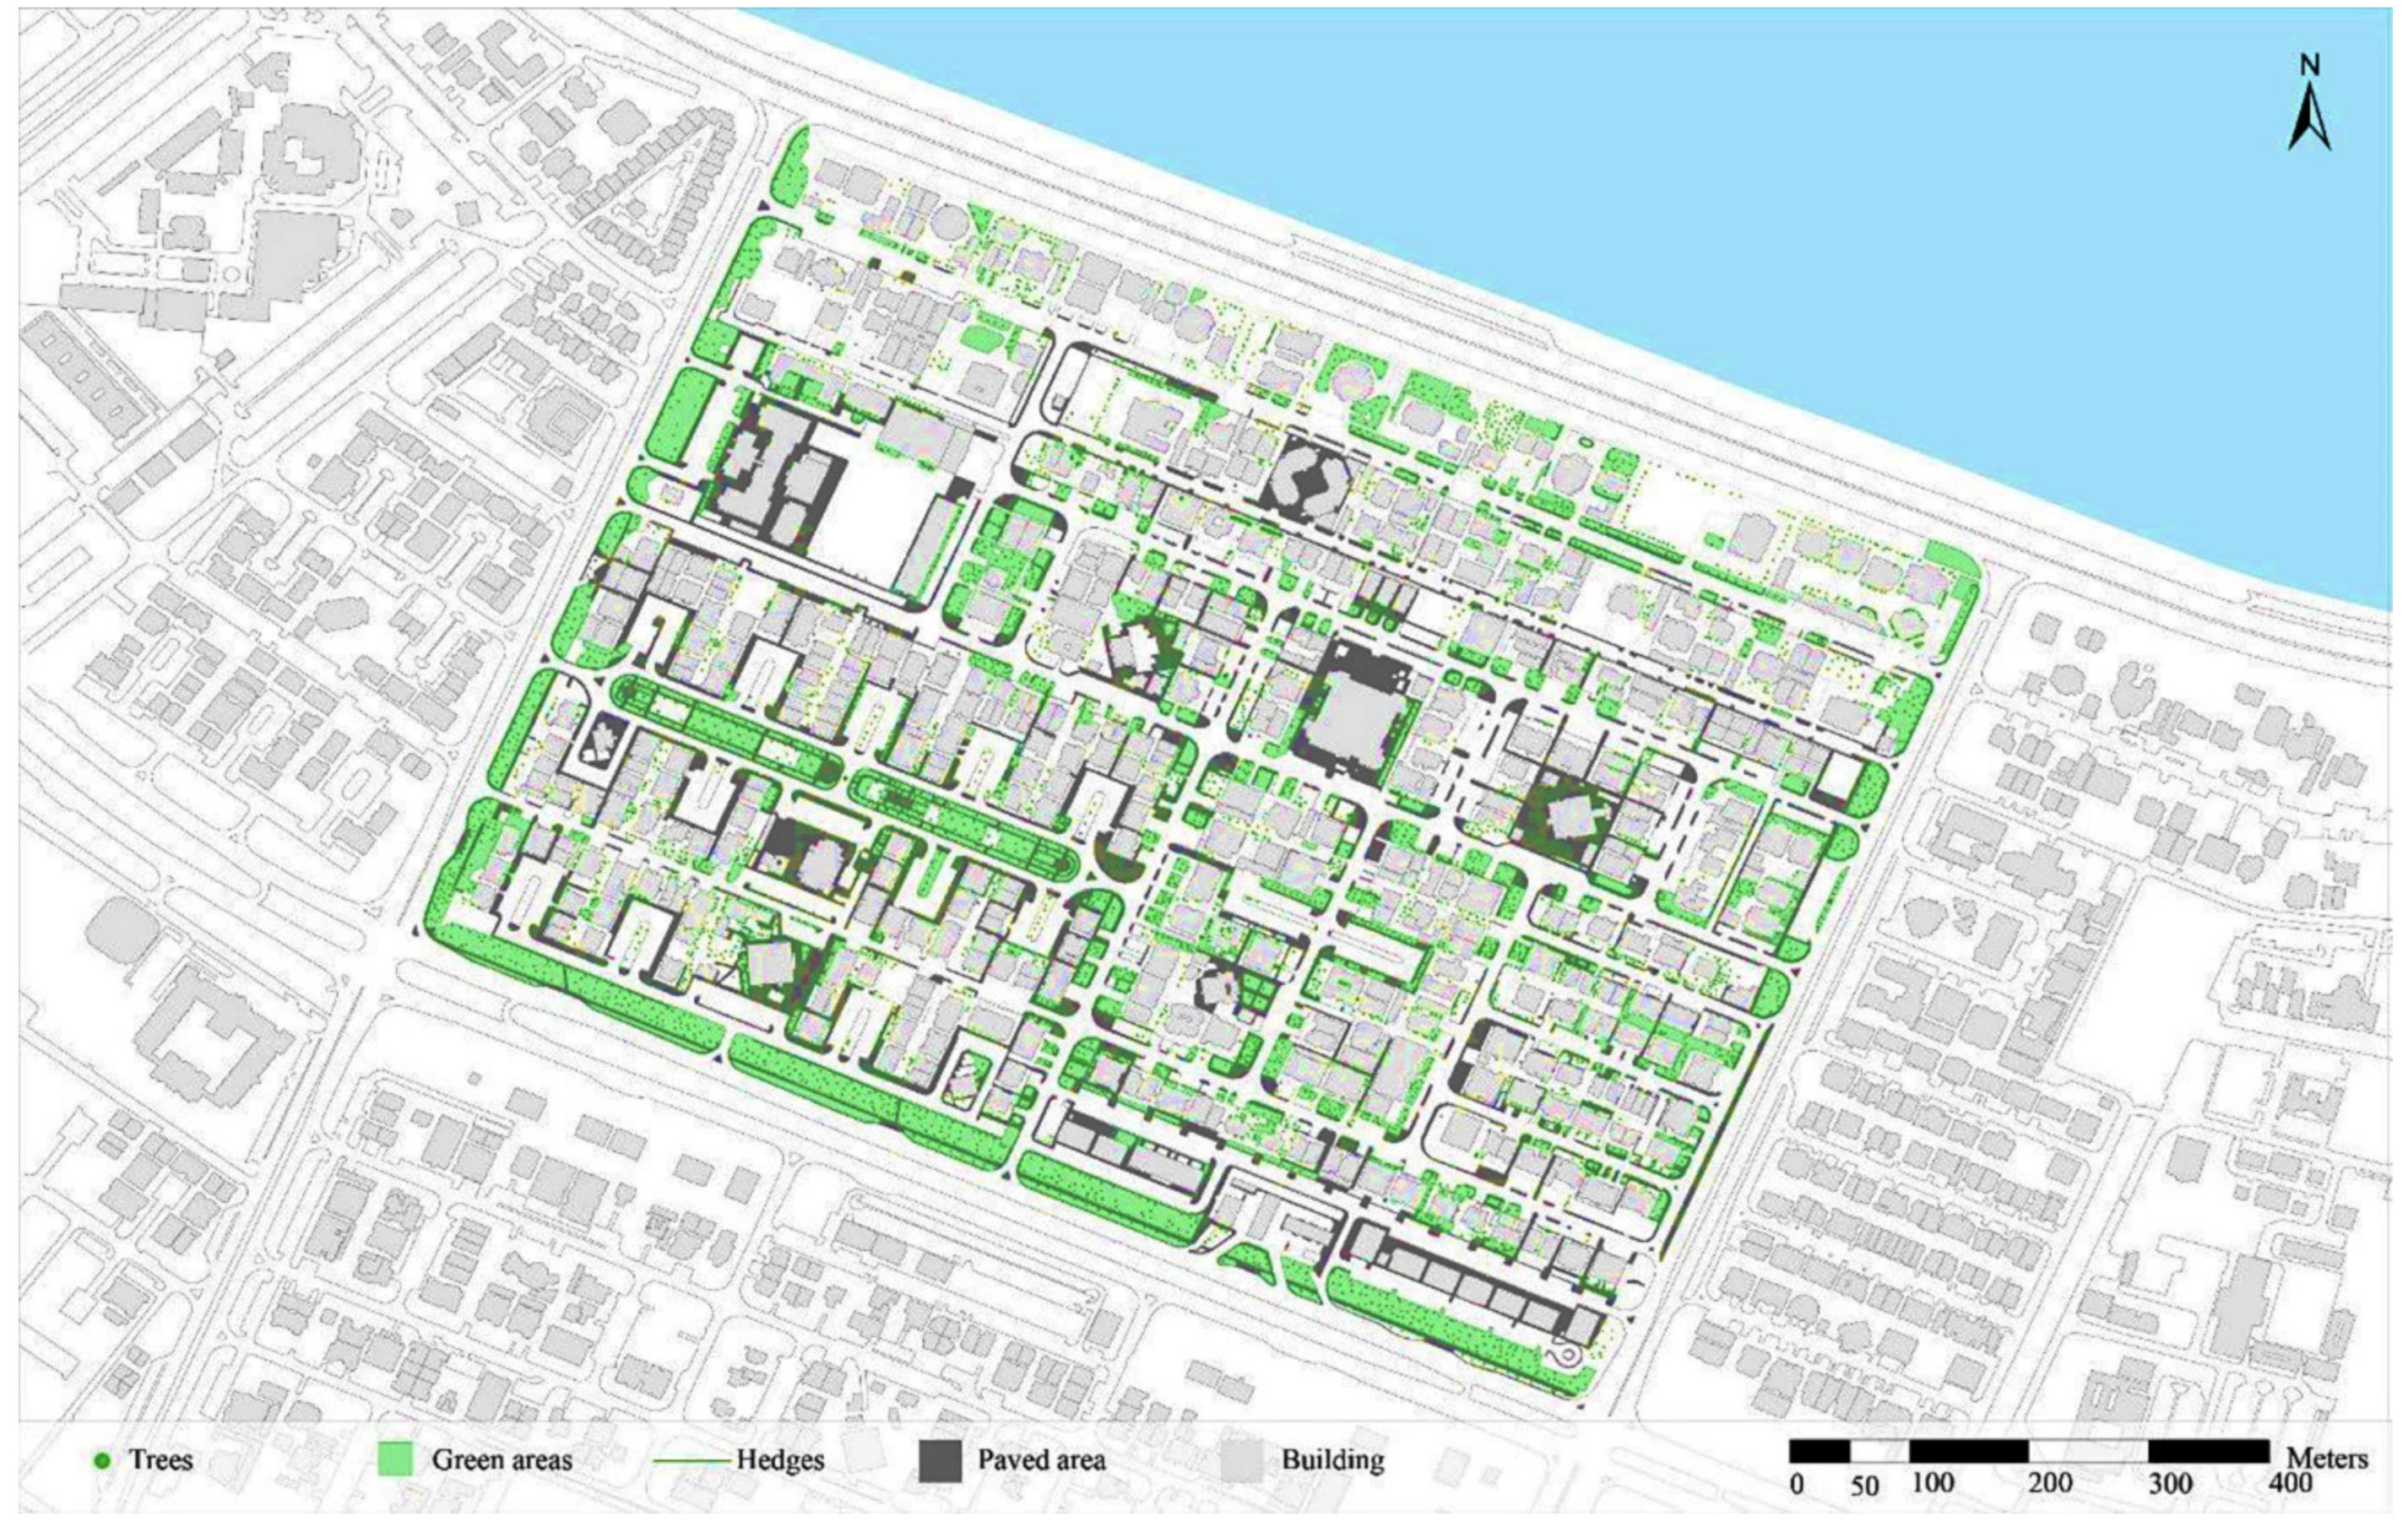
Open Space
5.4.2. Audit Tool Assessment
Land Use
Transportation
Facilities
Aesthetics
Signage
Social Environment
6. Conclusions
Author Contributions
Funding
Acknowledgments
Conflicts of Interest
References
- Sherer, P.M. Why America needs more city parks and open space. 2003. Available online: http://www.eastshorepark.org/benefits_of_parks%20tpl.pdf (accessed on 15 January 2020).
- York Cornwell, E.; Behler, R.L. Urbanism, neighborhood context, and social networks. City Community 2015, 14, 311–335. [Google Scholar] [CrossRef]
- Mitchell, C.U.; LaGory, M. Social capital and mental distress in an impoverished community. City Community 2002, 1, 199–222. [Google Scholar] [CrossRef]
- Koohsari, M.J.; Mavoa, S.; Villanueva, K.; Sugiyama, T.; Badland, H.; Kaczynski, A.T.; Owen, N.; Giles-Corti, B. Public open space, physical activity, urban design and public health: Concepts, methods and research agenda. Health Place 2015, 33, 75–82. [Google Scholar] [CrossRef]
- Trepci, E.; Maghelal, P.; Azar, E. Effect of densification and compactness on urban building energy consumption: Case of a Transit-Oriented Development in Dallas, TX. Sustain. Cities Soc. 2020, 56, 101987. [Google Scholar] [CrossRef]
- Francis, M. Urban Open Space: Designing for User Needs; Island Press: Washington, DC, USA, 2003. [Google Scholar]
- Burrows, E.; O’Mahony, M.; Geraghty, D. How urban parks offer opportunities for physical activity in Dublin, Ireland. Int. J. Environ. Res. Public Health 2018, 15, 815. [Google Scholar] [CrossRef]
- Pimenta, A.; Maghelal, P.; Alawadi, K. Are Transit-Oriented Developments Effective Neighborhood Design Models to Help Meet the Recommended Weekly Physical Activity Levels? Case of Abu Dhabi. Int. J. Sustain. Transp. (forthcoming).
- Maghelal, P.; Natesan, P.; Naderi, J.R.; Kweon, B.S. Investigating the use of virtual reality for pedestrian environments. J. Archit. Plan. Res. 2011, 28, 104–117. [Google Scholar]
- Song, C.; Ikei, H.; Igarashi, M.; Takagaki, M.; Miyazaki, Y. Physiological and psychological effects of a walk in urban parks in fall. Int. J. Environ. Res. Public Health 2015, 12, 14216–14228. [Google Scholar] [CrossRef] [PubMed]
- Phaneuf, D.J.; Smith, V.K.; Palmquist, R.B.; Pope, J.C. Integrating property value and local recreation models to value ecosystem services in urban watersheds. Land Econ. 2008, 84, 361–381. [Google Scholar] [CrossRef]
- Shaw, R.J.; Čukić, I.; Deary, I.J.; Gale, C.R.; Chastin, S.F.; Dall, P.M.; Dontje, M.L.; Skelton, D.A.; Macdonald, L.; Der, G. The influence of neighbourhoods and the social environment on sedentary behaviour in older adults in three prospective cohorts. Int. J. Environ. Res. Public Health 2017, 14, 557. [Google Scholar] [CrossRef] [PubMed]
- Statistical Yearbook of Abu Dhabi 2017. Statistical Center of Abu Dhabi. 2017. Available online: https://www.scad.gov.ae/en/pages/generalpublications.aspx?releaseid=973&publicationid=79&topicid= (accessed on 15 January 2020).
- Abu Dhabi Plan 2030. Charrette One Proceeding Book Final. 2013. Available online: https://www.ecouncil.ae/PublicationsEn/plan-abu-dhabi-full-version-EN.pdf (accessed on 15 January 2020).
- Almardood, M.; Maghelal, P. Enhancing the use of transit in arid regions: Case of Abu Dhabi. Int. J. Sustain. Transp. 2020, 14, 375–388. [Google Scholar] [CrossRef]
- Alawadi, K.; Benkraouda, O. What happened to Abu Dhabi’s urbanism? The question of regional integration. J. Urban Des. 2018, 23, 367–394. [Google Scholar] [CrossRef]
- Scoppa, M.; Bawazir, K.; Alawadi, K. Walking the superblocks: Street layout efficiency and the sikkak system in Abu Dhabi. Sustain. Cities Soc. 2018, 38, 359–369. [Google Scholar] [CrossRef]
- Scoppa, M.; Bawazir, K.; Alawadi, K. Straddling boundaries in superblock cities. Assessing local and global network connectivity using cases from Abu Dhabi, UAE. Transp. Res. Part A Policy Pract. 2019, 130, 770–782. [Google Scholar] [CrossRef]
- Sugiyama, T.; Leslie, E.; Giles-Corti, B.; Owen, N. Associations of neighbourhood greenness with physical and mental health: Do walking, social coherence and local social interaction explain the relationships? J. Epidemiol. Community Health 2008, 62, e9. [Google Scholar] [CrossRef]
- Sung, H.; Lim, J.; Mun, J.; Kim, Y. Objective versus Self-Reported Physical Activity and Cardiovascular Disease Risk Factors. Korean J. Sports Med. 2020, 38, 28–36. [Google Scholar] [CrossRef]
- Godbey, G.C.; Mowen, A.J. The Role of Parks and Recreation in Promoting Physical Activity and Health. Franklin County Healthier Communities Through Active Living Summit. Kauffman Station PA: Chambersburg, PA, USA, 2003. [Google Scholar]
- Van Dyck, D.; Cardon, G.; Deforche, B.; Giles-Corti, B.; Sallis, J.F.; Owen, N.; De Bourdeaudhuij, I. Environmental and psychosocial correlates of accelerometer-assessed and self-reported physical activity in Belgian adults. Int. J. Behav. Med. 2011, 18, 235–245. [Google Scholar] [CrossRef]
- Hur, M.; Nasar, J.L. Physical upkeep, perceived upkeep, fear of crime and neighborhood satisfaction. J. Environ. Psychol. 2014, 38, 186–194. [Google Scholar] [CrossRef]
- Leslie, E.; Saelens, B.; Frank, L.; Owen, N.; Bauman, A.; Coffee, N.; Hugo, G. Residents’ perceptions of walkability attributes in objectively different neighbourhoods: A pilot study. Health Place 2005, 11, 227–236. [Google Scholar] [CrossRef]
- Basolo, V.; Strong, D. Understanding the neighborhood: From residents’ perceptions and needs to action. Hous. Policy Debate 2002, 13, 83–105. [Google Scholar] [CrossRef]
- Ross, A.; Searle, M. A conceptual model of leisure time physical activity, neighborhood environment, and sense of community. Environ. Behav. 2019, 51, 749–781. [Google Scholar] [CrossRef]
- Kweon, B.S.; Sullivan, W.C.; Wiley, A.R. Green common spaces and the social integration of inner-city older adults. Environ. Behav. 1998, 30, 832–858. [Google Scholar] [CrossRef]
- Sullivan, W.C.; Kuo, F.E.; Depooter, S.F. The fruit of urban nature: Vital neighborhood spaces. Environ. Behav. 2004, 36, 678–700. [Google Scholar] [CrossRef]
- Cohen, D.A.; Ashwood, J.S.; Scott, M.M.; Overton, A.; Evenson, K.R.; Staten, L.K.; Porter, D.; McKenzie, T.L.; Catellier, D. Public parks and physical activity among adolescent girls. Pediatrics 2006, 118, e1381–e1389. [Google Scholar] [CrossRef] [PubMed]
- Kaczynski, A.T.; Potwarka, L.R.; Smale, B.J.; Havitz, M.E. Association of parkland proximity with neighborhood and park-based physical activity: Variations by gender and age. Leis. Sci. 2009, 31, 174–191. [Google Scholar] [CrossRef]
- Melody, S.; Hosking, J.; Woodward, A.; Witten, K.; MacMillan, A.; Field, A.; Baas, P.; Mackie, H. Systematic literature review of built environment effects on physical activity and active transport–an update and new findings on health equity. Int. J. Behav. Nutr. Phys. Act. 2017, 14, 158. [Google Scholar]
- Reisz, T. Plans the earth swallows: An interview with Abdulrahman Makhlouf. Portal 2013, 2, 1–17. [Google Scholar]
- Saelens, B.E.; Sallis, J.F.; Black, J.B.; Chen, D. Neighborhood-based differences in physical activity: An environment scale evaluation. Am. J. Public Health 2003, 93, 1552–1558. [Google Scholar] [CrossRef]
- Slater, S.; Full, K.; Fitzgibbon, M.; Floyd, M. Parks and Recreation Areas Self-Report Survey. Available online: http://activelivingresearch.org/parks-and-recreation-areas-self-report-survey (accessed on 15 January 2020).
- Grootaert, C.; Narayan, D.; Jones, V.N.; Woolcock, M. Measuring Social Capital: An Integrated Questionnaire; The World Bank: Washington, DC, USA, 2004. [Google Scholar]
- Brownson, R.C.; Hoehner, C.M.; Brennan, L.K.; Cook, R.A.; Elliott, M.B.; McMullen, K.M. Reliability of 2 instruments for auditing the environment for physical activity. J. Phys. Act. Health 2004, 1, 191–208. [Google Scholar] [CrossRef]
- Ewing, R.; Cervero, R. Travel and the built environment: A meta-analysis. J. Am. Plan. Assoc. 2010, 76, 265–294. [Google Scholar] [CrossRef]
- Maghelal, P. Walking to Transit: Influence of Built Environment at Varying Distances. Inst. Transp. Eng. J. 2011, 81, 38–43. [Google Scholar]
- Brown, T.A. Confirmatory Factor Analysis for Applied Research; Guilford Publications: New York City, NY, USA, 2015. [Google Scholar]
- Peterson, R.A. A meta-analysis of Cronbach’s coefficient alpha. J. Consum. Res. 1994, 21, 381–391. [Google Scholar] [CrossRef]
- Hur, M.; Nasar, J.L.; Chun, B. Neighborhood satisfaction, physical and perceived naturalness and openness. J. Environ. Psychol. 2010, 30, 52–59. [Google Scholar] [CrossRef]
- Lovejoy, K.; Handy, S.; Mokhtarian, P. Neighborhood satisfaction in suburban versus traditional environments: An evaluation of contributing characteristics in eight California neighborhoods. Landsc. Urban Plan. 2010, 97, 37–48. [Google Scholar] [CrossRef]
- Qamhaieh, A.; Chakravarty, S. Global Cities, Public Transportation, and Social Exclusion: A Study of the Bus System in Abu Dhabi. Mobilities 2016, 12, 462–478. [Google Scholar] [CrossRef]
- Alawadi, K.; Dooling, S. Challenges and opportunities for participatory planning approaches within Dubai’s urban context. J. Urban Int. Res. Placemaking Urban Sustain. 2016, 9, 276–301. [Google Scholar] [CrossRef]
- Alawadi, K. Rethinking Dubai’s urbanism: Generating sustainable form-based urban design strategies for an integrated neighborhood. Cities 2017, 60, 353–366. [Google Scholar] [CrossRef]
- Alawadi, K.; Khanal, A.; Almulla, A. Land, urban form, and politics: A study on Dubai’s housing landscape and rental affordability. Cities 2018, 81, 115–130. [Google Scholar] [CrossRef]
- Alawadi, K.; Benkraouda, O. The debate over neighborhood density in Dubai: Between theory and practicality. J. Plan. Educ. Res. 2019, 39, 18–34. [Google Scholar] [CrossRef]
- Beal, L.; Séraphin, H.; Modica, G.; Pilato, M.; Platania, M. Analysing the Mediating Effect of Heritage Between Locals and Visitors: An Exploratory Study Using Mission Patrimoine as a Case Study. Sustainability 2019, 11, 3015. [Google Scholar] [CrossRef]
- Tresidder, M. Using GIS to Measure Connectivity: An Exploration of Issues; Portland State University: Portland, OR, USA, 2005. [Google Scholar]
- Bratman, G.N.; Anderson, C.B.; Berman, M.G.; Cochran, B.; Vries, S.D.; Flanders, J.; Folke, C.; Frumkin, H.; Gross, J.J.; Hartig, T.; et al. Nature and mental health: An ecosystem service perspective. Science 2019, 5, eaax0903. [Google Scholar] [CrossRef] [PubMed]
- Alawadi, K. A return to the old landscape? Balancing physical planning ideals and cultural constraints in Dubai’s residential neighborhoods. J. Hous. Built Environ. 2019, 34, 235–263. [Google Scholar] [CrossRef]
- Alawadi, K. Place attachment as a motivation for community preservation: The demise of an old, bustling, Dubai community. Urban Studies 2017, 54, 2973–2997. [Google Scholar] [CrossRef]
- Alawadi, K. Urban redevelopment trauma: The story of a Dubai neighbourhood. Built Environ. 2014, 40, 357–375. [Google Scholar] [CrossRef]
- Abu Dhabi Urban Street Design Manual. 2013. Available online: https://isocarp.org/app/uploads/2014/05/AfE_2013_4-UPC.pdf (accessed on 15 January 2020).


| Measures | Male | Female | Total |
|---|---|---|---|
| Age | |||
| 21–24 | 18 (12.4%) | 14 (9.6%) | 32 (22.1%) |
| 25–34 | 26 (17.9%) | 38 (26.2%) | 64 (44.1%) |
| 35–44 | 26 (17.9%) | 17 (11.7%) | 43 (29.7%) |
| 45–64 | 5 (3.4%) | 1 (0.7%) | 6 (4.1%) |
| Education | |||
| High-school | 29 (20%) | 14 (9.6%) | 43 (29.7%) |
| Bachelor | 30 (20.7%) | 36 (24.8%) | 66 (45.5%) |
| Masters | 15 (10.3%) | 14 (9.6%) | 29 (20%) |
| Doctoral | 1 (0.7%) | 4 (2.8%) | 5 (3.4%) |
| Others | - | 1 (0.7%) | 1 (0.7%) |
| NR | - | 1 (0.7%) | 1 (0.7%) |
| HH Income | |||
| <10,000 | 32 (22.1%) | 37 (25.5%) | 69 (47.6%) |
| 10,000–30,000 | 33 (22.8%) | 17 (11.7%) | 50 (34.5%) |
| >30,000 | 4 (2.8%) | 1 (0.7%) | 5 (3.4%) |
| NR | 6 (4.1%) | 15 (10.3%) | 21 (14.5%) |
| Ethnicity | |||
| Local | 9 (6.2%) | 5 (3.4%) | 14 (9.7%) |
| Asian | 50 (34.5%) | 34 (23.4%) | 84 (57.9%) |
| GCC | 9 (6.2%) | 17 (11.7%) | 26 (17.9%) |
| Other | 7 (4.8%) | 14 (9.7%) | 21 (14.4%) |
| Variables | Accessibility | Perception | Surrounding | Traffic Safety | Crime Safety |
|---|---|---|---|---|---|
| Walkability to stores | 1.000 | - | - | - | - |
| Walkability to other places | 1.208 | - | - | - | - |
| Walkability to transit stop | 1.566 | - | - | - | - |
| Walkability to non-gov. services | 2.964 | - | - | - | - |
| Walkability to gov. services | 2.055 | - | - | - | - |
| Availability of sidewalks | - | 1.000 | - | - | - |
| Availability of bicycle or pedestrian trails | - | 2.505 | - | - | - |
| Separation of sidewalks by cars | - | 3.070 | - | - | - |
| Separation of sidewalks by Grass/dirt | - | 1.645 | - | - | - |
| Trees along streets | - | - | 1.000 | - | - |
| Trees shade on sidewalks | - | - | 1.687 | - | - |
| Free of litter | - | - | 0.541 | - | - |
| Attractiveness of natural sights | - | - | 0.983 | - | - |
| Attractiveness of buildings/homes | - | - | 0.683 | - | - |
| Traffic along home street | - | - | - | 1.000 | - |
| Traffic along nearby streets | - | - | - | 0.788 | - |
| Air pollution | - | - | - | 0.295 | - |
| Lighting at night | - | - | - | - | 1.000 |
| Interaction with others | - | - | - | - | 1.296 |
| High crime rate | - | - | - | - | 1.249 |
| Safety during the day | - | - | - | - | 0.947 |
| Safety during the night | - | - | - | - | 0.629 |
| Reliability Coeff. (Cronbach’s alpha) | 0.671 | 0.562 | 0.601 | 0.669 | 0.676 |
| Likelihood Ratio (Model vs. Saturated) | 9.14 * | 9.26 *** | 10.25 * | 10.59 **** | 10.17 * |
| Variables | Neighborhood Satisfaction (Dep. Variable) | |||
|---|---|---|---|---|
| Coef | Std Error | t | ||
| Ethnicity | ||||
| GCC | −0.316 | 0.242 | −1.31 | |
| Asian | −0.416 ** | 0.206 | −2.02 | |
| Other | −0.679 *** | 0.258 | −2.63 | |
| Age | ||||
| 25–34 years | 0.132 | 0.161 | 0.82 | |
| 35–44 years | 0.047 | 0.177 | 0.26 | |
| 45–64 years | 0.418 | 0.298 | 1.40 | |
| 65 years or older | −0.118 | 0.104 | −1.13 | |
| Education | ||||
| Bachelor’s Degree | −0.114 | 0.149 | −0.76 | |
| Master’s Degree | −0.057 | 0.172 | −0.33 | |
| Doctoral Degree | 0.074 | 0.331 | 0.22 | |
| Other Degree | −1.796 **** | 0.63 | −2.85 | |
| Income (AED) | ||||
| 10–30K | −0.195 | 0.125 | −1.56 | |
| >30K | 0.032 | 0.293 | 0.11 | |
| Built Environment | ||||
| Access | 0.449 * | 0.235 | 1.91 | |
| Perception | 0.544 * | 0.287 | 1.90 | |
| Surrounding | 0.291 ** | 0.124 | 2.35 | |
| Crime | 0.384 | 0.483 | 0.79 | |
| Traffic Safety | 0.000 | 0.071 | 0.00 | |
| Number of Observations | 123 | |||
| F (18, 104) | 2.82 | |||
| Prob > F | 0 | |||
| R-Squared | 0.328 | |||
| Adj R-Squared | 0.212 | |||
| Root MSE | 0.582 | |||
| Variables | Social Capital (Dep. Variable) | |||
|---|---|---|---|---|
| Coef | Std Error | t | ||
| Ethnicity | ||||
| GCC | 0.959 ** | 0.421 | 2.28 | |
| Asian | 1.406 **** | 0.363 | 3.87 | |
| Other | 0.683 | 0.460 | 1.48 | |
| Age | ||||
| 25–34 years | −0.253 | 0.279 | −0.91 | |
| 35–44 years | −0.466 | 0.305 | −1.53 | |
| 45–64 years | −0.523 | 0.518 | −1.01 | |
| 65 years or older | 0.100 | 0.181 | 0.55 | |
| Education | ||||
| Bachelor’s Degree | 0.378 | 0.258 | 1.47 | |
| Master’s Degree | 0.575 * | 0.297 | 1.93 | |
| Doctoral Degree | −0.735 | 0.571 | −1.29 | |
| Other Degree | 2.507 ** | 1.128 | 2.22 | |
| Income (AED) | ||||
| 10–30K | 0.352 | 0.218 | 1.61 | |
| >30K | 0.388 | 0.506 | 0.77 | |
| Built Environment | ||||
| Access | −0.411 | 0.412 | −1.00 | |
| Perception | −0.207 | 0.503 | −0.41 | |
| Surrounding | 0.300 | 0.219 | 1.37 | |
| Crime | −1.716 ** | 0.836 | −2.05 | |
| Traffic Safety | −0.058 | 0.123 | 0.47 | |
| Neighborhood Satisfaction | 0.487 **** | 0.169 | 2.88 | |
| Number of Observations | 123 | |||
| F (18, 104) | 2.13 | |||
| Prob > F | 0.008 | |||
| R-Squared | 0.28 | |||
| Adj R-Squared | 0.15 | |||
| Root MSE | 1 | |||
| Variable | Quality | Comment |
|---|---|---|
| Residential | Good | 4 out of 6 destinations available |
| Public/governmental | Moderate | 8 out of 13 destinations available |
| Commercial | Moderate | 12 out of 21 destinations available |
| Recreational | Poor | 3 out of 9 destinations available |
| Natural features | Poor | 1 out of 4 destinations available |
| Walkability | Moderate | Depends on houses setbacks |
| Bikability | Poor | No bike lanes are available |
| Street connectivity | Poor | Not the interconnected street system. Many closed loops and cul-de-sacs. |
| Crossing aids | Poor | No/rare crosswalks (marking) |
| Traffic calming devices | Poor | No/rare availability of traffic calming measures |
| Street lighting | Moderate | Available on the sides of the streets only, not alleyways. |
| Recreational facilities | Moderate | Two small pocket parks |
| Recreational equipment | Moderate | Only those available at the park |
| Amenities | Poor | No public toilets, vending machines, or other amenities |
| Attractive features | Moderate | Trees available, but not well planned |
| Comfort features | Poor | Only in the park (benches, shade trees, and elements) |
| Air pollution | Good | No air pollution |
| Noise pollution | Good | No noise pollution |
| Physical disorder | Good | No significant physical disorder found |
| Signage | Poor | Only stop sign, and yield |
| Social activities | Good | People of different ages were present, |
| People conducting various physical activities were present |
© 2020 by the authors. Licensee MDPI, Basel, Switzerland. This article is an open access article distributed under the terms and conditions of the Creative Commons Attribution (CC BY) license (http://creativecommons.org/licenses/by/4.0/).
Share and Cite
Al-Ali, A.; Maghelal, P.; Alawadi, K. Assessing Neighborhood Satisfaction and Social Capital in a Multi-Cultural Setting of an Abu Dhabi Neighborhood. Sustainability 2020, 12, 3200. https://doi.org/10.3390/su12083200
Al-Ali A, Maghelal P, Alawadi K. Assessing Neighborhood Satisfaction and Social Capital in a Multi-Cultural Setting of an Abu Dhabi Neighborhood. Sustainability. 2020; 12(8):3200. https://doi.org/10.3390/su12083200
Chicago/Turabian StyleAl-Ali, Anfal, Praveen Maghelal, and Khaled Alawadi. 2020. "Assessing Neighborhood Satisfaction and Social Capital in a Multi-Cultural Setting of an Abu Dhabi Neighborhood" Sustainability 12, no. 8: 3200. https://doi.org/10.3390/su12083200
APA StyleAl-Ali, A., Maghelal, P., & Alawadi, K. (2020). Assessing Neighborhood Satisfaction and Social Capital in a Multi-Cultural Setting of an Abu Dhabi Neighborhood. Sustainability, 12(8), 3200. https://doi.org/10.3390/su12083200