Article

Analysis of Fatal Accidents and Their Causes in the Korean Construction Industry

1
International School of Urban Science, University of Seoul, Seoul 02504, Korea
2
Department of Construction Policy Research, Korea Institute of Civil Engineering and Building Technology, Gyeonggi-Do 10223, Korea
3
Department of Architectural Engineering, University of Seoul, Seoul 02504, Korea
*
Author to whom correspondence should be addressed.
Sustainability 2020, 12(8), 3120; https://doi.org/10.3390/su12083120
Submission received: 25 February 2020 / Revised: 28 March 2020 / Accepted: 9 April 2020 / Published: 13 April 2020
(This article belongs to the Special Issue Sustainable Construction Quality and Safety Management)

Abstract

:
The construction industry is one of the most hazardous industries in many countries. Many studies have asserted that industrial accidents could be prevented by eliminating their root causes. However, given that accident occurrence processes are considerably complex and often invisible, it is difficult to identify and eliminate the root causes. Based on this recognition, this paper aims to analyze the causality of construction accidents on the basis of direct causes that are classified into unsafe actions (UA) and unsafe conditions (UC). A logistic regression is applied to examine associations between UAs and UCs and their significances in triggering construction accidents. Then, a Delphi method is applied to determine the relationships between direct and root causes of construction accidents. This study contributes to an improved understanding of the complex causal process of construction accidents, which is a necessary stepping-stone to prevent construction accidents. Meanwhile, only one-to-one combinations of UCs and UAs are considered in this paper. Thus, follow-up studies to examine the impact of one-to-many or many-to-many combinations are needed.

1. Introduction

The construction industry has long been recognized as one of the most hazardous industries in many countries [1,2]. As of 2016, the construction industry accounted for 19% of the total industrial deaths in the United States, and worldwide, the construction industry was found to have a higher fatality rate than other industries [3]. According to a Korea Occupational Safety and Health Agency (KOSHA) report [4], the construction industry accounted for 29.6% of all industries in Korea and the mortality rate of the construction industry (1.90 mortalities per 10,000 workers) was more than the mortality rate of the UK (1.37 mortalities per 10,000 workers). In this regard, numerous researchers have proposed various causation models (e.g., the domino theory, the accident root causes tracing model, etc.) to identify and eliminate the causes of construction accidents [1,5]. These models identified the major causes of accidents but they had a limitation in considering accidents that occurred by independent causes. However, given that most accidents arise due to many interrelated factors, it is difficult to determine one independent cause of each accident [1,6]. According to a report [7] issued by Japan’s Ministry of Health, Labor, and Welfare, 81.3% of accidents were caused by combinations of unsafe acts (UAs) and unsafe conditions (UCs), while the remaining 18.7% occurred due to either an UA or an UC only. The US National Security Council (USNSC) [8] also reported that the probability of accident occurrence caused by both UAs and UCs is higher than the probability that they will cause accidents independently.
Based on this recognition, this paper aims to analyze causality of fatal accidents in the construction industry in order to better understand the overall relationship between accidents and their direct and root causes. To achieve this aim, correlations of UAs and UCs are analyzed in this paper to identify significant combinations that have a high correlation between UAs and UCs. Then, a logistic regression is applied in order to investigate relationships between the identified combinations and accidents. In addition, a Delphi method is applied with seven safety managers in order to determine the relationship between direct and root causes. To prevent confusion, this paper defines that UAs and UCs are included in the direct causes that cause accidents directly, and root causes cause direct causes according to the domino theory of Heinrich [6]. Additionally, to focus on the relationship between the accident, the direct causes, and the root causes, this paper did not cover the environmental characteristics of each construction project that could affect the accidents, such as types of construction, their size, etc.

2. Literature Review

Heinrich [6] asserted that deficiencies of human behavior, which are influenced by social and environmental factors, might lead to the direct cause, the accident itself, and the resulting injuries. Thus, it has been suggested to devote management and organizational effort to reducing root causes based on the belief that the root causes are one of the fundamental underlying factors in accident causation [9,10]. Weaver [11] claimed that understanding the root causes is one of the important factors in preventing accidents. Following this, some theoretical models have been developed and applied to case studies in order to trace the root causes of accidents [5,12]. In addition to this, Laukkanen [13] highlighted the importance of safety training and systems for preventing root causes.
On the other hand, some studies, particularly in construction, have focused on direct causes, rather than root causes. These studies mostly analyzed UAs and UCs and then proposed safety measures for preventing accidents. For example, Haslam et al. [14] explored factors contributing to injuries that occurred in airport construction projects. They classified major risk factors, including human factors (e.g., inappropriate acts, safety infractions, being in a hurry, inexperience, lack of skills) and condition factors (e.g., weather, terrain, poor lighting, walking surfaces). Chi et al. [15] analyzed electrical fatalities in Taiwan’s construction industry and determined that the major causes of fatal electrical accidents were improperly installed, defective, or damaged tools and equipment; poor work practices; careless worker contact with equipment or energized power lines; the improper use of personal protective equipment (PPE); and unsafe working conditions. Chi et al. [16] also recognized that UAs are one of the major causes of accidents when they are combined with UCs on a construction site.
In addition, other accident studies have striven to determine the most common types of accidents in the construction industry by analyzing historical accident data. Chi et al. [17] developed a coding system to facilitate the categorization of fatal falls according to fall location, individual factors, and company size to determine the importance of contributing factors. Dong et al. [18] evaluated deaths resulting from fall injuries among Hispanic construction workers in the United States. Winge et al. [19] identified frequent accident types, the accident sequence, and barrier failures using samples of 176 construction accidents in Norway. Fabiano et al. [20] analyzed the historical accident data in Italian industry and found out that there is a cyclic trend in fatal accidents. Unsar et al. [21] examined the results of occupational accidents in Turkey in order to identify the causes of occupational accidents. These studies have successfully identified major causes of accidents, but they are limited in considering only independent causes in accident occurrence. Thus, these studies have not fully considered the relationships among the steps in an accident’s process, which are necessary to understand the complex causalities of construction accidents.

3. Methodology

In this paper the author tried to apply appropriate methodologies considering the paper’s aim and the structure of the data collected. The authors adopted the methodologies for analyzing nominal data because the data was configured based on the presence of accidents. Therefore, the major combinations of UAs and UCs were identified in this paper by conducting a chi-square test and a lambda analysis to measure the existence and extent of a correlation between UAs and UCs, respectively. To understand the causal process of major combinations and accidents, the authors conducted a logistic regression, which could indicate the effect of UAs and UCs on accidents. In addition, the Delphi process was intended in this paper to complement the limits of the data in determining the relationship between major combinations and the root causes. Figure 1 shows a research framework summarizing the methodologies and steps conducted in this paper.

4. Combinations of UAs and UCs

4.1. Data Collection and Classification Standard

The authors collected 675 cases of fatal construction accidents reported by KOSHA from 2007 to 2013 to conduct a correlation between UAs and UCs. The 675 cases were organized in the form of a report describing the date, time, personnel, location, and general causes of each accident. A classification standard of UAs and UCs defined by KOSHA was used to analyze and classify the causes of the accidents. The KOSHA classification defines 11 types of UA and 8 types of UC. However, it is difficult to directly apply the existing general standard to the construction industry because this standard is developed in order to cover all industries including the construction industry. Therefore, the general standard has some difficulties in characterizing fatal construction accidents. For example, the “place where there is a danger of falling” specified in UA 1 (i.e., approach to dangerous place) is not concrete, and the “hazardous jobs” specified in UC 6 (i.e., defect of production process) is unclear. Thus, the existing general standards were redefined in this paper to better address the characteristics of fatal construction accidents. Table 1 shows the modified standards used for classifying direct causes of construction accidents in this paper.

4.2. Correlation Analysis

This study analyzed which UAs and UCs were the most common causes of accidents among the 11 UAs and the 8 UCs by case, based on the premise that most accidents arise when an UA is combined with an UC. To identify combinations of UAs and UC 675 cases of fatal accidents in the construction industry were collected and analyzed. While near-misses are an important component in the better understanding and management of construction accidents, the authors unfortunately did not include near-misses in the analysis because KOSHA only reported the actual accidents. Based on the classification in Table 1, accident examination reports of 675 cases were carefully investigated with safety managers, and one major UA and one major UC were identified for explaining the direct causes of each accident. All 675 cases analyzed in this study were classified by an UC and an UA. Of course, there might have been more than one UA and more than one UC in the triggering of an accident. However, considering that the main objective of this paper was to identify some significant combinations of UAs and UCs, only one-to-one combinations of UCs and UAs was considered in this paper. In addition, it is practically ineffective to investigate all the insignificant combinations for identifying the causality of construction accidents.
Table 2 shows the frequency of accidents caused by combinations of the various UAs and UCs.
For determining direct causes, it was effective to figure out significant combinations that had a high correlation between the 11 UAs and 8 UCs. In order to identify the significant combinations, a chi-square test was conducted in this paper, which could measure the correlation between the UAs and UCs. Then, a lambda analysis was conducted in this paper in order to determine the coupling degree of the variables; the degree of lambda is a criterion to identify how strong a correlation of nominal variables is by estimating the value of two variables in both directions. Generally, the value of Lambda is between 0 and 1, and the closer the value is to 1, the more cohesive the variables are considered.
An analysis of the chi-square test at the 0.01 significance level was conducted in this paper. Because a cell whose expected frequency is less than five is 20% of the whole for conducting a chi-square test, combinations that did not satisfy the condition were excluded in this paper. Combinations that were satisfied with the significance level of the chi-square test were targeted for lambda analysis. The results are presented in Table 3.
Investigating combinations that have high correlation among the UAs and UCs was more effective than merely examining the frequency of each UA and UC for determining an association between them, which was identified through the difference between the result of a frequency analysis (Table 2) and the result of a correlation analysis (Table 3). For example, the degree of lambda of a combination made up of UC 4 and UA 3, which have a relatively high frequency among UCs and UAs, was 0.288, which had a relatively low coherence, whereas the degree of lambda of a combination composed of UC 6 and UA 7, with a low frequency, had a relatively high coherence.
As a result of the chi-square test, combinations that did not meet the 0.01 significance level were excluded through the lambda analysis. Lambda analysis was only conducted on 23 combinations that were satisfied with the 0.01 significance level. It was noted that there was meaningful correlation of two variables if the lambda of the combinations was higher than 0.2, which might be considered a criterion of significant correlation. Consequently, this study could deduct11 major combinations whose accident frequency was 69.6% of the total accidents (Table 4). The combination with the greatest correlation among the eight combinations was UC 2–UA 3, whose lambda value was 0.57. That combination was followed by UC6‒UC7, UC 4–UA 10, UC4–UA3, UC1–UA1, UC4–UA1, UC2–UA1, UC1–UA11, UC6–UA4, UC1–UA3, and UC7–UA10.
In sequence, the relationship between an accident, a direct cause, and the root causes is investigated in this paper, and then finally a causal process of accidents in the construction industry is described using the eleven deducted combinations.

5. Causal Process of Fatal Accidents

5.1. Relationship between a Direct Cause and an Accident

Based on the findings in Table 4, the authors identified a relationship between accidents and the direct cause. Major construction types and accident types caused by the eleven significant combinations were investigated in this study and then the relationships were analyzed in detail. In the case of Korea, the most common accident type among all accidents in the construction industry was falling, followed by collapse, being caught between items, stumbling, and electric shock, and the most common construction type during which accidents occur was finishing work, followed by reinforced concrete work, steel structural work, earth work, equipment work, and temporary work [4].
In sequence, a logistic regression was conducted in this study, which is suitable in cases where the dependent variable is nominal, to determine a relationship between accidents and the direct cause. In a logistic regression model, the independent variable forms a linear relationship with the dependent variables after the log transformation.
A data set was established through the additional analysis for conducting the logistic regression. The dependent variable was “type of accident” (such as falling, collapse, being caught between items, stumbling, or electric shock) and the independent variables were UCs and UAs. For example, in the case of figuring out a relationship between falling and direct causes that are combinations of UCs and UAs, where falling might occur by UC 2 and UA 3, a dependent variable was defined as 1, and an independent variable was set as 2 and 3. Otherwise, if other types of accidents might happen by UC 4 and UA 10, the dependent variable was identified as 0, and an independent variable was set as 4 and 10.
Using the entire dataset, the logistic regression model was built in SPSS 19.0 to estimate the probability of falling accidents based on UCs and UAs, which are independent variables, and Table 5 summarizes the results of the logistic regression. The result of logistic regression described how much influence combinations of UCs and UAs have on each type of accident, which can enable the investigation of a relationship between an accident and a direct cause. Table 5 shows UC 1, UC 2, UA 1, UA 3, UA 4, and UA 9 had an influence on a falling accident at a 95% confidence level. UC 2 (a defect of a safety device) and UA 3 (incorrect use of protection), whose standardized coefficients (B) were 3.3 and 4.436, respectively, had the biggest effect on falling.
Using the results of logistic regression, Equation (1) estimates the conditional probability of falling caused by combinations between UC and UA on condition that both the UC and the UA occur [22].
P r o b a b i l i t y = 1 / ( 1 + e ( B c + B A + C ) )
where B c is the standardized coefficient of UC causing falling; B A is the standardized coefficient of UA causing falling; and C is a constant of the equation.
Only the probability caused by the eleven combinations that were previously judged as having coherence between UA and UC were considered in this paper. As the result of logistic regression with falling and direct causes (Table 5), the possible combinations of UCs and UAs meeting the confidence level were UC1‒UA1, UC1‒UA3, UC2‒UA1, and UC2‒UA3 among the 11 major combinations. The probability of falling caused by the combinations is presented in Table 6. UC 2–UA 3 strongly influenced the probability of falling, which means fatal falling occurred frequently when workers misused protection in environments lacking safety equipment. This was followed by UC 1–UA 3, UC 2–UA 1, and UC 1–UA 1 as the main causes of falling. Similarly, the probability between other types of accidents and direct causes were calculated. The processes and results of these analyses (Table 6) could indicate the relationship between the accidents and the combination of UCs and UAs, i.e., the direct causes.

5.2. Relationship between a Direct Cause and a Root Cause

It was also necessary to determine a relationship between the direct cause and the root cause to investigate the causality of construction accidents. There is very little numerical data on the relationship between root cause and direct cause, and the relationship is not simple [23]. Therefore, the Delphi method was used in this paper because it requires much experience and know-how in safety management in order to analyze it. The Delphi method is an interactive process for proper decision-making that involves collecting the judgments of experts using a series of questionnaires intersected with feedback [24]. The questionnaires are designed to focus on problems, solutions, or forecasts. Each subsequent questionnaire is developed based on the results of the previous questionnaire [25]. It is a very flexible tool that permits the reaching of a consensus through successive stages of questionnaire and feedback.
A survey for the Delphi method was conducted thanks to blind-copy electronic mail, which was used to send the survey to experts in safety management in order to save time and expense for both the surveyor and the experts. The Delphi survey group size appears to be very different across the literature. However, it is often recommended to have a group of between 7 and 18 participants to draw some relevant conclusions and, at the same time, avoid difficulty in reaching consensus among the experts [24]. Therefore, a Delphi method was used in this paper with seven safety managers who have more than 10 years of experience (see Table 7).
Some studies identified the root causes of accidents as follows: a lack of proper training; safety equipment not provided; deficient enforcement of safety measures; unsafe equipment, method, or conditions; poor attitude to safety; and isolated deviation from prescribed behavior [26,27]. However, the existing root causes needed to be modified to suit the situation in the Korean construction industry, as the root causes can generally vary depending on the social atmosphere and the environment. Therefore, the major root causes that cause fundamental problems in the construction industry were deduced in this paper using a primary open-ended question.
The results are presented in Table 8, which presents seven major root causes of accidents in the Korean construction industry.
In this paper, the statistical analysis of round 1 and round 2 correspond to the results expressed in the discussion paragraph. It must be noted that the results of round 1 and round 2 were the same because the synthesis and proposition that was done after round 1 satisfied all of the experts. As a consequence no change was made between the answers of round 1 and round 2. An overall relationship between direct causes and root causes was determined by using closed-ended questions (round 1). In this step, experts were asked to identify major accident cases caused by the eleven combinations defined earlier. Then, the authors selected the root causes that were judged the cause of each combination. This made it possible to investigate the potential relationship between a direct cause and a root cause. Finally, another closed-ended question (round 2) was asked in order to confirm the identified relationships from the experts. Prior to asking the last question, the results of their answers for the previous question were shared and discussed with the experts in order to reach a consensus between the experts. The overall results are relevant as the interrogation of seven experts makes them trustworthy.
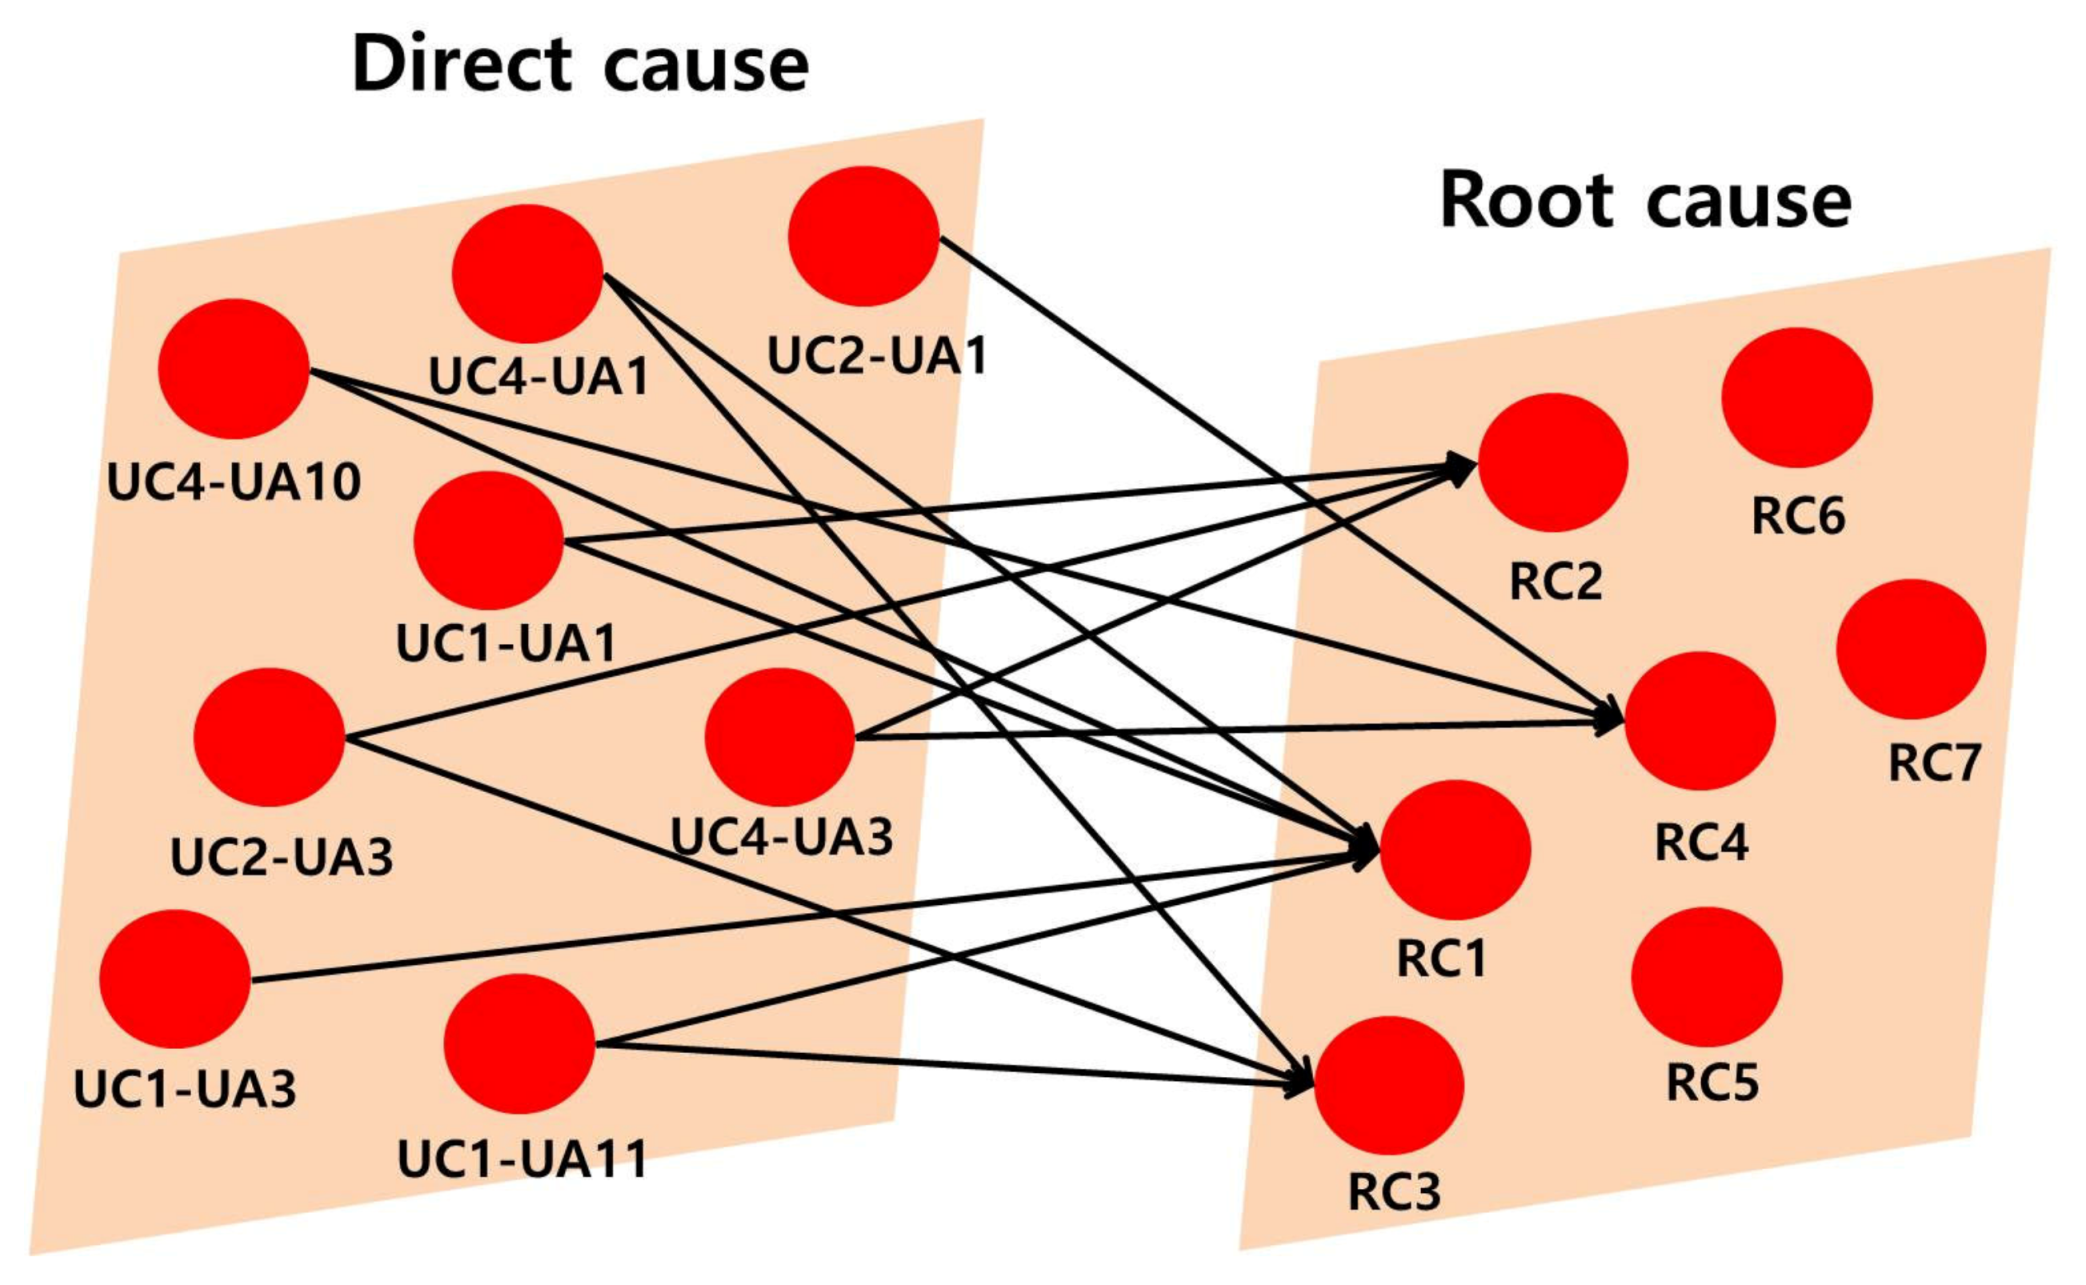
The relationships between direct causes and root causes derived from the questions were shown in Figure 2. According to Figure 1, the experts judged the most consequential root cause to be root cause 1, influencing several combinations made up of UCs and UAs, followed by root causes 2, 3, and 4. However, they did not judge the other root causes as producing an effect on the direct causes. The researcher found it was especially unexpected that root cause 5 was excluded from the results. When interpreting the results of the relationship between root causes and direct causes, accidents would occur by direct causes, such as the defect of a safety device (UC 2), the approach to a dangerous place (UA 1), a dangerous place (UC 4), and the wrong use of protection (UA 3), if the construction period is insufficient.

5.3. Identification of Causal Process of Fatal Accidents

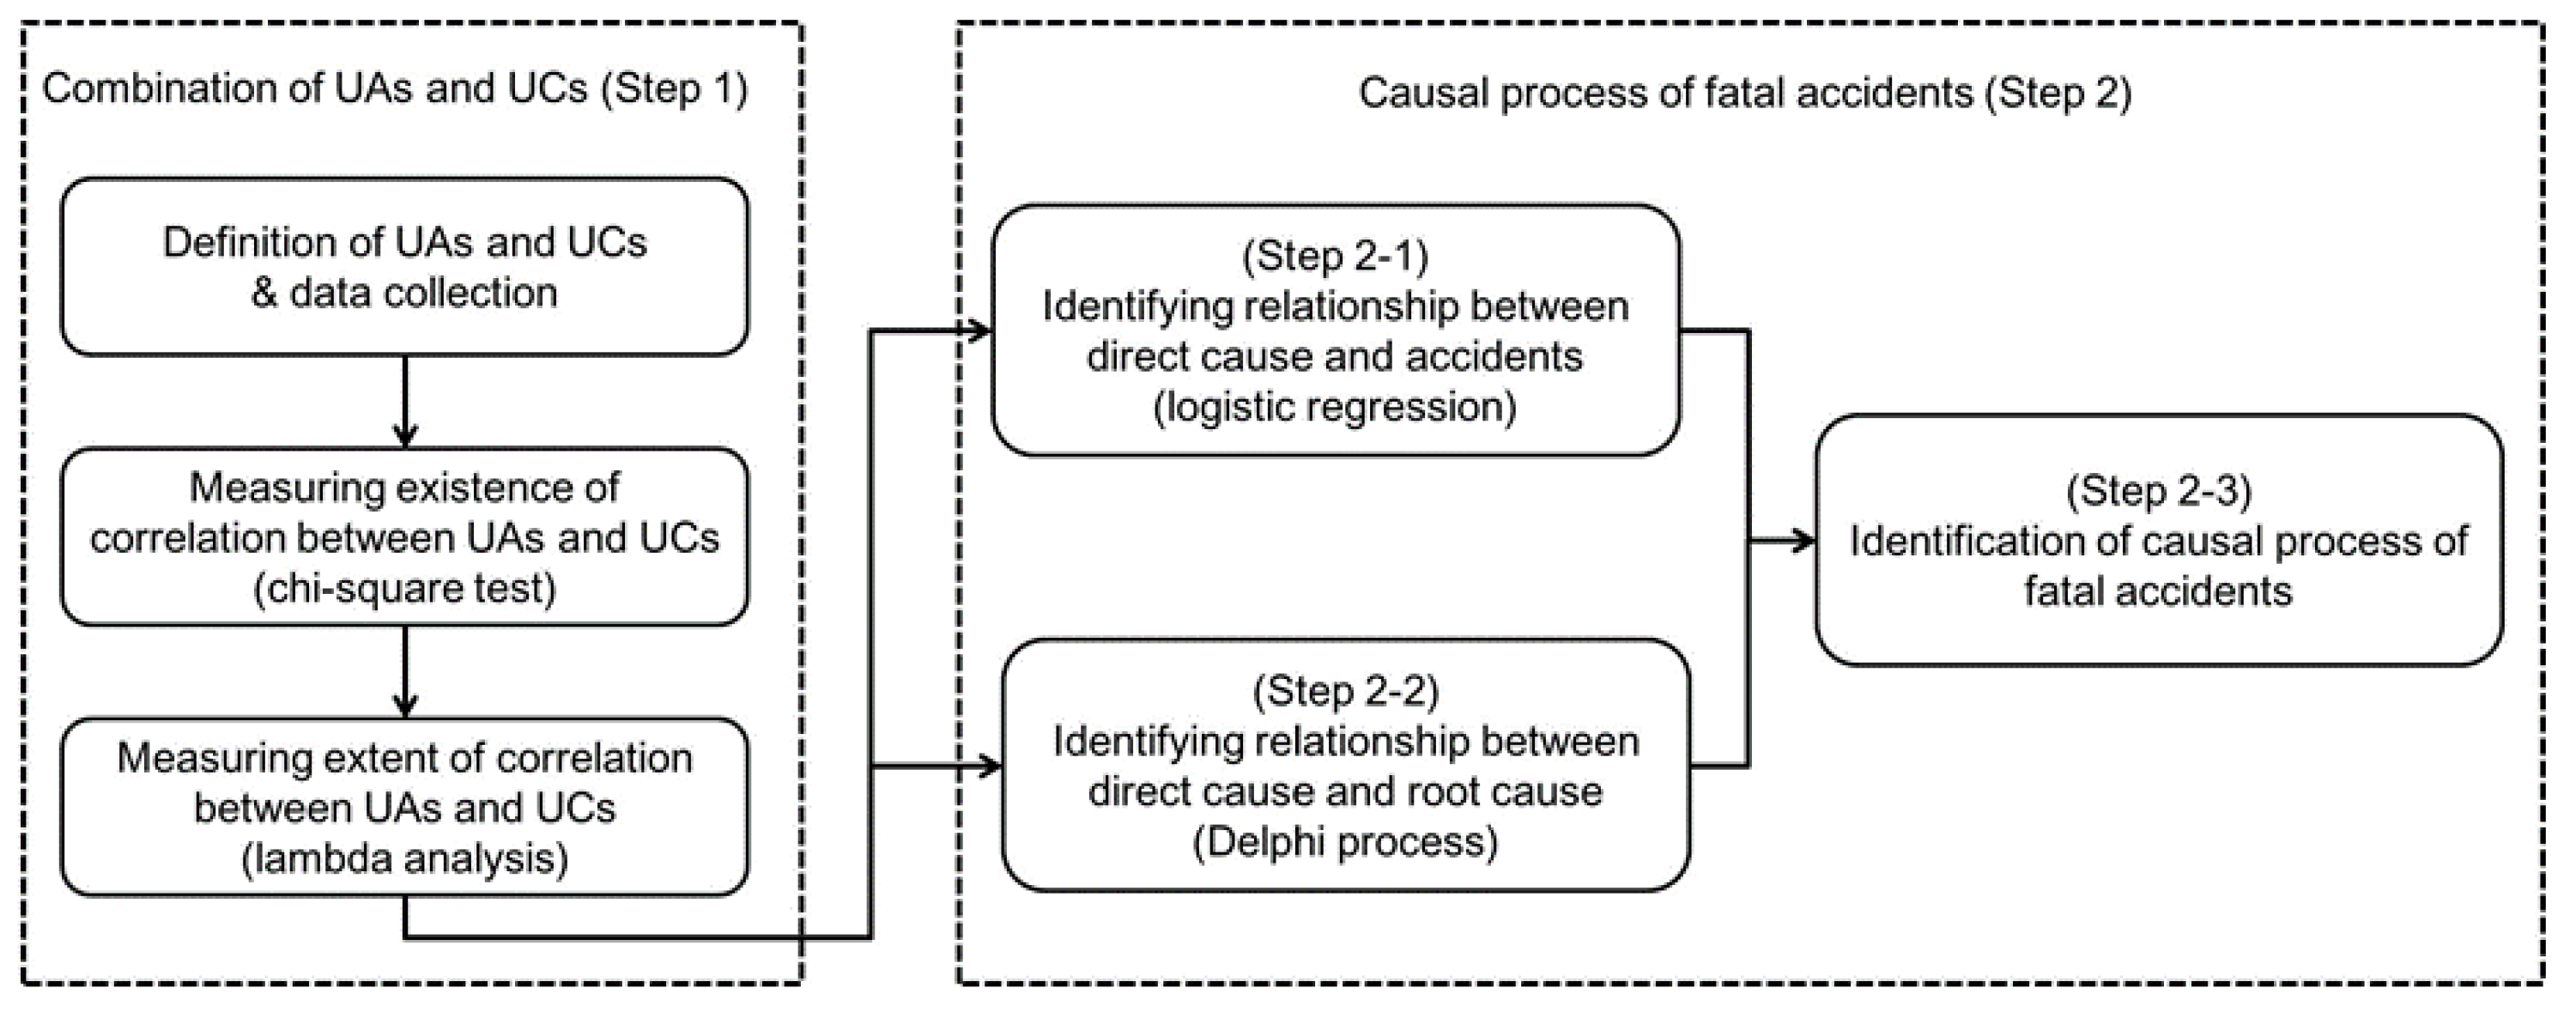
A connection between accidents and a direct cause was determine din this paper using a chi-square test and logistic regression, and then a relationship between a direct cause and a root cause was determined using the Delphi method. In this section, the investigation and analysis of the causal process of fatal accidents in the construction industry is described. It is practicable to investigate the causal process by arranging the two relationships studied earlier based on direct cause.
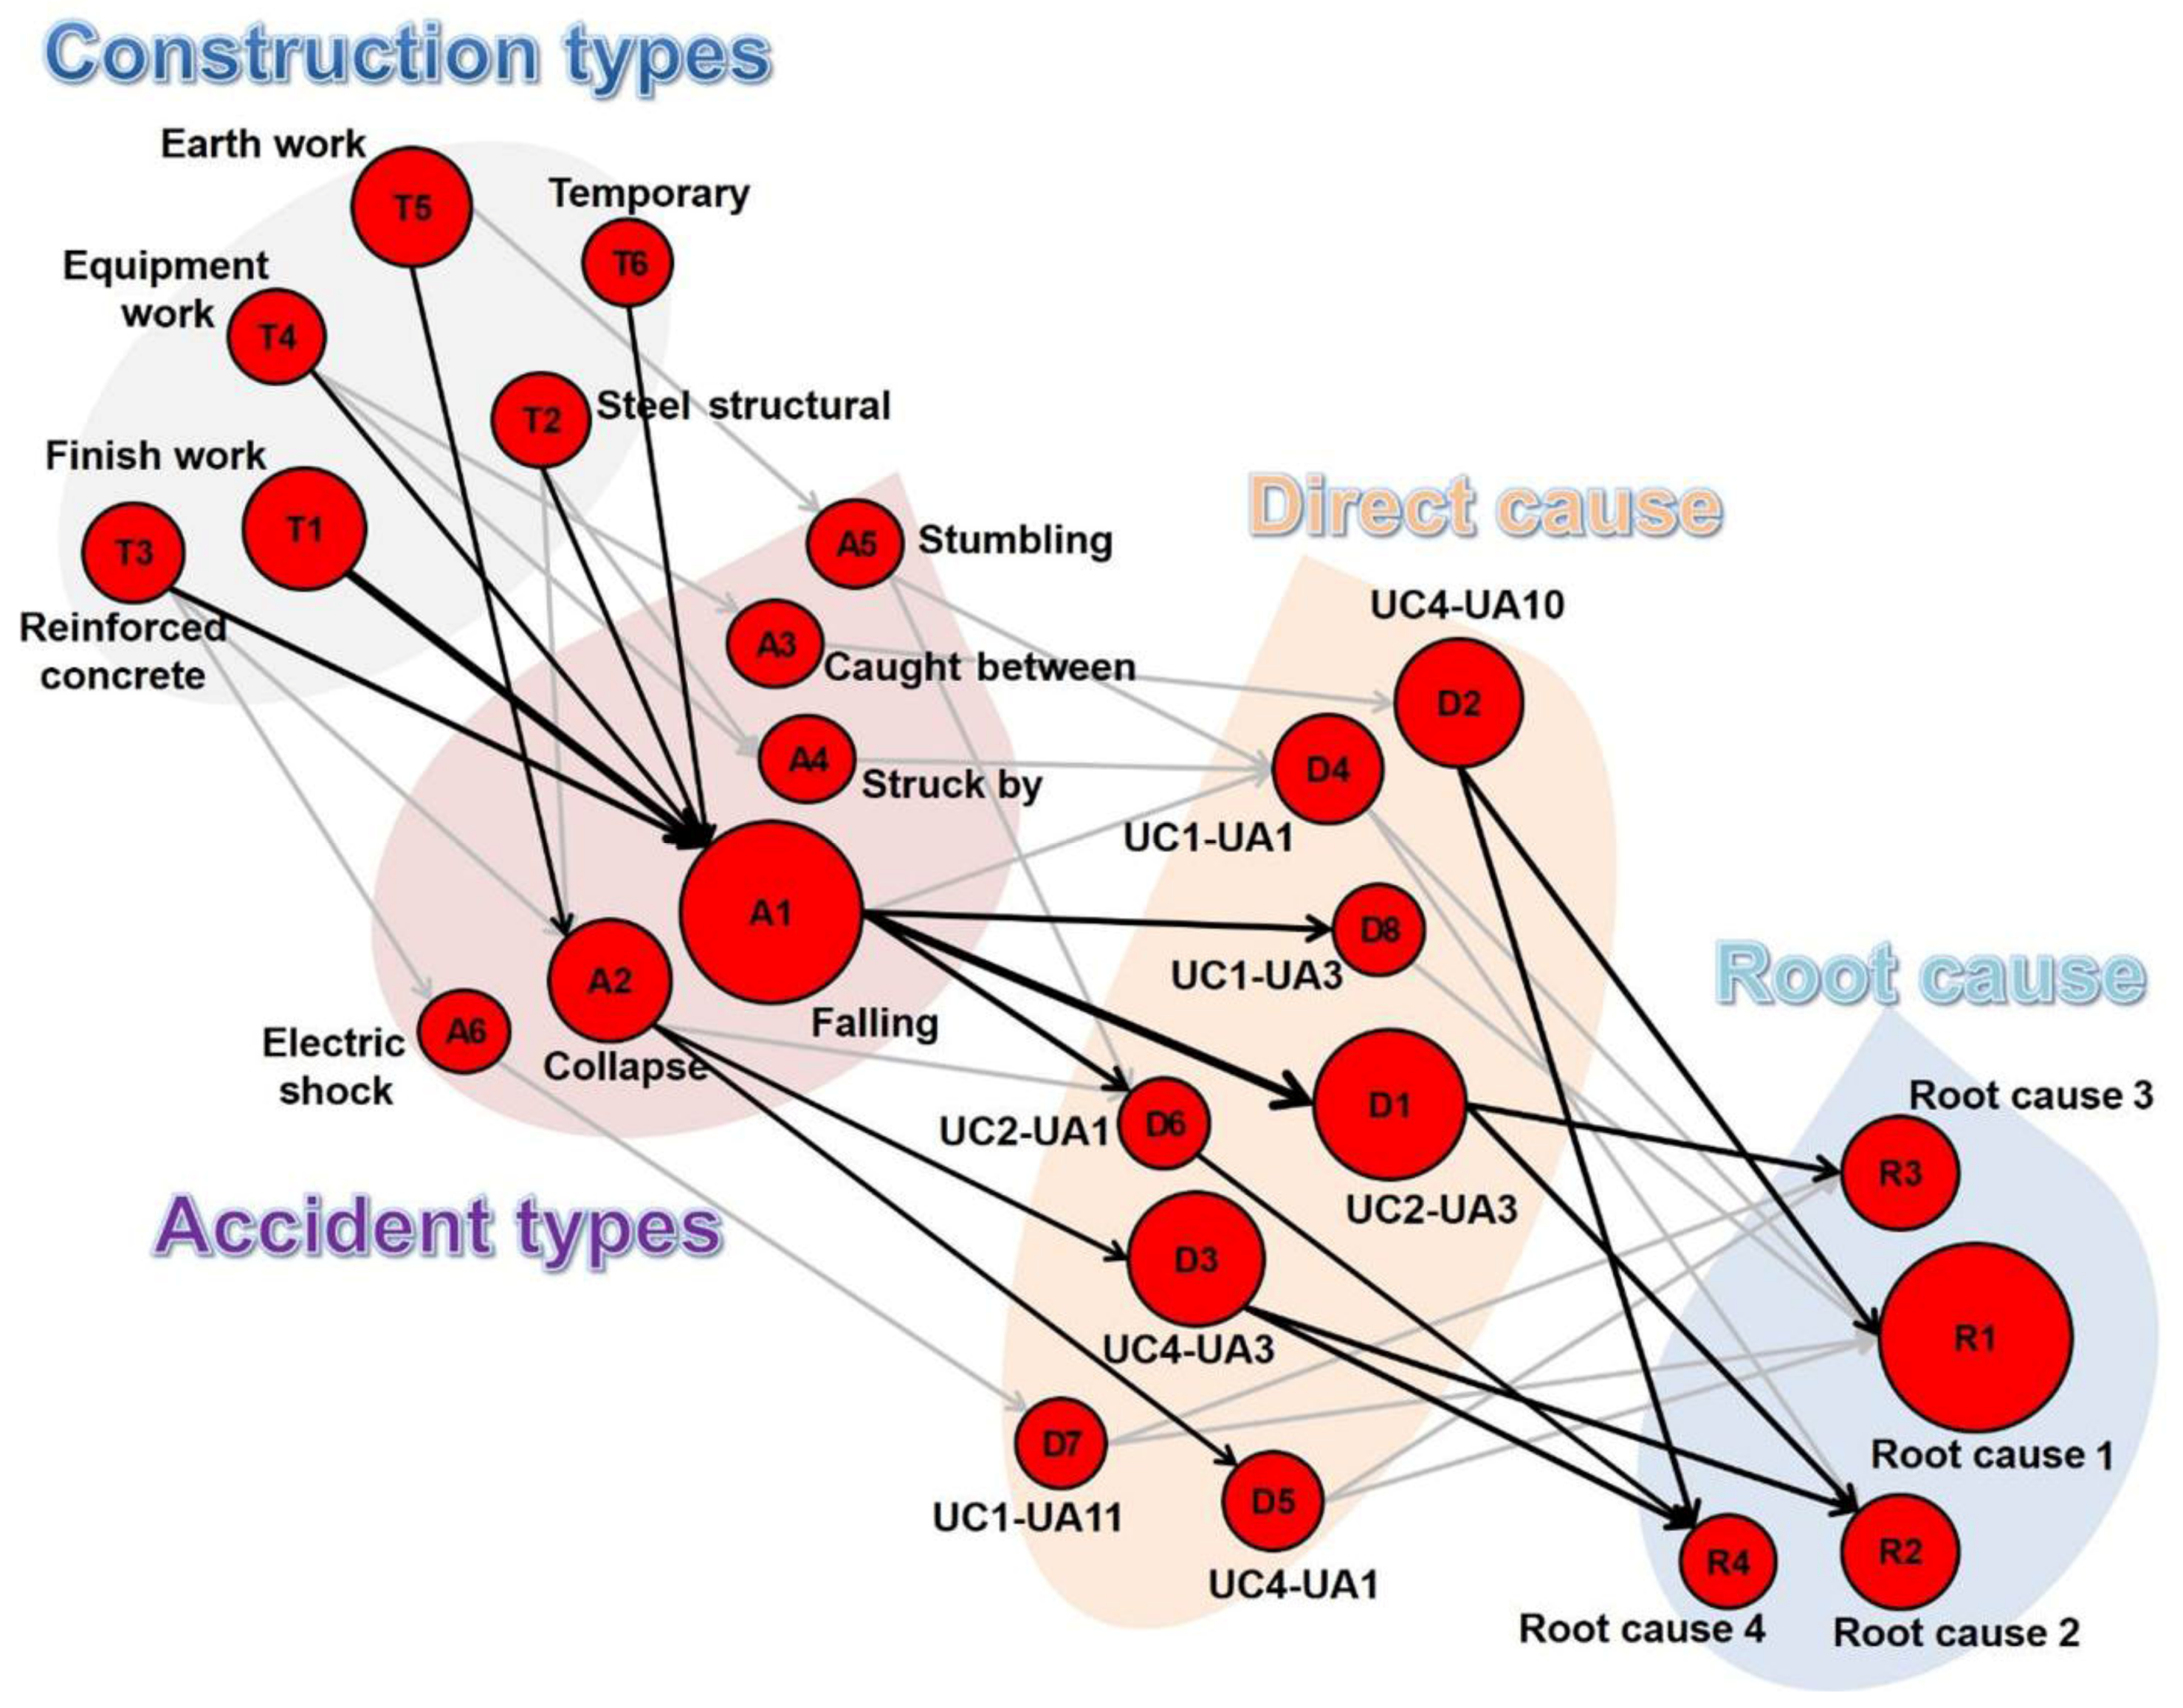
In the results depicted in Figure 3, the size of the circle represents the degree of danger at each step, and the thickness of the arrow indicates the degree of connection between the circles. From Figure 3, it is possible to recognize that the process of accident occurrence is significantly complex, which means that it is extremely difficult to determine proper root causes by simply analyzing accident cases without also investigating the causal process to prevent accidents in the construction industry.
According to the causal process established in this study, the primary root cause leading to fundamental problems was root cause 1 (lack of manger’s safety consciousness), followed by root cause 4 (insufficient construction period), and root cause 3 (lack of education about safety). These results were in line with previous studies such as Toole et al.’s [24] selection of “lack of proper training” and “poor attitude toward safety” or Choudhry et al.’s [26] findings of “perceived risk” and “safety orientation and training” as the main root causes. In addition, the results of this study show that the combination of UC2‒UA3 and root cause 1 was the most influential. The combination UC2‒UA3 caused by root cause 3 affected falling significantly, and UC4‒UA3 caused by root cause 4 had the most influence on collapse.
It is necessary to consider root causes by construction types because each root cause has a different influence in different construction scenarios. Therefore, the researcher examined major root causes in the context of different construction types.
Temporary work: Because most subcontracting groups hired for temporary work are usually smaller and more financially insecure than other subcontracting groups, they often do not have the wherewithal to educate their workers about safety. This makes managing temporary workers more difficult, and their lack of education about safety is a major root cause of temporary work.
Earth work: Most earth work is conducted in uncertain environments, which leads to numerous changes of plans. When managers control these changes, they usually consider schedules or cost to be the highest priority, which can cause serious problems. Thus, the lack of a manager’s safety consciousness is judged as a major root cause in earth-work accidents.
Frame work, concrete work, and steel work: According to safety experts, the safety education level of workers in frame work, as well as reinforced-concrete work and steel structural work, is commonly poor because these types have the highest percentage of day workers and foreign workers among all construction types. Lack of familiarity with an ever-changing crew as well as language barriers and communication issues may be the basis for why the lack of education about safety is considered to be a major root cause.
Finishing work: Many projects are commonly conducted with insufficient budgets and completion schedules because of an overheated bid market, which greatly influences finishing work, which is postproduction. Thus, as workers of finishing work are often pressed for time, they make mistakes or take unsafe actions in the middle of their work. For this reason, rushing to complete a job on schedule is considered a root cause of accidents in finishing work.
Equipment work: Finally, equipment work is widely recognized as a comparatively safe construction type. Ironically, as workers in equipment work are more educated about their work and have sufficient knowledge of it, their expertise occasionally causes managers to be insensitive to safety and negligently supervise their workers. Therefore, the lack of a manager’s safety consciousness is judged as a major root cause of equipment work. In addition, the ratio of accidents caused by the 11 major combinations has not decreased significantly since 2007 (see Table 9). Especially an observation of the trend of accidents by each combination reveals that the ratio of accidents caused by some combinations, such as UC 4–UA 3, UC 1–UA 11, and UC 1–UA 3, has a rising trend, as shown in Table 9.

6. Conclusions

The construction industry is one of the most hazardous industries in many countries. Many studies have asserted that industrial accidents could be prevented by eliminating their root causes. However, given that accident occurrence processes are considerably complex and often invisible, it is difficult to identify and eliminate the root causes. Based on this recognition, this paper aims to analyze the causality of construction accidents on the basis of direct causes that are classified into UAs and UCs. A logistic regression was applied to examine associations between UAs and UCs and their significances in triggering construction accidents. Then, a Delphi method was applied to determine the relationships between direct and root causes of construction accidents. The results of this paper showed that the primary root cause leading to fundamental problems was root cause 1 (lack of manger’s safety consciousness), followed by root cause 4 (insufficient construction period), and root cause 3 (lack of education about safety). In addition, the combination of UC2‒UA3 and root cause 1 was the most influential. The combination of UC2‒UA3 caused by root cause 3 affected falling significantly, and UC4‒UA3 caused by root cause 4 had the most influence on collapse.
This paper contributes to an improved understanding of the complex causal process of construction accidents, ultimately preventing and/or minimizing fatal accidents in construction. Because the combination of causes that cause accidents directly can be identified through the causal process presented in this paper, effective safety measures to prevent accidents can be established, and recognizing the root causes that cause the critical direct causes will be fundamentally beneficial in preventing accidents in the construction industry. Furthermore, the use of the proposed process would enable practitioners to explore prudent alternatives to eliminate root causes.
Meanwhile, fatal accident data from Korean industry over a 7-year period was analyzed in this paper in order to propose the causal process. Thus, further studies on the basis of more long-term data would ensure the objectivity of the process. In addition, only one-to-one combinations of UCs and UAs were considered in this paper. To this end, the authors are conducting a follow-up study to examine the impact of one-to-many or many-to-many combinations.

Author Contributions

Conceptualization, I.P., S.H. and C.H.; methodology, I.P. and S.H.; software, I.P. and J.K.; validation, I.P. and J.K.; formal analysis, I.P. and S.H.; investigation, I.P. and J.K.; resources, S.H. and C.H.; data curation, I.P. and J.K.; writing—original draft preparation, I.P.; writing—review and editing, S.H., J.K. and C.H.; visualization, I.P. and J.K.; supervision, S.H. and C.H. All authors have read and agreed to the published version of the manuscript.

Funding

This research received no external funding.

Conflicts of Interest

The authors declare no conflict of interest.

References

  1. Suraji, A.; Duff, A.R.; Peckitt, S.J. Development of causal model of construction accident caution. J. Constr. Eng. Manag. 2001, 127, 337–344. [Google Scholar] [CrossRef]
  2. Newaz, M.T.; Davis, P.; Jefferies, M.; Pillay, M. The psychological contract: A missing link between safety climate and safe behavior on construction sites. Saf. Sci. 2019, 112, 9–17. [Google Scholar] [CrossRef]
  3. Chan, A.P.C.; Yang, Y.; Darko, A. Construction accidents in a large-scale public infrastructure project: Severity and prevention. J. Constr. Eng. Manag. 2018, 144, 05018010. [Google Scholar] [CrossRef]
  4. Korea Occupational Health and Safety Agency. Annual Health, Labor and Welfare Report; KOSHA: Ulsan, Korea, 2017. [Google Scholar]
  5. Abdelhamid, T.S.; Everett, J.G. Identifying root causes of construction accidents. J. Constr. Eng. Manag. 2000, 126, 52–60. [Google Scholar] [CrossRef]
  6. Heinrich, H.W. Industrial Accident Prevention. A Scientific Approach, 4th ed.; McGraw-Hill: New York, NY, USA, 1959. [Google Scholar]
  7. Ministry of Health, Labour and Welfare. Annual Health, Labour and Welfare Report 2007–2008; MHLW: Tokyo, Japan, 2008. [Google Scholar]
  8. National Safety Council. Award-winning program. In Accident Prevention Manual for Industrial Operation, 6th ed.; NSC: Washington, DC, USA, 1971. [Google Scholar]
  9. Bird, F. Managment Guide to Loss Control; Institute Press: Atlanta, GA, USA, 1974. [Google Scholar]
  10. Adams, E. Accident causation within the management system. Profl. Saf. 1976, 22, 26–29. [Google Scholar]
  11. Weaver, D.A. Symptoms of operational error. Profl. Saf. 1971, 17, 24–34. [Google Scholar]
  12. Hinze, J.; Pedersen, C.; Fredley, J. Identifying root causes of construction injuries. J. Constr. Eng. Manag. 1998, 124, 67–71. [Google Scholar] [CrossRef]
  13. Laukkanen, T. Construction work and education: Occupational health and safety reviewed. Constr. Manag. Econ. 1999, 17, 53–62. [Google Scholar] [CrossRef]
  14. Haslam, R.A.; Hide, S.A.; Gibb, A.G.F.; Gyi, D.E.; Pavitt, T.; Atkinson, S.; Duff, A.R. Contributing factors in construction accidents. Appl. Ergon. 2005, 36, 401–415. [Google Scholar] [CrossRef] [Green Version]
  15. Chi, C.F.; Yang, C.C.; Chen, Z.L. In-depth accident analysis of electrical fatalities in the construction industry. Int. J. Ind. Ergon. 2009, 39, 635–644. [Google Scholar] [CrossRef]
  16. Chi, S.; Han, S.; Kim, D. Relationship between unsafe working conditions and worker’s behavior and impact of working conditions on injury severity in U.S. construction industry. J. Constr. Eng. Manag. 2013, 139, 826–838. [Google Scholar] [CrossRef] [Green Version]
  17. Chi, C.F.; Chang, T.C.; Ting, H.I. Accident patterns and prevention measures for fatal occupational falls in the construction industry. Appl. Ergon. 2005, 36, 391–400. [Google Scholar] [CrossRef] [PubMed]
  18. Dong, X.; Fujimoto, A.; Ringen, K.; Men, Y. Fatal falls among Hispanic construction workers. Accid. Anal. Prev. 2009, 41, 1047–1052. [Google Scholar] [CrossRef] [PubMed]
  19. Winge, S.; Albrechtsen, E. Accident types and barrier failures in the construction industry. Saf. Sci. 2018, 105, 158–166. [Google Scholar] [CrossRef]
  20. Fabiano, B.; Parentini, I.; Ferraiolo, A.; Pastorino, R. A century of accidents in the Italian industry: Relationship with the production cycle. Saf. Sci. 1995, 21, 65–74. [Google Scholar] [CrossRef]
  21. Unsar, S.; Sut, N. General assessment of the occupational accidents that occurred in Turkey between the years 2000 and 2005. Saf. Sci. 2009, 47, 614–619. [Google Scholar] [CrossRef]
  22. King, G.; Zeng, L. Logistic regression in rare event data. Soc. Political Methodol. 2001, 9, 137–163. [Google Scholar] [CrossRef] [Green Version]
  23. Okoli, C.; Pawlowski, S.D. The delphi method as a research tool: An example, design consideration and application. Inf. Manag. 2004, 42, 15–29. [Google Scholar] [CrossRef] [Green Version]
  24. Skulmoski, G.J.; Hartman, F.T.; Krahn, J. The delphi method for graduate research. J. Inf. Technol. Educ. 2007, 6, 1–21. [Google Scholar] [CrossRef]
  25. Toole, M. Construction site safety roles. J. Constr. Eng. Manag. 2002, 128, 203–210. [Google Scholar] [CrossRef]
  26. Mitropoulos, P.; Abdelhamid, T.S.; Howell, G.A. Systems model of construction accident causation. J. Constr. Eng. Manag. 2005, 131, 816–825. [Google Scholar] [CrossRef]
  27. Choudhry, R.M.; Fang, D. Why operatives engage in unsafe work behavior: Investigating factors on construction sites. Saf. Sci. 2007, 46, 566–584. [Google Scholar] [CrossRef]
Figure 1. Research Framework.
Sustainability 12 03120 g001
Figure 2. Relationship between direct causes and root causes.
Sustainability 12 03120 g002
Figure 3. Causal process of fatal accidents in the construction.
Sustainability 12 03120 g003
Table 1. Modified standards defining UAs and UCs.
IDDescriptionOperational Definition
UA 1Approach to dangerous placeRedefinition of dangerous place (e.g., place where it is meaningless to wear protection)
UA 2Removal of safety devicesRemoving a function or shutdown (adopted from KOSHA)
UA 3Wrong use of protectionAssumption of all sites where workers are equipped with helmet and safety belt are. In the case of fatal falling under 10m, without using safety helmet
UA 4Wrong use of equipmentRedefinition of equipment (e.g., except of protection)
UA 5Repair of equipment in motionRepair, refueling, welding, cleaning, etc. of the machine in operation (adopted from KOSHA)
UA 6Failure of speed control of equipmentSpeeding or slow operation of a machine (adopted from KOSHA)
UA 7Careless handling of dangerous substanceLack of safety measures when handling firearms, explosives, combustibles, and weight (adopted from KOSHA)
UA 8Neglecting unsafe conditionLoad becoming undone while the machine is being operated or poor clearance of the load (adopted from KOSHA)
UA 9Unsafe movementUnsafe posture or unnecessary movement (adopted from KOSHA)
UA 10Defect of supervisionAddition of details (e.g., not following specifications, absence of signaler, etc.)
UA 11OthersUnable to classify as above (adopted from KOSHA)
UC 1Defect of materialAddition of details (e.g., deterioration of material, poor maintenance, wrong design, faulty assembly, etc.)
UC 2Defect of safety devicesRegulation of examples of safety devices (e.g., safety net, guard net, etc.)
UC 3Defect of protectionRegulation of examples of safety devices (e.g., safety helmet, safety belt, isolative tool, etc.)
UC 4Defect of work placeAddition of details (e.g., place where there is a possibility of falling, collapse, being caught between items, stumbling, electric shock)
UC 5Defect of working environmentRegulation of unsuitable temperature and humidity
UC 6Defect of production processAddition of details (e.g., flammable work, explosion work, weight work, etc.)
UC 7Defect of warning signBoundary area unknown or missing (adopted from KOSHA)
UC 8OthersUnable to classify as above (adopted from KOSHA)
Table 2. Frequency analysis of UAs and UCs.
UC 4UC 2UC 1UC 8UC 6UC 7UC 5UC 3Total
UA 36312225127222235
UA 138365030313134
UA 1069171651430115
UA 11614322101157
UA 4621410920043
UA 613338021030
UA 92808000018
UA 700301200015
UA 85052100013
UA 5110230108
UA 2221200007
Total20518914065382396675
Table 3. Chi-square and lambda tests of UA and UC (0 < λ < 1).
UC 4UC 2UC 1UC 8UC 6UC 7UC 5UC 3
UA 30.288 ***0.57 ***0.212 ***0.074 ***N/AN/AN/AN/A
UA 10.226 ***0.217 ***0.359 ***N/AN/AN/AN/AN/A
UA 100.405 ***0.007 ***0.056 ***0.185 ***N/A0.201 ***N/AN/A
UA 11N/AN/A0.315 ***N/AN/AN/AN/AN/A
UA 4N/AN/A0.151 ***0.198 ***0.217 ***N/AN/AN/A
UA 6N/AN/A0.035 ***0.168 ***N/AN/AN/AN/A
UA 9N/AN/AN/AN/AN/AN/AN/AN/A
UA 7N/AN/A0.039 ***N/A0.453 ***N/AN/AN/A
UA 8N/AN/A0.065 ***N/AN/AN/AN/AN/A
UA 5N/AN/A0.042 ***N/AN/AN/AN/AN/A
UA 2N/AN/A0.013 ***N/AN/AN/AN/AN/A
Note: *** p < 0.01, N/A; Not available for lambda analysis because of expected frequency.
Table 4. Combinations of UAs and UCs with a high correlation.
Combinations of UAs and UCsNumber of Accidents
UC2 (Defect of safety device) and UA3 (Wrong use of protection)122 (18.1%)
UC4 (Dangerous place) and UA10 (Defect of supervision)69 (10.2%)
UC4 (Dangerous place) and UA3 (Wrong use of protection)63 (9.3%)
UC1 (Defect of material) and UA1 (Approach to dangerous place) 50 (7.4%)
UC4 (Dangerous place) and UA1 (Approach to dangerous place)38 (5.6%)
UC2 (Defect of safety device) and UA1 (Approach to dangerous place)36 (5.3%)
UC1 (Defect of material) and UA11 (Others)32 (4.7%)
UC1 (Defect of material) and UA3 (Wrong use of protection)25 (3.7%)
UC7 (Defect of warning sign) and UA10 (Defect of supervision)14 (2.1%)
UC6 (Defect of production process) and UA7 (Careless handling of dangerous substance)12 (1.8%)
UC6 (Defect of production process) and UA4 (Wrong use of equipment)9 (1.3%)
Total470 (69.6%)
Table 5. Result of logistic regression regarding falling.
CaseBS.E,WalsSig.Exp(B)
Unsafe Condition 68.7030.000
UC 11.470.46410.0560.0024.351
UC 23.30.50542.6580.00027.104
UC 31.1361.1400.9930.3193.113
UC 40.6720.442.3290.1271.958
UC 51.4620.9192.5320.1124.316
UC 6−0.8140.7371.2220.2690.443
UC 7−0.3250.870.1390.7090.723
Unsafe Action 128.0010.000
UA 10.9880.3876.5320.0112.687
UA 21.2070.9851.5010.2213.344
UA 34.4360.4982.0770.00084.469
UA 41.3120.5156.4890.0113.712
UA 51.0911.0821.0160.3132.977
UA 60.7020.6091.3320.2482.018
UA 7−18.4209739.2830.0000.9980.000
UA 80.770.7661.0110.3152.160
UA 91.7360.7385.7020.0175.827
UA 100.2720.4900.3070.5791.312
Constant−2.8580.54327.6980.0000.057
Table 6. Probability of fatal falling for each combination.
UC 1UC 2UC 3UC 4UC 5UC 6UC 7UC 8
UA 10.4010.8070.3240.2320.4000.0640.1000.134
UA 20.4550.8390.3740.2730.4530.0780.1220.161
UA 30.9550.9920.9380.9050.9540.6820.7780.829
UA 40.4810.8520.3990.2940.4790.0860.1330.176
UA 50.4260.8220.3470.2510.4240.0700.1100.146
UA 60.3350.7580.2650.1850.3330.0490.0770.104
UA 70.0000.0000.0000.0000.0000.0000.0000.000
UA 80.3500.7710.2780.1950.3480.0520.0820.110
UA 90.5930.9010.5100.3960.5910.1290.1950.251
UA 100.2470.6710.1900.1280.2450.0320.0520.070
UA 110.2000.6090.1520.1010.1980.0250.0400.054
Table 7. Summary of experts.
No.Experience (Years)Career
Expert 114Construction Manager
Expert 213General Contractor
Expert 311General Contractor
Expert 410General Contractor
Expert 510Construction Manager
Expert 612Construction Manager
Expert 716Public Officer
Table 8. Major root causes of accidents in the construction industry.
ItemsDescription
Root cause 1Lack of manger’s safety consciousness
Root cause 2Shortage of safety management cost
Root cause 3Lack of education about safety
Root cause 4Insufficient construction period
Root cause 5Unsuitable and too common safety measures
Root cause 6Worker’s excessive work
Root cause 7Shortage of safety climate
Table 9. Trend of probability of accidents by 11 major combinations.
Combinations2007200820092010~2013
UC2-UA330%35%24%15%
UC6-UA74%1%1%2%
UC4-UA1011%9%9%9%
UC4-UA37%22%21%13%
UC1-UA19%3%8%8%
UC4-UA17%3%4%11%
UC2-UA113%5%3%8%
UC1-UA116%4%10%11%
UC6-UA41%1%1%1%
UC1-UA34%5%6%10%
UC7-UA101%3%2%4%
Total93%91%89%92%

