Abstract
We evaluated a teacher training intervention programme aimed at improving the teaching and learning process relating to history in the secondary classroom. This was carried out via the implementation of several teaching units during the period of teaching practice of trainee teachers specialising in geography and history. The design of the teaching units was based on historical thinking competencies and on the introduction of active learning strategies. The programme was evaluated via a quasi-experimental A-B type methodological approach employing a pretest and a post-test. Both tools were designed on the basis of four dimensions (methodology, motivation, satisfaction and perception). The content of the tools was validated using the interjudge process via a discussion group in the first round and with a Likert scale questionnaire (1–4) with seven experts in the second round. The reliability of the tools has been estimated via three indices (Cronbach’s alpha, composite reliability and omega), and the validity of the construct via an exploratory (EFA) and confirmatory factor analysis (CFA) with the structural equation model. The results regarding reliability and validity have been adequate. Furthermore, the descriptive results show an improvement in all of the dimensions following the implementation of the teaching units, particularly with regard to group work, the use of digital resources and work with primary sources.
1. Introduction
1.1. Historical Competencies and Active Learning Methods
The introduction into school curriculums of education competencies has significantly affected the way in which history is approached in the classroom. Since the turn of the century, history as a school subject has been agitated by at least two factors: on the one hand, the profound social changes brought about by the impact of new technologies and the ever more visible effects of globalization; and, on the other hand, the introduction into educational curriculums of competency-based education. The effect of the introduction of competencies can be observed in two fundamental issues: first of all, the dichotomy of competency-based education compared with rote learning and the conceptual model of teaching and assessment of history, which is so common in our context; and, secondly, the difficulty of fitting transversal or general competencies into subjects which have no direct relationship with them and the danger of diffusing the competencies of the subject itself [1].
The epistemological, pedagogical and cognitive bases of each subject must be taken as a point of reference for the application of the education competencies to teaching and learning processes. Pellegrino, Chudowski and Glaser [2] point out that all assessment, without taking into account its purpose, must be upheld by three pillars: a theoretical model on the way in which students represent their knowledge and develop the skills of the subject; the tasks or situations which allow for the observation of those skills; and a method for interpreting these tasks [3,4]. It is therefore necessary, first of all, to define the cognitive model of the learning of history in order to adapt teaching processes and the assessment of competencies to the subject.
Several decades ago, studies on the teaching of history took a cognitive turn [5]—one which was not taken at the same time or at the same pace in all countries. The origin of this change can be traced to the 1970s, at the time when Bruner’s theories and Bloom and Krathwohl’s taxonomies of educational objectives began to have a decisive influence on proposals regarding history teaching. One turning point in achieving this change in history teaching and learning took place in the United Kingdom in 1972 with the educational project History Project 13-16, which later came to be known as the School History Project (SHP). This project had the aim of enabling the learner to “make” history and not just to memorise past events. In other words, the learner was encouraged to develop historical thinking. It had huge repercussions on the teaching of history and on the official curriculum of the United Kingdom. Indeed, it was the origin of some extremely interesting projects in the 1990s, such as Concepts of History and Teaching Approaches [6,7]. Studies on the definition of historical thinking, and the concepts and skills of which it consists, have become widespread throughout the world: in Canada [8,9], the USA [4,10], Australia [11], Spain [12,13], Portugal [14] and the Netherlands [15,16], as well as in Latin America [17,18].
Historical knowledge weds first-order contents, relating to concepts, dates and events, to second-order concepts, such as the handling of historical sources, empathy and historical perspective [9]. It is the second, more complex, type of skills which facilitates the comprehension of history via the simulation of the work of the historian. In VanSledright’s [4] opinion, history is a construct and it must be taught as such. In this sense, history teachers must have a solid theoretical understanding of the formation of historical thinking and understanding in their students, of the way the subject is learned and of the search for markers of cognitive progression.
Furthermore, the development of historical thinking requires a methodological change which favours the active participation of the student in the process of the construction of historical knowledge. In the study by Miralles, Gómez and Rodríguez [19], some of the strategies which can be used during the teacher training process are shown. Among them are case studies (which make it possible to apply historical knowledge, and which help to understand and analyse present-day society), debates and simulations. These strategies are valid for mobilising the three types of knowledge and for work based on the resolution of problems, which enables the establishment of synthetic discourse to facilitate the ordering and structuring of historical information.
Teacher training is an essential element for overcoming the problems of history teaching in compulsory education. The need to train up highly qualified teachers in order to improve teaching and learning processes is a much-debated issue worldwide [20,21]. Despite the fact that there is a broad bibliography on teacher training, certain authors mention the need for greater comparative research, stating that empirical studies in higher education need to be linked systematically with previous results [22,23].
Among the issues dealt with in international studies, the analysis of trainee teachers’ knowledge has become an area of considerable interest and a way of focusing intervention in initial teacher training programmes [24]. The empirical findings of recent years have provided detailed information on how the learning opportunities presented in training programmes have a clear correlation with the knowledge and the competencies of teachers at the end of their training [25,26,27].
Some previous studies have highlighted the importance of analysing the teaching methods and strategies used in history classes, mainly in relation to the use of digital resources [28,29]. Indicators of motivation, satisfaction and perceived learning have often been used to assess potential changes resulting from the inclusion of such resources [30]. Motivation is a crucial factor for academic success and several studies have shown that active learning can improve it [31,32]. The importance of student satisfaction with learning is well documented and is highly related to motivation and commitment [33]. Furthermore, understanding the level of student satisfaction with a course or activity is basic to its design. Finally, perceived learning has been defined as the student’s perceptions of their own levels of ability and knowledge [34]. Therefore, understanding the factors that affect the perception of learning could help future teachers to improve both design and assessment, in order to enhance students’ learning experience. There is therefore a need for studies to identify the factors that affect students’ motivation, satisfaction and perception of learning in history class.
1.2. Research Objectives
The objective of this paper is to analyse the implementation in teaching practice classes of the teaching units designed within a teacher training programme in a master’s degree in secondary education. These teaching units were based on methodological changes (active strategies, the use of debates, group work and digital resources), and on the development of historical competencies (research via primary sources, historical empathy, etc.). In order to achieve this general objective, the following specific objectives were proposed:
SO1: to estimate the reliability of the data collection tools;
SO2: to analyse the validity of the construct of the data collection tools; and
SO3: to evaluate the results obtained in the implementation of the teaching units on the methodology employed, motivation, satisfaction and the perception of learning and social knowledge transfer.
2. Methodology
2.1. Research Approach
A type A-B (pretest–post-test) quasi-experimental approach was chosen. The quasi-experimental design has the aim of evaluating the impact of the treatments in situations in which the subjects are not assigned to the groups in accordance with a random criterion. In this case, the election of the groups was linked to the assignation of the teaching practice centers. A large proportion of education and social research employs this type of approach [35].
2.2. Participants
The intervention was implemented in 18 classes in the autonomous region of Murcia, with the participation of 14 schools (13 state-run and 1 private). The previously designed teaching units were implemented in the four years of compulsory secondary education (12–16 years of age) and in the two years of baccalaureate (16–18 years of age). The sample comprised schools from nine different local councils in the autonomous community: Mazarrón, Cieza, Cartagena, La Unión, Murcia, Molina de Segura, Águilas, San Javier and Alcantarilla. There were 473 secondary pupils who took part in the project (Table 1). Six pupils were eliminated from the sample for not completing more than a third of the items. The selection of the sample was related to the assignation of teaching practice centers of the trainee teachers who would implement the teaching units (Table 2).

Table 1.
Participants in the research according to sex.

Table 2.
Participants in the research according to the academic year in which the teaching units were implemented.
2.3. Design of the Intervention Programme
An intervention programme was designed for the speciality of geography and history in the master’s degree in teacher training, in order to improve the competencies of the future teachers in the design of activities and teaching units. This programme combined epistemological (affecting historical thinking competencies) and methodological (active teaching strategies, research methods, digital resources, etc.) elements. The proposed aim was for the trainee teacher to modify their epistemological concepts (what to teach and why history must be taught) and methodological ideas (how to teach history).
This programme was implemented in the subject entitled “Methods and resources for the teaching of geography, history and the history of art”. The training programme consisted of eight four-hour sessions. The first three were devoted to working with active learning methods: project method, case studies, problem-based learning, simulations, gamification and flipped classroom. The following two sessions were given over to working with primary sources and digital resources. The last three sessions were dedicated to the construction of teaching units, applying the prior theoretical work to the specific teaching unit which would be implemented in the secondary classroom during the students’ teaching practice. The students were required to design teaching units which combined work with historical competencies (working with sources, empathy, causes and consequences, etc.) via active methods and digital resources. Of the trainee teachers, 18 decided to evaluate the implementation of these units in the schools assigned to them for their teaching practice. Specifically, the descriptions of the sessions were as follows:
Session 1: Why is a change in teaching model necessary for Geography and History classes? Analysis of diagnostic and comparative researches with England and Canada. Incidence in epistemological aspects (six competences of historical thinking proposed by Seixas) for the change of didactic model.
Session 2: Inquiry strategies (I). Incidence in the work of inquiry with students (search, selection and analysis of information). Work with cooperative techniques (Aronson puzzle, etc.), use of classroom discussions, communication strategies, Project-Based Learning/Problems, case studies and Service-Learning. Debate on concrete practical examples.
Session 3: Inquiry strategies (II). Simulation strategies (dramatizations, historical perspective, etc.), flipped-classroom, gamification and fieldwork through didactic experimentation itineraries. Debate on concrete practical examples.
Session 4: Primary sources and heritage. Analysis of the usefulness of the use of primary sources in the classroom, work with studies on heritage education, examples of typology of heritage assets, guided work on where to look for primary sources on the web and how to insert them in the teaching units. Specific work on the website of PARES and Carmesí Project of the CARM.
Session 5: Digital resources. Digital competence, web resources, general applications (WebQuest, Wikis, Blog...) and specific applications useful for Geography and History (Google Earth, National Geographic MapMaker Interactive, virtual museums, virtual recreations, etc.). Work with Kahoot and Socrative to introduce gamification.
Session 6: Curriculum frame of the didactic unit. Objectives, contents and competencies.
Session 7: Methodology and activities. Methodological explanation and sequence of activities: initiation-motivation, introduction of knowledge, synthesis and application.
Session 8: Assessment. Procedure, techniques and evaluation instruments. What, who, how and when to assess?
2.4. Data Collection Tool
In order to evaluate the implementation of the teaching units, two tools were designed: one pretest and one post-test (Supplementary document). These tools were designed to address four categories (methodology, motivation, satisfaction and learning), in accordance with other studies which have evaluated training programmes based on active methods such as gamification [36,37,38,39]. The pretest and post-test items were the same. While the pretest evaluates the history classes received by the pupils up to that moment, the post-test evaluates the implementation of the teaching unit designed by the trainee teachers. The first of the subscales, Section 1 (methodology), is composed of 13 items relating to methodology, teaching strategies and resources used by the teacher.
Two items representative of this scale are “The most frequently used resource is the textbook” and “Historical documents are used in the classroom to learn history”. Section 2, concerning student motivation, was composed of 8 items grouped together regarding intrinsic motivation (“The classes motivate me to know more about history”) and extrinsic motivation (“The history classes motivate me because we work in groups”). The third section dealt with student satisfaction and contained 6 items. Learner satisfaction is generally measured by self-reporting on their satisfaction with the learning environment. Sample items of the student satisfaction are: “I am satisfied with the role I have as a learner” or “I am satisfied with the way in which the teacher approaches the topics”. Finally, the fourth section consisted of 13 items relating to perceived learning of historical knowledge and knowledge transfer. This dimension was evaluated through items grouped together regarding the learning of historical knowledge (“In the history classes I learn about the main historical events”) and items grouped together regarding knowledge transfer (“Thanks to the history classes, I am more respectful towards people of other cultures and with opinions which differ from my own”). The questionnaire also included information about background characteristics such as age, gender and teaching grade. Respondents were asked to rate each statement on a five-point Likert scale, anchored between (1) strongly disagree and (5) strongly agree.
The validation of the content was carried out via the interjudge procedure based on the categories of relevance and the clarity of the items of the tool. In the first round, the option was taken to form a discussion group of seven experts (two lecturers in the teaching of the social sciences; two secondary geography and history teachers; two primary social sciences teachers; and one lecturer from the Department of Research Methods and Diagnostics in Education, an expert in research methodology) to validate the content. After the necessary modifications, a second round was carried out with the experts in order to give a definitive validation of the two tools. In this second round we used a validation guide through a Likert 1-4 scale questionnaire (Supplementary material) with the same seven experts. On the first page of the validation instrument, the objective of the pretest and post-test was explained, as well as their function within the objectives of the research project. The validation instrument has three parts: in the first part, the instructions and identification data of the students are evaluated. In the second part, the experts must assess the design and formal aspects of the questionnaire. Finally, the experts must assess the contents of the questionnaire and its relationship to achieving the objectives of the research project. For this, the dimensions of clarity and relevance of the four pretest/post-test subscales were used: methodology, motivation, satisfaction, and learning and transfer. All the items obtained a mean higher than 3. In addition, we calculated the concordance between judges in the dimensions of clarity and relevance. We obtained good concordance results using the Bandigwala’s weighted agreement coefficient (BWN). Specifically, we obtained 0.86 for clarity of the items, and 0.91 for relevance of the items.
2.5. Research Procedure and Data Analysis
Both the procedure designed for the research and the data collection tools were positively evaluated by the ethics committee of the University of Murcia. An informed consent protocol (Supplementary document) was designed for the students and the families of the participants. In order to ensure the reliability of the implementation, a protocol was established with the trainee teachers and their tutors with all the steps to be followed, both in the teaching of the units and the collection of the data via the pretest and post-test.
The data were collected in two separate files (one for each tool), with each teaching unit differentiated from the others with an identification number. The pupils were identified, both in the pretest and the post-test, via a list number which was the same for both tools. In this way, it was possible to carry out an individualised study without gathering any personal information. Once the data had been collected, the R package lavaan was used to carry out the analysis [40].
For this paper, reliability analyses (Cronbach’s alpha, composite reliability and omega) were carried out, along with construct validity analyses (exploratory (EFA) and confirmatory factor analysis (CFA) via structural equation modelling) and descriptive statistics to detail the results of the post-test compared to the pretest in each of the dimensions established (methodology, motivation, satisfaction, perception of learning and social knowledge transfer).
Reliability can be defined as the degree of precision offered by a measurement. In order to be reliable, a scale must have the capacity for exhibiting consistent results in successive measurements of the same phenomenon. It has the objective of determining, in terms of probability, the degree of variation attributable to random or causal errors which are not linked to the construction of the tool. It guarantees the consistency expressed in the determination of the degree of error contained in the application of the scale and, therefore, in the measurement of the phenomenon. We studied the reliability of the two scales used with three indices: Cronbach’s alpha, composite reliability and McDonald’s omega.
With the validity analysis, we hope to analyse a construct in order to visualise the different dimensions which make up a concept via the identification of latent properties and variables (factors). Each factor is represented by the indicators which reach greater correlations.
In order to examine the validation of the construct in more depth, we carried out structural equation modelling (SEM) to confirm the existence of a series of constructs in the questionnaire. With a structural equation model, what is really being done is a logistical regression, in which the dependent variable would be the construct (in this case, each section of the questionnaire), and the items would be the independent variables. By calculating the models, the values of those coefficients can be estimated.
We compared the covariance matrix derived from the variables observed and the covariance matrix reproduced by the model. In this way, it was possible to contrast the hypothesis that the difference between the matrix from the data collected from the questionnaire and the theoretical matrix defined in the conceptual model was not statistically significant. As it was a Likert scale, the assumption of normality was not fulfilled. Therefore, we decided to make a robust estimation of the statistic χ2 via the DWLS (Diagonal Weighted Least Squares) estimator [41].
In order to establish the adjustment indices of the model, we used the Tucker–Lewis index (TLI) values, also known as the Non-Normed Fit Index (NNFI) and Comparative Fit Index (CFI). These take values of between 0 and 1, in which values closer to 1 indicate a good fit [42]. We also considered the RMSEA (Root Mean Square Error of Approximation) value, which measures the absolute difference between the proposed theoretical model and the data observed, taking into account the number of estimators and the sample size [43]. It takes values of between 0 and 1, with values closer to 0 indicating a good fit. Before showing the different adjustment indices, it must be mentioned that there is a certain degree of controversy relating to them, in the sense that there is no established agreement in the scientific community regarding their use. Some authors believe that only the Chi-square should be interpreted. Other authors [44] advocate the cautious use of adjustment measures, due to the fact that their limits can be deceitful if they are used badly.
3. Results
3.1. Reliability Analysis
First of all, we employed the internal consistency method based on Cronbach’s alpha, which makes it possible to estimate the reliability of a measurement tool made up of a set of items, for example a 5-point Likert scale, which we hope will measure the same theoretical dimension (the same construct). In this way, the items are summable in a single score which measures a feature, which is important in the theoretical construction of the tool. The reliability of the scale must always be obtained with the data of each sample to guarantee the reliable measurement of the construct in the specific research sample. We obtained an alpha value of 0.92 in the pretest and 0.92 in the post-test. Both values were considered excellent.
It is also considered important in scales of matrix correlations which are ordinal in nature to offer composite reliability data for each of the critical dimensions, as it analyses the relations between the responses to the items and the latent variable measured, as well as the variance extracted for studying the validity of the scale. The composite reliability coefficient (Composite Reliability) is considered to be more suitable than Cronbach’s alpha because it does not depend on the number of attributes associated with each concept. It is considered that the minimum value should be 0.70 [45].
We obtained an overall composite reliability index of 0.91 in the pretest and 0.92 in the post-test. Both values were considered excellent.
Other authors propose the omega coefficient, also known as Jöreskog’s rho, as it is not affected by the number of items, by the number of alternative responses or by the proportion of variance of the test [46]. The omega coefficient is based on factor loading, which is the weighted sum of the standardised variables. In the pretest, we obtained an omega of 0.721, which is considered acceptable. However, in the post-test, we obtained a lower value (.49), which is considered to be questionable.
Overall, the reliability results for both tools can be considered to be appropriate, although there are some unbalanced elements (Table 3). There are excellent overall results for Cronbach’s Alpha and the composite reliability index (higher than 0.90). Section 2 (motivation) and Section 4 (perception of learning) obtained results of between 0.80 and 0.90 in all of the indices, whereas Section 3 (satisfaction) scored close to 0.80 in all the indices. Section 1 (methodology) was more heterogeneous, with results oscillating between acceptable and questionable.

Table 3.
Summary of the scores obtained in the reliability analysis according to sections and overall.
3.2. Construct Validity: EFA and CFA
3.2.1. Pretest
Before carrying out the analysis, it is recommendable to examine the correlation matrix to search for variables which do not correlate well with any other (with correlation coefficients less than 0.3), and variables which correlate too well with others (variables with some correlation coefficients higher than 0.9). The former should be eliminated from the analysis while the latter can be maintained, albeit taking into account that they may cause problems of multicollinearity. In our case, there were no problems of this kind.
We also carried out Bartlett’s test of sphericity in order to check that it was significant, in other words, that our matrix was not similar to an identity matrix. Indeed, we obtained a p-value of p < 0.05, indicating that the matrix was factorizable.
We also estimated the Keiser–Meyer–Olkin (KMO) coefficient. For the factor analysis (FA) carried out on Sections 1, 2, 3 and 4, all of the KMO coefficients were above 0.7, with values of 0.72, 0.87, 0.80 and 0.90 respectively. It should be remembered that the KMO coefficient is better when it is closer to 1, which indicates that the application here of an FA was correct and that Section 1 was the least stable. When the FA was applied to the questionnaire as a whole, a KMO of 0.91 was obtained.
The overall EFA of the questionnaire demonstrates a distribution in five dimensions, explaining 43% of the total variance (Figure 1).
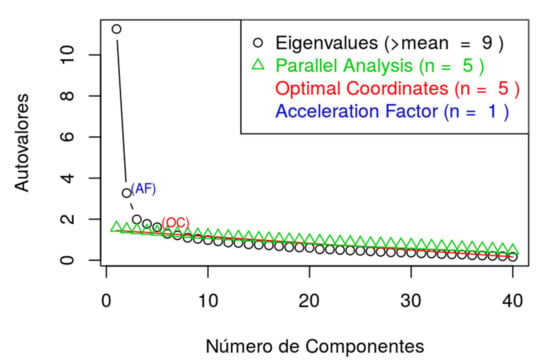
Figure 1.
Numbers of components.
Table 4 shows that Dimension 1 groups together the majority of the items of Sections 3 and 4 (satisfaction and learning of historical contents) and that the remaining items are distributed between the rest of the dimensions. These groupings explain 43% of the variance of the questionnaire.

Table 4.
Components of matrix.
In the following section, we shall perform a more in-depth examination with a confirmatory factor analysis of each section via structural equation modelling.
Section 1
By applying the hypothesis contrast, it could be observed that the DWLS estimator had a statistic of 350.2525565 (robust estimation 386.6210834), with 65 degrees of freedom and a significant p-value (p < 0.05). All of the p-values were significant with the exceptions of items 1 and 4. Therefore, with the exception of these two items, all of the variables were different to zero. That is to say, to a greater or lesser degree, they contributed to the model.
The model with all of the items from the questionnaire did not fit correctly (TLI = 0.82; CFI =.85; RMSEA 1.01). Given that the model did not fit well with the data from Section 1, we proceeded to eliminate the variables which contributed least to the model, which was associated with the internal error of each variable. We eliminated the variables with an internal error greater than 0.85, leaving us with the variables from 1.5 to 1.11 (items relating to innovation methodology), and checked the model again. The model now fitted correctly (TLI = 0.95; CFI = 0.96; RMSEA = 0.08) (Table 5).

Table 5.
Adjustment indices of the model of Section 1.
Figure 2 shows the definition of the structural equation model, in which the two-way arrows represent the covariances between the latent variables (ellipses) and the one-way arrows symbolise the influence of each latent variable (constructs) on their respective observed variables (items). Lastly, the two-way arrows over the squares (items) show the error associated to each observed variable. The three variables which contribute most to the model are 1.9 (use of the internet), 1.11 (use of research in history classes) and 1.8 (use of audio-visual resources).
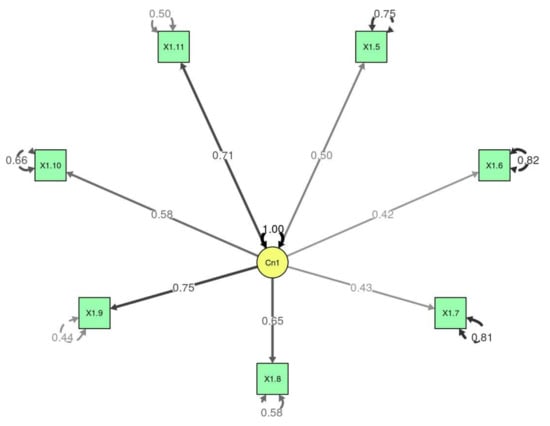
Figure 2.
Structural equation model, Section 1.
Section 2
By applying the hypothesis contrast, it could be observed that the DWLS estimator had a statistic of 82.3929415 (robust estimation 136.8868406), with 20 degrees of freedom and a significant p-value (p < 0.05) (Figure 3). It can be seen that, except for item 2.18 (“History classes only motivate me to pass exams”), all of the p-values were significant, and all of the variables were different to zero; to a greater or lesser extent they contributed to the model. When item 2.18 was eliminated, it was observed that the TLI and CFI were greater than 0.99 (Table 6). Therefore, the model fit well. In this case, there was an RMSEA value of 0.0858781 and a non-significant p-value, which meant that the model did indeed fit well with the data.
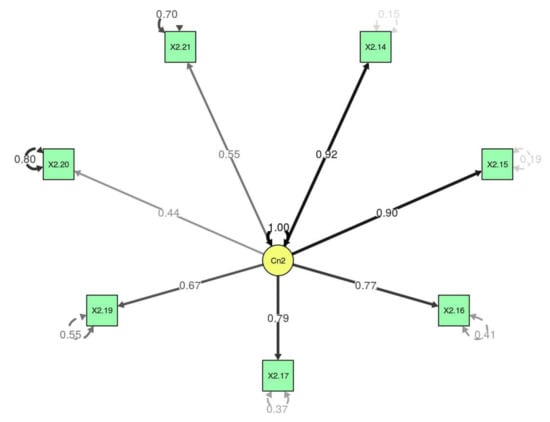
Figure 3.
Structural equation model, Section 2.

Table 6.
Adjustment indices of the model of Section 2.
Section 3
By applying the hypothesis contrast, it could be observed that the DWLS estimator had a statistic of 82.3929415 (robust estimation 136.8868406), with 20 degrees of freedom and a significant p-value (p < 0.05) (Figure 4). All of the p-values were significant, and all of the variables were different to zero; to a greater or lesser extent they contributed to the model. The model with all of the items of the questionnaire did not fit well (TLI = 0.96; CFI = 0.98; RMSEA = 0.1). Given that the model did not fit the data of Section 3, we proceeded to eliminate variable 3.24 (“I am satisfied with the work of my classmates when we work in groups”), which is that which contributed least to the model. In this case, the model fit correctly (TLI = 0.99; CFI = 0.99; RMSEA = 0.05) (Table 7).
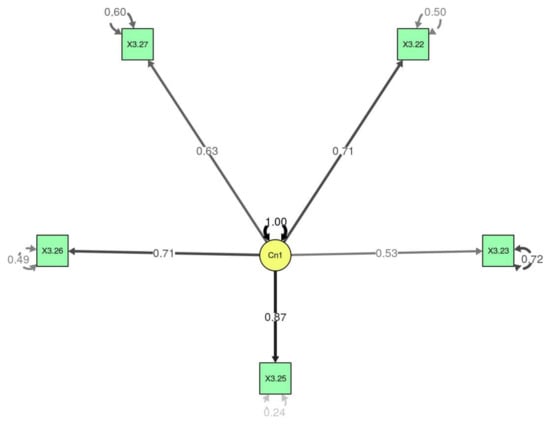
Figure 4.
Structural equation model, Section 3.

Table 7.
Adjustment indices of the model of Section 3.
Section 4
By applying the hypothesis contrast, it could be observed that the DWLS estimator had a statistic of 82.3929415 (robust estimation 136.8868406), with 20 degrees of freedom and a significant p-value (p < 0.05) (Figure 5). All of the p-values were significant and all of the variables were different to zero; to a greater or lesser extent they contributed to the model. It is clear that variables 4.28 and 4.29 (items relating to the knowledge of historical events and figures) are those which contributed most to the model, whereas 4.36 (“I learn to work in groups with my classmates”) contributed almost nothing. The model with all of the items of the questionnaire did not fit correctly (TLI = 0.97; CFI = 0.97; RMSEA = 0.11). Given that the model does not fit well with the data of Section 3, we proceeded to eliminate the variables which contributed least to the model (4.36 and 4.38). In this case, the model fitted better, although the RMSEA was questionable (TLI = 0.98; CFI = 0.98; RMSEA = 0.10) (Table 8).
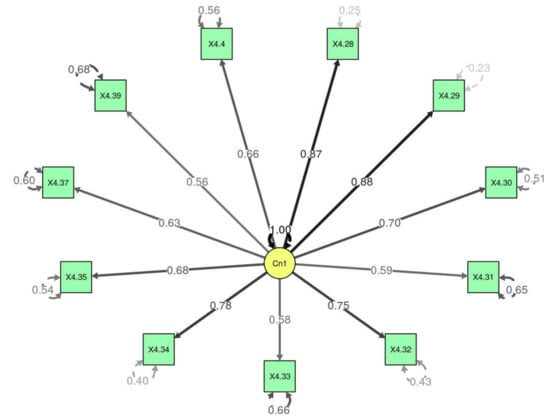
Figure 5.
Structural equation model, Section 4.

Table 8.
Adjustment indices of the model of Section 4.
In conclusion, for Section 1, the SEM eliminated half of the questions, just as the exploratory factor analysis distributed the items of this section into different constructs. For Section 2, the SEM retained all of the items, although it indicated that 2.18 did not contribute to the model. For Section 3, the SEM retained all of the items, with the exception of 3.24, which did not contribute to the model, coinciding completely with the FA, which kept the items together and placed 3.24 in another dimension. Finally, for Section 4, the SEM was not able to fit the model. It indicated that 4.36 and 4.38 did not contribute to the model. Again, this coincided with the FA, which kept the items together and placed those questions in other dimensions, along with 4.39, which is the one which contributed least according to the SEM. In general, it could be observed that the results obtained here were in agreement with those obtained in the general FA, and proposed a division of Section 1, whereas the rest of the sections were better adjusted.
3.2.2. Post-test
In the analysis of the correlation matrix, there were no variables which did not correlate well or with a correlation coefficient greater than 0.9. Likewise, in the Bartlett sphericity analysis, we obtained a p-value of p < 0.05, indicating that the matrix was not similar to the identity matrix. In the FA carried out on Sections 1, 2, 3 and 4, all of the KMO coefficients were close to or above 0.7, with values of 0.68, 0.86, 0.77 and 0.91 respectively. This indicated that the application here of an FA was well considered and that Section 1 was the least stable.
When the EFA was applied to the whole questionnaire, we obtained a distribution in 4 dimensions, explaining 41% of the total variance, with a KMO of 0.92 (Figure 6).
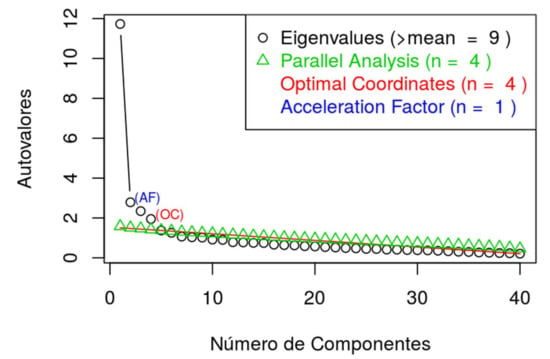
Figure 6.
Numbers of components of post-test.
Table 9 shows that the first dimension groups together many of the items relating to traditional methodology (assessment via different techniques, use of the internet and audio-visual resources, critical work with sources, etc.), with the majority of the items from Sections 2, 3 and 4. The variance explained by a single factor per process is 16%, 43%, 37% and 37%, with Section 1, again, being the most heterogeneous.

Table 9.
Components of post-test matrix.
In the following section, we shall look in more detail at the validation of the construct for each of the sections of the questionnaire.
Section 1
By applying the hypothesis contrast, it could be observed that the DWLS estimator had a statistic of 760.9003772 (robust estimation 693.4870295), with 65 degrees of freedom and a significant p-value (p < 0.05) (Figure 7). In our case, variables 1.13, 1.12 and 1.6 were those which contributed most to the model.
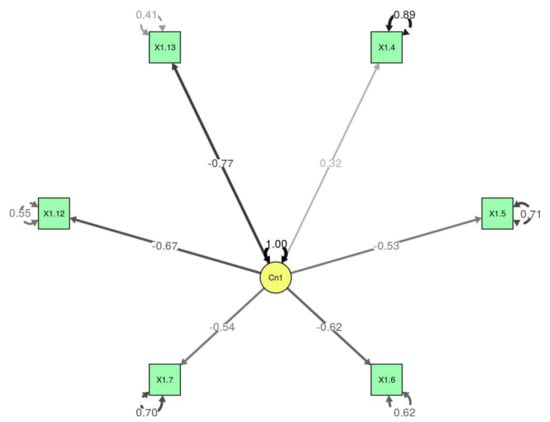
Figure 7.
Structural equation model, Section 1.
The model with all of the items from Section 1 did not fit correctly (TLI = 0.57; CFI = 0.64; RMSEA = 0.16). Given that the model did not fit well with the data of Section 1, we proceeded to eliminate the variables which contributed least to the model. We eliminated the variables with an internal error greater than 0.80 and checked the model again. We eliminated 7 variables: 1.1, 1.2, 1.3, 1.8, 1.9, 1.10 and 1.11. In this way, it was possible to achieve a better fit of the model (Table 10), although the RMSEA was questionable (TLI = 0.92, CFI = 0.95; RMSEA = 0.1). In this model, the items relating to innovative methodology had a negative load (1.5, 1.6, 1.7, 1.12 and 1.13), whereas item 1.4 (“In order to pass, I learn the contents by rote”) had a positive load.

Table 10.
Adjustment indices of the model of Section 1.
Section 2
By applying the hypothesis contrast, it could be observed that the DWLS estimator had a statistic of 96.2166894 (robust estimation 161.1879894), with 20 degrees of freedom and a significant p-value (p < 0.05) (Figure 8). With the exception of item 2.18, all of the p-values were significant, and all of the variables were different to zero and, to a greater or lesser extent, contributed to the model. It could be seen that variables 2.14, 2.15 and 2.16 (“The classes motivate me to learn history, to make an effort and to understand social reality”) were those which contributed most to the model, whereas item 2.18 (“History classes only motivate me to pass the exams”) contributed nothing. The model with all of the items of the section fit correctly (TLI = 0.98; CFI = 0.98; RMSEA = 0.09) (Table 11).
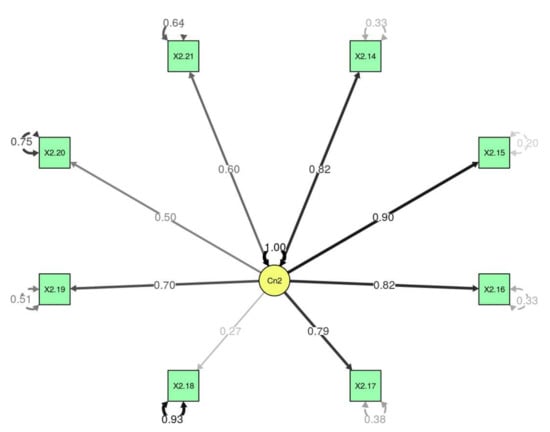
Figure 8.
Structural equation model, Section 2.

Table 11.
Adjustment indices of the model of Section 2.
Section 3
By applying the hypothesis contrast, it could be observed that the DWLS estimator had a statistic of 96.2166894 (robust estimation 161.1879894), with 20 degrees of freedom and a significant p-value (p < 0.05) (Figure 9). All of the p-values were significant, all of the variables were different to zero and, to a greater or lesser extent, they contributed to the model. Variables 3.22, 3.23 and 3.25 (“I am satisfied with my role in the classroom and with the working atmosphere in the classroom”) were those which contributed most to the model. The model with all of the items from Section 3 fit correctly, albeit with a questionable RMSEA (TLI = 0.96; CFI = 0.97; RMSEA = 1) (Table 12).
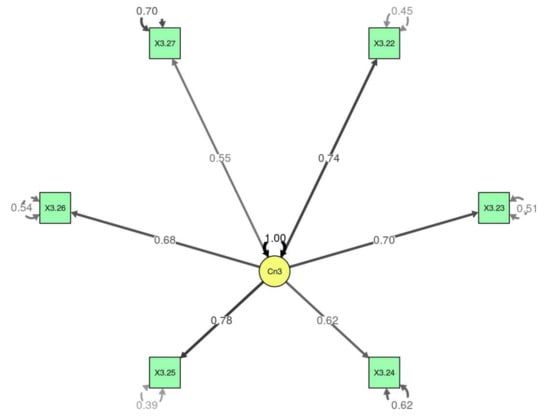
Figure 9.
Structural equation model, Section 3.

Table 12.
Adjustment indices of the model of Section 3.
Section 4
By applying the hypothesis contrast, it could be observed that the DWLS estimator had a statistic of 96.2166894 (robust estimation 161.1879894), with 20 degrees of freedom and a significant p-value (p < 0.05) (Figure 10). All of the p-values were significant, all of the variables re different to zero and, to a greater or lesser extent, they contributed to the model. Variables 4.28, 4.32 and 4.40 (“I have learnt about the main historical events, changes and continuities and to debate issues relating to current affairs”) were those which contributed most to the model, whereas item 4.36 (“I have learnt to carry out group work”) hardly contributed anything. When item 4.36 was eliminated, the model fit correctly (TLI = 0.97; CFI = 0.98; RMSEA = 0.08) (Table 13).
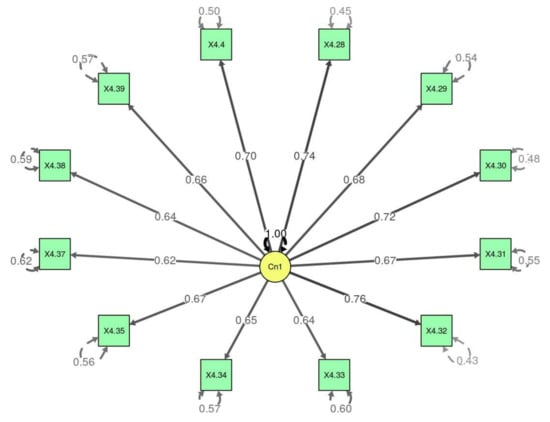
Figure 10.
Structural equation model, Section 4.

Table 13.
Adjustment indices of the model of Section 4.
In conclusion, for Section 1, the SEM eliminated half of the questions, leaving 6 of the initial 13, just as the factor analysis distributed the items from this section into different constructs. For Section 2, the SEM retained all of the items, although it indicated that 2.18 did not contribute to the model. The FA kept the items together, although it moved 2.18 to one dimension and 2.20 to another, with the latter being the second least-explained item in the SEM. For Section 3, the SEM retained all of the items, coinciding completely with the FA, which kept all of the items together, with the exception of 3.24, which contributed little to the SEM model and was placed in another dimension. Finally, for Section 4, the SEM retained all of the items, with the exception of 4.36. Again, it coincided with the FA in this aspect, although the FA also removed 4.37 and 4.38. In general, it can be observed that the results obtained here were in agreement with those obtained in the general FA and proposed a division of Section 1.
3.3. Descriptive Results
As can be appreciated in Table 14, items relating to traditional methodology scored less well in the post-test, unlike items grouped with innovative methodology. A particular difference can be noted for textbooks and the use of exams, with more than a point of difference. The pupils evaluated positively the use of information technology, group work and the introduction of strategies related to historical methodology (the use of sources, research, simulations, critical evaluation, etc.) in the teaching units. There is more than a point of difference in the items relating to group work, carrying out research, the use of the internet and the use of simulations and dramatizations.

Table 14.
Differences of averages between the pretest and post-test in the evaluation of the methodology.
Table 15 shows a more positive evaluation of motivation (particularly intrinsic motivation) in the teaching units implemented. Specifically, the pupils valued motivation via group work, being able to contribute their own point of view and their own knowledge and the motivation brought about by the use of digital resources. The three items with the biggest difference in scores were motivation due to group work, having used resources other than the textbook and being able to give their point of view.

Table 15.
Differences of averages between the pretest and post-test in the evaluation of motivation.
4. Results Regarding the Perception of Satisfaction
Table 16 shows a more positive evaluation of satisfaction in the teaching units implemented compared with the history classes the pupils had received beforehand. They expressed particular satisfaction with the way in which the teacher approached the topics in the classroom, with group work and with the positive atmosphere in the classroom.

Table 16.
Differences of averages between the pretest and post-test in the evaluation of satisfaction.
5. Results Regarding Perception of Learning of Historical Knowledge and its Social Transfer
Table 17 shows a more positive evaluation of historical knowledge and the transfer thereof in the teaching units implemented compared with the history classes which the pupils had received beforehand. The pupils particularly valued the transfer of knowledge thanks to the different ways of using IT, the transfer of learnt knowledge to be more respectful towards other cultures and opinions and the transfer relating to debating and understanding current affairs. The improvement in the perception of the learning of historical knowledge is more moderate (approximately 0.3 improvement), with the exception of the use of documents and primary sources, which represented an improvement of 0.7. The improvement in the items grouped together regarding the transfer of knowledge was higher (0.7).

Table 17.
Differences of averages between the pretest and post-test in the evaluation of learning and social transfer of knowledge.
6. Discussion and Conclusions
The results show an improvement in the evaluation of history classes by secondary school pupils following the implementation of the teaching units based on historical thinking competencies and on a methodological change. The items relating to the carrying out of group work, research, the development of simulations in the classroom and the use of documents and historical sources are those which received a higher score. On the other hand, the pre-eminent use of textbooks and assessment based on written exams and rote learning fell.
As far as the category relating to motivation is concerned, once again, extremely positive results were obtained. The pupils expressed the view that the classes motivated them to learn and make more of an effort, not only to achieve better marks or to pass the exams, but also to know more about history. Also worthy of note is the idea that the pupils considered that they were able to contribute their own opinions and, above all, to carry out projects in groups. These results are in line with other work that has concluded that support for autonomy, class structure, and active participation contribute to improved student motivation [47,48].
As far as the category relating to satisfaction is concerned, all of the items in the questionnaire demonstrated an increase in this aspect when active methods are employed in the classroom and the learners see another way of teaching and learning about history. In direct relation to this aspect, the way in which the topics are approached in class stands out. These results are consistent with studies by Burgess, Senior and Moores [49] and Langan and Harris [50] who found organization, classroom management and teaching quality impacts on and is related to student satisfaction.
Lastly, regarding the category of perception of learning and knowledge transfer, the pupils gave positive evaluations in all of the items. Again, working in groups was the aspect which received the best score, although the different uses of information technologies and the use of documents and historical sources in the classroom also stand out [19,40]. These results show that learner-content interaction and learner-instructor interaction are critical factors in student satisfaction and perceived learning [33]. On the other hand, the use of digital resources and active learning have shown an increase in perceived learning in previous works and have also been related to increased motivation [51].
The use of active learning methods in conjunction with the theory of historical thinking reflects positively on the effects of this programme in classroom methodology. This is clearly reflected in the pupils’ perception, with a decrease being evident in aspects relating to traditional methodology and an increase in innovative methodology. It is extremely revealing that the programme had better results in intrinsic, rather than extrinsic, motivation. This marks a path which can be followed for the ongoing improvement of history classes. The pupils proved to be more motivated in their classes due to the mere fact of wanting to learn about history, rather than passing their exams or increasing their marks.
Equally relevant was the effect on the pupils’ level of satisfaction. The perception shown is that the training programme also increased the appreciation of the pupils with regard to new ways of working in the classroom. Last of all, the effects of the programme again showed a positive response on the part of the learners as far as the perception of learning of historical knowledge and its social transfer are concerned. The latter aspect is of particular importance as the items related to the use and application of historical knowledge in the pupils’ daily lives acquired a higher score than the items related to the learning of historical knowledge, although this also received a positive evaluation.
Supplementary Materials
The following are available online at https://www.mdpi.com/2071-1050/12/8/3124/s1, Figure S1: title, Table S1: title, Video S1: title.
Author Contributions
Conceptualization, C.J.G.-C., P.M.-M. and J.R.-M.; methodology, C.J.G.-C., P.M.-M. and J.R.-M.; software, C.J.G.-C. and J.R.-M.; validation, J.R.-M., C.J.G.-C. and P.M.-M.; formal analysis, J.R.-M., C.J.G.-C. and I.A.-D.; investigation, C.J.G.-C. and P.M.-M.; data curation, J.R.-M. and C.J.G.-C.; writing—original draft preparation, J.R.M, C.J.G.-C. and I.A.-D.; writing—review and editing, I.A.-D. and P.M.-M.; project administration, P.M.-M. and C.J.G.-C.; funding acquisition, C.J.G.-C. and P.M.-M. All authors have read and agreed to the published version of the manuscript.
Funding
This article has been possible thanks to the research project “Methodological concepts and active learning methods for the improvement of teaching competencies” (PGC2018-094491-B-C33), funded by Ministry of Science, University and Innovation, co-funded by FEDER, and project “Teacher competencies and active learning methods. An evaluative research with trainee teachers of social sciences” (20638/JLI/18), funded by Seneca Foundation. Agency of Science and Technology from Region of Murcia.
Acknowledgments
We want to thank teachers, school managers and the institutions that participated for their collaboration.
Conflicts of Interest
The authors declare no conflict of interest.
References
- Gómez-Carrasco, C.J.; Ortuño-Molina, J.; Miralles-Martínez, P. Enseñar Ciencias Sociales con Métodos Activos de Aprendizaje, Reflexiones y Propuestas a Través de la Indagación; Octaedro: Barcelona, Spain, 2018. [Google Scholar]
- Pellegrino, J.W.; Chudowski, N.; Glaser, R. Knowing What Students Know: The Science and Design of Educational Assessment; National Academies Press: Washington, DC, USA, 2001. [Google Scholar]
- Gómez, C.J.; Miralles, P. Historical Skills in Compulsory Education: Assessment, Inquiry Based Strategies and Argumentation. New Approaches Educ. Res. 2016, 5, 139–146. [Google Scholar]
- VanSledright, B.A. Assessing Historical Thinking and Understanding, Innovation Design for New Standards; Routledge: New York, NY, USA, 2014. [Google Scholar]
- Carretero, M.; López, C. Estudios cognitivos sobre el conocimiento histórico: Aportaciones para la enseñanza y alfabetización histórica. Enseñanza de las Ciencias Sociales 2009, 8, 79–93. [Google Scholar]
- Lee, P. Putting Principles into Practice: Understanding History. In How Students Learn: History in the Classroom; Donovan, M.S., Bransford, J.D., Eds.; National Academies Press: Washington, DC, USA, 2005. [Google Scholar]
- Lee, P.; Ashby, R. Progression in Historical Understanding Among Students Ages 7–14. In Knowing, Teaching, and Learning History: National and International Perspectives; Stearns, P.N., Seixas, P., Wineburg, S., Eds.; University Press: New York, NY, USA, 2000. [Google Scholar]
- Clark, P. New Possibilities for the Past, Shaping History Education in Canada; UBC Press: Vancouver, BC, Canada, 2011. [Google Scholar]
- Seixas, P.; Morton, T. The Big Six Historical Thinking Concepts; Nelson College Indigenous: Toronto, ON, Canada, 2013. [Google Scholar]
- Wineburg, S. Historical Thinking and other Unnatural Acts, Charting the Future of Teaching the Past; Temple University Press: Philadelphia, PA, USA, 2001. [Google Scholar]
- Parkes, R.J.; Sharp, H. Nietzschean perspectives on representations of national history in Australian school textbooks: What should we do with Gallipoli? Ensayos Revista de la Facultad de Educación de Albacete 2014, 29, 159–181. [Google Scholar]
- López-Facal, R. La LOMCE y la competencia histórica. Ayer 2014, 94, 273–285. [Google Scholar]
- Martínez-Hita, M.; Gómez, C.J. Nivel cognitivo y competencias de pensamiento histórico en los libros de texto de Historia de España e Inglaterra. Un estudio comparativo. Revista de Educación 2018, 379, 145–169. [Google Scholar]
- Barca, I. Till New Facts Are Discovered: Students’ Ideas About Objectivity in History. In International Review of History Education, Vol. 4, Understanding History: Recent Research in History Education; Ashby, R., Gordon, P., Lee, P., Eds.; Routledge Falmer: New York, NY, USA, 2005. [Google Scholar]
- Van Drie, J.; Van Boxtel, C. Historical reasoning: Towards a framework for analyzing student’s reasoning about the past. Educ. Psychol. Rev. 2008, 20, 87–110. [Google Scholar] [CrossRef]
- Van Boxtel, C.; Grever, M.; Klein, S. Heritage as a Resource for Enhancing and Assessing Historical Thinking: Reflections from the Netherlands. In New Directions in Assessing Historical Thinking; Ercikan, K., Seixas, P., Eds.; Routledge: New York, NY, USA, 2015. [Google Scholar]
- Mora, G.; Ortiz, R. El modelo de educación histórica. Experiencias de innovación en la Educación Básica de México. Ensayos Revista de la Facultad de Educación de Albacete 2012, 11, 87–98. [Google Scholar]
- Schmidt, M.A. Jóvenes brasileños y europeos: Identidad, cultura y enseñanza de la historia (1998–2000). Enseñanza de las Ciencias Sociales 2005, 4, 53–64. [Google Scholar]
- Miralles, P.; Gómez, C.J.; Rodríguez, R. Patrimonio, competencias históricas y metodologías activas de aprendizaje. Un análisis de las opiniones de los docentes en formación en España e Inglaterra. Estudios Pedagógicos 2017, 43, 161–184. [Google Scholar] [CrossRef]
- Cochran-Smith, M.; Zeichner, K.M. Studying Teacher Education: The Report of the AERA Panel on Research and Teacher Education; Routledge: New York, NY, USA, 2005. [Google Scholar]
- Darling-Hammond, L.; Bransford, J.D. Preparing Teachers for a Changing World: What Teachers Should Learn and Be Able to Do; Jossey-Bass: San Francisco, CA, USA, 2005. [Google Scholar]
- König, J.; Ligtvoet, R.; Klemenz, S.; Rothland, M. Effects of opportunities to learn in teacher preparation on future teachers’ general pedagogical knowledge: Analyzing program characteristics and outcomes. Stud. Educ. Eval. 2017, 53, 122–133. [Google Scholar] [CrossRef]
- Schmidt, W.H.; Blömeke, S.; Tatto, M.T. Teacher Education Matters, A Study of the Mathematics Teacher Preparation from Six Countries; Teacher College Press: New York, NY, USA, 2011. [Google Scholar]
- Darling-Hammond, L. Assessing teacher education. The usefulness of multiple measures for assessing program outcomes. J. Teach. Educ. 2006, 57, 120–138. [Google Scholar] [CrossRef]
- Konig, J.; Blomeke, S. Future Teachers’ General Pedagogical Knowledge from Comparative Perspective. Does School Experience Matter? ZDM Int. J. Math. Educ. 2012, 44, 341–354. [Google Scholar] [CrossRef]
- Blomeke, S.; Suhl, U.; Kaiser, G.; Dohrmann, M. Family background, entry selectivity and opportunities to learn: What matters in primary teacher education? An international comparison of fifteen countries. Teach. Teacher Educ. 2012, 28, 44–55. [Google Scholar] [CrossRef]
- Schimdt, W.H.; Cogan, L.; Houang, R. The role of opportunity to learn in teacher preparation: An international context. J. Teach. Educ. 2011, 62, 138–153. [Google Scholar] [CrossRef]
- Ibáñez, A.; Vicent, N.; Asensio, M. Aprendizaje informal, patrimonio y dispositivos móviles. Evaluación de una experiencia en educación secundaria. Didáctica de las Ciencias Experimentales y Sociales 2012, 26. [Google Scholar] [CrossRef]
- Miralles, P.; Gómez, C.J.; Arias, V.B.; Fontal, O. Digital resources and didactic methodology in the initial training of history teachers. Comunicar 2019, 61, 45–56. [Google Scholar] [CrossRef]
- Maloy, J.; Fries, L.; Laski, F.; Ramirez, G. Seductive details in the flipped classroom: The impact of interesting but educationally irrelevant information on student learning and motivation. CBE Life Sci. Educ. 2019, 18, 3. [Google Scholar] [CrossRef]
- Armbruster, P.; Patel, M.; Johnson, E.; Weiss, M. Active learning and student-centered pedagogy improve student attitudes and performance in introductory biology. CBE Life Sci. Educ. 2009, 8, 203–213. [Google Scholar] [CrossRef]
- Hospel, V.; Galand, B. Are both classroom autonomy support and structure equally important for students’ engagement? A multilevel analysis. Learn. Instruct. 2016, 41, 1–10. [Google Scholar] [CrossRef]
- Alqurashi, E. Predicting student satisfaction and perceived learning within online learning environments. Distance Educ. 2019, 40, 133–148. [Google Scholar] [CrossRef]
- Alavi, M.; Marakas, G.M.; Youngjin, Y. A Comparative Study of Distributed Learning Environments on Learning Outcomes. Inf. Syst. Res. 2002, 4, 404–415. [Google Scholar] [CrossRef]
- Fernández, P.; Vallejo, G.; Livacic, P.; Tuero, E. Validez Estructurada para una investigación cuasi-experimental de calidad. Se cumplen 50 años de la presentación en sociedad de los diseños cuasi-experimentales. Anales de Psicología 2014, 30, 756–771. [Google Scholar]
- Da Rocha, L.; Sandro, A.; De Melho, I. Effectiveness of gamification in the engagement of students. J. Comput. Hum. Behav. 2016, 58, 48–63. [Google Scholar] [CrossRef]
- De Marcos, L.; García-López, E.; García-Cabot, A. On the effectiveness of game-like and social approaches in learning: Comparing educational gaming, gamification & social networking. Comput. Educ. 2016, 95, 99–113. [Google Scholar]
- Han-Huey, C.; Kofinas, A.; Luo, J. Enhancing student learning experience with technology-mediated gamification: An empirical study. Comput. Educ. 2018, 121, 1–17. [Google Scholar]
- Hanus, M.D.; Fox, J. Assessing the effects of gamification in the classroom: A longitudinal study on intrinsic motivation, social comparison, satisfaction, effort and academic performance. Comput. Educ. 2015, 80, 152–161. [Google Scholar] [CrossRef]
- Rosseel, Y. lavaan: An R package for structural equation modeling. J. Stat. Softw. 2012, 48, 1–36. [Google Scholar] [CrossRef]
- Beaujean, A.A. Latent Variable Modeling Using R: A Step-By-Step Guide; Routledge: New York, NY, USA, 2014. [Google Scholar]
- Kenny, D.A. Structural Equation Modeling; SAGE: Thousand Oaks, CA, USA, 2012. [Google Scholar]
- Steiger, J.H. Structural model evaluation and modification: An interval estimation approach. Multivar. Behav. Res. 1990, 25, 173–180. [Google Scholar] [CrossRef]
- Hayduk, L.; Cummings, G.; Boadu, K.; Pazderka-Robinson, H.; Boulianne, S. Testing! Testing! One, two, three—Testing the theory in structural equation models! Personal. Individ. Differ. 2007, 42, 841–850. [Google Scholar] [CrossRef]
- Hair, J.F., Jr.; Black, W.C.; Babin, B.J.; Anderson, R.E. Multivariate Data Analysis, 7th ed.; Pearson Prentice Hall: Upper Saddle River, NJ, USA, 2009. [Google Scholar]
- Ventura-León, J.L.; Caycho-Rodríguez, T. El coeficiente omega: Un método alternativo para la estimación de la confiabilidad. Revista Latinoamericana de Ciencias Sociales Niñez y Juventud 2017, 15, 625–627. [Google Scholar]
- Ahn, I.; Patrick, H.; Chiu, M.M.; Levesque-Bristol, C. Measuring teacher practices that support student motivation: Examining the factor structure of the teacher as social context questionnaire using multilevel factor analyses. J. Psychoeduc. Assess. 2019, 37, 743–756. [Google Scholar] [CrossRef]
- Owens, D.C.; Sadler, T.D.; Barlow, A.T.; Smith-Walters, C. Student motivation from and resistance to active learning rooted in essential science practices. Res. Sci. Educ. 2020, 50, 253–277. [Google Scholar] [CrossRef]
- Burgess, A.; Senior, C.; Moores, E. A 10-year case study on the changing determinants of university student satisfaction in the UK. PLoS ONE 2018, 13, 1–15. [Google Scholar] [CrossRef] [PubMed]
- Langan, A.M.; Harris, W.E. National student survey metrics: Where is the room for improvement? High. Educ. 2019, 78, 1075–1089. [Google Scholar] [CrossRef]
- Makransky, G.; Lilleholt, L. A structural equation modeling investigation of the emotional value of immersive virtual reality in education. Educ. Technol. Res. Dev. 2018, 66, 1141–1164. [Google Scholar] [CrossRef]
© 2020 by the authors. Licensee MDPI, Basel, Switzerland. This article is an open access article distributed under the terms and conditions of the Creative Commons Attribution (CC BY) license (http://creativecommons.org/licenses/by/4.0/).