Article

An Evaluation of the Ceiling Depth’s Impact on Skylight Energy Performance Predictions Through a Building Simulation

Department of Architectural Engineering, University of Ulsan, Ulsan 44610, Korea
*
Author to whom correspondence should be addressed.
Sustainability 2020, 12(8), 3117; https://doi.org/10.3390/su12083117
Submission received: 20 March 2020 / Revised: 10 April 2020 / Accepted: 10 April 2020 / Published: 13 April 2020
(This article belongs to the Section Energy Sustainability)

Abstract

:
This study evaluated the impact of including a building ceiling depth into a simulation model on skylight efficiency under two climatic conditions (Ulsan and Seoul, South Korea). Using Radiance and EnergyPlus simulation tools integrated in OpenStudio program by National Renewable Energy Laboratory, Golden, Colorado, USA, daylighting and building energy consumption were computed and assessed to evaluate the energy performance and optimization of skylights. Skylight-to-roof ratios from 1% to 25% were analyzed with ceiling depths of 1.5 m to 3 m. The results showed that the range for efficient skylight ratios became smaller with an increase of ceiling depth; in addition, small apertures were more affected by the ceiling depth than were large apertures. Under Ulsan’s climatic conditions, the optimal skylight-to-roof ratios were 8%, 9%, 10%, and 11% for ceiling depths of 1.5 m, 2 m, 2.5 m, and 3 m, respectively. In Seoul, 8% and 9% were the optimum skylight-to-roof ratios for ceiling depths of 1.5 m and 2 m, respectively; no skylight was energy efficient for a ceiling deeper than 2 m. This study indicates that ceiling depth is a critical factor in the evaluation of skylight performance; thus, it should not be excluded from a simulation model, as is often done to simplify simulation modeling.

1. Introduction

Because of ongoing energy crises in many countries, the use of natural light in buildings is becoming a necessity rather than just a preference. In addition to reducing the lighting energy consumption of a building, natural light is reported to enhance occupants’ moods and increase productivity in workplaces [1]. Among the various daylighting systems available today, top-lighting is widely used due to its ability to provide daylight with a fairly homogeneous illuminance distribution in spaces lacking facades or in deep rooms where daylight from side lighting cannot sufficiently reach the rear area of the space. In addition, the wide variety of top-lighting strategies allow the system to be used for both aesthetic and energy-efficiency purposes [2,3]. Furthermore, the usefulness of top-lighting is expected to increase with the current urbanization rate. Sidker et al. [4,5], investigated urban energy optimization and suggested that for clustered buildings, case of a newly developing city, building shape, envelop, rooftops, orientation, and all other building regulations should be given more attention to efficiently reduce energy consumption.
In a study that aimed to improve daylighting performance in deep-plan buildings [6], the authors reported that top-openings can be an effective way to bring sufficient natural light into the deep areas of buildings in crowded cities, where buildings tend to be clustered together. Unlike a monitor skylight or light scoop, a horizontal skylight is a popular top-lighting configuration because of its simple construction and ability to provide enough natural light, even from the less-than-ideal sky conditions.
Many studies on the role of top-opening systems in building sustainability can be found in the literature [7]. One study investigated the optimum proportions of lightscoop skylights to ensure maximum illuminance in a given room, concluding that a lightscoop height-to-width ratio of 4:3 produces suitable daylighting, regardless of the reflector shape [8]. In addition, the effectiveness of top-lighting in the reduction of building energy consumption has been validated and quantified by several researchers. Some studies used physical models to assess the impacts of skylights on building energy demands, whereas others have predicted building lighting and thermal loads using computer simulation programs such as Lightscape developed by Autodesk research team in California, Daysim by National Research Council of Canada, Radiance by Lawrence Berkeley National Lab (LBNL)-Berkeley, CA, EnergyPlus by National Renewable Energy Lab (NREL)-Golden, Colorado and LBNL-Berkeley, CA, and other validated simulation tools. For example, a study on the effects of skylight and clerestory design on building energy performance, through the use of EnergyPlus and Radiance software programs, reported that an optimum skylight-to-ceiling ratio was 3% in terms of energy efficiency for the specific building design and location considered [9]. The results of this study were in good agreement with the findings of another study, which reported that skylight openings ranging from 3% to 14% of the ceiling area could reduce building energy consumption by up to 19% [10].
Skylights have been used in the architectural and construction industries for some time, and researchers have quantified and validated their potential for building sustainability. Due to their convenience and easy manipulation of study variables, computer simulations have been widely used in most investigations due to their optimum skylight shape and configuration [11], orientation [12], and glazing properties [13]. Generally, a building envelope’s cross-sectional details are rarely considered during simulation modeling; instead, they are used as input values mostly to define a building’s thermal properties. This modeling uncertainty mainly caused by the simplifications and assumptions made during simulations has been reported to be one of the sources of inaccurate predictions from building energy simulation tools [14]. With such simulation settings, how much of the transmitted solar heat gains and visible light are reflected in the simulation predictions can be scientifically determined and discussed. Unlike side windows, skylights are installed in a deep layering scheme containing the building’s structure, systems such as ventilation and electric lighting, and a hung-ceiling layer. Therefore, studies are needed to quantify the impact of modeling simplification on simulation predictions in order for designers and various researchers to make good use of the findings in the literature. With knowledge of how much the predicted energy performance of a skylight is altered by real ceiling depth, designers can direct their focus on other important aspects such as the cost and feasibility of possible adjustment of the ceiling depth by integrating two or more building functioning systems into one layer.
The purpose of this study was to quantify and parametrically analyze the impact of the no-thickness assumption for building envelop in computer simulation programs by applying a ceiling depth on horizontal skylight. Both the building energy and adequate daylighting were analyzed to account for the transmitted solar heat gains (reflected in cooling and heating energy consumption) and visible light (reflected in lighting energy consumption and suitable daylighting). In addition, optimization of the skylight design was performed for a typical building ceiling depth. Furthermore, because climatic conditions have been shown to play a critical role in a skylight’s energy efficiency [10,15], this study was conducted for two different cities in South Korea: Ulsan and Seoul. South Korea is mainly divided into three climate zones: central, southern, and Jeju. According to Köppen classification, the central climate zone is classified as Dwa characterized by cold-dry winter and hot summer while the southern and Jeju climate zones are classified as Cfa (temperate region, humid year-round, and hot summer) [16]. Given that the central and southern zones make the biggest part of the country, the two cities used in this study, Seoul and Ulsan, were selected from the central and southern climate zones, respectively, as is shown in Figure 1. The heating degree days (HDD) for Ulsan and Seoul are 2013.9 and 2626.8, respectively, whereas their cooling degree days (CDD) are 659.4 and 881.2, respectively [17].

2. Research Methods

This study evaluated the impact of ceiling depth on horizontal skylight energy performance predictions through building energy simulation programs. Through OpenStudio’s integrated Radiance and EnergyPlus, the study assessed the difference in building energy consumption by including the building ceiling depth into simulation model. The study started by identifying the importance of SRR (the Skylight-to-roof ratio) and ceiling depth on building energy performance through a sensitivity analysis. After confirming the SRR and ceiling depth influence, the study was proceeded in three different stages as illustrated by the flowchart in Figure 2. First, the energy performance of different SRRs was evaluated using the commonly made assumption of no ceiling depth during simulation modeling, and alternatives for energy efficient SRRs were defined. Next, based on the actual building ceiling depth, a new energy evaluation was performed for the pre-defined energy-efficient skylight. Finally, daylight qualitative evaluation and integrated optimization were performed for both locations (Ulsan and Seoul).

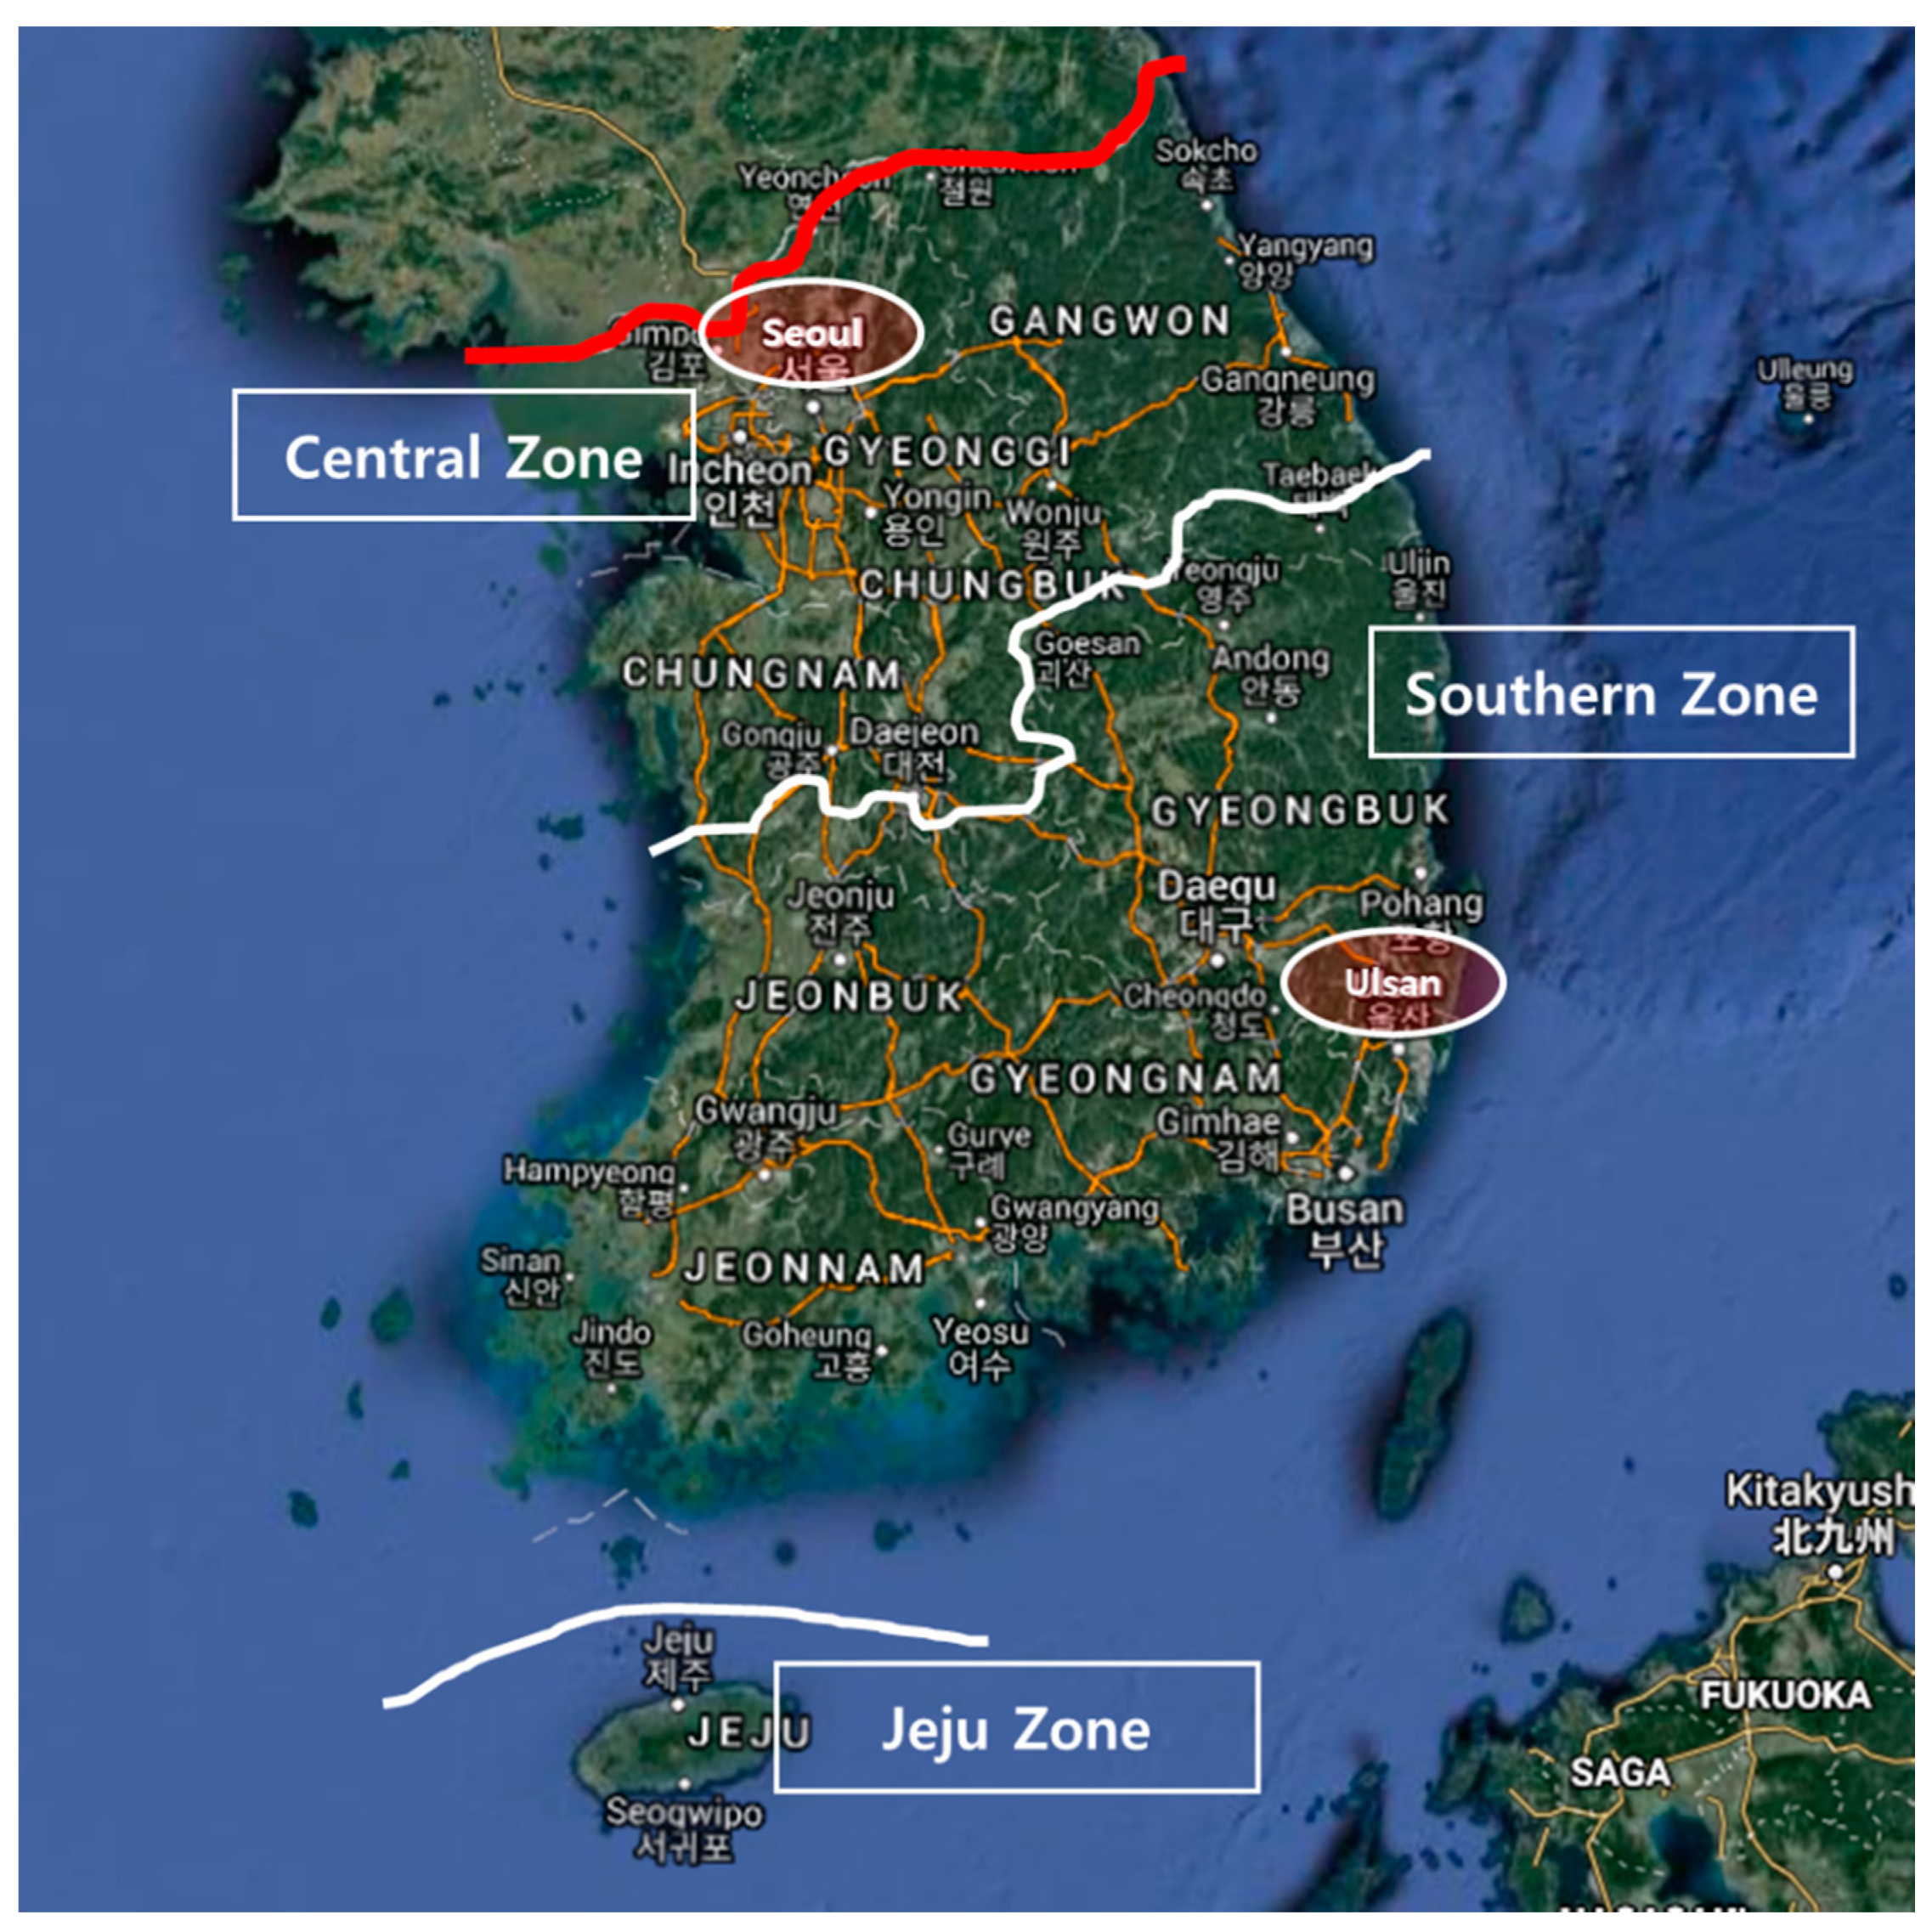
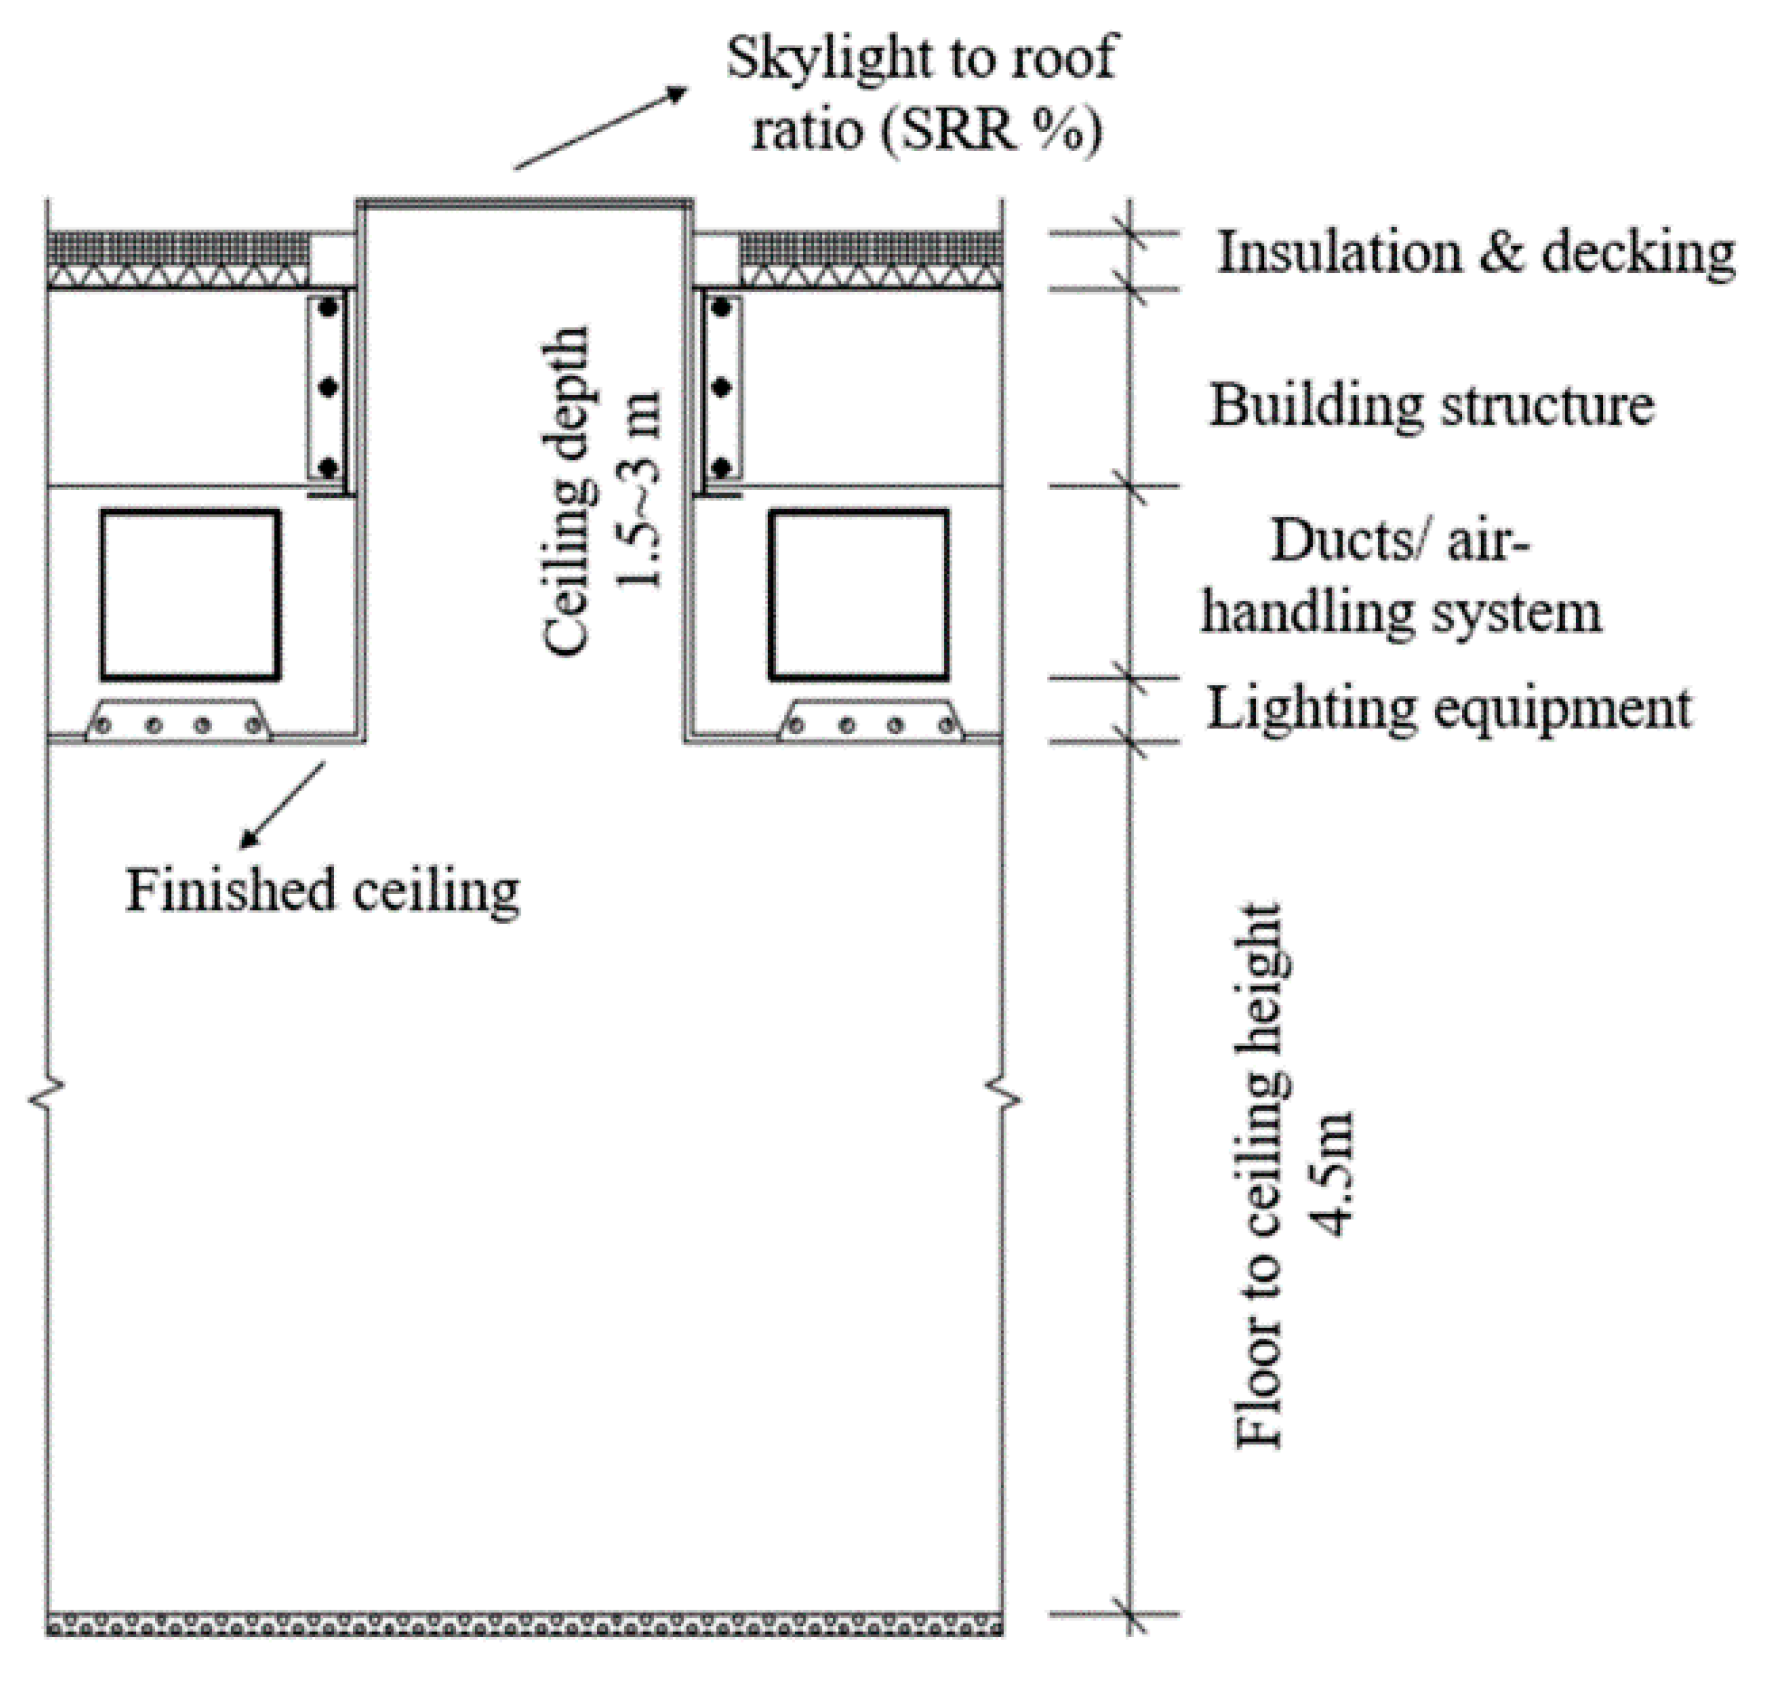
2.1. Study Model and Variables

A common public space of 9 m × 9 m × 4.5 m was modeled. To avoid any complications from the introduction of any other structures that could substantially alter the results, a rectangular open space uninterrupted by columns, partitions, or any other structures was designed. The model represented a small scale of a vast open rooflit space of a single-story building or a top floor of a multi-story building. To generate general results, dimensions were selected based on a previous study on the performance of a top-lighting system [8]. Because the aim of this study was to analyze the impact of skylight and ceiling depth on a building’s energy demand, the model had no side windows but included one horizontal skylight. Because of this assumption, energy efficiency of case models was analyzed based on the study’s base model instead of the available standard simulation models. This assumption has been applied by other studies to merely evaluate top-lighting system rather than a combination of the side and top-lighting system [10]. A floor-to-ceiling height of 4.5 m was purposely chosen to ensure that the largest portion of daylight received at the task level was largely dependent on the skylight and ceiling components.
Reflectance values of 30%, 50%, and 70% were used for the floor, walls, and ceiling, respectively; they were selected according to the Illuminating Engineering Society of North America (IESNA) [18]. The U-values for the floor, walls, and ceiling were 0.513 W/m2K, 0.429 W/m2K, and 0.192 W/m2K, respectively; they were selected according to the Korea Energy-Saving Design criteria for office and commercial buildings [19].
The glazing material used in this study was flat-styled CoolOptics manufactured by SunOptics, Sacramento, California, United State of America. This type of glass has the advantage of high visible daylight transmittance and less thermal transfer. It was selected based on a previous study that reported its energy efficiency when used for horizontal skylights in five different weather conditions [20]. The thermal and optical properties of the glazing material were 1.98 W/m2K, 0.37, and 0.67 for the U-value, shading coefficient, and visible transmittance, respectively. The thermal and optical properties were identical for all models and are listed in Table 1.
As discussed previously, a parametric analysis was performed to investigate the effects of including a building ceiling depth on the prediction of skylight performance in terms of both the building energy consumption and adequate daylighting. A ceiling depth ranging from 1.5 m to 3 m was studied; the ceiling was deep enough to accommodate various building systems for roof insulation, building structure, ventilation, electric lighting, or any other necessary mechanical system [21]. Figure 3 shows the details of a typical ceiling layering scheme and the study variables.

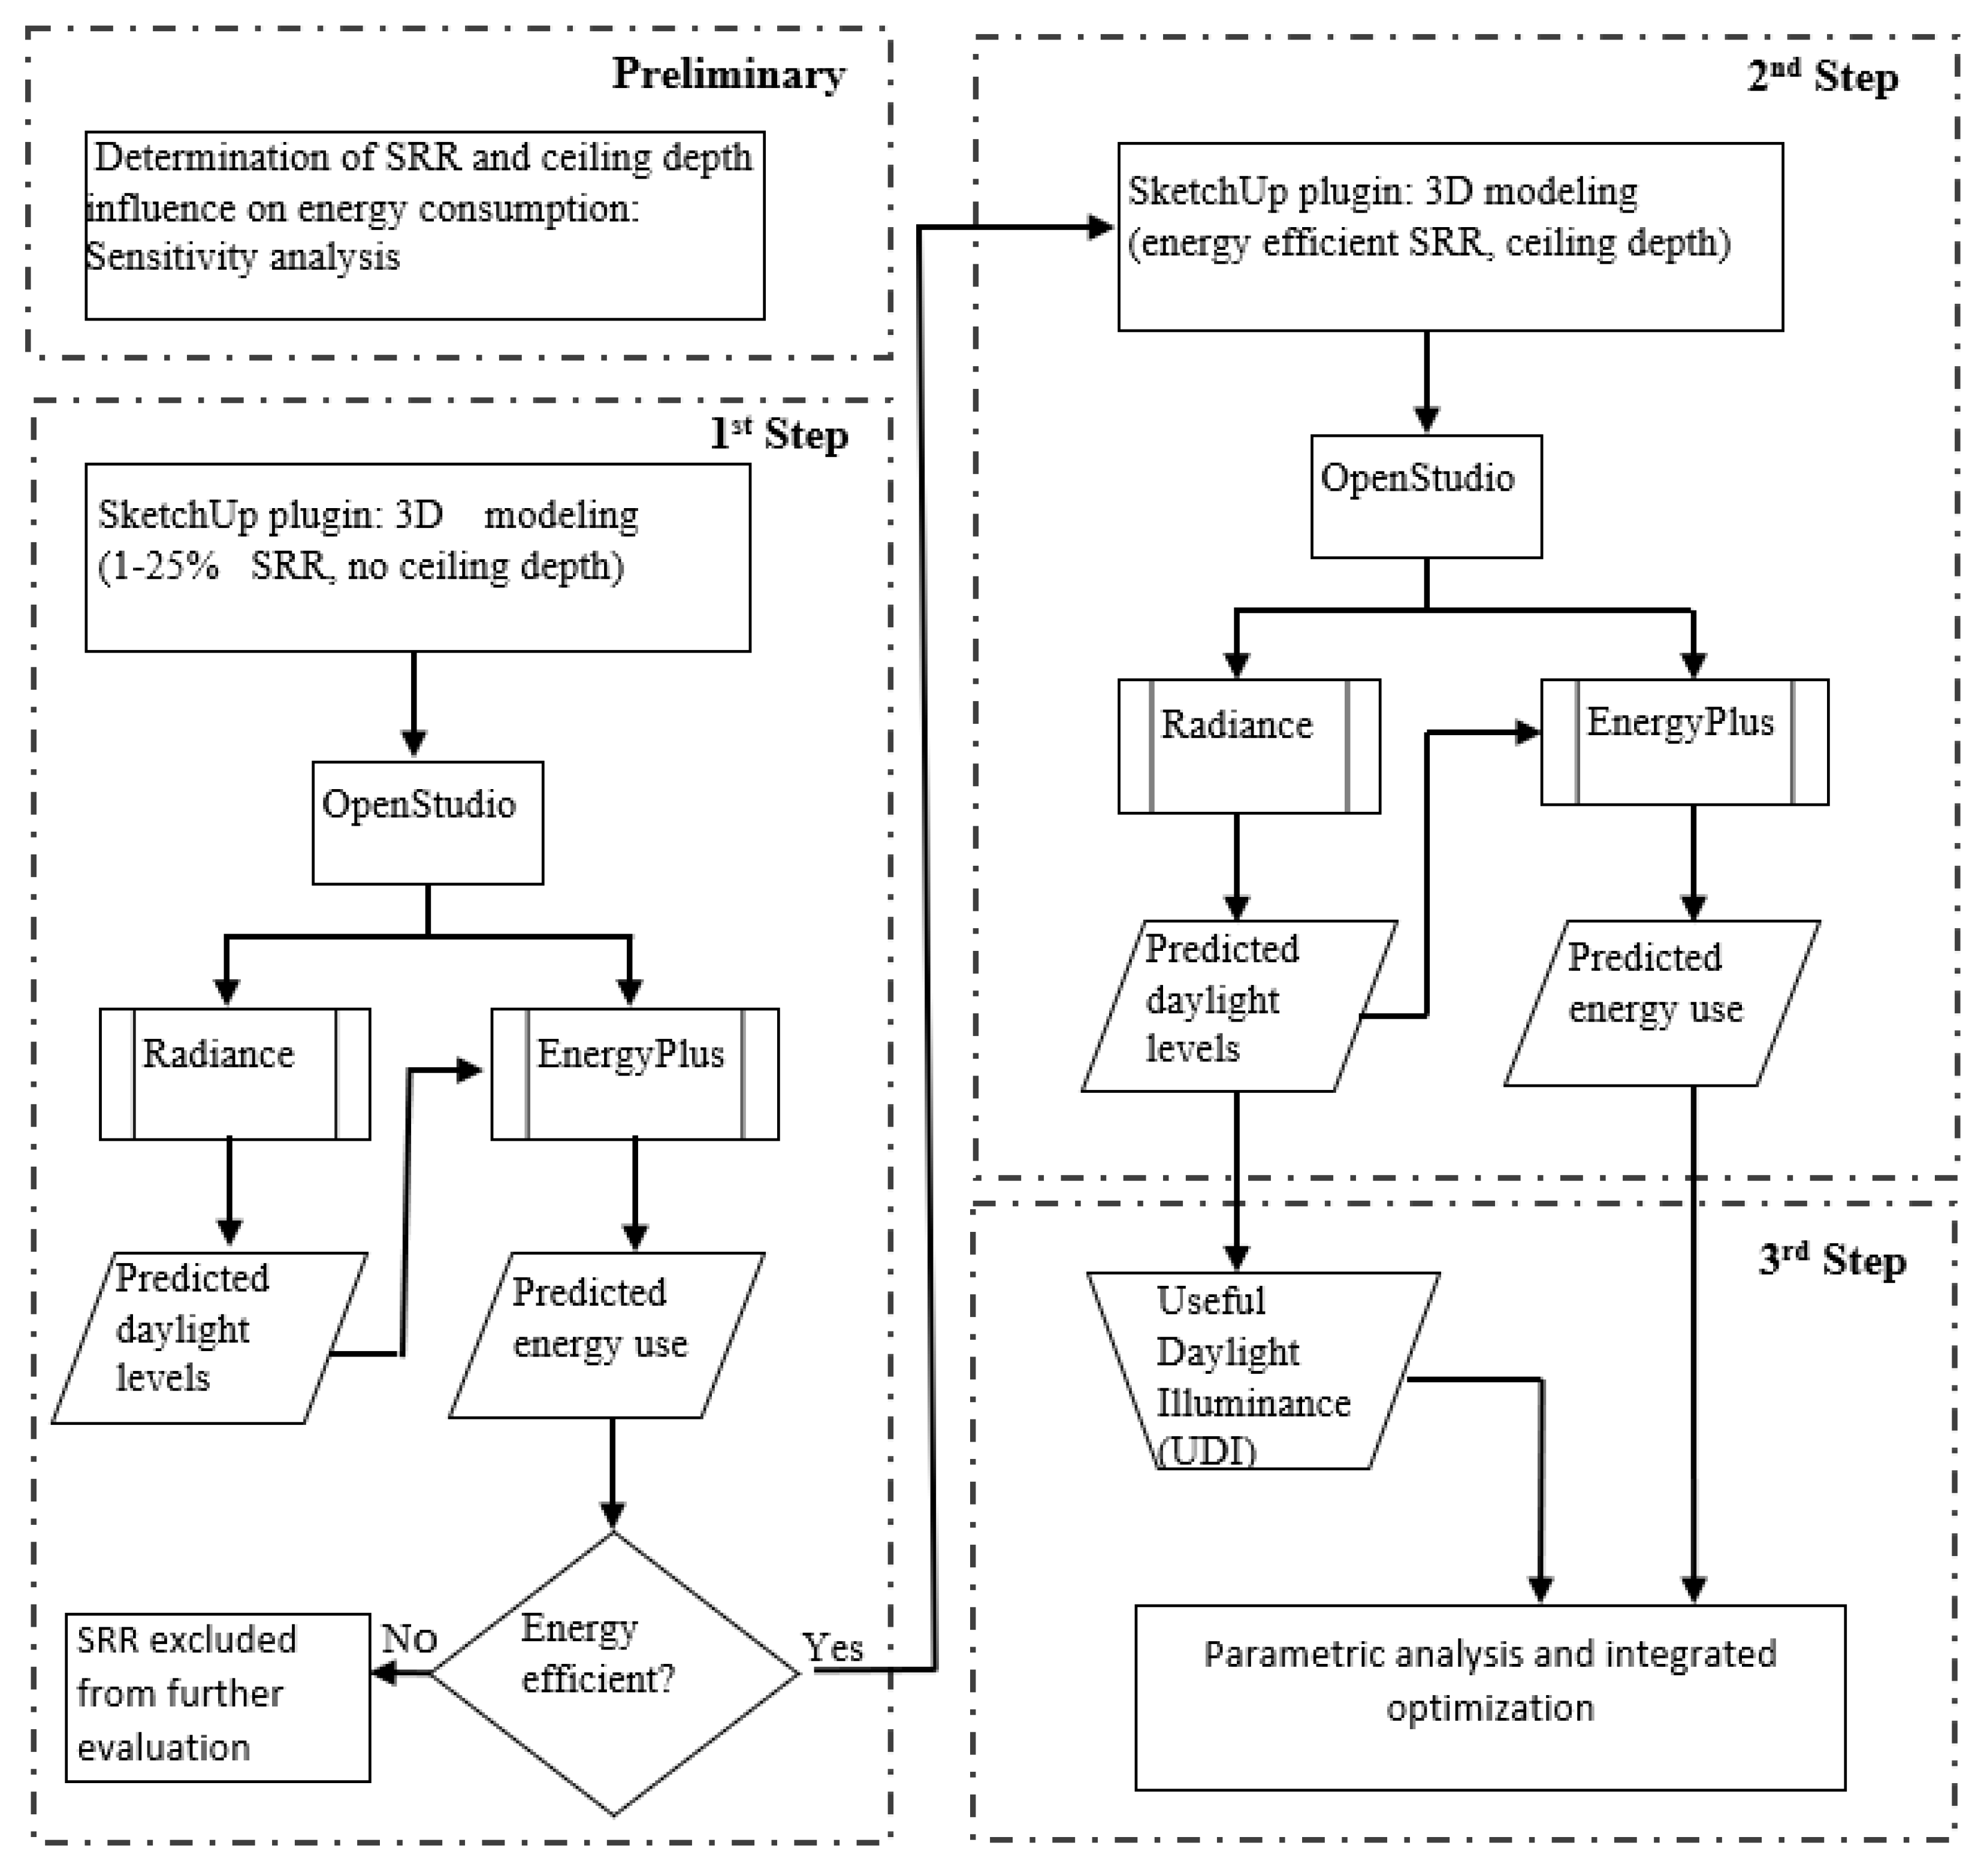
2.2. Simulation Tools and Modeling Conditions

This study was conducted using OpenStudio’s integrated Radiance and EnergyPlus (Guglielmetti and Ball 2016 [22]). This conjunction of Radiance and EnergyPlus was purposely selected to cohesively perform an integrated optimization without isolated daylighting and energy simulations, which often lead to low accuracy. A study on the optimization of fenestration size based on daylighting and building thermal loads (Futrell, Ozelkan, and Brentrup 2015 [23]) has validated the use of integrated Radiance and EnergyPlus for complex building design.
A simulation model fit to enable accurate results with a light-backwards ray-tracing method used by Radiance was created singularly using the OpenStudio SketchUp plugin. Figure 4 shows the illuminance map with 81 measurement points and a daylighting control photosensor, which were included in the simulation model for daylight qualitative assessment and artificial lighting control, respectively. The number of illuminance measurement points was calculated based on adequate distance between side wall and contour measurement points (0.5 m) and the distance between two consecutive measurement points (1 m) for qualitative daylight evaluation (Nabil and Mardaljevic 2006 [24]). To provide adequate lighting for the entire occupiable floor area, a sensor for artificial lighting was placed where the lowest daylight illuminance levels occurred. Radiance parameters were continuously altered during trial simulations until more consistent results were obtained. A continuous dimming control system with 3 steps was used to control 100% of the artificial lighting of the space. The Illuminating Engineering Society (IES) (DiLaura et al. 2011 [18]) recommendation for suitable lighting in a general open space (300 lux) was used as the illuminance set point. Lighting fixtures were continuously and linearly dimmed from maximum to minimum input power as the daylight illuminance received at the daylighting control photosensor increased. In other words, the fractional input power was 1, 2/3, 1/3, and 0 for daylight illuminance ranges of 0–100 lux, 100–200 lux, 200–300 lux, and above 300 lux, respectively.
The simulation model from the SketchUp plugin was imported into OpenStudio and further modeled by adding necessary input data for the whole building energy simulation. The modified simulation model (.osm) was then translated into a valid Radiance model by an OpenStudio-to-Radiance forward translator with all the necessary elements for daylighting simulation. During the daylight simulation, Radiance created a blended illuminance schedule from the hourly illuminance values at the sensor point; then, a new artificial lighting schedule was calculated and forwarded back to the OpenStudio model. The new calculated lighting load schedule was later used by EnergyPlus during the building energy simulation.
In this study, International Weather for Energy Calculations (IWEC) weather data provided by the American Society of Heating, Refrigerating, and Air-conditioning Engineers (ASHRAE) were used to represent the typical long-term weather patterns [25]. The model was treated as a single thermal zone with internal loads from people and lighting. Based on typical commercial buildings in South Korea [26], lighting power density, occupancy, and air infiltration were set as 11.34 W/m2, 9.3 m2/person, and 2.19 m3/hr × m2, respectively. A simplified HVAC (Heating Ventilation and Air Conditioning) system was designed, containing an outdoor air mixing box, a DX single-speed cooling coil, coil heating gas, a fan, and an air terminal. The cooling system used electricity with a coefficient of performance (COP) of 3, whereas natural gas was used for the heating system with a COP of 0.8. Table 2 summarizes all simulation inputs and conditions used in this study.

2.3. Sensitivity Analysis

Sensitivity analysis in building energy performance is mainly conducted to determine the significance of the input variables’ contribution to the variance of the output. In this study, a linear relationship between the output variable y i and the p-vector of input variables was assumed through multiple linear regression, and the contribution of the ceiling depth and SRR on the building energy performance was determined. The input-output relation was modeled with an error variable ε i , that represents the unobserved random variable between input and output. The input-output relationship was expressed by Equation (1).
y i = β 1 x i 1 + β 2 x i 2 + ε i             i = 1 ,   2 ,   3 , , n
where y i is the predicted building energy consumption (lighting, cooling, heating, and total building energy); β 1 and β 2 are p-dimensional regression coefficient for the ceiling depth and SRR, respectively; x i 1 is the ceiling depth, while x i 2 is the SRR. A total of 16 alternatives for ceiling depth ranging from 1.5 m and 3 m with 0.1 m variation and 20 alternatives for SRR ranging from 1% to 20 % were combined, resulting in 320 combinations (n = 16 × 20 = 320). Since the input and output had different units, all the variables were standardized as the following Equation (2).
x i 1 = x i 1 x ¯ 1 δ x 1      x i 2 = x i 2 x ¯ 2 δ x 2      y i = y i y ¯ δ y
where x i and y i are the standardized input and output, x i and y i are the actual input and output, x ¯ and y ¯ are the input and output arithmetic mean, and δ x   and   δ y are the input and output standard deviation. The regression model of the standardized variables was created as Equation (3).
[ Y 1 Y n ] = [ x 11 x 12 x n 1 x n 2 ] [ β 1 β 2 ] + [ ε 1 ε n ]
The standard regression coefficient (SRC) β 1 and β 2 and were calculated and these values determined how sensitive the predicted energy consumptions were against the ceiling depth and SRR. The SRC varies between 1 and −1 with a large absolute value indicating great impact of the input on the output. The error from this input-output linear relationship assumption was estimated through a standard error that varied between 0.05 and 0.41.

3. Results and Discussion

This study evaluated how the inclusion of building ceiling cross-sectional details altered the predicted building energy consumption for different SRRs and ceiling depths through an integrated Radiance and EnergyPlus simulation program. Generally, adding a skylight to a building decreases its artificial lighting energy consumption but increases its solar heat gain and thermal conductance. Thus, to be energy efficient, a skylight has to overcome the increased thermal transfer caused by reductions in artificial lighting and internal heat gained from artificial lighting. Therefore, the skylight’s energy efficiency was evaluated in terms of the total building energy consumption, which included the energy used for artificial lighting, cooling, heating, and ventilation. To perform an integrated building energy and daylighting optimization, UDI100–2000 (Useful Daylight Illuminance) was used as the daylighting performance index.
The X-axis in the result graphs (Figures 6–8) represents different SRRs, whereas the Y-axis represents the building energy consumption. In addition, a base model with the same dimensions and material properties but no skylight was modeled and simulated under the two climatic conditions. The base model’s energy consumption was used as a benchmark for all SRRs as illustrated on all the result graphs.
As explained previously, this study started by determining the influence of SRR and ceiling depth on skylight energy performance, after which energy efficient SRRs were defined with no ceiling included in the simulation model. Next, a ceiling depth was applied to the pre-defined energy-efficient SRRs and their energy performance was re-evaluated. Finally, an integrated daylighting and energy analysis was performed for skylight optimization. The results from all the steps are presented in the following sections.

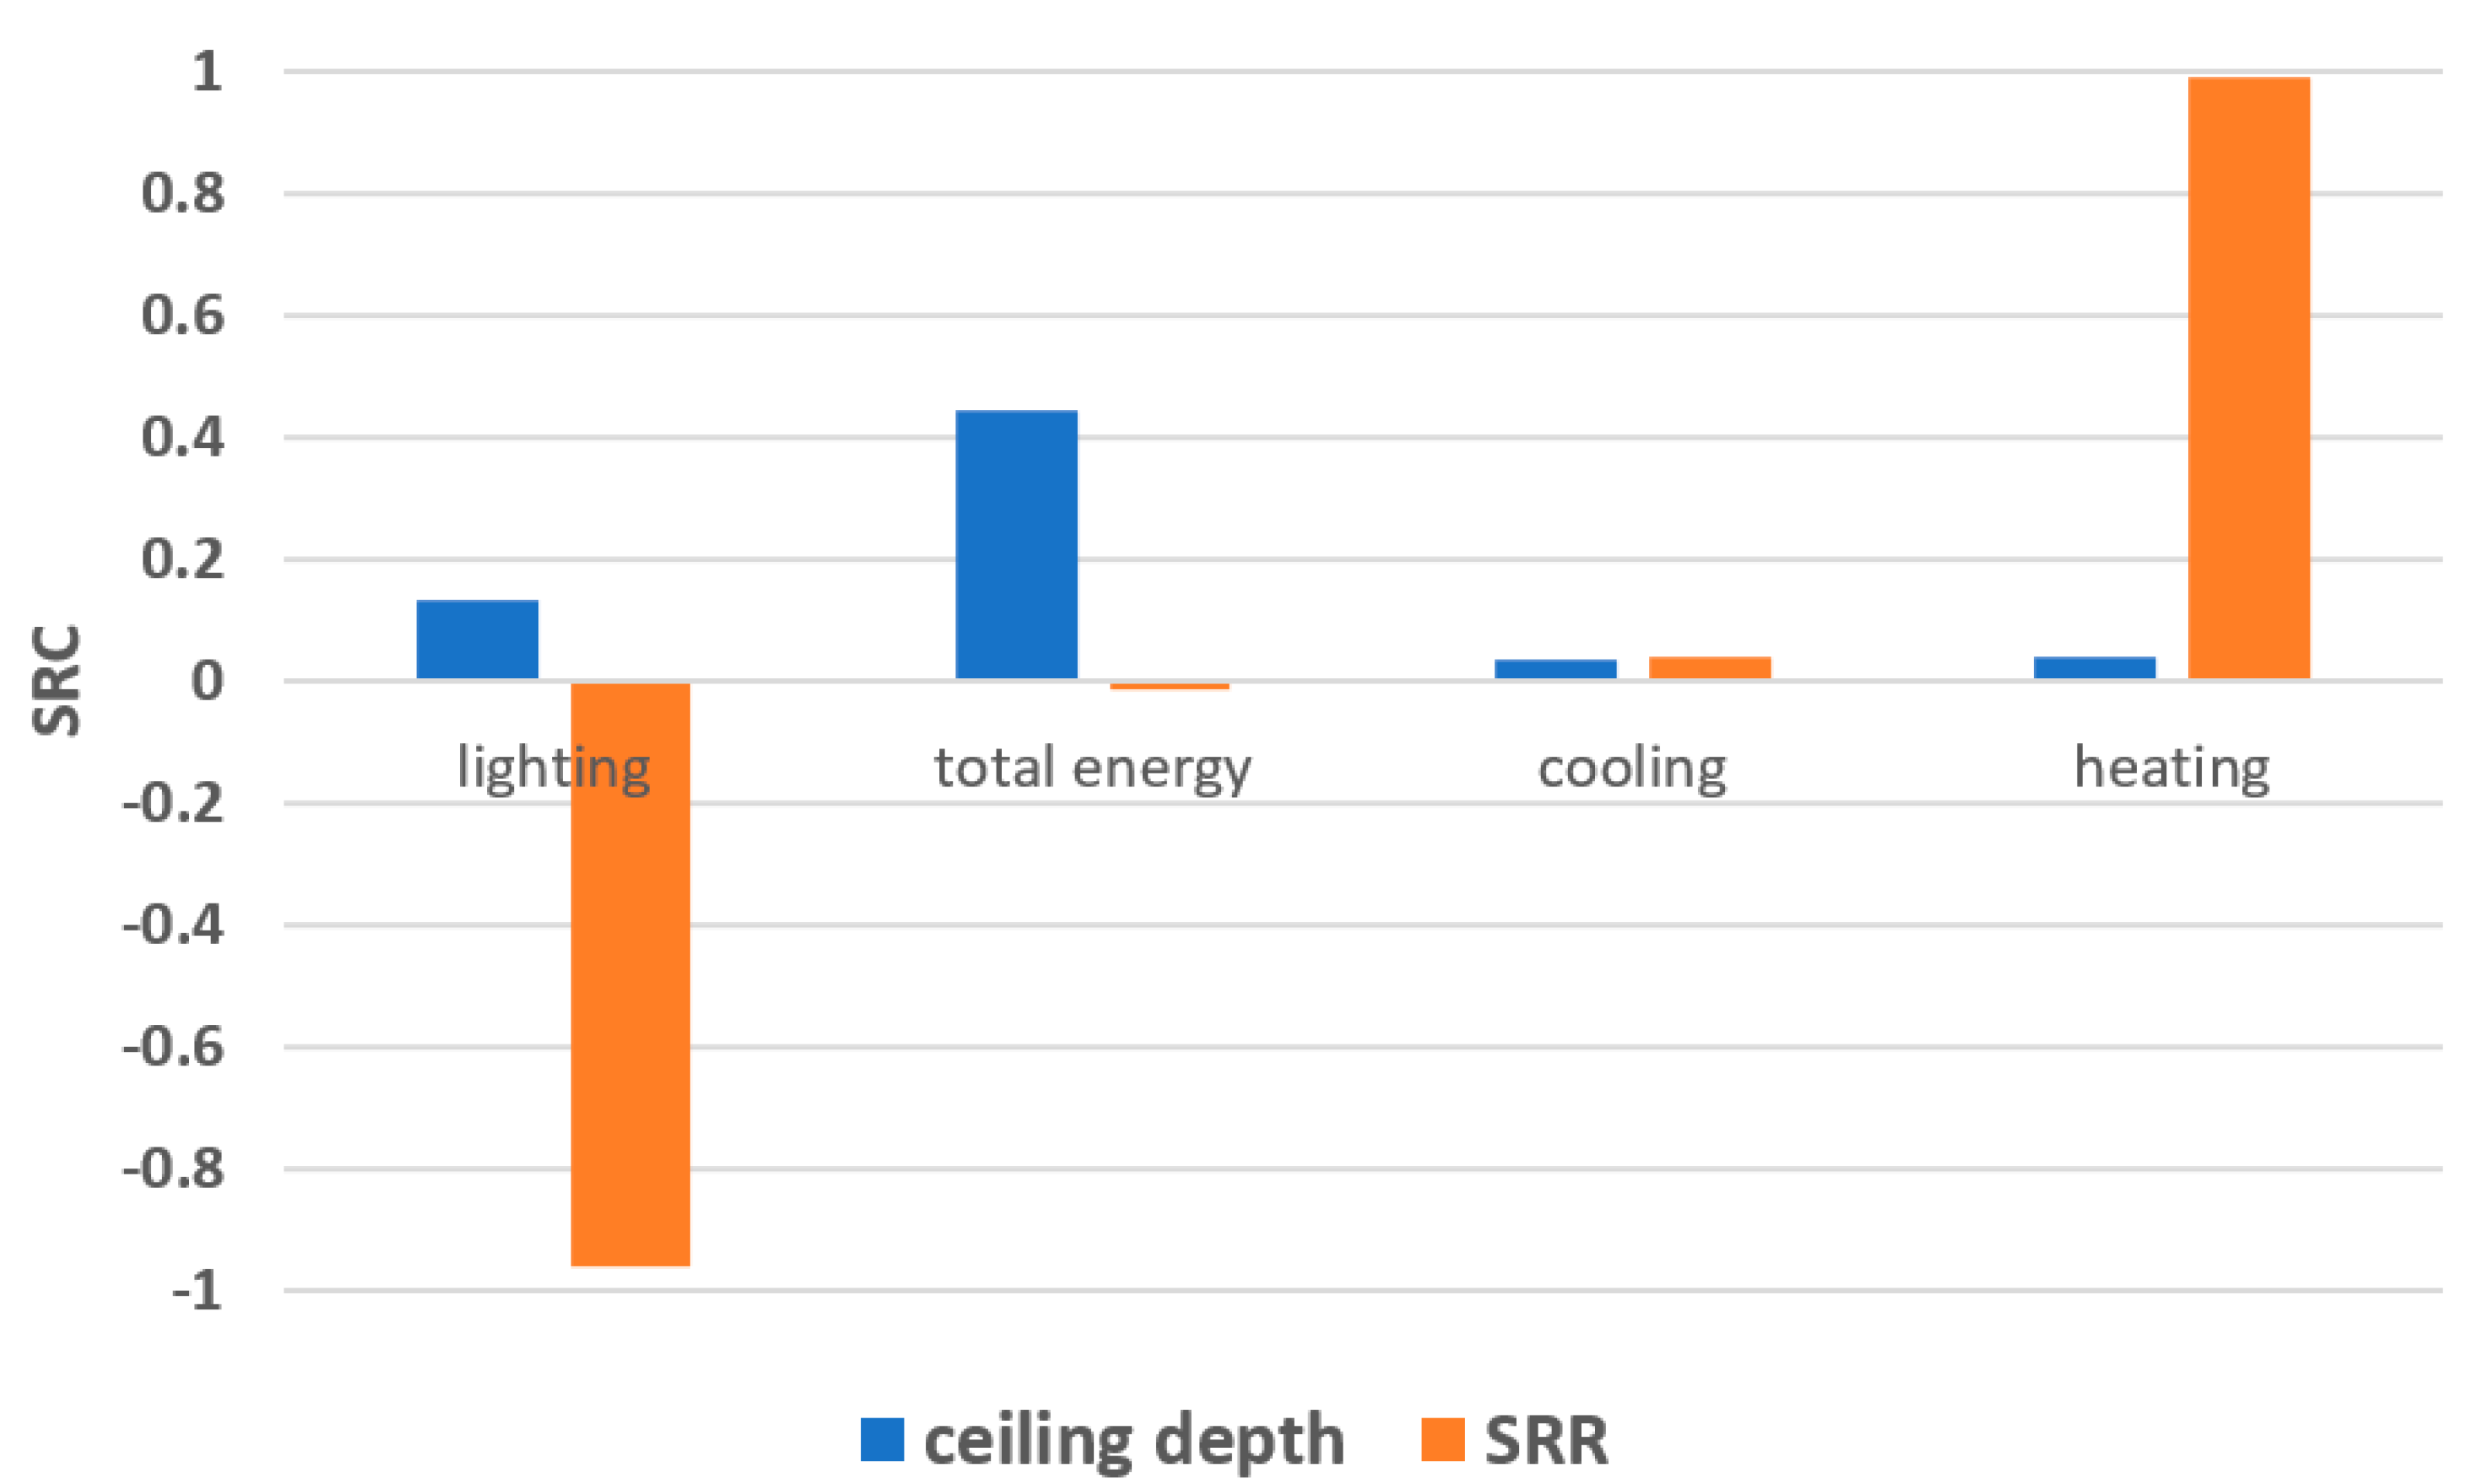
3.1. Sensitivity Analysis

As previously mentioned, the standard regression coefficients (SRC) for ceiling depth and SRRs were calculated and the results are presented in Figure 5. From the results, it was observed that the skylight advantage on lighting energy might be outweighed by its negative effect on heating energy consumption, implying that the energy performance of different SRRs could differ depending on local climatic conditions. Therefore, the next step was to conduct a SRR based energy efficiency evaluation under two climatic conditions. The sensitivity analysis also showed that the ceiling depth negatively influenced all the energy performance indicators. In addition, it is important to note that the impact of ceiling depth on total building energy was higher than the sum of the impact on single energy contribution. The reason could be that the increase in lighting energy is associated with increased internal load from artificial lighting which is reflected in the total building energy consumption. Although the ceiling depth impact was less significant on cooling and heating energy, its influence on lighting and total building energy showed that it played a considerable role in skylight energy efficiency. Thus, further analysis on how the inclusion of the ceiling depth into a simulation model could alter the predicted energy performance was carried out.

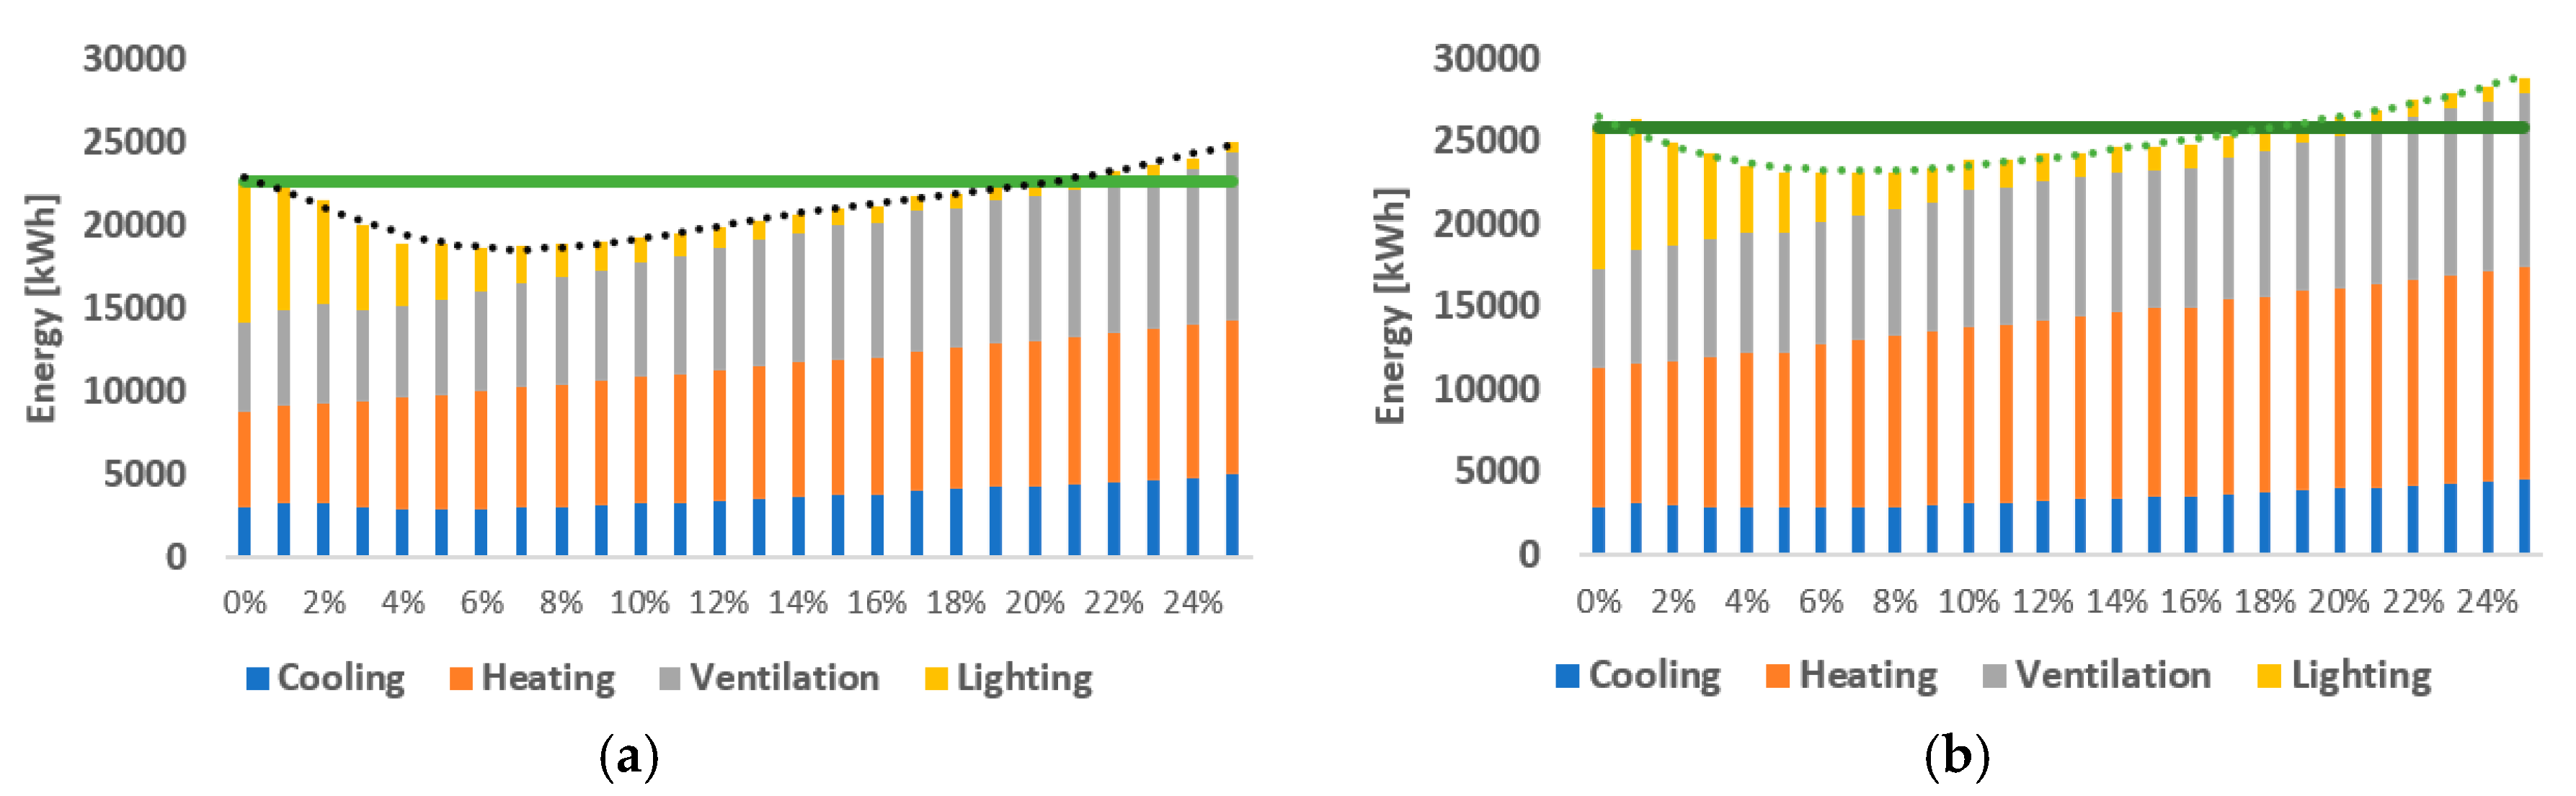
3.2. Energy Efficiency of Skylight

Energy simulations for SRRs of 1% to 25% were carried out. Their energy performances were assessed and benchmarked against the base model, which had the same dimensions and material properties but no skylight. A SRR was considered to be energy efficient if its total building energy consumption was less than the base model.
As shown in Figure 6, the cooling energy consumption was minimally reduced, reaching its minimum at a SRR of 4%. For SRRs greater than 4%, the cooling energy linearly and slowly increased as the SRR increased. This study supported previous findings that the impact of daylighting on cooling energy consumption strongly depends on the climate under consideration. For Miami and Boston [15], a study reported a cooling energy reduction for skylights with SRRs less than 3.5%; however, for the climatic conditions of San Francisco [10], the cooling loads minimally increased until a SRR of 5%. The heating energy consumption steadily and more conspicuously increased as the SRR increased. These results were in agreement with previous findings that adding skylights increases a building’s heating loads. The ventilation energy consumption followed a similar trend as cooling; however, the energy variation was more conspicuous for ventilation because it contributed more to the total building energy consumption than did cooling. Although the variations in lighting energy consumption had no fluctuations with increases in SRR, they showed specific behaviors and greatly influenced the energy performance of the skylight. Therefore, in the following parts of this study, the lighting energy and the total building energy (which includes the energy used for cooling, heating, ventilation, and lighting) are evaluated separately.
As shown in Figure 6a, for Ulsan climatic conditions, the total building energy consumption dropped when a skylight was added, reaching the minimum energy consumption at a SRR of 6%. For a SRR of 7%, the increase in the energy consumed for cooling, heating, and ventilation started to outweigh the lighting energy reduction; however, any SRR less than 20% was more energy efficient than the base model for Ulsan’s climatic conditions. In addition, the results showed a special trend for lighting energy reduction. Lighting energy decreased exponentially for small apertures, and the reduction rate linearly and slowly reduced as the SRR increased. This can be explained by the fact that increasing the SRR makes the space more saturated, and the daylight illuminance level at the sensor point approaches the target illuminance. As a result, any increase in the SRR makes a less important impact on lighting energy consumption. The total building and lighting energy reduction at optimal SRR was 18% and 68.5%, respectively.
As shown in Figure 6b, for the case of Seoul, the results showed a slight increase in the total building energy consumption for a SRR of 1%. This was mostly because such a small aperture, a SRR of 1%, could not provide enough daylight to significantly reduce lighting energy consumption and offset the increased heating energy, which dominates the total building energy for Seoul’s climatic conditions. By increasing the SRR, the total building energy consumption dropped until it reached its minimum at 6% SRR. A skylight with a SRR greater than 6% increased the total building energy consumption; however, any SRR between 2% and 18% was more energy efficient than the base model. In addition, Figure 6b shows that the rate of lighting energy reduction gradually decreased as the skylight ratio increased. This is because the space became saturated by daylight as the SRR increased; as a consequence, the SRR became less influential on lighting energy consumption. The range for energy efficient SRRs was 2–18% and the total building and lighting energy were reduced by 11% and 65.5%, respectively.

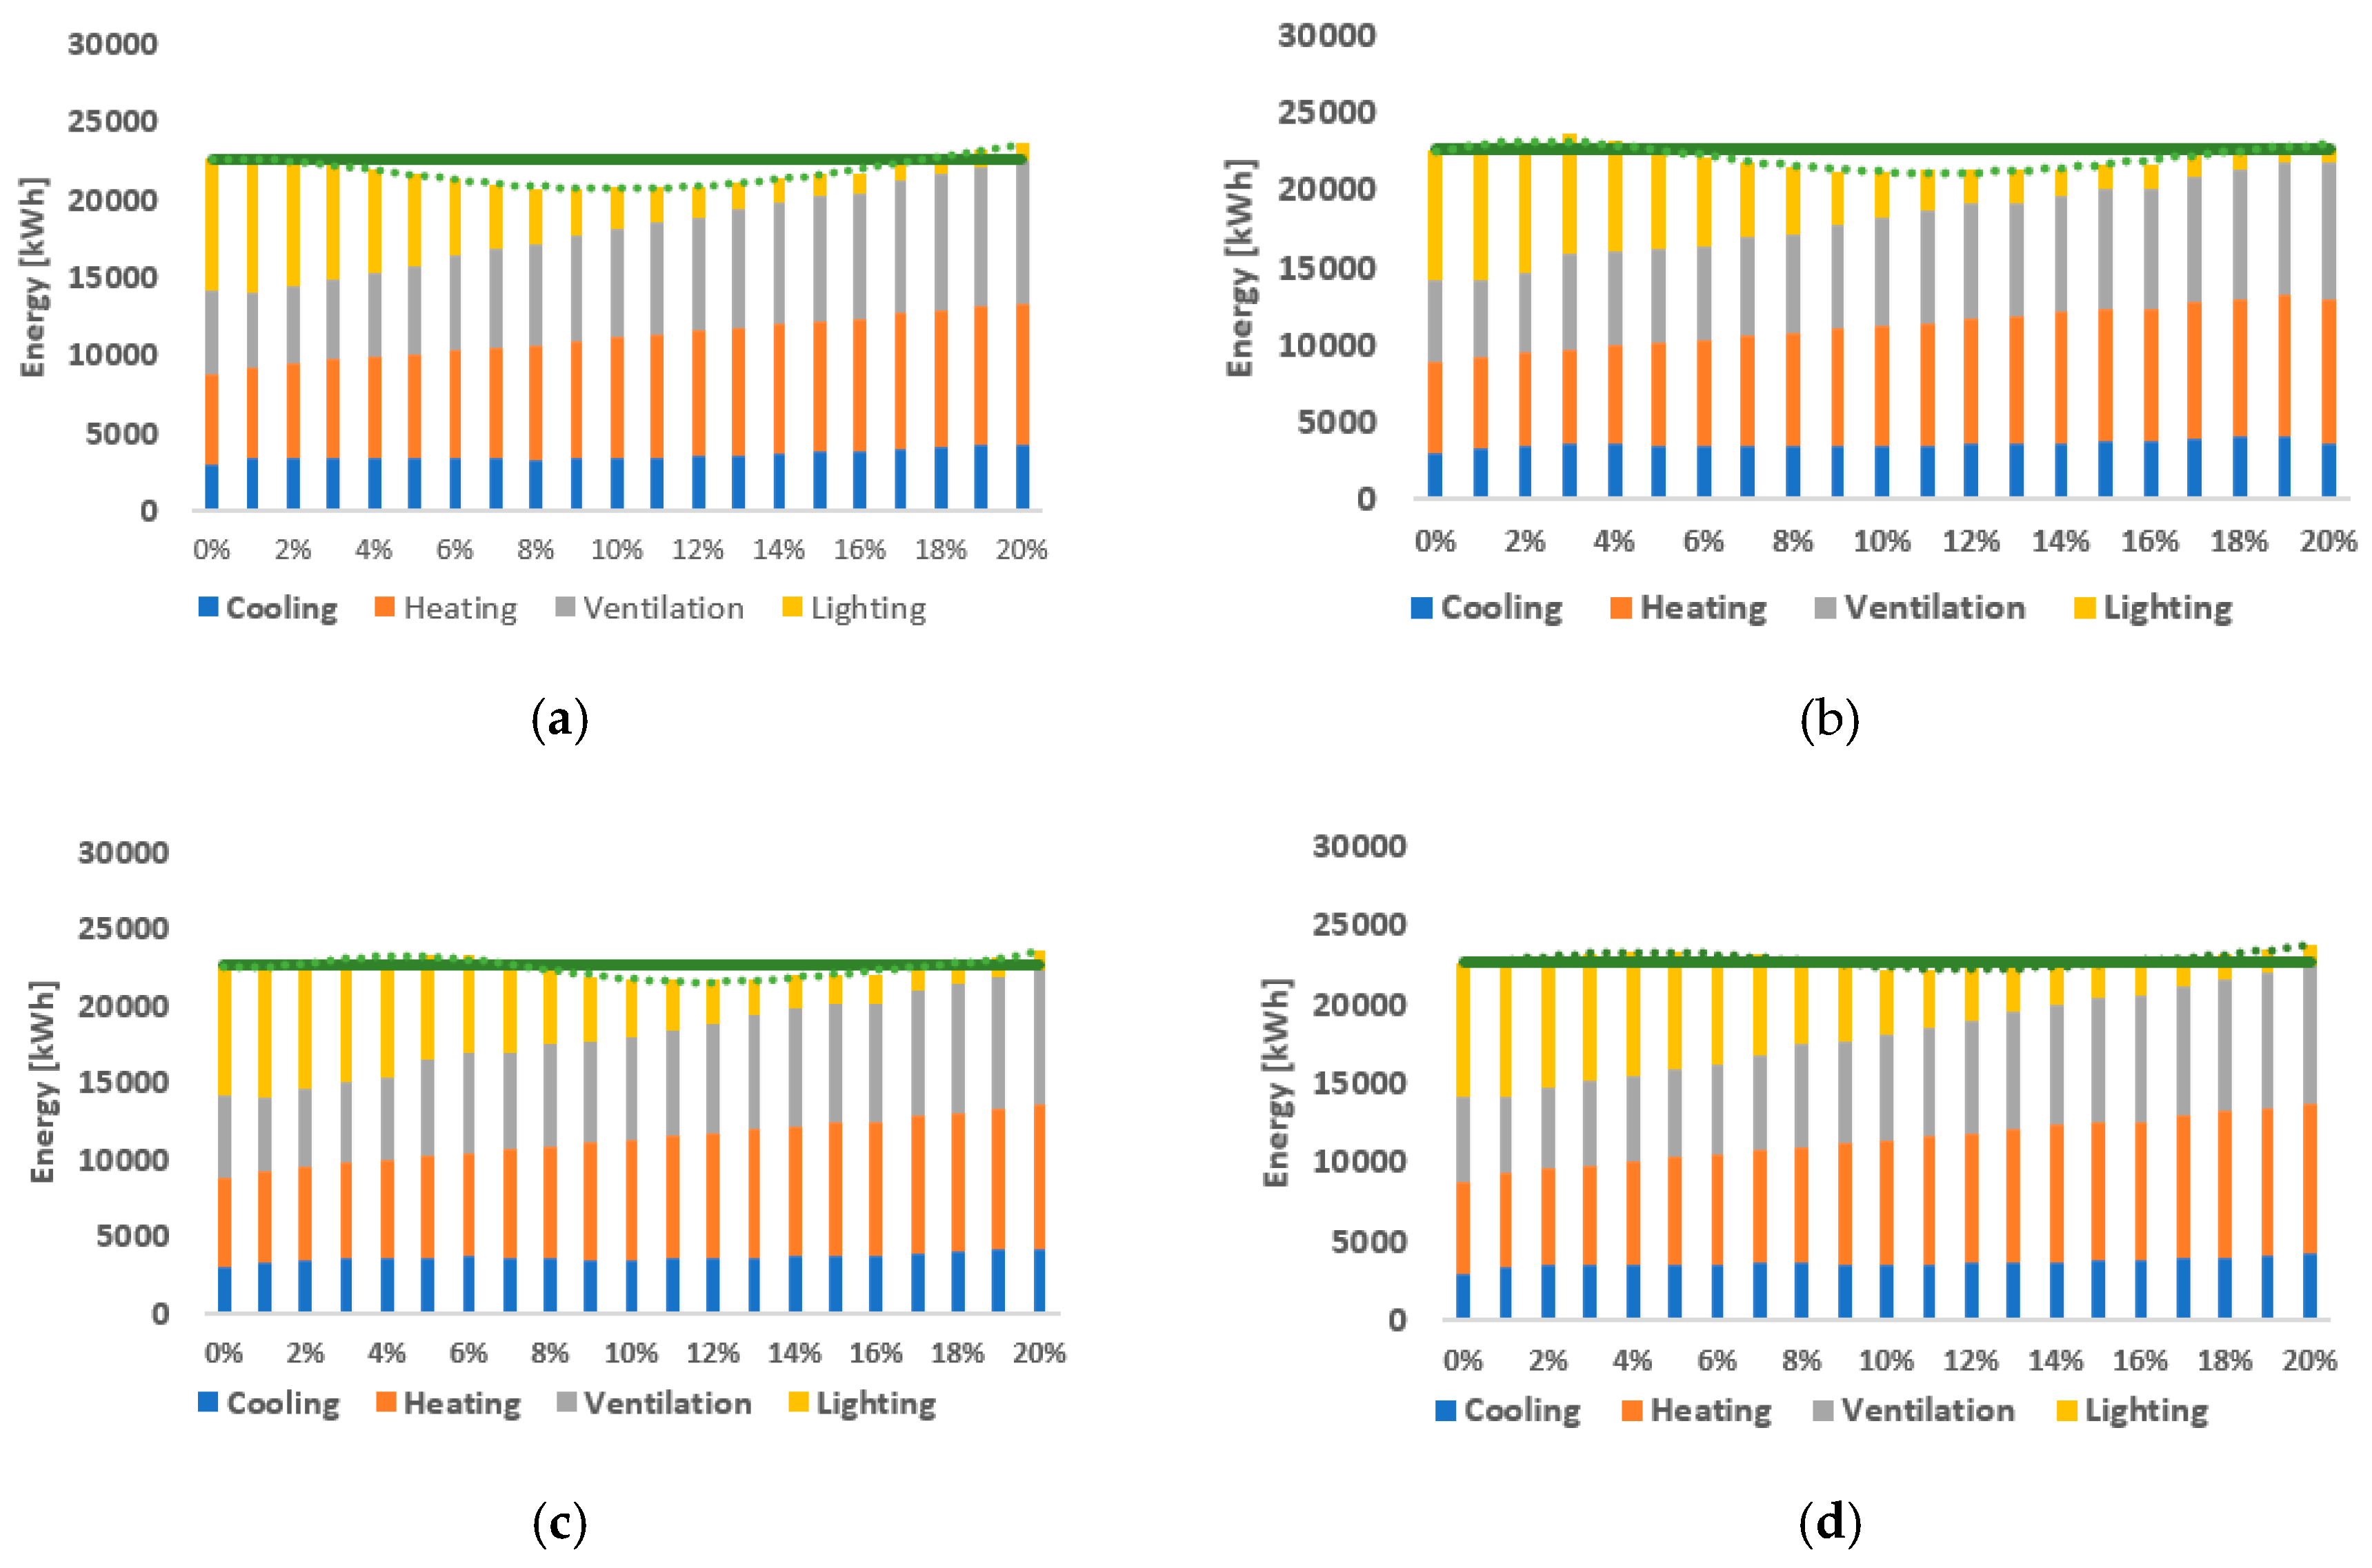
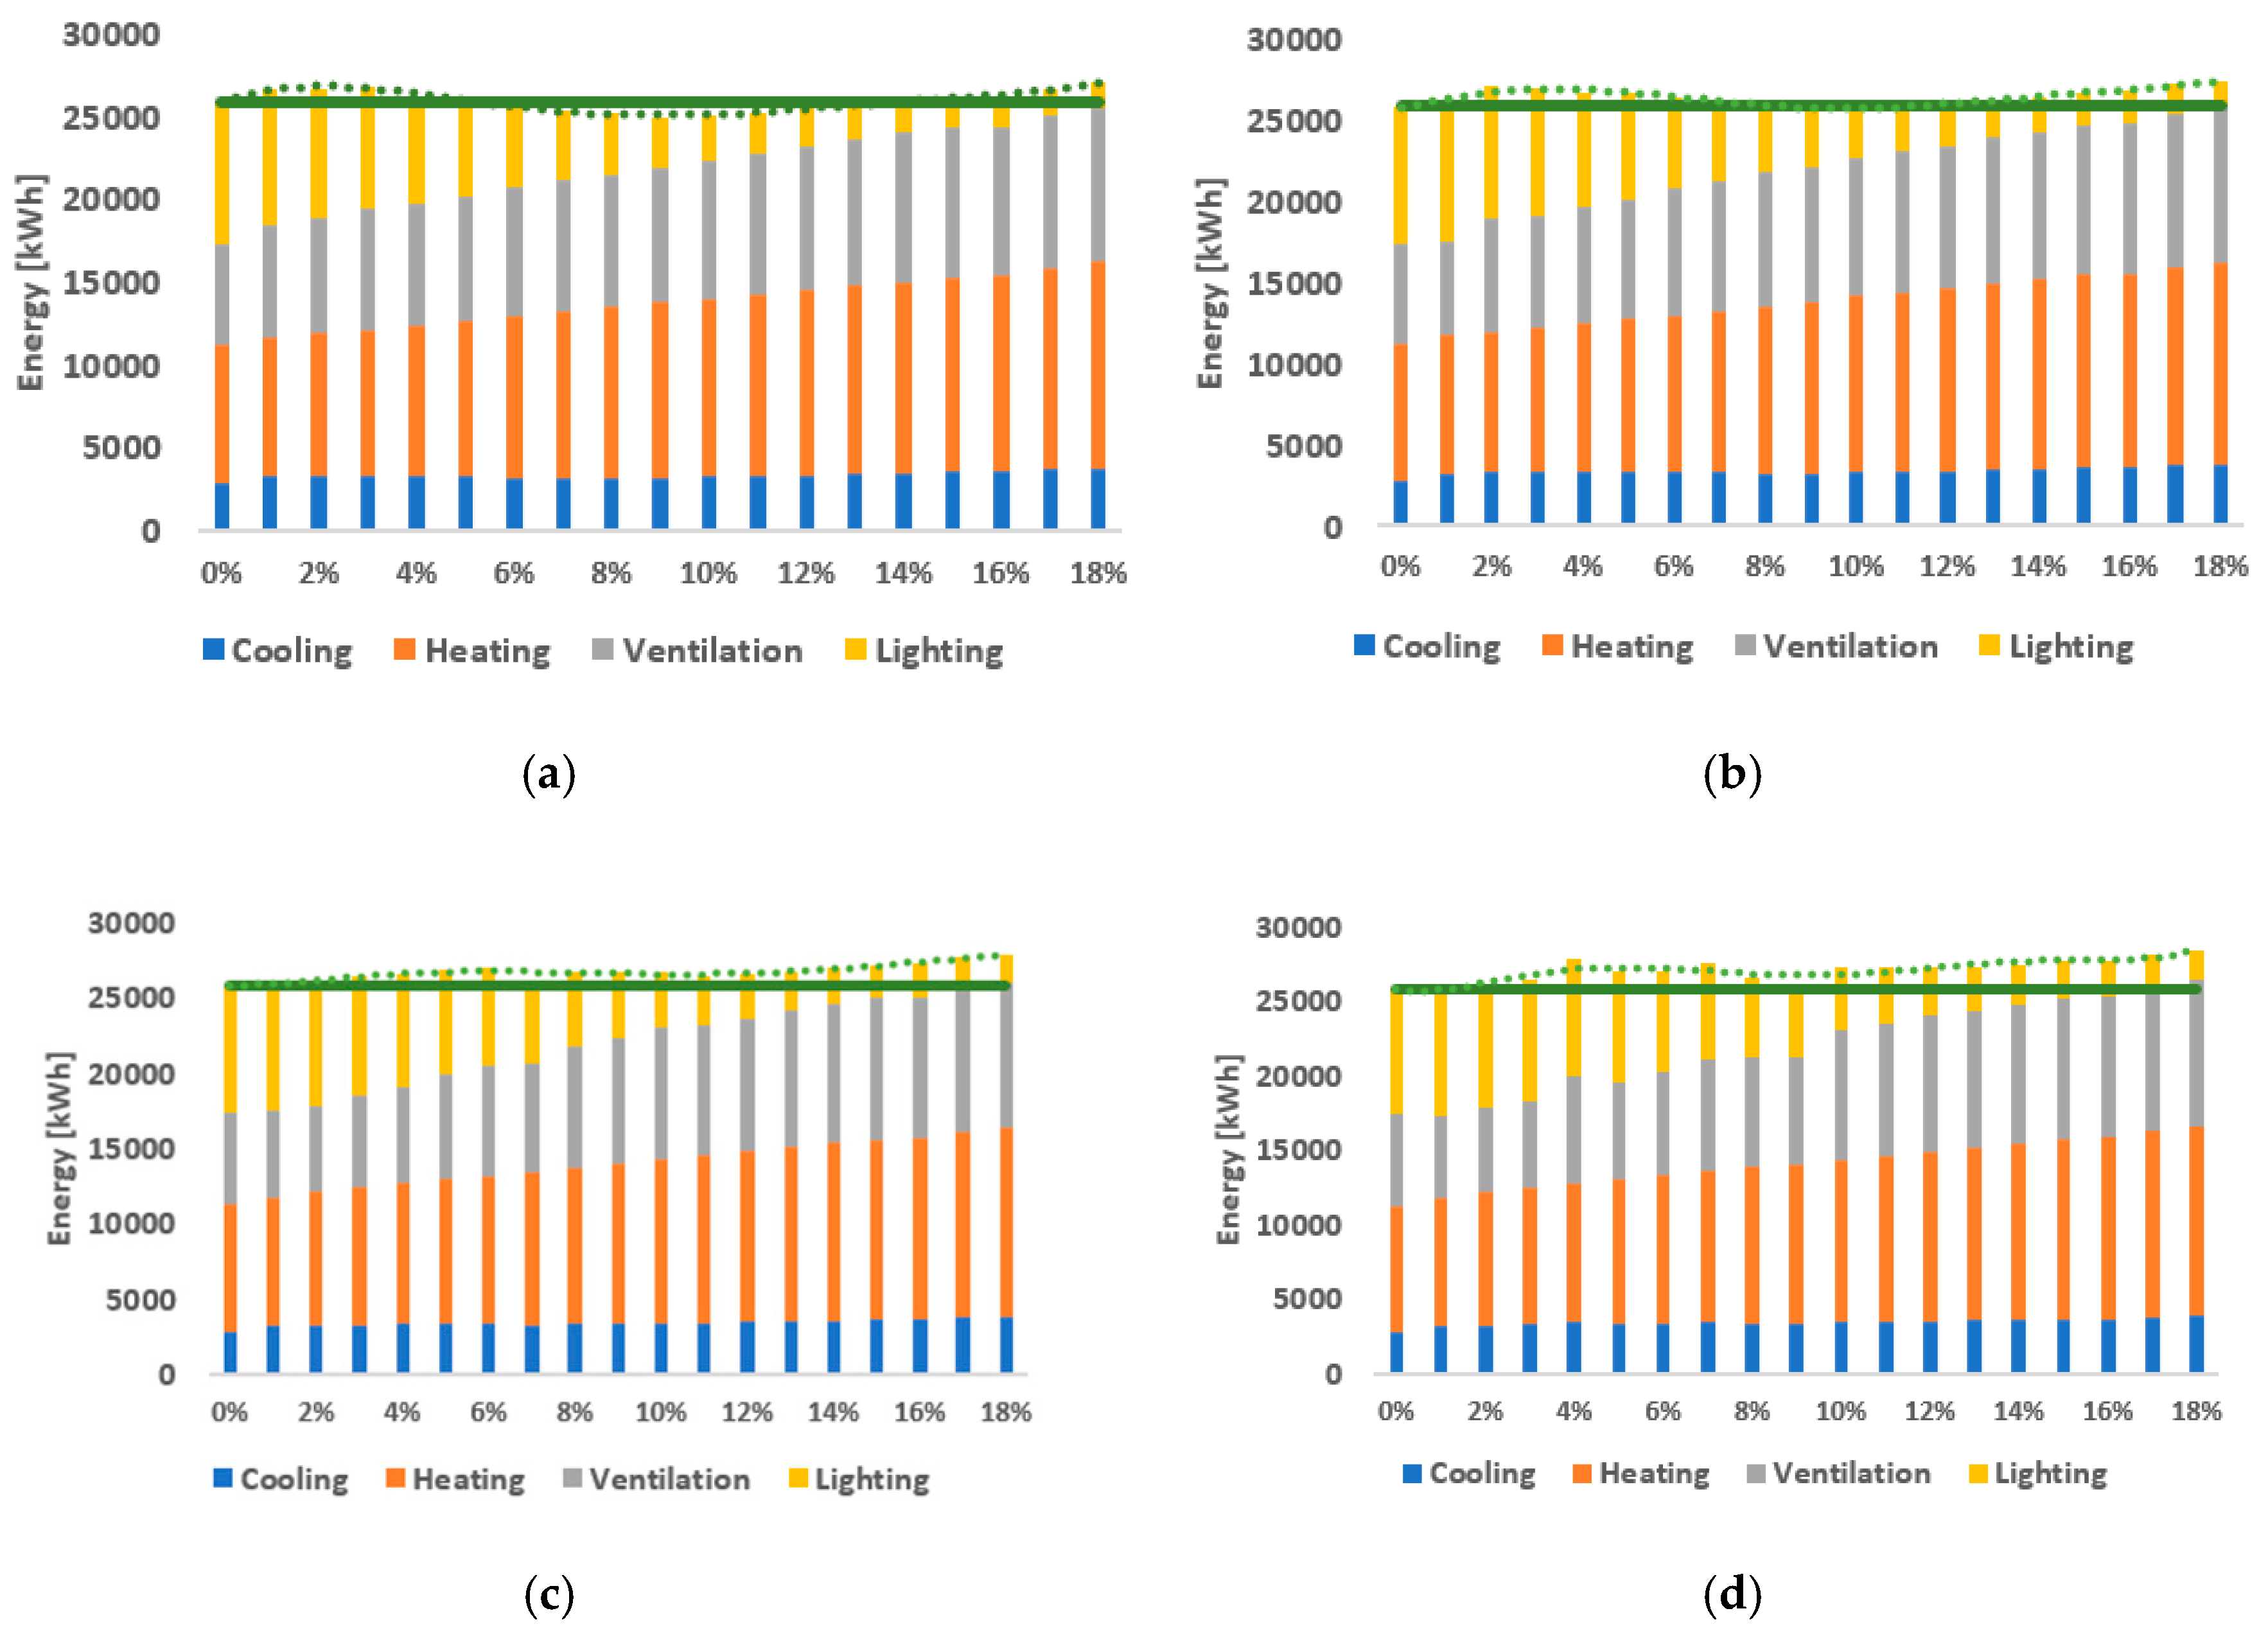
3.3. Ceiling Depth and Skylight Energy Efficiency

This study evaluated the energy efficiency of skylights for the real conditions under which they are installed. Depending on the size and the type of equipment installed in a building, the ceiling layering scheme can be as deep as 1.52 m to 2.74 m [21]. Therefore, the predefined energy-efficient SRRs were redesigned with a ceiling depth of 1.5 m, 2 m, 2.5 m, and 3 m included in the simulation model. Variations in skylight energy efficiency according to the ceiling depth were then assessed. The results are presented in Figure 7 and Figure 8 for the climatic conditions of Ulsan and Seoul, respectively.
As expected, both lighting and the total building energy consumption increased with an increase in ceiling depth. This was mainly because the daylight illuminance level reaching the workspace was diminished as the ceiling depth increased, leading to increased lighting energy consumption and hence increased total building energy consumption. In addition, the impact of ceiling depth was greater for small skylights, and this impact slowly reduced as the skylight ratio increased. Figure 7 and Figure 8 show that only one end of the energy-efficient SRR range—the minimum energy-efficient SRR—changed with a variation of the ceiling depth. This can be attributed to the fact that the daylight from smaller skylights was subjected to more bounces before entering into the space. Thus, the skylight’s capability to produce enough daylight to significantly reduce lighting energy consumption lessened with an increase of ceiling depth, especially for small apertures.
As shown in Figure 7, the ranges of energy-efficient SRRs for Ulsan were 1–17%, 5–17%, 7–17%, and 9–17% for ceiling depths of 1.5 m, 2 m, 2.5 m, and 3 m, respectively. As the ceiling depth increased, small SRRs were unable to produce significant lighting energy reductions that could offset the increased cooling, heating, and ventilation energy consumption. However, the skylight thermal transfer for SRRs greater than 17% overpowered the lighting energy reduction; therefore, SRRs of 18–20% were unable to counterbalance the cooling, heating, and ventilation energy consumption by the reduced lighting energy consumption. The optimum SRRs in terms of total building energy consumption were 8%, 9%, 10%, and 11% for ceiling depths of 1.5 m, 2 m, 2.5 m, and 3 m, respectively.
Figure 8 shows the variations in skylight energy efficiency by ceiling depth under Seoul climatic conditions. SRRs in the range of 6–13% and 9–13% were energy efficient for ceiling depths of 1.5 m and 2 m, respectively. Increasing the ceiling depth decreased solar heat gain through daylight reflection on the ceiling’s vertical section before reaching the occupied space. During heating season, the reduced heat gain and increased thermal conductance negatively affected the heating energy consumption. Hence, for a location with relatively more heating energy consumption, such as Seoul, there were fewer alternatives for energy-efficient SRRs compared with Ulsan. In addition, no skylight could outweigh the negative impact of ceiling depth on the total building energy consumption for ceiling depths of 2.5 m and 3 m.
In a comparison between the results for Ulsan and Seoul, the effects of climatic conditions on skylight energy efficiency were more significant when ceiling depth was included in the model. Therefore, the ceiling’s cross-sectional details should be taken into account during simulation modeling for accurate energy predictions. In addition, by comparing the skylight’s performance between the two locations, this study confirmed the findings from a previous study [10], which reported that the skylight’s thermal conductance (negative impact during the heating season) dominated over the solar heat gain (positive impact during the heating season); hence, the skylight’s energy efficiency decreased as the building’s heating demand increased. Similarly, in this study, the skylight performed more energy efficiently under Ulsan’s climatic conditions (2013.9 HDD) than under Seoul’s (2626.8 HDD). The highest total building energy reductions for Ulsan were 9%, 7%, 5%, and 3% for ceiling depths of 1.5 m, 2 m, 2.5 m, and 3 m, respectively. For Seoul, the highest total building energy reductions were 4% and 1% for ceiling depths of 1.5 m and 2 m, respectively, with increased building energy consumption for ceilings deeper than 2 m.

3.4. Skylight Optimization

Adequate natural lighting is as important as energy efficiency in building design. Although reduced lighting energy consumption indicates the energy efficiency of a skylight, it does not have upper limits to account for excessive daylight, which is a potential source of glare. Useful Daylight Illuminance (UDI100–2000) was used in this study for the daylight qualitative analysis. A study on climate-based daylighting metrics [27], described a well-daylit space as having more than 50% of the floor area receive daylight illuminances in the range of 100–2000 lux for at least 50% of the annual occupied hours. Moreover, the study reported that horizontal illuminance above 2000 lux increased the probability of glare. Therefore, for daylight performance, the current study calculated the percentage of floor area that received daylight illuminance between 100 lux and 2000 lux for at least 50% of the occupied hours without exceeding 2000 lux. In other words, all illuminance points that received daylight above 2000 lux were excluded from UDI100–2000 calculations. In this way, the integrated daylighting and building energy optimization performed in this study was based on an energy-efficient and completely glare-free space.
Table 3 and Table 4 present the daylighting performance of the skylight under the climatic conditions of Ulsan and Seoul, respectively. For each combination of ceiling depth and SRR, the daylighting performance was evaluated as poor (P), adequate (Y), or excessive (E) for UDI less than 50%, UDI greater than 50%, and for space receiving daylight illuminance greater than 2000 lux, respectively. The green-shaded area represents, for each ceiling depth, SRR alternatives that are suitable for both adequate daylighting and building energy efficiency.
For Ulsan, suitable SRR ranges were 5–8%, 6–9%, 7–10%, and 9–11% for ceiling depths of 1.5 m, 2 m, 2.5 m, and 3 m, respectively. Furthermore, the SRR with the minimum building energy consumption had the best UDI100-2000 for all ceiling depths, which suggests that the upper limit of UDI100-2000 can be used as a threshold for both glare and building energy efficiency. The results indicate that increasing the size of a skylight above the skylight ratio with the best UDI100–2000 leads to excessive daylight, solar heat gain, and thermal conductance. Through an integrated daylighting and energy performance analysis, the study concluded that SRRs of 8%, 9%, 10%, and 11% were optimal with total building energy reductions of 9%, 7%, 5%, and 3% and UDI100–2000 of 95%, 95%, 87%, and 86% for ceiling depths of 1.5 m, 2 m, 2.5 m, and 3 m, respectively.
In the case of Seoul, adequate SRRs in terms of daylighting and energy performance were 6–8% and 9% for ceiling depths of 1.5 m and 2 m, respectively. The optimal SRRs for 1.5 m and 2 m ceiling depths were 8% and 9% with total building energy reductions of 4% and 1%, respectively, and UDI100-2000 of 94%. In addition, although no skylight ratio was defined as energy efficient for ceiling depths of 2.5 m and 3 m, SRRs of 7–10% and 8–11% met the UDI criteria for a well-daylit space at ceiling depths of 2.5 m and 3 m, respectively.
The results showed a slight difference in daylighting performance between Ulsan and Seoul, which was due to the cities’ atmospheric conditions. The annual clearness indices (KT) for Ulsan and Seoul are 0.48 and 0.42, respectively [28]; thus, the model received more solar radiation under the climatic conditions of Ulsan than under those of Seoul. In addition, although the optimization method reached the same optimal result for both locations, the amounts of energy saved by the optimal skylight were different due to local thermal conditions. The highest total building energy reductions were 9% and 4% for Ulsan and Seoul, respectively.
Although the results for both Ulsan and Seoul showed a similar trend, the significant impact of climatic conditions on the energy performance of skylights was confirmed. Generally, solar heat gain and thermal conductance are the two major factors that govern the energy efficiency of any daylighting system. In the case of a top-lighting system, the thermal conductance effects tend to be greater than the solar heat gain [10]. As a result, Seoul—a region with relatively more heating energy demand—had fewer alternatives for energy-efficient SRRs than did Ulsan. When no ceiling depth was included in the simulation model, 6% SRR was the optimum; this finding agrees with a previous study [10], that reported an optimum skylight-to-floor area of 5.5–6%. Different results for energy efficient skylight may be obtained for different climate conditions. Ghobad et al. [15] have reported that for a heating dominated climate, the increase in heating energy demand negated skylights’ benefit of reducing lighting energy consumption for a skylight that has a larger than 2% aperture-to-floor ratio. The inclusion of ceiling depth into simulation model reinforced the effects of modeling simplification on simulation predictions of nonconventional buildings. Unlike side lighting, skylights are installed in a deep layering scheme which is much thicker than the building wall where side windows are installed; hence the thermal exchange as well as daylighting performance of skylight are altered by the exclusion of ceiling depth into a simulation model. In addition, it is important to note that not only does the skylight to roof ratio for optimal skylight increases as the ceiling depth increases, but also the energy reduction of a skylight is reduced as the ceiling deepens. Therefore, where possible, ceiling layers should be integrated, especially when small multiple skylights are desired over one large aperture.

4. Conclusions

This study examined the extent to which common simulation models, which do not include a ceiling layering scheme, affect the predictions about the energy efficiency and daylighting performance of skylights. Through a parametric analysis, this study concluded that a skylight-to-roof ratio of 6%, which is in the range of what has been reported elsewhere (5.5–6%) as the ideal skylight configuration in terms of both building energy efficiency and daylight performance, is optimal only for ceilings with no depth—an impractical condition in real-world situations. This study determined that ceiling depth has a great influence on both the energy efficiency and daylighting performance of skylights; therefore, that variable should not be excluded from investigations on skylight performance, as it is often done to simplify a simulation model.
A ceiling depth of 1.5 to 3 m was included in the simulation model for skylight performance evaluation under Ulsan and Seoul climatic conditions. Through an optimization method, the study concluded that skylight-to-roof ratios of 8%, 9%, 10%, and 11% were optimal, with total building energy reductions of 9%, 7%, 5%, and 3% for ceiling depths of 1.5 m, 2 m, 2.5 m, and 3 m, respectively, under Ulsan’s climatic conditions. For the case of Seoul, the optimal skylight-to-roof ratios were 8% and 9%, with total building energy reductions of 4% and 1% for ceiling depths of 1.5 m and 2 m, respectively. Moreover, for Seoul’s climatic conditions, adding a skylight to a ceiling deeper than 2 m was not energy efficient. Although the results showed a similar trend for skylight performance according to ceiling depth, skylights generally performed better in terms of energy efficiency under Ulsan’s climatic conditions compared with those of Seoul. For Ulsan and Seoul, skylights could save up to 9% and 4% of the total building energy consumption, respectively, with 95% of the floor area receiving adequate daylight levels (100–2000 lux) for at least 50% of the occupied hours.
Including actual ceiling depth into simulation model enables simulation program to account for transmitted solar heat gain and visible light through skylight. Ceiling depth affects energy performance of a skylight by reducing its ability to provide sufficient daylight and solar heat through multiple light reflection. Given that solar heat gains play a crucial role in balancing the thermal conductance of skylight, the impact of ceiling depth on the overall skylight energy performance depends on the climate under consideration. For a heating dominated climate, it would be necessary to determine the maximum ceiling depth for energy efficient skylight and proceed with ceiling layers integration, when possible, to reduce the ceiling depth.
After analyzing the results of this study, it is important to consider other factors that can affect the evaluation of energy efficiency and optimal skylight performance, such as glazing properties, building geometry, site neighborhood, and HVAC systems. Therefore, future work should investigate the sensitivity of a simulation model with related factors on skylight performance and optimization.

Author Contributions

Methodology: Y.-A.L.; Supervision: K.H.K.; Validation: Y.-A.L.; Writing—original draft: A.I.; Writing—review & editing: K.H.K. All authors contributed equally to the text. All authors have read and agreed to the published version of the manuscript.

Funding

This work was supported by the 2018 Research Fund of University of Ulsan, South Korea.

Conflicts of Interest

The authors declare no conflict of interest.

References

  1. Al-Ashwal, N.T.; Hassan, A.S. The impact of daylighting-artificial lighting integration on building occupant’s health and performance. ITJEMAST 2018, 9, 97–105. [Google Scholar]
  2. Gago, E.J.; Muneer, T.; Knez, M.; Köster, H. Natural light controls and guides in buildings. Energy saving for electrical lighting, reduction of cooling load. Renew. Sustain. Energ. Rev. 2015, 41, 1–13. [Google Scholar] [CrossRef]
  3. Danny, H.W.L.; Angela, C.K.C.; Stanely, K.H.C.; Eric, W.M.L. Study of daylight data and lighting energy savings for atrium corridors with lighting dimming controls. Energ. Build. 2014, 72, 457–464. [Google Scholar]
  4. Sikder, S.K.; Eanes, F.; Asmelash, H.B.; Kar, S.; Koetter, T. The Contribution of Energy-Optimized Urban Planning to Efficient Resource Use–A Case Study on Residential Settlement Development in Dhaka City, Bangladesh. Sustainability 2016, 8, 119. [Google Scholar] [CrossRef] [Green Version]
  5. Sikder, S.K.; Nagarajan, M.; Kar, S.; Koetter, T. A geospatial approach of downscaling urban energy consumption density in mega-city Dhaka, Bangladesh. Urban Clim. 2018, 26, 10–30. [Google Scholar] [CrossRef]
  6. Adahi, A.A.; Saghafi, M.R.; Tahbaz, M. The study of effective factors in daylight performance of light-wells with dynamic daylight metrics in residential buildings. Sol. Energy 2017, 155, 679–697. [Google Scholar] [CrossRef]
  7. Acosta, I.; Navarro, J.; Sendra, J.J. Towards an analysis of the performance of monitor skylights under overcast sky conditions. Energ. Build. 2015, 88, 248–261. [Google Scholar] [CrossRef]
  8. Acosta, I.; Navarro, J.; Sendra, J.J. Daylighting design with lightscoop skylights: Towards an optimization of shape under overcast sky conditions. Energ. Build. 2013, 60, 232–238. [Google Scholar] [CrossRef]
  9. Fang, Y.; Cho, S. Sensitivity analysis of skylight and clerestory design on energy and daylight performance of retail building. In Proceedings of the 2018 Building Performance Analysis Conference and SimBuild Co-Organized by ASHRAE and IBPSA-USA, Chicago, IL, USA, 26–28 September 2018. [Google Scholar]
  10. Motamedi, S.; Liedl, P. Integrative algorithm to optimize skylights considering fully impacts of daylight on energy. Energ. Build. 2017, 138, 655–665. [Google Scholar] [CrossRef]
  11. El-Abd, W.; Kamel, B.; Afify, M.; Dorra, M. Assessment of skylight design configurations on daylighting performance in shopping malls: A case study. Sol. Energy 2018, 170, 358–368. [Google Scholar] [CrossRef]
  12. Al-Obaidi, K.M.; Ismail, M.; Rahman, A.; Malek, A. Energy efficient skylight design in tropical houses. In Key Engineering Materials; Trans Tech Publications Ltd.: Stafa-Zurich, Switzerland, 2015; pp. 45–56. [Google Scholar]
  13. Laouadi, A.; Atif, M.R.; Galasiu, A. Towards developing skylight design tools for thermal and energy performance of atriums in cold climates. Build. Environ. 2002, 37, 1289–1316. [Google Scholar] [CrossRef] [Green Version]
  14. Coakley, D.; Raftery, P.; Keane, M. A review of methods to match building energy simulation models to measured data. Renew. Sustain. Energ. Rev. 2014, 37, 123–141. [Google Scholar] [CrossRef] [Green Version]
  15. Ghobad, L.; Place, W.; Cho, S. Design optimization of square skylights in office building. In Proceedings of the 13th Conference of the International Building Performance Simulation Association, Chambery, France, 26–28 August 2013. [Google Scholar]
  16. Kim, C.H.; Lee, S.E.; Kim, K.S. Analysis of energy saving potential in high-performance building technologies under Korean climatic conditions. Energies 2018, 11, 884. [Google Scholar] [CrossRef] [Green Version]
  17. Lee, K.; Baek, H.J.; Cho, C. The estimation of base temperature for heating and cooling degree-days for South Korea. J. Appl. Meteorol. Climatol. 2014, 53, 300–309. [Google Scholar] [CrossRef]
  18. DiLaura, D.L.; Houser, K.W.; Mistrick, R.G.; Steffy, G.R. The Lighting Handbook: Reference and Application; Illuminating Engineering Society of North America: New York, NY, USA, 2011; 1328p. [Google Scholar]
  19. Oh, M.; Roh, S.; Jang, M.; Park, J. Evaluation of heating and cooling load according to applying electrochromic glass to office building envelope in South Korea. Int. J. Sustain. Build. Technol. Urban Dev. 2018, 9, 158–169. [Google Scholar]
  20. Yoon, Y.J.; Moeck, M.; Mistrick, R.G.; Bahnfleth, W.P. How much energy do different toplighting strategies save? J. Archit. Eng. 2008, 14, 101–110. [Google Scholar] [CrossRef] [Green Version]
  21. Ghobad, L.; Place, W.; Hu, J. He Impact of Systems Integration on the Daylighting Performance of Skylights in Offices. Proc. SimBuild 2012, 5, 577–584. [Google Scholar]
  22. Guglielmetti, R.; Ball, B.L. A framework for daylighting optimization in whole buildings with OpenStudio. In Proceedings of the ASHRAE and IBPSA-USA SimBuild 2016, Salt Lake City, UT, USA, 8–12 August 2016. [Google Scholar]
  23. Futrell, B.J.; Ozelkan, E.C.; Brentrup, D. Optimizing complex building design for annual daylighting performance and evaluation of optimization algorithms. Energ. Build. 2015, 92, 234–245. [Google Scholar] [CrossRef]
  24. Nabil, A.; Mardaljevic, J. Useful daylight illuminances: A replacement for daylight factors. Energ. Build. 2006, 38, 905–913. [Google Scholar] [CrossRef]
  25. Drury, B.C. Which Weather Data Should You Use for Energy Simulation of Commercial Buildings? In Weather Data for Simulation. Available online: https://energyplus.net/weather/simulation (accessed on 20 November 2019).
  26. Kim, K.; Oh, J.; Jeong, W. Study on solar radiation models in South Korea for improving office building energy performance analysis. Sustainability 2016, 8, 589. [Google Scholar] [CrossRef] [Green Version]
  27. Lee, S.J.; Lee, M.W.; Kim, H. Decision of lighting power density for office building lighting. J. Korean Inst. Illum. Electr. Install. Eng. 2012, 26, 22–28. [Google Scholar]
  28. Jung, Y.; Lee, H.; Kim, J.; Cho, Y.; Kim, J.; Lee, Y. Spatio-temporal characteristics in the clearness index derived from global solar radiation observations in Korea. Atmosphere 2016, 7, 55. [Google Scholar] [CrossRef] [Green Version]
Figure 1. The three climate zones of South Korea and two selected cities for the study.
Sustainability 12 03117 g001
Figure 2. The process of skylight performance evaluation and optimization.
Sustainability 12 03117 g002
Figure 3. Building ceiling layering scheme with an installed skylight.
Sustainability 12 03117 g003
Figure 4. Illuminance map with the location of sensor for lighting control.
Sustainability 12 03117 g004
Figure 5. Standard regression coefficient.
Sustainability 12 03117 g005
Figure 6. Predicted skylight energy performance with ceiling depth excluded: (a) Ulsan, and (b) Seoul.
Sustainability 12 03117 g006
Figure 7. Predicted skylight energy performance under Ulsan climatic conditions by ceiling depth: (a) 1.5 m, (b) 2 m, (c) 2.5 m, and (d) 3 m.
Sustainability 12 03117 g007
Figure 8. Predicted skylight energy performance under Seoul climatic conditions by ceiling depth: (a) 1.5 m, (b) 2 m, (c) 2.5 m, and (d) 3 m.
Sustainability 12 03117 g008
Table 1. Model’s optical and thermal properties.
SurfaceMaterialReflectanceU-Value [W/m2K]Visible TransmittanceShading Coefficient
FloorBrick + heavyweight concrete + insulation0.30.513--
WallsHeavy concrete + insulation0.50.429--
CeilingLightweight concrete + insulation0.70.192--
GlazingFlat-styled CoolOptics-1.980.670.37
Table 2. Energy simulation conditions.
CategoryInputValues
Set pointsLighting
Cooling
Heating
300 lux
24 °C
20 °C
Internal loadsLighting density
Occupancy
People load
11.34 W/m2
9.3 m2/person
117.2 W
COPCooling system
Heating system
3
0.8
Infiltration-2.19 m3/hr × m2
Operation hours9am–5pm-
Lighting controlContinuous dimming
(3 steps)
-
Table 3. UDI for different SRR and ceiling depth (Ulsan)
SRR%1234567891011121314151617181920
Ceiling Depth
0 mPPYYYEEEEEEEEEEEEEEE
1.5 mPPPPYYYYEEEEEEEEEEEE
2 mPPPPPYYYYEEEEEEEEEEE
2.5 mPPPPPYYYYYEEEEEEEEEE
3 mPPPPPPPYYYYEEEEEEEEE
Table 4. UDI for different SRR and ceiling depth (Seoul)
SRR%1234567891011121314151617181920
Ceiling Depth
0 mPPYYYEEEEEEEEEEEEEEE
1.5 mPPPPYYYYEEEEEEEEEEEE
2 mPPPPPYYYYEEEEEEEEEEE
2.5 mPPPPPPYYYYEEEEEEEEEE
3 mPPPPPPPYYYYEEEEEEEEE

