Solid Waste Characterization and Recycling Potential for a University Campus in China


Abstract
1. Introduction
2. Methodology
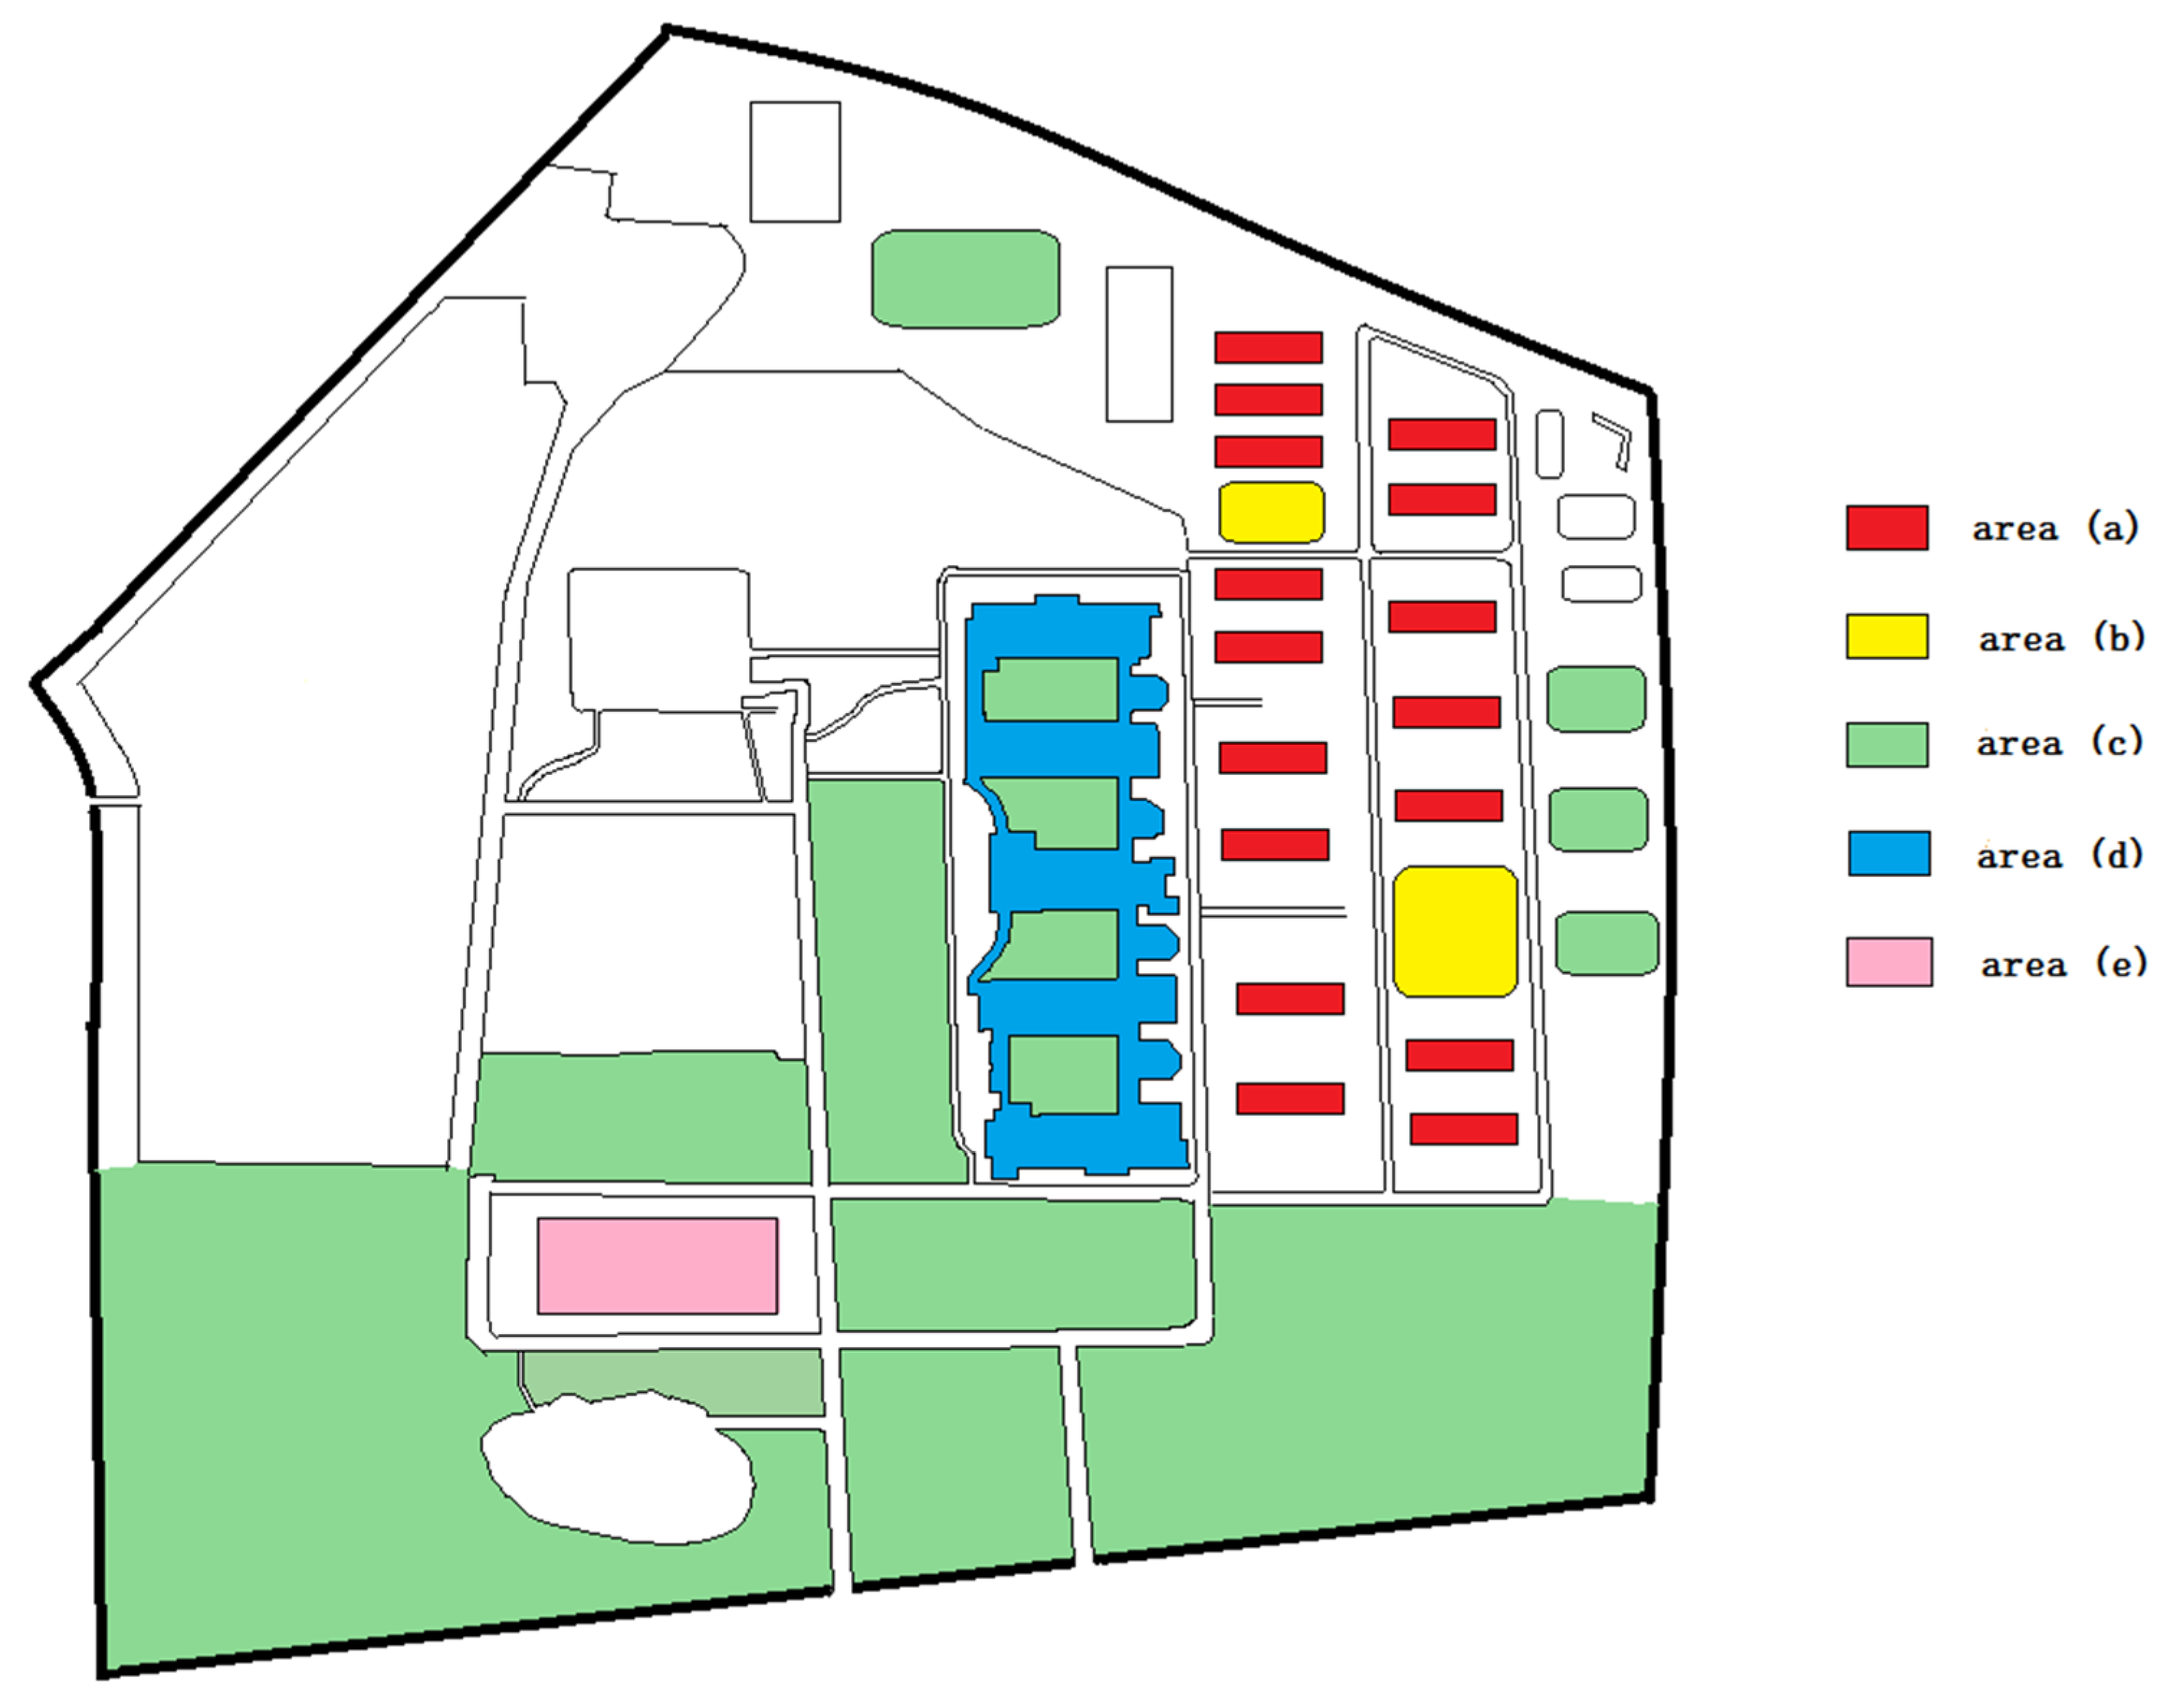
2.1. Site Description
2.2. Waste Collection System on the LL Campus
2.3. Waste Categorization and Recycling Potential Rating
2.4. Sampling Frame
2.5. Scope of the Study and Data Collection
2.6. Data Recording and Analysis
3. Results and Discussion
3.1. Daily Solid Waste Generation
3.2. The Recycling Potential
3.3. Waste Characterization
3.3.1. Organic Waste
3.3.2. Plastics
3.3.3. Paper and Cardboard
3.3.4. Other Types of Solid Waste
3.4. Influencing Factors of Waste Characterization and Recycling Potential
4. Conclusions
Author Contributions
Funding
Conflicts of Interest
References
- Chen, X.; Geng, Y.; Fujita, T. An overview of municipal solid waste management in China. Waste Manag. 2010, 30, 716–724. [Google Scholar] [CrossRef] [PubMed]
- Li, G. Launching pilot project of “Waste-free City” to improve the level of solid waste resource utilization. Environ. Prot. 2019, 47, 8–9. [Google Scholar] [CrossRef]
- General Office of the State Council of China. Notice of the General Office of the State Council on the issuance of the Pilot Work Plan for the Construction of “No Waste City”. Available online: http://www.gov.cn/zhengce/content/2019-01/21/content_5359620.htm (accessed on 16 February 2020).
- Shanghai Municipal People’s Congress. Shanghai Domestic Waste Management Regulations. Available online: http://www.spcsc.sh.cn/n1939/n2440/n5781/u1ai190025.html (accessed on 19 February 2020).
- Ministry of Housing and Urban-Rural Development of China. National Urban Domestic Waste Classification Work Conference was Held in Shanghai. Available online: http://www.mohurd.gov.cn/jsbfld/201902/t20190222_239548.html (accessed on 19 February 2020).
- Li, D. Evolutionary game analysis on the supervision mechanism of waste sorted collection in colleges and universities. Chin. J. Environ. Manag. 2017, 5, 90–94. [Google Scholar] [CrossRef]
- Alshuwaikhat, H.M.; Abubakar, I. An integrated approach to achieving campus sustainability: Assessment of the current campus environmental management practices. J. Clean. Prod. 2008, 16, 1777–1785. [Google Scholar] [CrossRef]
- Smyth, D.P.; Fredeen, A.L.; Booth, A.L. Reducing solid waste in higher education: The first step towards ‘greening’ a university campus. Resour. Conserv. Recycl. 2010, 54, 1007–1016. [Google Scholar] [CrossRef]
- De Vega, C.A.; Ojeda Benítez, S.; Ramirez Barretob, M.E. Solid waste characterization and recycling potential for a university campus. Waste Manag. 2008, 28, S21–S26. [Google Scholar] [CrossRef]
- Rada, E.C.; Bresciani, C.; Girelli, E.; Ragazzi, M.; Schiavon, M.; Torretta, V. Analysis and measures to improve waste management in schools. Sustainability 2016, 8, 840. [Google Scholar] [CrossRef]
- Lonescu, G.; Rata, E.C.; Ragazzi, M.; Marculescu, C.; Badea, A.; Apostol, T. Integrated municipal solid waste scenario model using advanced pretreatment and waste to energy processes. Energy Conversion and Management 2013, 76, 1083–1092. [Google Scholar] [CrossRef]
- Painter, K.; Thondhlana, G.; Kua, H.W. Food waste generation and potential interventions at Rhodes University, South Africa. Waste Manag. 2016, 56, 491–497. [Google Scholar] [CrossRef]
- Adeniran, A.E.; Nubi, A.T.; Adelopo, A.O. Solid waste generation and characterization in the University of Lagos for a sustainable waste management. Waste Manag. 2017, 67, 3–10. [Google Scholar] [CrossRef]
- Gebreeyessus, G.D.; Berihun, D.; Terfassa, B. Characterization of solid wastes in higher education institutions: The case of Kotebe Metropolitan University, Addis Ababa, Ethiopia. Int. J. Environ. Sci. Technol. 2019, 16, 3117–3124. [Google Scholar] [CrossRef]
- Trends in Solid Waste Management. Available online: https://datatopics.worldbank.org/what-a-waste/trends_in_solid_waste_management.html (accessed on 10 March 2020).
- Implementation Plan of Municipal Solid Waste Classification System (in Chinese). Available online: http://www.gov.cn/zhengce/content/2017-03/30/content_5182124.htm (accessed on 10 March 2020).
- Yang, G.; Pan, X.; Luo, Y. Dynamic relationship between resources sustainability and human development and policy implications. Economist 2014, 36–45. [Google Scholar] [CrossRef]
- Zen, I.S.; Subramaniam, D.; Sulaiman, H.; Saleh, A.L.; Omar, W.; Salim, M.R. Institutionalize waste minimization governance towards campus sustainability: A case study of Green Office initiatives in Universiti Teknologi Malaysia. J. Clean. Prod. 2016, 135, 1407–1422. [Google Scholar] [CrossRef]
- Feng, W.; Cai, Y.; Gu, B. Population, Policy, and Politics: How Will History Judge China’s One-Child Policy? Popul. Dev. Rev. 2013, 38, 115–129. [Google Scholar] [CrossRef]
- Cameron, L.; Erkal, N.; Gangadharan, L.; Meng, X. Little emperors: Behavioural impacts of China’s one-child policy. Science 2013, 339, 953–957. [Google Scholar] [CrossRef] [PubMed]
- Zhang, D.; Jiang, Q.; Ma, X.; Li, J. Drivers for food risk management and corporate social responsibility; a case of Chinese food companies. J. Clean. Prod. 2014, 66, 520–527. [Google Scholar] [CrossRef]
- Qi, X. Face: A Chinese concept in a global sociology. J. Sociol. 2011, 47, 279–295. [Google Scholar] [CrossRef]
- Westerman, P.W.; Bicudo, J.R. Management considerations for organic waste use in agriculture. Bioresour. Technol. 2005, 96, 215–221. [Google Scholar] [CrossRef]
- Mason, I.G.; Brooking, A.K.; Oberender, A.; Harfordb, J.M.; Horsleyb, P.G. Implementation of a zero waste program at a university campus. Resour. Conserv. Recycl. 2003, 38, 257–269. [Google Scholar] [CrossRef]
- Yildiz, S.; Yaman, C.; Demir, G.; Ozcan, H.K.; Coban, A.; Okten, H.E.; Sezer, K.; Goren, S. Characterization of municipal solid waste in Istanbul, Turkey. Environ. Prog. Sustain. Energy 2013, 32, 734–739. [Google Scholar] [CrossRef]
- Convery, F.; Mcdonnell, S.; Ferreira, S. The most popular tax in Europe? Lessons from the Irish plastic bags levy. Environ. Resour. Econ. 2007, 38, 1–11. [Google Scholar] [CrossRef]
- Bird, J. What a waste: Online Retail’s Big Packaging Problem. Available online: https://www.forbes.com/sites/jonbird1/2018/07/29/what-a-waste-online-retails-big-packaging-problem/#6cb6c66e371d (accessed on 10 March 2020).
- Mondejar-Jimenez, J.; Ferrari, G.; Secondi, L.; Principato, L. From the table to waste: An exploratory study on behaviour towards food waste of Spanish and Italian youths. J. Clean. Prod. 2016, 138, 8–18. [Google Scholar] [CrossRef]
- Stangherlin, I.; de Barcellos, M.D. Drivers and barriers to food waste reduction. Br. Food J. 2018, 120, 2364–2387. [Google Scholar] [CrossRef]
- Hebrok, M.; Boks, C. Household food waste: Drivers and potential intervention points for design—an extensive review. J. Clean. Prod. 2017, 151, 380–392. [Google Scholar] [CrossRef]
- Merrow, K.; Penzien, P.; Dubats, T. Exploring Food Waste Reduction in Campus Dining Halls. Available online: https://wmich.edu/sites/default/files/attachments/ENVS%204100%20Final%20Project%20Report%20-%20Merrow,%20Penzien,%20Dubats.pdf (accessed on 4 April 2020).


| Area | Building Groups | The Number of Cleaners |
|---|---|---|
| (a) | Seven male dormitory buildings, nine female dormitory buildings | 28 |
| (b) | First cafeteria and second cafeteria | 24 |
| (c) | Gardens, playgrounds, and roads | 9 |
| (d) | Academic area (including administrative building, computer building, teaching building) | 16 |
| (e) | Laboratory building | 10 |
| Category | Description | Recyclability Levelb | ||
|---|---|---|---|---|
| 1 | 2 | 3 | ||
| Organic waste | Food waste | √ | ||
| Leaves, branches, flowers, corn cobs, etc. | √ | |||
| Animal carcasses | √ | |||
| Plastics | Plastic packaging bags, disposable plastic bags, food bags, etc. | √ | ||
| Plastic bottlesa | √ | |||
| Cardboard and paper | Cardboard packaging, paper boxes, etc. | √ | ||
| Printing paper, book paper, etc. | √ | |||
| Sanitary waste | Toilet paper, sanitary pads, etc. | √ | ||
| Others | Glass utensils | √ | ||
| Metal, tin cans, aluminium bottles, etc. | √ | |||
| Clothes, textiles, etc. | √ | |||
| Sand, dirt, hair, etc. | √ | |||
| Area (a) | Area (b) | Area (c) | Area (d) | Area (e) | Recycling Waste Collector | Waste Transporter | Local Recycling Centre Employee | Total | |||||
|---|---|---|---|---|---|---|---|---|---|---|---|---|---|
| Cleaner | Gardener | Cleaner | Lab Technician | Food Waste Transporter | Other Waste Transporter | ||||||||
| Gender | Male | 56 | 51 | 22 | 6 | 30 | 10 | 9 | 2 | 2 | 6 | 4 | 198 |
| Female | 75 | 37 | 13 | 0 | 42 | 33 | 14 | 2 | 0 | 0 | 2 | 218 | |
| Age group (years old) | 30 and younger | 0 | 0 | 0 | 0 | 0 | 0 | 21 | 0 | 0 | 0 | 0 | 21 |
| 31–40 | 2 | 0 | 0 | 0 | 0 | 2 | 1 | 1 | 1 | 1 | 0 | 8 | |
| 41–50 | 32 | 1 | 2 | 0 | 9 | 11 | 1 | 0 | 1 | 1 | 2 | 60 | |
| 51–60 | 74 | 46 | 24 | 5 | 46 | 30 | 0 | 3 | 0 | 4 | 3 | 235 | |
| Above 60 | 23 | 41 | 9 | 1 | 17 | 0 | 0 | 0 | 0 | 0 | 1 | 92 | |
| Total | 131 | 88 | 35 | 6 | 72 | 43 | 23 | 4 | 2 | 6 | 6 | 416 | |
| Month | Mean Daily Waste Generation (% of the total) | Sum of Means | ||||
|---|---|---|---|---|---|---|
| Area (a) | Area (b) | Area (c) | Area (d) | Area (e) | ||
| Nov 2018 | 2.82 (30.1) | 2.95 (31.5) | 2.53 (27.1) | 0.91 (9.7) | 0.15 (1.6) | 9.36 (100) |
| Dec 2018 | 2.60 (33.4) | 3.49 (44.9) | 1.28 (16.5) | 0.15 (1.9) | 0.26 (3.3) | 7.78 (100) |
| Jan 2019 | 1.64 (28.1) | 2.74 (47.1) | 0.69 (11.9) | 0.28 (4.8) | 0.47 (8.1) | 5.82 (100) |
| Feb 2019 | 3.02 (37.4) | 3.16 (39.2) | 1.56 (19.3) | 0.20 (2.5) | 0.13 (1.6) | 8.07 (100) |
| Mar 2019 | 3.05 (35.5) | 4.83 (56.2) | 0.03 (0.3) | 0.38 (4.4) | 0.31 (3.6) | 8.60 (100) |
| Apr 2019 | 5.42 (52.7) | 4.00 (38.9) | 0.08 (0.8) | 0.46 (4.5) | 0.32 (3.1) | 10.28 (100) |
| May 2019 | 3.24 (38.1) | 4.35 (51.1) | 0.12 (1.4) | 0.45 (5.3) | 0.35 (4.1) | 8.51 (100) |
| Jun 2019 | 3.99 (44.7) | 3.83 (42.9) | 0.09 (1.0) | 0.61 (6.8) | 0.41 (4.6) | 8.93 (100) |
| Jul 2019 | 1.19 (47.8) | 0.54 (21.6) | 0.01 (0.4) | 0.17 (6.7) | 0.59 (23.5) | 2.50 (100) |
| Aug 2019 | 0.68 (25.6) | 1.20 (45.3) | 0.01 (0.4) | 0.12 (4.6) | 0.64 (24.1) | 2.65 (100) |
| Sep 2019 | 1.94 (27.8) | 4.13 (59.3) | 0.05 (0.7) | 0.35 (5.0) | 0.50 (7.2) | 6.97 (100) |
| Oct 2019 | 2.42 (30.0) | 4.53 (56.1) | 0.40 (4.9) | 0.33 (4.1) | 0.40 (4.9) | 8.08 (100) |
| Average | 2.67 (36.6) | 3.31 (45.3) | 0.57 (7.8) | 0.37 (5.1) | 0.38 (5.2) | 7.32 (100) |
| Average waste generation per day from November 2018 to October 2019: 7.32 tonnes | ||||||
| Average waste generation per student per day from November 2018 to October 2019: 487 g | ||||||
| Country of Study | Annual Growth of GDP per Capita in the 5 Years before the Study (%) | Waste Generation | Recycling Potential (%) | Food (%) | Plastics (%) | Paper & Cardboard (%) | |||
|---|---|---|---|---|---|---|---|---|---|
| Tonne/Day | g/Day/Student | ||||||||
| Previous studies | de Vega et al. (2008)a | Mexico | 1.44 | 1 | N/A | 65.00 | 2.68h | 4.84 | 26.60 |
| Smyth et al. (2010)b | Canada | 1.77 | 0.24g | 16g | 71.60 | 21.64 | 8.10 | 29.10 | |
| Zen et al. (2016)c | Malaysia | 3.87 | 0.56 | 830 | 86.60 | 46.00 | 12.91 | 16.12 | |
| Adeniran et al. (2017)d | Nigeria | 0.93 | 32.2 | 370 | 75.00 | 1.50i | 33.00 | 15.00 | |
| Gebreeyessus (2019)e | Ethiopia | 6.36 | 0.20 | 93 | 93.00 | 84.41 | 1.83 | 3.65 | |
| This study | Zhang et al. (2020) | China | 6.31f | 7.32 | 487 | 79.31 | 60.83 | 10.52 | 11.48 |
| Waste Categories | % of the Weight of Solid Waste in the Area | ||||||
|---|---|---|---|---|---|---|---|
| Area (a) | Area (b) | Area (c) | Area (d) | Area (e) | Overall | ||
| Organics | Food waste | 37.82 | 94.00 | 6.40 | 26.14 | 42.85 | 60.83 |
| Leaves | 0.00 | 0.00 | 80.86 | 0.00 | 0.33 | 6.28 | |
| Animal carcasses | 0.00 | 0.00 | 0.00 | 0.00 | 1.34 | 0.07 | |
| Plastics | Plastic packaging bags | 15.26 | 3.90 | 5.20 | 19.58 | 17.48 | 10.52 |
| Plastic bottles | 1.14 | 0.10 | 0.78 | 1.12 | 0.66 | 0.61 | |
| Paper and cardboard | 20.27 | 0.00 | 4.20 | 22.93 | 16.49 | 11.48 | |
| Sanitary waste | 25.39 | 1.98 | 2.48 | 30.23 | 20.35 | 10.12 | |
| Others | 0.12 | 0.02 | 0.08 | 0.00 | 0.50 | 0.09 | |
| Total | 100.00 | 100.00 | 100.00 | 100.00 | 100.00 | 100.00 | |
| GDP per Capita Growth in the 5 Years before the Research (annual, %) | Weight (g/day/person) | Recycling Potential (%) | Food (%) | Plastic (%) | Paper & Cardboard (%) | |
|---|---|---|---|---|---|---|
| GDP per capita growth rate in the 5 years before the research (annual, %) | 1 | |||||
| Weight (g/day/person) | 0.098 ns | 1 | ||||
| Recycling potential (%) | 0.762 ns | 0.210 ns | 1 | |||
| Food (%) | 0.964** | −0.011ns | 0.866* | 1 | ||
| Plastics (%) | −0.483 ns | 0.293ns | −0.162 ns | −0.514 ns | 1 | |
| Paper & cardboard (%) | −0.633 ns | −0.144 ns | −0.779 ns | −0.630 ns | −0.219 ns | 1 |
© 2020 by the authors. Licensee MDPI, Basel, Switzerland. This article is an open access article distributed under the terms and conditions of the Creative Commons Attribution (CC BY) license (http://creativecommons.org/licenses/by/4.0/).
Share and Cite
Zhang, D.; Hao, M.; Chen, S.; Morse, S. Solid Waste Characterization and Recycling Potential for a University Campus in China. Sustainability 2020, 12, 3086. https://doi.org/10.3390/su12083086
Zhang D, Hao M, Chen S, Morse S. Solid Waste Characterization and Recycling Potential for a University Campus in China. Sustainability. 2020; 12(8):3086. https://doi.org/10.3390/su12083086
Chicago/Turabian StyleZhang, Dongyong, Mengge Hao, Sida Chen, and Stephen Morse. 2020. "Solid Waste Characterization and Recycling Potential for a University Campus in China" Sustainability 12, no. 8: 3086. https://doi.org/10.3390/su12083086
APA StyleZhang, D., Hao, M., Chen, S., & Morse, S. (2020). Solid Waste Characterization and Recycling Potential for a University Campus in China. Sustainability, 12(8), 3086. https://doi.org/10.3390/su12083086