Abstract
Automatic number plate recognition (ANPR) systems, which have been widely equipped in many cities, produce numerous travel data for intelligent and sustainable transportation. ANPR data operate at an individual level and carry the unique identities of vehicles, which can support personalized traffic planning. However, these systems also suffer from the common problem of missing data. Different from the traditional missing cases, we focus on the problem of the loss of vehicle identities in ANPR records due to recognition failure or other environmental factors. To address the issue, we propose a heterogeneous graph embedding framework that constructs a travel heterogeneous information network (THIN) and learns the embeddings of the entities to find the best matched vehicles for the unknown records. As a result, the recovery of vehicle identities is cast as an entity alignment task on a THIN. The proposed method integrates the vehicle group entities and context relations into the THIN for capturing the spatiotemporal relationships in vehicle travel and adopts a holographic embeddings model for better fitting the network structure. Empirically, we test it with a real ANPR dataset collected from Xuancheng, China, which has a densely-distributed camera network. The experiments demonstrate the effectiveness of the proposed graph structure under different missing rates. Further, we compare it with other embedding methods and the results support the superiority of holographic embeddings.
1. Introduction
Nowadays, transportation systems have entered an era of data-driven intelligence [1,2] in order to alleviate the conventional but intractable problem of traffic congestion and further improve the efficiency. In other words, multisource traffic data should be fed into the intelligent transportation systems (ITS). Thanks to the advancement of data collection techniques, an abundance of traffic data can be obtained including loop detector data, GPS data [3], automated fare collection (AFC) data [4], cellular signaling data [5] and automatic number plate recognition (ANPR) data [6]. High-quality traffic data can support a diversity of transportation applications like dynamic traffic forecasting [7], route planning [8] and accident warning [9].
Among those data sources, ANPR systems have attracted the most attention lately. Benefiting from the rapid development of infrastructure construction as well as the algorithms in computer vision, massive traffic data can be collected from the image-based sensors [10]. The equipment is always installed at different directions of the intersections for violation monitoring and security surveillance. When a vehicle passes through, the camera detects its movement and takes a photograph of it. Then optical character recognition is applied to read vehicle license plates to create vehicle location data. These data include individual vehicle travel information as well as traffic state statistics, making them distinguished from traditional data. Therefore, such systems have been broadly deployed for personalized ITS applications, especially in China. Take Xuancheng, Anhui, for example; the deployment coverage had reached 85% (109 intersections of 129 in total) in the central area by the end of 2018.
Unfortunately, the ANPR data inevitably suffer from the missing data problem in the process of data collection [11], which goes against sustainable development. Due to detection failure and device malfunction, we might see traffic data missing in certain spaces and times, which is ubiquitous in other systems and has been addressed by much research [12,13,14,15]. For individual level data, the missing case can be the loss of vehicle identities of certain records because of number plate recognition failure, which might influence the performance and reliability of individual travel data. Table 1 shows several anonymous records from an ANPR database, in which there is one without an identification label. Besides, for the reason of different illuminations, resolutions and flow volumes, the missing rates vary along different times of day, as illustrated in Figure 1. In this work, we aim at inferring the missing vehicle identities accurately given the raw ANPR records from a road network.

Table 1.
Anonymous automatic number plate recognition data samples.
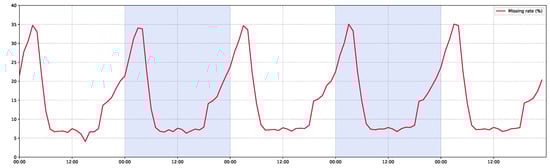
Figure 1.
Hourly distribution of vehicle identity missing rate (red line) of 109 intersections in Xuancheng, Anhui from 6–10 August in 2018.
However, we are confronted with some challenges in order to address the above problem. First, taking the original data as independent records will lead to a sparsity problem as the features are not always adequate and the motion of vehicles at intersections act like cells. Therefore, we should take both the context records and the similar vehicles’ movements into account. For example, vehicles with similar travel sequences could help recover the missing information for each other. As a result, it requires us to model the interactions among the involved objects (e.g., vehicles, locations, times) properly, which gives rise to the second challenge. These interactions are so complex to model for their intrinsic heterogeneous and semi-structured characteristics as illustrated in Figure 2. As we have the knowledge of vehicles’ traveling behaviors at intersections, we can integrate them into the modeling process to capture spatiotemporal relationships.
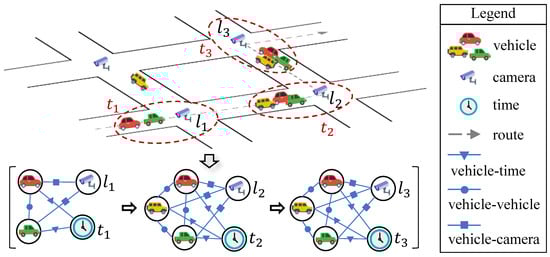
Figure 2.
Heterogeneous interactions of the involved objects during vehicle traveling.
In this work, we propose an embedding-based framework with heterogeneous information networks (HINs) as the input for missing vehicle identity recovery. In particular, we first model the involved objects in the ANPR records as entities and their relations as edges in a HIN. Then, we combine the prior knowledge of vehicles’ movements with the HIN to produce higher level entities and utilize a spatiotemporal relation model to further capture the rich context information. Given the enhanced HIN as the input, we adopt knowledge embedding techniques to learn the representations for entities and relations in a low dimensional space where similarity between entities can be preserved. At last, we treat the original task as entity alignment in the latent space by finding the similar pairs.
The contributions of this work are summarized as follows:
- We propose to recover missing vehicles’ identities in the ANPR records, which is different from the imputation of traffic state values but essential for personalized ITS applications.
- We exploit HIN to model the complex traveling data and develop an enhanced graph structure to capture the spatiotemporal relations via vehicle grouping and context link extraction.
- We treat the identities recovery problem of ANPR data as an entity alignment task on embeddings, which is evaluated on a real world dataset.
2. Literature Review
We first review the related work in missing data imputation for the ANPR system. Then we further review the problem of vehicle trajectory reconstruction, which is an essential task in ANPR data and, to some extent, the missing vehicle identity recovery problem. Finally we survey the embedding methods for heterogeneous information networks mining, which learn entity representations for downstream applications.
2.1. Missing Data Imputation for the ANPR System
The missing data problem is also common and unavoidable in the ANPR system due to the factors like device malfunctions, transmission distortion, or loss of vehicles’ identity from images [15]. To fully make use of the ANPR data for ITS applications, it is critical to accurately impute the missing data. Therefore numerous matrix-based [12,14] and tensor-based [13,15] methods have been proposed to address the missing data problem. These algorithms could take into account the spatiotemporal information and capture the traffic patterns. However, they focus on the imputation of aggregated traffic state values like traffic flow volume and speed. The problem of recovering vehicles’ identity from the extracted ANPR records is still open and has not yet been tackled, which is essential for personalized transportation. Consequently, it is necessary to develop a method to recover the loss of vehicles’ identity directly from the ANPR data.
2.2. Vehicle Trajectory Reconstruction
To make the ANPR data available for transportation data mining like origin–destination estimation and traffic simulation, it is necessary to extract vehicles’ trajectories (i.e., every single trip) by matching their detection records identified by different cameras across the network. The derived trips can be incomplete and abnormal due to the low spatial coverage and recognition error. To address the problem of trajectory data missing, a batch of vehicle trajectory reconstruction methods are proposed to restore the space-time routes. Ref. [16] uses Bayesian method to find the most likely trajectories by considering the traffic count data on the road network. Ref. [17] builds a trajectory reconstruction model integrated with order preference and depth-first search to solve the incomplete vehicle paths. Ref. [18] introduces a particle filter framework to estimate the probability of trajectories from possible candidates. However, these methods are used to fill the information of the missing trajectories which is not directly collected from the equipments and thus not presented in the raw ANPR data. In our work, as the exact vehicle passing records are obtained, our goal is to match the right vehicle IDs for the ones without identity (i.e., vehicle plate number).
2.3. Heterogeneous Network Embedding
Most data from the real world actually reflect the interaction information among the concerned objects, which naturally form heterogeneous information networks [19,20] where objects are multitypes and interconnected. Therefore a set of algorithms that can effectively handle these semi-structured data are proposed to mine the hidden but useful information from such networks. Among them, embedding techniques have grown into a preference as they can preserve the semantic patterns into the vector representations for different tasks. Recently, the latent feature embedding models have achieved remarkable success in link prediction and entity alignment, such as the compositional representation models [21,22,23] and the translation-based models [24,25,26]. We can leverage such heterogeneous network structure and embedding learning approaches in our framework.
3. Preliminaries
In this section, we introduce some important concepts to be appear in the context, followed by a formal description of the vehicle plate number recovery problem.
3.1. Concept Definition
3.1.1. Heterogeneous Information Networks
With the equipment of different types of sensors, the acquisition of multisource data becomes more effortless [1]. Their intrinsic characteristics of multitypes and interconnected naturally make themselves heterogeneous information networks [27]. These complex networks are usually multimode and multirelational, carrying rich information of the real world.
Definition 1.
An heterogeneous information network [27] is defined as a directed graph where is the set of entities and each entity belongs to a particular entity type in the type set . is the set of edges between the entities in . Similarly, involves multiple types of relations in set . Typically, it requires or . Otherwise, it will be degraded to a homogeneous network.
In our case, the ANPR data naturally form a heterogeneous information network where , corresponding to the entity types of vehicle, passing event, camera location and time span respectively. As the extracted entities and their semantic relations in mainly describe the traveling behaviors of vehicles in the road network, we further call it a travel heterogeneous information network (THIN).
3.1.2. Vehicle Group
In the basic THIN, each detection record at a specific camera location is defined as a passing event entity with the corresponding vehicle entity connects to it. This setting models each detection record separately, making the network connectivity sparse and ignoring the relationship with other companion vehicles. Refs. [28,29] proposed to model a bunch of related vehicles as a vehicle group to capture the companion pattern among them. They define vehicle group based on the co-occurrence of detection as follows.
Definition 2.
A vehicle group is defined as a crowd of vehicles passing a camera location within a certain time period . Consequently, vehicle group in camera location can be denoted as , where is a detection record specified by a vehicle ID and a passing timestamp . We can say that the members of co-occurred in location .
As we want to utilize the information from the co-occurred vehicles in the THIN, we apply vehicle group entity identification and then replace the passing event entities with them. Moreover, since we need to capture the traveling companion relationships between different camera locations, we extract links among vehicle group for the purpose of connecting the vehicle group entities which are topologically and temporally consecutive in the road network.
3.2. Problem Description
In this work, we aim to infer the missing vehicle identities of the incomplete detection records through finding the match vehicle entities. While there exists some similar techniques, like vehicle trajectory reconstruction, that can be adopted to recover the incomplete trajectory according to the historical route choice, they often fail to retrieve the real location and time of the passing event. In our scenario, we have the proper detection records of each passing event, although the vehicle IDs are lost; as a result, the real spatial and temporal information can be preserved.
The basic input is the set of detection records . For each record , we can describe it as where v is the identity of the vehicle but can be unknown if the plate number can not be recognized, l and t are the recorded location and timestamp, , and are vehicle type, vehicle color and plate color respectively which are appearance properties extracted from the raw images.
However, as we can observe, the entities of each record alone do not have adequate relevant features. Their interactions are so complicated that we can not model them via the classic matrix or tensor decomposition methods [14,30,31] which have been proven to be the dominant approach in the field of missing data imputation. As the detection data themselves are well structured and the interactions among entities are defined in a traffic adapted manner, we construct a THIN as the model input.
Finally, the output of the proposed model is the inferred vehicle identities for each detection record d. This can be done by finding the most nearest known vehicle entity from their embedding vector space and merging them as one entity.
4. Proposed Model
We present an overview of the proposed model in Section 4.1. Then, we further detailed each part of it, including the travel heterogeneous network construction in Section 4.2, embedding learning in Section 4.3 and entity alignment in Section 4.4.
4.1. Framework Overview
Figure 3 illustrates the overall embedding-based framework of the proposed model. Our goal is to learn the embeddings for all involved entities in travels (i.e., vehicles, locations, times) to infer the missing vehicle IDs. By introducing the vehicle group entities and the context relationships, they capture the spatiotemporal interactions and the proximities among different entities.
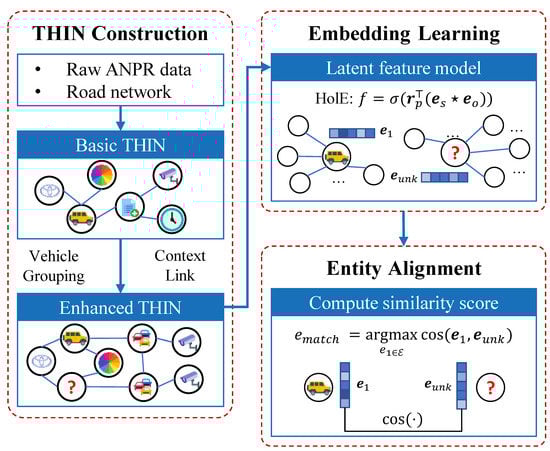
Figure 3.
Overview of the framework.
Our framework first requires the construction of a THIN, in which entities and relations are all defined elements. Intuitively, an ANPR record corresponds to a passing event entity, and then the vehicle and camera location entities can be further derived from it. For vehicle attributes, we directly treat them as property entities. With this basic THIN, we further apply vehicle grouping and context link extraction in order to model the companion interactions of vehicles and capture the semantic proximities among entities. Then we implement the latent feature based representation learning algorithms on the enhanced THIN to embed the entity features into the low dimensional space and produce a dense embedding vector for each entity e. Once we obtain the embeddings for all entities, the entity alignment unit finds every pair with a proper similarity score where entities and belong to the same type . whose identity is unknown is the entity extracted from an incomplete record.
4.2. Travel Heterogeneous Network Construction
In this section, we construct a THIN, which has different types of entity and relation, to transform the ANPR data into a relational structure. Basically, we have seven types of original entities extracted from the raw data: vehicles, camera locations, passing events, timestamps, vehicle colors, vehicle types and plate colors. Among them, vehicles, camera locations, passing events and timestamps are object entities corresponding to the real world instances, while the rest are property entities serving as auxiliary entities. Particularly, passing events are objects describing the behaviour of real world entities (e.g., vehicles) happened at certain moments (or periods) and at specific locations. Figure 4 illustrates the schema of the basic THIN.
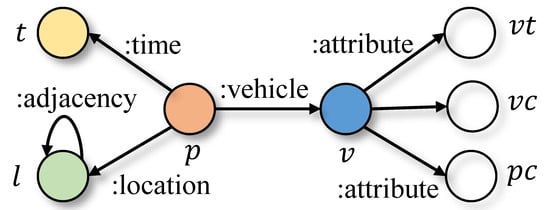
Figure 4.
Schema of the basic THIN. Symbol represent the entity types vehicle, camera site, passing event, timestamp, vehicle color, vehicle type and plate color.
Note that when encountering an incomplete ANPR record, we still extract a vehicle entity from it in the same manner. However, the vehicle identity value of this entity is set as null or unknown as we are going to find the aligned entity for it to recover the missing vehicle identity.
To address the sparsity of spatiotemporal data and fully utilize the information from companion vehicle entities, we apply vehicle grouping and spatiotemporal relationships extraction to finally present the enhanced THIN.
4.2.1. Vehicle Grouping
As mentioned above, the current THIN models the vehicle passing events as different separate entities connecting to the camera location entity network and the timestamp entities. This graph model brings two challenges for the task of vehicle alignment. For a vehicle entity whose identity is unknown, its connections to the other entities in the network is sparse. In other words, there are not sufficient features can be utilized, making it difficult to model the travel pattern of the vehicle. Besides, we neglect the physical interactions of vehicles’ movements. When exploring a particular object (e.g., a vehicle here), it would be informative to take the instances when the object interacts with others into account. For example, two vehicles may travel together along the same sequence of intersections in a road network. If we could discover this companion pattern, the travel information of one vehicle can be used for inferring the trajectory of the another one. Therefore, it is intuitive to consider the spatiotemporal information from companion vehicles for assistance.
Based on the ideas above, we conduct vehicle grouping process to create a new type of entity. As defined in Section 3.1, for each location l of camera sites in time period , we replace the passing event entities, which is linked to l and t between with a single vehicle group entity g. Figure 5 illustrates the operation of vehicle grouping, where circles and ovals with dash border on the left are passing events of vehicles and vehicle group entities respectively. After that, entity g is connected to l and the relevant vehicle entities on the right of Figure 5.
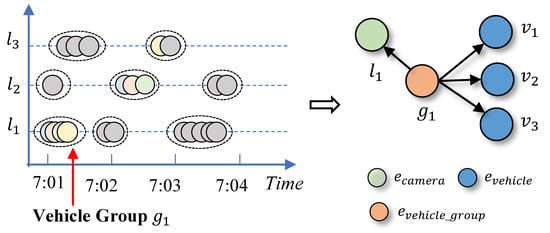
Figure 5.
Illustration of vehicle grouping. On the left, circles denotes the passing events of different vehicles while the ovals denotes the generated vehicle groups.
However, while we succeed in discovering the companion structures in each camera location, the context patterns along different locations and time periods remain unrevealed. Next we further exploit it via vehicle group spatiotemporal relation extraction.
4.2.2. Vehicle Group Spatiotemporal Relation Extraction
In order to capture the companion traveling patterns beyond one stationary location, it is necessary to connect the vehicle group entities that appear in the context of nearby locations and time periods. Obviously, in the traveling scenario, we can observe that two vehicles are more likely to be the same vehicle if they appear in small space or time distance, otherwise the opposite. This procedure can help preserving proximities and further letting the expected aligned vehicle entities share similar embeddings.
With this in mind, context links are introduced among vehicle group entities to model the relationships between detected records spatially and temporally. As the vehicle group entities already hold both space and time information, the context connections between them are spatiotemporal relations. Specifically, for vehicle group entities and , we extract a spatiotemporal relation between them if they satisfy the following two conditions: (1) without loss of generality, the camera site of is located at the downstream intersection of (i.e., the camera location of ); (2) the beginning time of has a time-delay (but within the limits of a threshold) after of according to the road segment between and . Figure 6 gives an illustration of how spatiotemporal context links extract. After this process, the connection structure of certain entities have renewed which corresponds to the partial graph on the right.
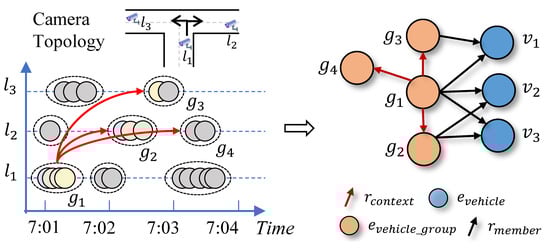
Figure 6.
Context link extraction. The red arrows on the left represent the context relations between vehicle groups, which are determined by the above camera topology and the time threshold.
4.2.3. Enhanced THIN Construction
After the above two procedures, we formally construct the enhanced THIN. Now we have 6 types of entities: vehicles, camera locations, vehicle groups, vehicle colors, vehicle types and plate colors. Comparing with the previous network schema, vehicle group entities take the place of passing event entities and timestamps entities are removed as the time information is encapsulated in the vehicle group entities and their relations. Moreover, embedding every timestamps entities is impractical in representation learning.
Next, we detail all kinds of edges in our enhanced THIN. First, for vehicles and their appearance properties, there are three attribute relationships, namely vehicle–vehicle color edges, vehicle–vehicle type edges and vehicle–plate color edges. Then with regard to the relationships between the object entities, we treat vehicle group entities as central entities and their edges to other entities can be easily derived in accordance with the traveling semantic. As a result, we have location relations between vehicle group and camera location, member relations between vehicle group and vehicle and context relations between vehicle group themselves. Finally, the adjacency relationships are reserved between camera location entities adhering to the topology of the road network. The updated graph schema is illustrated in Figure 7.
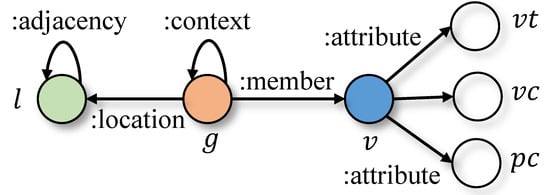
Figure 7.
Schema of the enhanced THIN. Symbol g represents the entity type of vehicle group.
4.3. Embedding Learning
In this section, we resort to the latent feature models for representation learning on heterogeneous graph.
4.3.1. Generic Learning Setting
For the sake of clearness, we refer to each relational structure in an HIN as a SPO (i.e., subject, predicate, object) triplet where s and o are entities and p is the relation between them. Then function indicates whether or not it is a possible triplet of .
These models assume that the presence or absence of certain triplets is correlated with each other [32]. And they explain triplets via embedded features of entities and relations which are composed of implicit components learned from relational data. To learn of the triplets, we can transform it into a supervised learning problem by estimating the probability . The formulation can be written as:
where are learned representations of different vector spaces, denotes the sigmoid function, parameter denotes the set of all embeddings and is called score function representing the confidence of the existence of triplet . The score function is the key unit to model the interactions of the embeddings inside a triplet.
Given relational dataset containing valid and invalid tuples, our goal is to learn the embeddings that fits best according to (1). This can be done by optimizing the following pairwise ranking loss:
where S, denote the set of valid and invalid triplets respectively and is a margin hyperparameter. As an HIN only stores valid relationships, the negative relations of can be generated by corrupting the valid triplets from S.
4.3.2. HolE
There are generally two kinds of embedding learning models according to whether they explicitly or not form compositional representations of the embeddings. For compositional vector space models, they adopt varied compositional operators such as tensor product [21] to capture rich interactions. While the non-compositional methods introduce translations of entity embeddings.
Here, we exploit the difference by taking HolE [23] and TransE [24] as examples. HolE uses the circular correlation to model the interaction between subject and object which is defined as:
where denotes the circular correlation operator. Further it computes the similarity between the intermedia result and the predicate as the score of a triplet:
As for TransE, it directly measures the distance of the translations of entities in the score function:
Figure 8 shows the element-wise interactions among the embeddings. For TransE, the latent features of entities are combined (i.e., linear summation or subtraction) independently. In contrast, HolE explicitly models all relationships between the latent features of different entities via circular correlation which allows to capture the complex interaction between subject and object with the multiplicative forms. As a result, the modeling power of HolE is naturally more expressive.
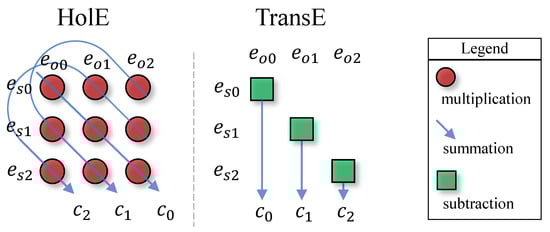
Figure 8.
Element-wise interactions between entities of a triplet. Vector is the intermediate result of subject entity and object entity. (Adapted from [23]).
Moreover, different from quantifying the similarities with the circular correlation results in HolE, the predicate in (5) is modeled as the transition vectors between subject and object, which brings restrictions to the distributions of entities and relations in the vector space. As illustrated in Figure 9, we will get the same embeddings for vehicle group entities as well as vehicle entities (i.e., and ) since TransE can not deal with the one-to-many and many-to-one member relation in the enhanced THIN. These embeddings ignore the difference among entities and thus contradict the truth. Considering the flexibility of circular correlation as well as the complex relation structure of the enhanced THIN, we adopt HolE to the embedding learning problem.
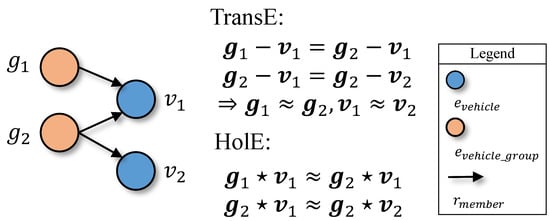
Figure 9.
The example of one-to-many, many-to-one, and many-to-many relations. TransE learns the same embeddings for the involved entities.
4.4. Entity Alignment
The above model learns embeddings for each entities and lets similar entities have similar embeddings. In the context of our problem, we care more about the entities of type vehicle so we denote them as . Then, we can compute the similarity using the result embedding vector with the following equation:
is a vehicle entity with unknown vehicle identity extracted from a corrupted detection record and indicates the set of vehicle entities except the ones with unknown vehicle identity. Our goal is to compute the similarity score between the target entity and all entities . As a result, is the expected aligned entity pair and we can recover the vehicle identity of by merging them into one entity . Note that to avoid the entities that are too dissimilar to be aligned, a threshold is introduced.
5. Experiments and Discussion
5.1. Experimental Settings
5.1.1. Dataset
We use the real world ANPR data obtained from Xuancheng, China, which has wide coverage of high-definition cameras deployed at signalized intersections. The ANPR system data are anonymized and the usage of them is authorized by the Public Security Bureau of Xuancheng. To efficiently evaluate different models, we choose a specific area shown in Figure 10 where 9 intersections (red markers) are selected and a time period from 7:00 a.m. to 11:00 a.m. on 7 August 2018. The study area is located at the center of the city and each intersection is equipped with cameras in different directions (i.e., 35 cameras in total). The average distance between the adjacent intersections is about 500 m, making it clear to identify the spatiotemporal context.
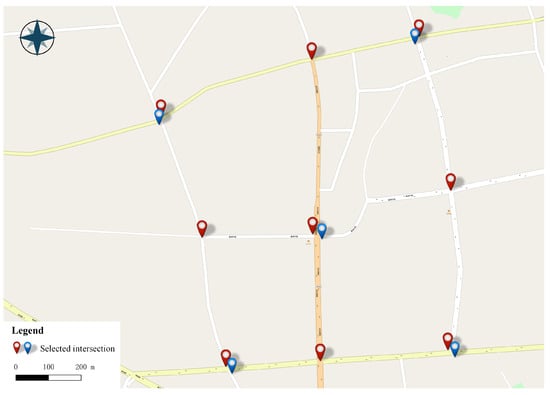
Figure 10.
A small area of Xuancheng where red markers indicate all 9 selected intersections with cameras installed in all entrances. The blue markers denote the 5 selected intersections in a sparser camera network.
After data preproccess, only those consecutive records of the same vehicles remain. Then the dataset is restructured into a THIN . As indicated in Figure 1, the missing rate in the daytime is around 7% but can reach 35% at night. Under the circumstance, we only consider the low missing rate scenarios as most concerned travels happen between the morning peak and the evening peak. Thus we evaluate the performance with 5% and 10% missing rates by randomly removing the vehicle identities. Furthermore, in order to investigate the effect of the distribution of cameras, we generate another THIN by selecting a sparser network of cameras. includes four intersections at the corner and the central intersection as shown in Figure 10. The statistics of the result THIN and are shown in Table 2.
Table 2.
Statistics of the THIN dataset.
5.1.2. Evaluation Metrics
To evaluate the performance, we choose (i.e., the proportion of correctly aligned entities ranked in the top k predictions) and the mean of the rank (MR) of the correct entity. Higher and lower MR indicate better performance. For each entity , the ranking is accomplished according to the similarity score computed by (6). During the actual implementation, the vehicle entities connected to the same vehicle group entity are filtered out.
5.1.3. Comparisons
We compare different knowledge embedding models to investigate the effectiveness of various embedding strategies as well as the graph schemas of THIN. In addition to TransE and HolE, we further consider the following settings:
- Basic THIN: We use the basic THIN generated from the ANPR data in which there are no vehicle group entities and spatiotemporal relations.
- TransH [25] and TransR [26]: These models are proposed to improve the performance of TransE on 1-to-n, n-to-1 and n-to-n relations. By introducing more parameters, they become more expressive but less efficient. The score functions for a triplet are respectively written as:where is the normal vector of the hyperplane of relation p and is a projection matrix connecting the vector spaces of entity and relation.
5.1.4. Parameter Selection
To be fair, we use the same set of shared parameters for different models. Specifically, the embeddings dimensionality of entities is set to 64, the learning rate of the optimizer is 0.001, the batch size in model training is 100 and the margin is set to 1.
5.2. Experiment Results and Discussion
5.2.1. Performance
Table 3 shows the overall results of vehicle entity alignment. First, regarding the THIN dataset , our proposed enhanced THIN model outperforms the basic THIN in different embedding algorithms. Especially, HolE makes the biggest progress among them due to its ability to model the complex relationships. The improvements demonstrate the strength of the enhanced graph structure where the introduction of vehicle group entities and their context relationships is capable of capturing the spatial and temporal interactions of vehicles at adjacency intersections. For the basic THIN, the movements of vehicles at different locations are modeled independently, making it difficult to discover the peering patterns. Therefore, the connections inside the heterogeneous graph are too sparse to learn useful information for alignment. The results provide further justification for the proper design of the enhanced travel heterogeneous information network.
Table 3.
Vehicle entity alignment results.
Evidently, the performance gets worse when the missing rate of vehicle identities rises from 5% to 10% because the number of records with unrecognized vehicle identity increases and the chance of utilizing the information from vehicles with similar travel trajectories decreases. Meanwhile, we notice that the performance differences between two missing rates are relatively small. Consequently, we can recover the missing vehicle identities well for the ANPR data collected in the daytime.
For the chosen models, as expected, TransE has the poorest performance on the task of entity alignment as it is not designed to model the complex relations (i.e., one-to-many, many-to-one and many-to-many relations) in HINs and hence fails to distinguish those entities which are connected by or connect to the same one. To address the issue, TransH and TransR are successively proposed to capture the diversity of different types of entities and relations via multiple vector spaces. In our enhanced THIN, the linkages between the vehicle group entity and vehicle entity are typical many-to-many relations and account for the majority in the graph. As a result, these two algorithms achieve great improvements and also indicate that the proposed enhanced THIN model is helpful. Further, HolE uses circular correlation instead of vector translation to model the interactions within entities and relations and its performance is slightly better than TransH and TransR. This is probably because HolE has less restrictions on the interactions of each component of the embedded representations and thus eases the distributions of entity embeddings in the vector space. The comparisons well support our choice of the HolE model.
In addition, the performance results on the THIN dataset show similar conclusions for the strength of the enhanced network model and the advantages of HolE. However, compared with which has a denser network of cameras, the performance on is slightly worse than it. Several factors may account for this phenomenon. For an intersection in a sparser network of cameras like , the adjacent cameras of it could be flexiable. Thus, the number of the downstream or upstream cameras increases and the randomness also increases. Besides, the length between every two adjacent intersections becomes longer, making it difficult to discover the expected companion vehicles for alignment. These results indicate that the proposed model can be also applied to a sparser network of cameras. Due to the disadvantages of the sparse network of cameras, a road network with denser deployment of cameras on the intersections is preferred as we can obtan fine-grained traveling trajectories of vehicles at the same time.
5.2.2. Visualization
To further investigate the ability of model TransE and HolE, we visualize a part of the embeddings of vehicle group entities and vehicle entities by projecting them into a 2-dimensional space with the popular t-SNE [33] algorithm. It is known that a good embedding need to catch the intrinsic properties of entities by putting them properly into a low dimensional space. Figure 11 presents the visualization results of TransE and HolE under the enhanced THIN. The entity embeddings generated by TransE are extremely close and form circular-like and dense clusters. This is because it fails to model the many-to-many member relations in the enhanced THIN, which brings huge randomness in entity alignment. For HolE, the entities are distributed well and separated broadly into several blocks. These embeddings can discriminate different entities according to their relationships to others and thus contain the intrinsic properties in their components. The visualization results additionally justify the advantages of HolE in Section 4.3.
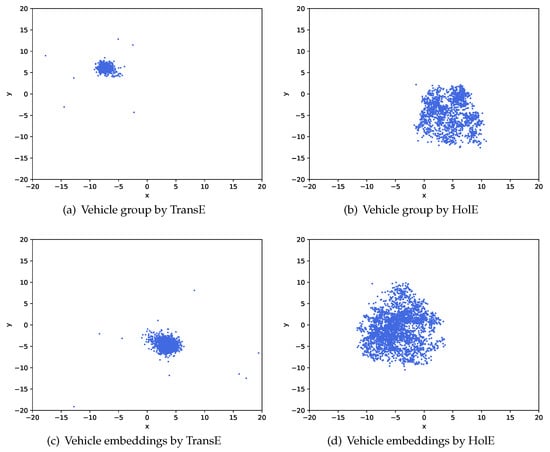
Figure 11.
Visualization of the vehicle group and vehicle embeddings by different algorithms on the enhanced THIN.
6. Conclusions
In this paper, we intend to recover the missing vehicle identities of the ANPR data which is an essential part of data driven transportation for intelligence and sustainability. To address the problem, we organize these records as a travel heterogeneous information network according to the heterogeneous interactions which exist among the entities involved in vehicles’ travel. In the THIN, the real world objects are extracted as entities and connected to each other according to their semantic relationships. To utilize the companion information from the peer vehicles as well as ease the problem of data sparsity, we further construct an enhanced THIN through vehicle grouping and context relation extraction, which is capable of capturing the spatiotemporal relationships along adjacent intersections. Given the novel THIN, we transform the recovery problem into the task of vehicle entity alignment, which is achieved by learning the embedding representations for different entities. Considering that there exists a large number of complex relations in the heterogeneous graph, we choose HolE to learn the embeddings for better performance. An experiment using real ANPR data from Xuancheng, China is conducted to evaluate the framework. The results demonstrate the effectiveness of the proposed enhanced THIN model and justify the advantages of holographic embeddings. The recovered records are important for downstream ANPR data mining, especially for personalized intelligent transportation.
Author Contributions
Conceptualization, Y.C. and Z.H.; methodology, Y.C.; software, Y.C.; validation, Y.C. and Z.H.; formal analysis, Y.C.; investigation, Y.C.; resources, Z.H.; data curation, Y.C.; writing–original draft preparation, Y.C.; writing–review and editing, Y.C. and Z.H.; visualization, Y.C.; supervision, Z.H.; project administration, Z.H.; funding acquisition, Z.H. All authors have read and agreed to the published version of the manuscript.
Funding
This research was funded by the National Natural Science Foundation of China grant number U1811463 and in part by the Guangzhou Science and Technology Program Key Projects grant number 201804020012.
Conflicts of Interest
The authors declare no conflict of interest.
References
- Zhang, J.; Wang, F.Y.; Wang, K.; Lin, W.H.; Xu, X.; Chen, C. Data-driven intelligent transportation systems: A survey. IEEE Trans. Intell. Transp. Syst. 2011, 12, 1624–1639. [Google Scholar] [CrossRef]
- Wang, Y.; Zeng, Z. Data-Driven Solutions to Transportation Problems; Elsevier: Amsterdam, The Netherlands, 2018. [Google Scholar]
- Lin, M.; Hsu, W.J. Mining GPS data for mobility patterns: A survey. Pervasive Mob. Comput. 2014, 12, 1–16. [Google Scholar] [CrossRef]
- Pelletier, M.P.; Trépanier, M.; Morency, C. Smart card data use in public transit: A literature review. Transp. Res. Part C Emerg. Technol. 2011, 19, 557–568. [Google Scholar] [CrossRef]
- Caceres, N.; Wideberg, J.; Benitez, F.G. Review of traffic data estimations extracted from cellular networks. IET Intell. Trans. Syst. 2008, 2, 179–192. [Google Scholar] [CrossRef]
- Zhan, X.; Li, R.; Ukkusuri, S.V. Lane-based real-time queue length estimation using license plate recognition data. Transp. Res. Part C Emerg. Technol. 2015, 57, 85–102. [Google Scholar] [CrossRef]
- Lana, I.; Del Ser, J.; Velez, M.; Vlahogianni, E.I. Road traffic forecasting: Recent advances and new challenges. IEEE Intell. Transp. Syst. Mag. 2018, 10, 93–109. [Google Scholar] [CrossRef]
- Liebig, T.; Piatkowski, N.; Bockermann, C.; Morik, K. Dynamic route planning with real-time traffic predictions. Inform. Syst. 2017, 64, 258–265. [Google Scholar] [CrossRef]
- El Faouzi, N.E.; Leung, H.; Kurian, A. Data fusion in intelligent transportation systems: Progress and challenges–A survey. Inform. Fusion 2011, 12, 4–10. [Google Scholar] [CrossRef]
- Sulaiman, N.; Jalani, S.N.H.M.; Mustafa, M.; Hawari, K. Development of automatic vehicle plate detection system. In Proceedings of the 2013 IEEE 3rd International Conference on System Engineering and Technology, Shah Alam, Malaysia, 19–20 August 2013; pp. 130–135. [Google Scholar]
- Smith, B.L.; Scherer, W.T.; Conklin, J.H. Exploring imputation techniques for missing data in transportation management systems. Transp. Res. Record 2003, 1836, 132–142. [Google Scholar] [CrossRef]
- Qu, L.; Li, L.; Zhang, Y.; Hu, J. PPCA-based missing data imputation for traffic flow volume: A systematical approach. IEEE Trans. Intell. Transp. Syst. 2009, 10, 512–522. [Google Scholar]
- Tan, H.; Feng, G.; Feng, J.; Wang, W.; Zhang, Y.J.; Li, F. A tensor-based method for missing traffic data completion. Transp. Res. Part C Emerg. Technol. 2013, 28, 15–27. [Google Scholar] [CrossRef]
- Li, L.; Li, Y.; Li, Z. Efficient missing data imputing for traffic flow by considering temporal and spatial dependence. Transp. Res. Part C Emerg. Technol. 2013, 34, 108–120. [Google Scholar] [CrossRef]
- Zhang, H.; Chen, P.; Zheng, J.; Zhu, J.; Yu, G.; Wang, Y.; Liu, H.X. Missing data detection and imputation for urban ANPR system using an iterative tensor decomposition approach. Transp. Res. Part C Emerg. Technol. 2019, 107, 337–355. [Google Scholar] [CrossRef]
- Feng, Y.; Sun, J.; Chen, P. Vehicle trajectory reconstruction using automatic vehicle identification and traffic count data. J. Adv. Transp. 2015, 49, 174–194. [Google Scholar] [CrossRef]
- Yu, H.; Yang, S.; Wu, Z.; Ma, X. Vehicle trajectory reconstruction from automatic license plate reader data. Int. J. Distrib. Sens. Netw. 2018, 14, 1550147718755637. [Google Scholar] [CrossRef]
- Rao, W.; Wu, Y.J.; Xia, J.; Ou, J.; Kluger, R. Origin-destination pattern estimation based on trajectory reconstruction using automatic license plate recognition data. Transp. Res. Part C Emerg. Technol. 2018, 95, 29–46. [Google Scholar] [CrossRef]
- Sun, Y.; Han, J.; Yan, X.; Yu, P.S.; Wu, T. Pathsim: Meta path-based top-k similarity search in heterogeneous information networks. Proc. VLDB Endowment 2011, 4, 992–1003. [Google Scholar]
- Shi, C.; Zhou, C.; Kong, X.; Yu, P.S.; Liu, G.; Wang, B. Heterecom: A semantic-based recommendation system in heterogeneous networks. In Proceedings of the 18th ACM SIGKDD International Conference on Knowledge Discovery and Data Mining, Beijing, China, 12–16 August 2012; pp. 1552–1555. [Google Scholar]
- Nickel, M.; Tresp, V.; Kriegel, H.P. A Three-Way Model for Collective Learning on Multi-Relational Data. ICML 2011, 11, 809–816. [Google Scholar]
- Socher, R.; Chen, D.; Manning, C.D.; Ng, A. Reasoning with neural tensor networks for knowledge base completion. In Proceedings of the 26th International Conference on Neural Information Processing Systems, Lake Tahoe, NV, USA, 5–10 December 2013; pp. 926–934. [Google Scholar]
- Nickel, M.; Rosasco, L.; Poggio, T. Holographic embeddings of knowledge graphs. In Proceedings of the Thirtieth AAAI Conference on Artificial Intelligence, Phoenix, AZ, USA, 12–17 February 2016. [Google Scholar]
- Bordes, A.; Usunier, N.; Garcia-Duran, A.; Weston, J.; Yakhnenko, O. Translating embeddings for modeling multi-relational data. In Proceedings of the Advances in Neural Information Processing Systems, Lake Tahoe, NV, USA, 5–10 December 2013; pp. 2787–2795. [Google Scholar]
- Wang, Z.; Zhang, J.; Feng, J.; Chen, Z. Knowledge graph embedding by translating on hyperplanes. In Proceedings of the Twenty-Eighth AAAI Conference on Artificial Intelligence, Québec, QC, Canada, 27–31 July 2014. [Google Scholar]
- Lin, Y.; Liu, Z.; Sun, M.; Liu, Y.; Zhu, X. Learning entity and relation embeddings for knowledge graph completion. In Proceedings of the Twenty-Ninth AAAI Conference on Artificial Intelligence, Austin, TX, USA, 25–30 January 2015. [Google Scholar]
- Sun, Y.; Han, J. Mining heterogeneous information networks: A structural analysis approach. Acm Sigkdd Explor. Newsl. 2013, 14, 20–28. [Google Scholar] [CrossRef]
- Zhu, M.; Liu, C.; Wang, J.; Wang, X.; Han, Y. Instant discovery of moment companion vehicles from big streaming traffic data. In Proceedings of the 2015 International Conference on Cloud Computing and Big Data (CCBD), Shanghai, China, 4–6 November 2015; pp. 73–80. [Google Scholar]
- Han, Y.; Wang, G.; Yu, J.; Liu, C.; Zhang, Z.; Zhu, M. A service-based approach to traffic sensor data integration and analysis to support community-wide green commute in China. IEEE Trans. Intell. Transp. Syst. 2015, 17, 2648–2657. [Google Scholar] [CrossRef]
- Ran, B.; Tan, H.; Wu, Y.; Jin, P.J. Tensor based missing traffic data completion with spatial–temporal correlation. Phys. A: Stat. Mech. Appl. 2016, 446, 54–63. [Google Scholar] [CrossRef]
- Goulart, J.D.M.; Kibangou, A.; Favier, G. Traffic data imputation via tensor completion based on soft thresholding of Tucker core. Transp. Res. Part C Emerg. Technol. 2017, 85, 348–362. [Google Scholar] [CrossRef]
- Nickel, M.; Murphy, K.; Tresp, V.; Gabrilovich, E. A review of relational machine learning for knowledge graphs. Proc. IEEE 2015, 104, 11–33. [Google Scholar] [CrossRef]
- Maaten, L.V.d.; Hinton, G. Visualizing data using t-SNE. J. Mach. Learn. Res. 2008, 9, 2579–2605. [Google Scholar]
© 2020 by the authors. Licensee MDPI, Basel, Switzerland. This article is an open access article distributed under the terms and conditions of the Creative Commons Attribution (CC BY) license (http://creativecommons.org/licenses/by/4.0/).