Article

What Hinders the Promotion of the Green Mining Mode in China? A Game-Theoretical Analysis of Local Government and Metal Mining Companies

1
School of Resources and Safety Engineering, Central South University, Changsha 410083, China
2
Shandong Gold Group Co., Ltd., Jinan 250101, China
*
Authors to whom correspondence should be addressed.
Sustainability 2020, 12(7), 2991; https://doi.org/10.3390/su12072991
Submission received: 23 February 2020 / Revised: 27 March 2020 / Accepted: 3 April 2020 / Published: 8 April 2020
(This article belongs to the Special Issue Sustainable Management of Natural Resources)

Abstract

:
China is currently trying to reduce the environmental impact of metal mining operations by promoting green mining. However, conflicts of interest between the central government, local governments, and metal mining companies often negatively affect the implementation of related policies. This paper conducted a theoretical analysis of the game mechanism between local governments and metal mining companies to study the factors that influence their strategies. First, we summarize the various game model parameters, determine the strategies which the companies and local government can choose, and establish the game model for the companies and the local government. Second, we list the utility of the company and local government under all game outcomes and analyse their behavioral tendencies. Third, we discuss the impacts of various factors on the choice of their mining mode in detail. The behavioral analysis shows that the local government’s inclination to supervise a mine is negatively related to the supervision cost and positively related to the production scale of this mine; various factors influence the companies in their decision making, with the yield and comprehensive utilization rate of tailings and waste rocks have the greatest impact; the scale of mine production also affects the companies’ willingness to carry out technological innovation. Finally, we offer some suggestions for the promotion of green mining.

1. Introduction

A series of environmental issues, such as land occupancy, vegetation destruction, groundwater and air pollution, and engineering disasters caused by mineral resources, have been major issues to be addressed [1,2,3,4,5]. To solve these environmental issues, the Chinese central government launched their Green Mine Construction Plan in 2010, which is aimed at changing all mines in China into green mines [6,7]. However, only 1220 mining companies were identified as pilot green mines in China as of 2019, which account for less than 2% of the total mines [8].
Adopting the green mining mode is the key to building a green mine [9,10]. Some scholars have analyzed the reasons for the slow progress of green mining adoption in China [11,12,13,14]. Ideally, the local government performs its duty to supervise the mines in its administrative area according to environmental regulations. Mining companies adopt green production technology under the guidance of the green mining mode, which can reduce the impact of their activities on the natural environment. However, in practice, environmental regulations may be inadequately enforced by the local government due to the high costs of supervision and management, and mining companies are reluctant to adopt the green mining because of the high cost and high risk of green technology innovation. The conflicts of interest between the central government, local governments, and metal mining companies negatively affect the implementation of the Green Mine Construction Plan.
Therefore, it is necessary to study the factors that influence the strategies of local governments and mining companies, and to build an optimal strategy that can balance environmental protection, the company’s profits, and the local government’s benefits. Many scholars have studied the interactive strategies of the central government, local governments, and polluting enterprises [15,16,17]. Zhao et al. [18,19] used game theory to assess the government and manufacturers’ strategies for reducing environmental risk of materials and promote more environmentally friendly products. Hafezalkotob et al. [20,21] established the production competition models of green and non-green supply chains considering the intervention schemas of governments. Scholars also analysed the impact of a government’s punishment or subsidy policies on enterprises’ strategies for reducing the environmental risks [22,23]. These studies show that the appropriate policies can promote green innovation [17,24]. The right policies should coordinate the interests of the central government, local governments, and enterprises according to various influencing factors [25,26].
Some scholars in the field of green mining have qualitatively analysed the game between various stakeholders, including the government, green mining companies, traditional mining companies, and local residents [27,28,29]. In these studies, the impacts of regulatory strategy, production scale, and technology level on the government’s benefits and mining companies’ profits were discussed. They indicated that the decline in short-term profits, high cost of government supervision, and imperfect rewards and penalties are the main reasons for the restricted promotion of green mining. The mining production process involves the mining of metal ores, disposal of tailings and waste rocks (TWR), discharge of pollutants, environmental management, and ecological restoration [30,31,32,33,34,35]. The green technology levels of each mining link and production scale also have influences on a company’s enthusiasm for environmental protection [36].
However, the lack of a quantitative analysis model hinders existing studies from quantifying the impact of the scale of mine production, technological level of each mining link, and cost of government supervision. In addition, there are very few discussions on the influences of the green technology level of mining production links and production scale on a mining company’s profit. Therefore, we establish a game model to determine the degree of each factor’s influence based on survey data from Chinese metal mines in this paper. The quantization analyses in this paper will discuss the impacts of these factors on the decision-making of local governments and mining companies.
For clarity, the rest of the paper is organized as follows. Section 2 describes the game model in detail, while Section 3 analyzes the behavior patterns of mining companies and the government in different cases. Section 4 discusses the influencing factors of the mining companies’ decisions. Finally, Section 5 summarizes the paper and presents some suggestions.

2. Game Model

The game players in this study are the local government responsible for supervision and the Chinese metal mining companies. In order to establish the game model, we first assume the mine operation pattern, local government regulatory method, and information held by both parties, list out the relevant parameters, display all game outcomes in the normal form, and propose the formulas for calculating the utility of the government and the companies.

2.1. Assumptions

From the investigation of metal mine production and local government supervision in China, we make the following assumptions:
(1) The final product of mine production is the concentrate, with one mine mainly producing one type of ore concentrate. The concentrates produced from associated minerals are included in the comprehensive utilization of tailings.
(2) The annual ore production of a mine is determined by certain conditions, such as the condition of the ore body, degree of mechanization, and level of mining technology. Low-waste mining technology reduces the production rate of waste rocks without affecting the annual ore production. Changing the annual ore production of a few mines will not affect the market price of mineral products because the market price is determined through international market quotation [37].
(3) The central government designs environmental policies and supervises the local governments to enforce relevant regulations. The local governments are responsible for supervision of mines in their administrative areas, but their approach to supervision is affected by the supervision benefits. The supervision benefits consist of the resource and environmental taxes paid by companies and the fines collected from the companies that do not treat pollution. The local governments’ expenditure is their regulatory cost. If a mining company fails to comply with the pollution control requirements, the local government supervising the mine will order the company to pay the cost for environmental governance and additional economic penalties; however, if the local government does not supervise the mine properly, the company will escape this punishment and the local government has to assume the cost of environmental governance. The local government not supervising mines means that it will not know the truth about the mine’s disposal of TWR and pollutants for a long time; in the case that the government surveys and punishes the companies after they discharged pollutants secretly, this will be considered as supervision.
(4) A mine’s sales volume is assumed to be equal to its ore output. Since the sales volume of the company is public information, evading resource taxes is almost impossible. However, since the actual comprehensive TWR utilization ratio and amount of pollutants are private information for companies, if the local government does not supervise them, the companies may provide false data and evade environmental taxes.

2.2. Model Parameters

The parameters of the game between the local government and companies under the green mining mode can be divided into four categories: Ore production (Table 1), TWR disposal (Table 2), environmental management (Table 3), and local government supervision (Table 4).

2.3. Model Formulation and Solution

In the game, the local government may choose to either supervise or not supervise a mining company. This action of the mining company takes two steps. In the first step, the company decides to adopt a green or traditional mining mode; in the second step, the company decides whether to control pollution or not. The normal form of the game is shown in Figure 1.

2.3.1. Profit of Mining Company

The profit of a mining company is its income minus expenditure. The company’s income consists of the sales revenue of mineral products and the profit from the comprehensive utilization of TWR. Its expenditure consists of the production cost, resource tax, TWR disposal cost, environmental treatment cost, and environmental tax.
When a company adopts green mining technology and controls the environment, it obtains a comprehensive TWR utilization income, but has to pay the additional TWR ecological disposal and environmental treatment costs. In this case, the company obtains the same profit whether it is supervised by the government or not; its profit can be calculated as shown below in Equation (1).
u e ( 1 , 1 , 1 ) = u e ( 1 , 1 , 2 )      = γ Q R ( P P T t c ) + ( Q w + Q t ) R r Q t p ( F 0 + F g ) G T p Q t p      = Q R [ γ ( P P T t c ) + ( 1 γ + ω g ) R r ( 1 γ + ω g ) ( 1 R ) ( F 0 + F g + F t p g + T p ) ]
When this company adopts green mining technology, it may not spend environmental treatment expenses to control the environment. However, if it is supervised by the government, it will have to pay for environmental treatment as well as extra fines. The company’s profit in this case will be as shown in Equation (2). If it is not supervised by the government, its profit will be as shown in Equation (3).
u e ( 1 , 2 , 1 ) = γ Q R ( P P T t c ) + ( Q w + Q t ) R r Q t p ( F 0 + F g ) G T p Q t p S      = Q R [ γ ( P P T t c ) + ( 1 γ + ω g ) R r ( 1 γ + ω g ) ( 1 R ) ( F 0 + F g + F t p g + T p ) ] S
u e ( 1 , 2 , 2 ) = γ Q R ( P P T t c ) + ( Q w + Q t ) R r Q t p ( F 0 + F g ) T p Q t p      = Q R [ γ ( P P T t c ) + ( 1 γ + ω g ) R r ( 1 γ + ω g ) ( 1 R ) ( F 0 + F g + T p ) ]
If this company does not adopt green mining technology, it will not have to pay an extra cost for the ecological disposal of TWR and will not obtain profit from the comprehensive utilization of TWR. Under government supervision, if the company treats pollution, its benefit will be as shown in Equation (4), and if it does not treat pollution, its benefit well be as shown in Equation (5). If the government does not supervise, the company will falsely claim its comprehensive TWR utilization rate, R, reaches the current average level, R ¯ , to reduce the environmental protection tax. In this case, its benefits from treating and not treating pollution will be as shown in Equations (6) and (7), respectively:
u e ( 2 , 1 , 1 ) = γ Q R ( P P T t c ) ( Q t + Q w ) F 0 G T p Q t p      = Q R [ γ ( P P T t c ) ( 1 γ + ω 0 ) ( F 0 + F t p 0 + T p ) ]
u e ( 2 , 2 , 1 ) = γ Q R ( P P T t c ) ( Q t + Q w ) F 0 G T p Q t p S      = Q R [ γ ( P P T t c ) ( 1 γ + ω 0 ) ( F 0 + F t p 0 + T p ) ] S
u e ( 2 , 1 , 2 ) = γ Q R ( P P T t c ) ( Q t + Q w ) F 0 G T p Q t p      = Q R { γ ( P P T t c ) ( 1 γ + ω 0 ) [ F 0 + F t p 0 + T p ( 1 R ¯ ) ] }
u e ( 2 , 2 , 2 ) = γ Q R ( P P T t c ) ( Q t + Q w ) F 0 T p Q t p      = Q R { γ ( P P T t c ) ( 1 γ + ω 0 ) [ F 0 + T p ( 1 R ¯ ) ] }

2.3.2. Benefit of the Local Government

The local government’s income consists of the resource and environmental taxes paid by companies and the fines collected from the companies that do not treat pollution. The local government’s expenditure consists of its regulatory cost. When the company adopting the green mining mode also controls pollution, the local government will benefit as shown in Equation (8) if it supervises, and as shown in Equation (9) if it does not supervise. However, when the company adopting the green mining mode does not control pollution, the local government can get fines from the company if it supervises, as shown in Equation (10). If the local government does not supervise, it will not pay the supervision cost, but will have to pay for pollution treatment, as shown in Equation (11).
u g ( 1 , 1 , 1 ) = γ Q R P T t + T p Q t p C      = Q R [ γ P T t + T p ( 1 γ + ω g ) ( 1 R ) ] C
u g ( 1 , 1 , 2 ) = γ Q R P T t + T p Q t p      = Q R [ γ P T t + T p ( 1 γ + ω g ) ( 1 R ) ]
u g ( 1 , 2 , 1 ) = γ Q R P T t + T p Q t p + S C      = Q R [ γ P T t + T p ( 1 γ + ω g ) ( 1 R ) ] + S C
u g ( 1 , 2 , 2 ) = γ Q R P T t + T p Q t p G      = Q R [ γ P T t + ( T p F t p g ) ( 1 γ + ω g ) ( 1 R ) ]
If the company does not adopt green mining but controls pollution, the local government will benefit as shown in Equation (12) when it supervises, and as shown in Equation (13) when it does not supervise. If this company does not control pollution, the local government will benefit as shown in Equation (14) when it supervises, and as shown in Equation (15) when it does not supervise. In Equations (13) and (15), the company provides a false comprehensive utilization rate, R ¯ , which is used to reduce the environmental tax.
u g ( 2 , 1 , 1 ) = γ Q R P T t + T p Q t p C      = Q R [ γ P T t + T p ( 1 γ + ω 0 ) ] C
u g ( 2 , 1 , 2 ) = γ Q R P T t + T p Q t p      = Q R [ γ P T t + T p ( 1 γ + ω 0 ) ( 1 R ¯ ) ]
u g ( 2 , 2 , 1 ) = γ Q R P T t + T p Q t p + S C      = Q R [ γ P T t + T p ( 1 γ + ω 0 ) ] + S C
u g ( 2 , 2 , 2 ) = γ Q R P T t + T p Q t p G      = Q R { γ P T t + ( 1 γ + ω 0 ) [ T p ( 1 R ¯ ) F t p 0 ] }

3. Model Analysis

3.1. Behavior Analysis of a Mining Company

According to the profit of a mining company, its behavior is affected by the local government’s decision on whether to supervise or not. The dominant strategies of a mining company when the local government supervises and does not supervise are discussed as below.

3.1.1. Company’s Behavior under Supervision

A mining company under supervision will be required to pay environmental treatment fees and other fines if it does not treat pollution; thus, the company treating pollution will have greater benefits. This can be shown as u e ( 1 , 1 , 1 ) > u e ( 1 , 2 , 1 ) , u e ( 2 , 1 , 1 ) > u e ( 2 , 2 , 1 ) . Therefore, mining companies under supervision must treat pollution because this choice is a dominant strategy. The company’s increased profit from adopting green mining, ∆Ue, is calculated as shown below in Equation (16).
Δ U e = u e ( 1 , 1 , 1 ) u e ( 2 , 1 , 1 )    = Q R { ( F 0 + T p ) [ R ( 1 γ + ω g ) + ω 0 ω g ] F g ( 1 γ + ω g ) ( 1 R )    + F t [ p 0 ( 1 γ + ω 0 ) p g ( 1 γ + ω g ) ( 1 R ) ] + ( 1 γ + ω g ) R r }
where τ0 and τg represent the TWR yield under conventional mining and green mining, respectively. These can be calculated as τ 0 = 1 γ + ω 0 and τ g = 1 γ + ω g , respectively. Thus, Equation (16) can be re-written as:
Δ U e = u e ( 1 , 1 , 1 ) u e ( 2 , 1 , 1 )    = Q R τ g { ( F 0 + T p ) [ τ 0 τ g ( 1 R ) ] F g ( 1 R ) + F t p g [ p 0 τ 0 p g τ g ( 1 R ) ] + R r }

3.1.2. Company’s Behavior under No Supervision

A company under no supervision will have the chance to escape responsibility of pollution treatment. The relationship between the company’s benefits under the different situations can be shown as: · u e ( 1 , 2 , 2 ) > u e ( 1 , 1 , 2 ) , u e ( 2 , 2 , 2 ) > u e ( 2 , 1 , 2 ) . This company will not treat pollution because treating pollution is the dominated strategy. Its increased profit from adopting green mining ∆Ue can be calculated as shown in Equation (18).
Δ U e = u e ( 1 , 2 , 2 ) u e ( 2 , 2 , 2 )    = Q R τ g { F 0 [ τ 0 τ g ( 1 R ) ] + T p [ τ 0 τ g ( 1 R ¯ ) ( 1 R ) ] F g ( 1 R ) + R r }
From an analysis of Equations (17) and (18), we can conclude as follows. When ∆Ue > 0, green mining is the dominant strategy; however, non-green mining is the dominant strategy when ∆Ue < 0. For a certain mine, F0, τ0, Tp, Ft, and p0 are constant. In order to improve its benefit from adopting the green mining mode, the mining company can take the following measures: Improving the comprehensive utilization rate of TWR, R, and the profit of comprehensive utilization, r; reducing the additional cost of disposing of unit mass TWR by using environmentally friendly methods, Fg, and the area of land polluted by unit mass TWR after ecological disposal, pg.
From Equations (17) and (18), we can conclude that the annual ore output, QR, is not the factor for determining whether green mining is the dominant or dominated strategy. Note that QR can magnify ∆Ue multiple times; assuming that ∆Ue is a positive number under the present green mining technology level, a large mine will benefit more than small mines under the same technical level. Therefore, the large mine will be more inclined to spend funds on green mining technology development than would small mines. This will be discussed in detail in Section 4.3.

3.2. Behavior Analysis of a Local Government

The local government has to decide on whether to supervise a mining company. From the analysis in Section 3.1.1, the company will decide to treat pollution if it is supervised by the local government, and not to treat pollution if it is not supervised by the local government. Therefore, this section just needs to discuss the dominant strategy of the local government when the company adopts or does not adopt green mining.

3.2.1. When the Company Adopts Green Mining

When the company adopts green mining, the local government’s benefit from choice of supervision or non-supervision is ug(1,1,1) or ug(1,2,2), respectively. The local government’s increased benefit from supervision ∆Ug is calculated in Equation (19).
Δ U g = u g ( 1 , 1 , 1 ) u g ( 1 , 2 , 2 ) = Q R F t p g τ g ( 1 R ) C

3.2.2. When the Company Does Not Adopt Green Mining

When the company does not adopt green mining, the local government’s benefit from choice of supervision or non-supervision is ug(2,1,1) or ug(2,2,2), respectively. Its increased profit from supervision can be written as:
Δ U g = u g ( 2 , 1 , 1 ) u g ( 2 , 2 , 2 ) = Q R ( T p R ¯ τ 0 + F t p 0 τ 0 ) C
From Equations (19) and (20), whether the company adopts green mining or not, the local government’s inclination to supervise is always positively correlated with the annual ore output QR and cost of treating the unit area contaminated land Ft, and is negatively correlated with supervision cost C. If the local government’s supervision cost is low and Ft is expensive, it will tend to supervise the mining company.
Influenced by QR, the local government may choose to supervise large mines preferentially. Since consistent supervision could damage the company’s reputation, large mines would prefer reduction in the local government’s inclination to supervise them. From Equations (19) and (20), companies can reduce the local government’s inclination to supervise only by adopting green mining. When a large mining company improves its green mining technology level, the comprehensive utilization rate of TWR, R, will increase; the area of land polluted, pg, and amount of waste rocks, ωg, will be reduced; consequently, the local government’s increased profit of supervision, ∆Ug, will be reduced.

4. Discussion of Factors Influencing Mining Company’s Decision

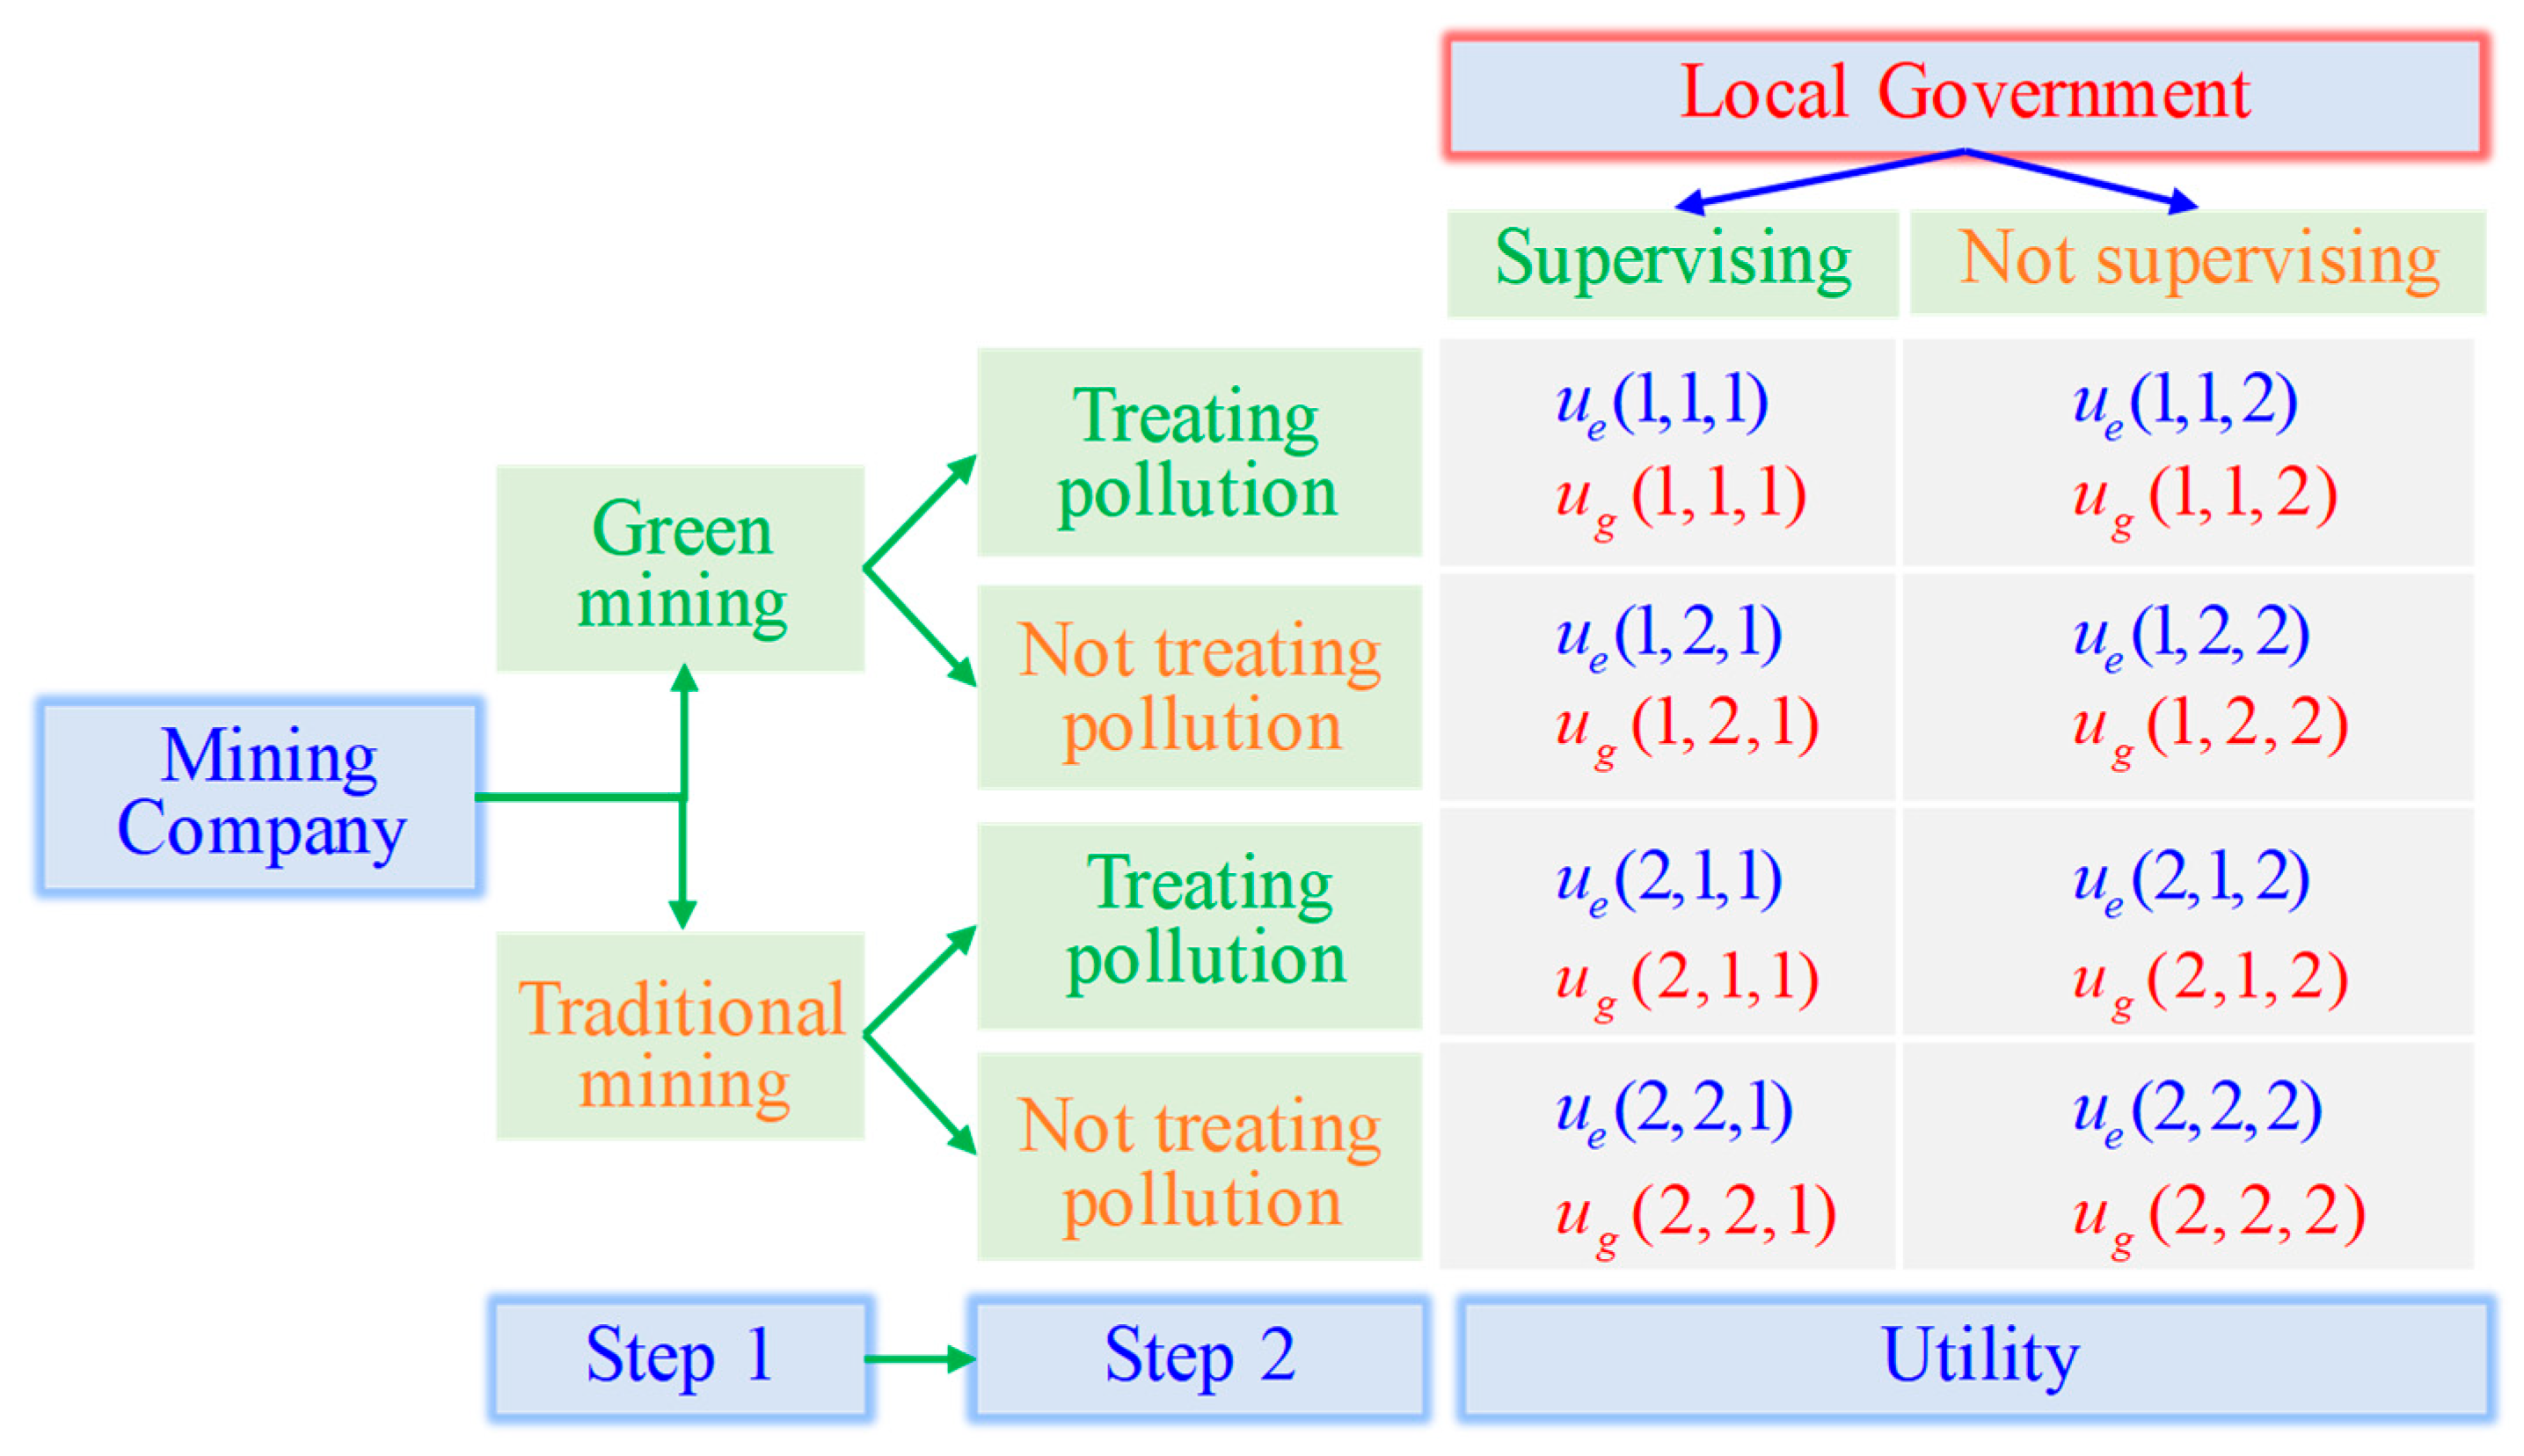
Nowadays, the Chinese central government is implementing the strictest environmental protection policies, making the environmental situation an important indicator of the local government’s performance. Ft has increased greatly following improvement in the environmental standard, with the cost of supervision declining sharply through the application of satellite and aerial photography technology. Therefore, ΔUg in both Equations (19) and (20) is positive. In this case, since supervision is the local government’s dominant strategy, it will certainly supervise the mining company.
A company supervised by the local government will certainly have to treat pollution, but need not necessarily adopt the green mining mode. In the following section, we examine the impacts of the various parameters in Equation (17) on the mining company’s decision.

4.1. Value of Parameters in the Game Model

The parameters in Equation (17), except for QR, can be categorized into two constant parameters and green mining technology-level parameters. As shown in Table 5, the constant parameters include F0, τ0, p0, Tp, and Ft, and the green mining technology-level parameters are τg, R, r, Fg, and pg.
To quantitatively analyse the impact of the different parameters in Equation (17) on the mining company’s decision, we first determine the values of all parameters shown in Table 5 by analysing the data from the China Tendering and Bidding Public Service Platform, government documents, and related research papers. The values of these parameters are mainly based on the data of metal mines, especially gold mines. The specific parameter determination processes are provided below, and the raw data can be found in the Supplementary Materials.
Tailing storage is the conventional approach to handling tailings in China, with the disposal cost including the storage and emission costs. The per unit mass tailing storage cost can be calculated by dividing the tailing storage construction investment by the designed storage capacity; its value is about 15–25 CNY/t. Tailing discharge has two kinds of technology: Slurry disposal and dry stacking. While the slurry disposal cost is about 5 CNY/t, the dry stacking cost is about 15 CNY/t. Therefore, the conventional approach’s cost to dispose of tailings, F0, is about 20–40 CNY/t in China. The harmless tailing storage technology is based on the conventional dry stacking technology and increases the seepage prevention and tailing consolidation process. The calculation of project construction shows that the additional cost of disposing of storage tailings using environmentally friendly methods, Fg, is about 10–20 CNY/t.
The TWR yield rate τ is based on the TWR discharge intensity in gold mines [38]. The waste rocks when mining one ton of gold ore, ω, is about 1.2 tons; the concentrate yield of gold ore, γ, is about 3%; the yield rate of TWR under conventional mining in gold mines τ0 is about 2.2. From the report, ω can be reduced to zero through the use of low-waste mining technology, but since the concentrate yield, γ, cannot be easily changed in the short term, the lowest that τ can reach is 0.97.
The area of land polluted by unit mass TWR, p, can be estimated from the tailing storage floor area. From the Chinese tailing storage data, a tailing storage facility with an area of 10 hm can store about 3 million tons of tailings, which means that one square meter can store 30 tons of tailings. The areas surrounding tailing storage facilities are always polluted by heavy metals. A sampling survey in a typical Pb–Zn mining area in South China shows that the surface soil in about one kilometer diameter of tailing impoundment is severely polluted, with the equivalent diameter of tailing impoundment close to 0.5 km [39]. Thus, the equivalent radius of the contaminated land is twice that of the tailings storage, and the area of land polluted by unit mass TWR under conventional mining, p0, is 0.13 m2/t. When the mine adopts a harmless disposal technology, the radius of pollution impact area is equal to the equivalent radius of the tailing storage area, so pg is 0.03 m2/t.
The Chinese central government introduced the environmental tax in 2018; the present environmental tax on tailings, Tp, is 15 CNY/t. Note that comprehensively utilized tailings are exempt from environmental tax [40].
From the China Resources Comprehensive Utilization Annual Report and China Environmental Statistics Yearbook data, the comprehensive utilization rate of tailings in China, R, is from 10% to 35%. Different comprehensive utilization approaches have different profits. Underground space filling, building material production, and reconcentration are three main comprehensive tailing utilization approaches in China, accounting for 53%, 43%, and 3% of all utilization approaches, respectively, in 2013 [41]. When tailings are used for filling underground space, if no ore pillars need to be mined, the filling will cost only about 20 CNY/t. Therefore, 20 CNY/t can be saved compared to storing tailings on the ground. The profit from using tailings to produce building materials such as blocks, baking-free bricks, cement, and artificial stone is about 40–100 CNY/t. The profit from tailing reconcentration is related to the gold grade of the tailings. Since the gold grade of old tailings produced in the 20th century is more than 1 g/t, the profit from old tailing reconcentration is above 200 CNY/t [42]. However, since the gold grade of new tailings is only about 0.25 g/t, the profit from reconcentration of new tailings will be less than 10 CNY/t unless beneficiation technology makes great progress [43]. Because the profit from reconcentration of new tailings is far less than that from filling underground space and building material production, the comprehensive TWR utilization profit ranges from 20 CNY/t to 100 CNY/t.
The cost of treatment per contaminated unit area land in China, Ft, can be estimated mainly from the total investment and treatment area of the abandoned mine environmental remediation project since 2018. Ft ranged from 25 CNY/m2 to 100 CNY/m2 according to the project requirements and degree of land pollution. If the project has to build new tailing storage and wastewater treatment facilities, its investment will increase to 200 or even 300 CNY/m2. Since the construction cost of a tailing storage facility has been considered in F0, Ft is valued at 25–100 CNY/m2 in this paper.

4.2. Impact of Green Mining Technology

To analyze how the level of green mining technology affects the company’s decision under supervision, we re-write Equation (17) as follows:
Δ U e = Q R A e
where Ae is the company’s increased profit from mining one ton of ore under the green mining mode. This can be calculated as follows:
A e = A 1 + A 2 + A 3 + A 4
{ A 1 = T p [ τ 0 ( 1 R ) τ g ] A 2 = τ 0 F 0 τ g ( F 0 + F g ) ( 1 R ) A 3 = F t [ p 0 τ 0 p g τ g ( 1 R ) ] A 4 = τ g R r
where A1, A2, A3, and A4 represent the increased profit from environmental tax, tailing disposal, pollution treatment, and comprehensive TWR utilization, respectively.
Since QR in Equation (21) is positive, we can use Ae to determine whether adopting the green mining mode is the dominant strategy of the mining company.
In Section 4.1, we determined value ranges of five parameters, τg, R, r, Fg, and pg, which reflect the company’s green mining technology level; their values are shown in Table 5. When Fg, R, r, and Ft are at their minimum, from Equation (21), Fg is at its maximum, τg = τ0, and pg = p0, and these parameters are at their worst. Furthermore, at this point, Ae reaches its minimum value of −26.785 CNY/t. In this case, green mining is the dominated strategy of the company. Now, by improving the level of the green mining technology parameters, we can increase the value of Ae and, in turn, improve the mining companies’ approach towards adopting the green mining mode, although the different parameters will have different effects on Ae.
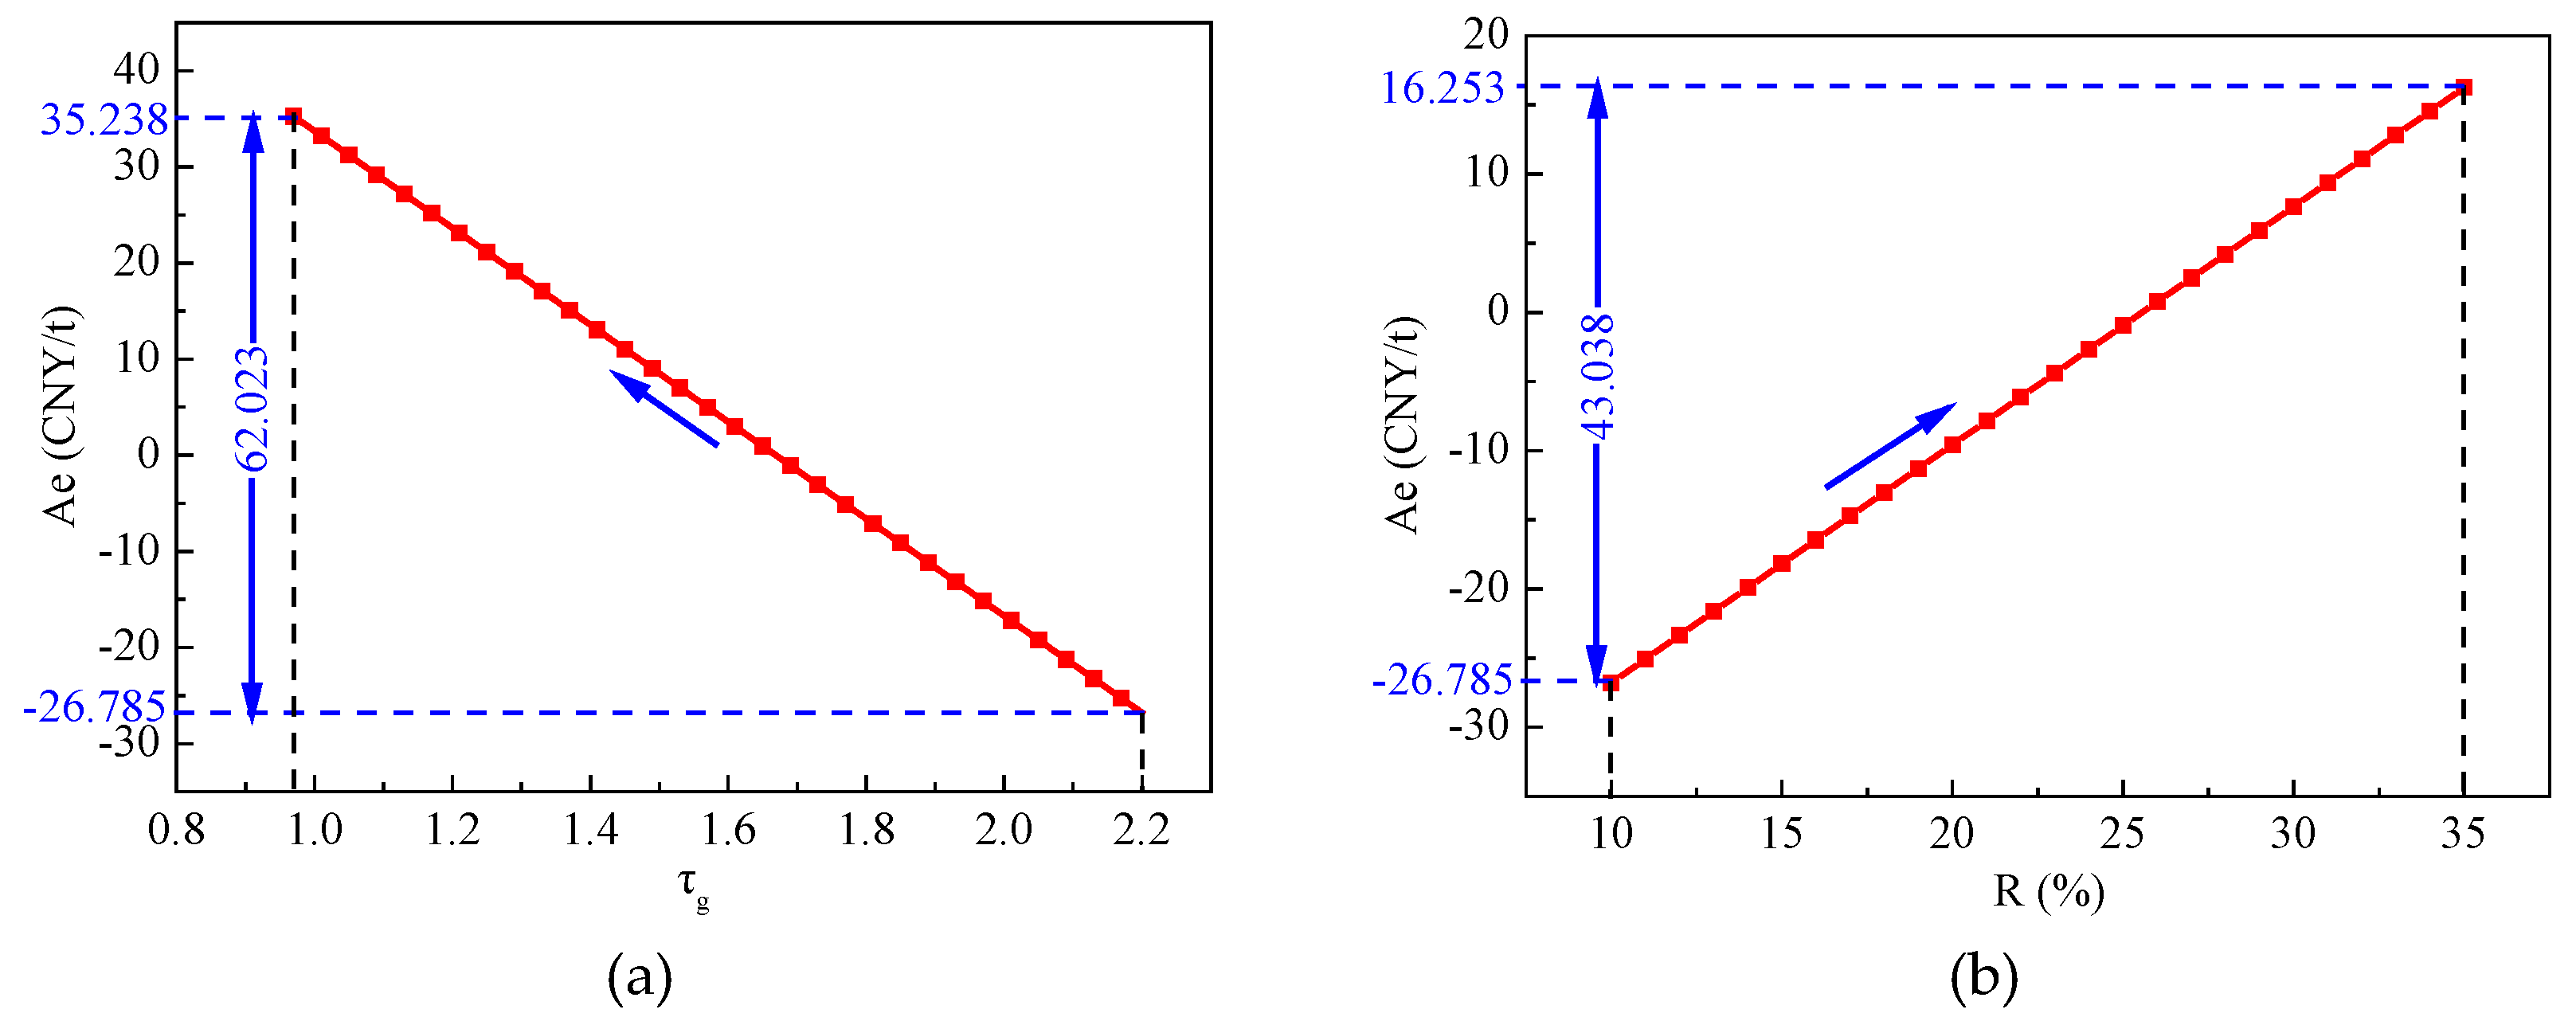
We analyzed the effect of each parameter on Ae by improving each parameter in turn, keeping the other parameters at their worst value and studying the relationship between the development of green mining technology and the company’s profit. The analysis results are presented in Figure 2.
As shown in Figure 2, by reducing τg or increasing R, Ae can be changed from negative to positive and green mining can be turned from a dominated strategy to a dominant strategy; the three measures of reducing Fg, increasing r, and reducing pg can improve the revenue of green mining, but if used alone, cannot change 
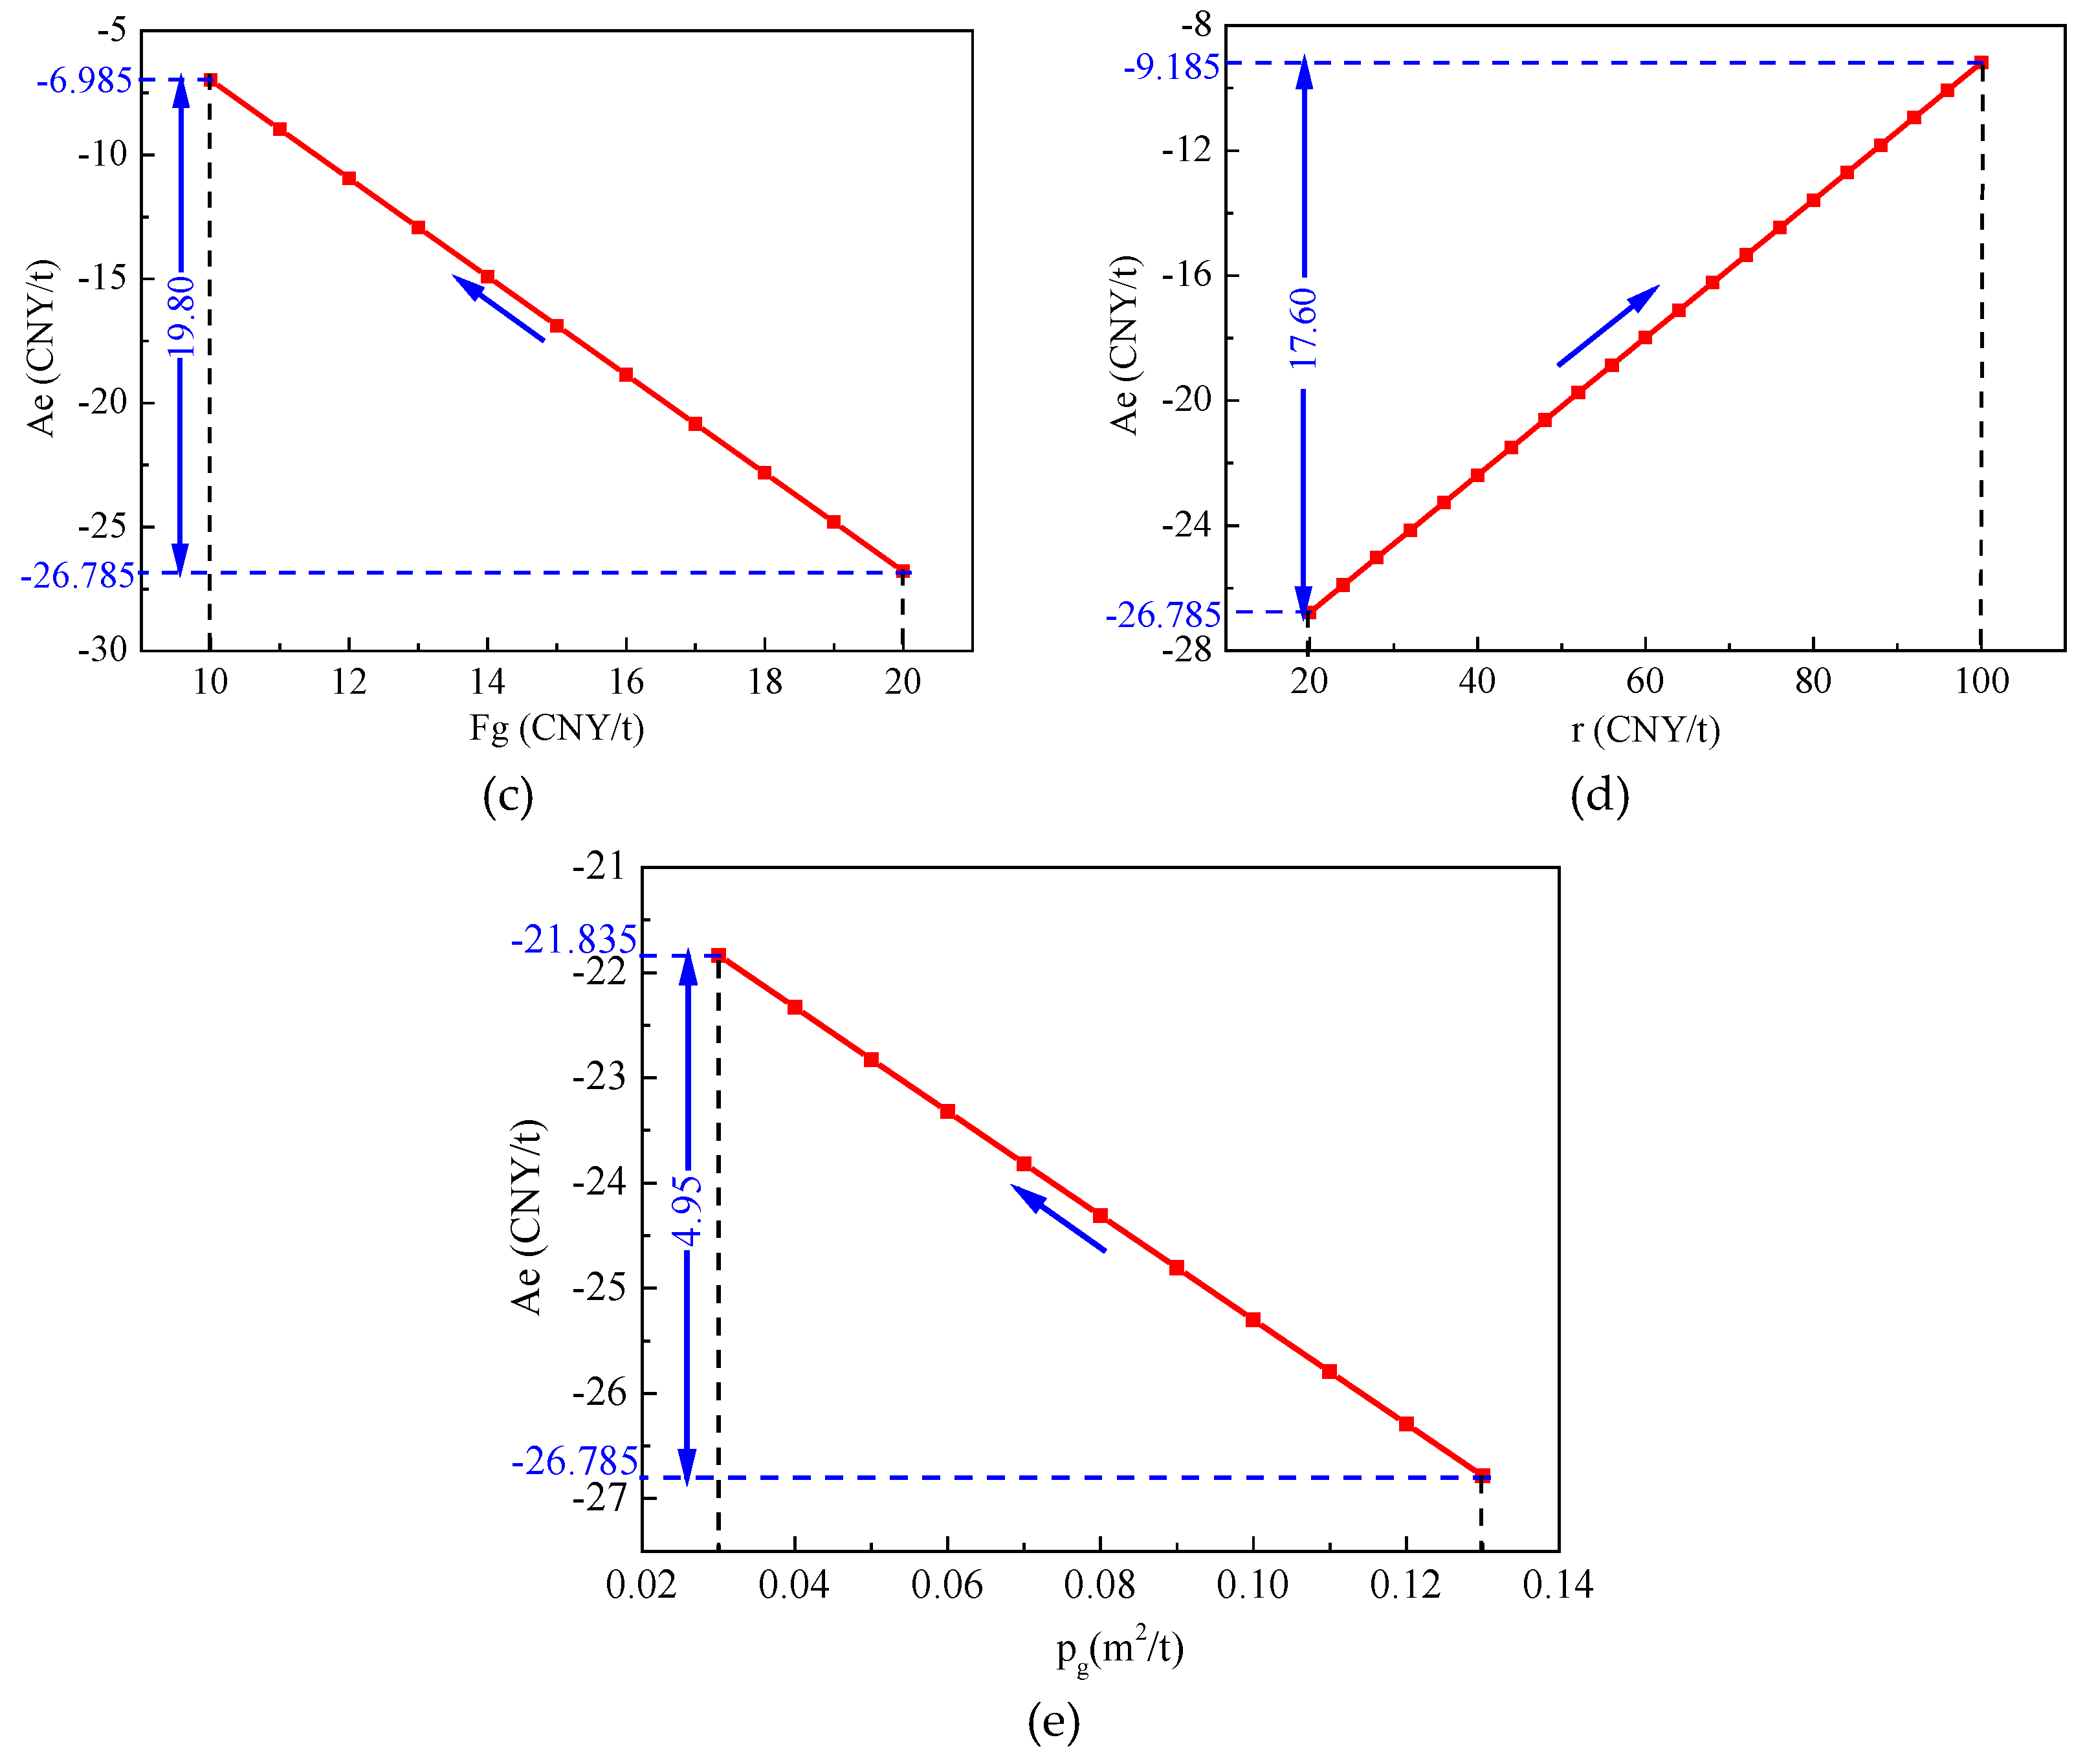
Ae from negative to positive. In the following, we discuss the reasons for this phenomenon in detail.
In Equation (22), τg and R are two parameters existing in all terms. This means that both of them can affect A1, A2, A3, and A4 simultaneously. Therefore, a reduction in τg or increase in R will quickly increase Ae. In fact, these two measures will reduce the amount of TWR, which needs to be disposed, from the source, and so the environmental taxes, cost of tailing disposal, and pollution treatment costs will decrease.
Fg can impact A2, as shown in Equation (22), and can be reduced from 20 CNY/t to 10 CNY/t, as shown in Table 5. Fg has limited scope to be reduced because the cost of harmless disposal measures in China, such as laying seepage-prevention layers at the tailing storage’s bottom, adding alkaline material into acid tailings, or adding a hardener into tailings, is sufficiently cheap. Therefore, a reduction in Fg alone cannot change Ae from negative to positive.
From Figure 2d, Ae increases by only 17.6 CNY/t when r is increased from 20 CNY/t to 100 CNY/t, the maximum value of r under the current technology level in China. From Equation (22), the effect of r on A4 depends on the value of τg and R. As Figure 2a,b show, τg and R are respectively negatively and positively correlated with Ae; this means that improving r alone will not increase Ae effectively until R is high enough.
From Equation (22), a reduction in pg can improve A3, which represents increased profit from pollution treatment. Since the impact of pg on A3 is related to Ft, pg will have more effect on A3 when Ft is higher. The value of Ft depends mainly on the land reclamation standards and TWR storage method. According to the Completion Standards on Land Reclamation Quality published by the Chinese central government, the main measure for the reclamation of polluted land is the isolation of harmful TWR. The cost of reclaiming the abandoned land would be only 25 CNY/m2 if no new tailing storage facilities or sewage treatment facilities need to be built. Moreover, the value of pg cannot be lower than that of the area required for stacking per unit mass TWR, that is, 0.03 m2/t. Thus, as shown in Figure 2e, pg has only a limited effect on Ae.
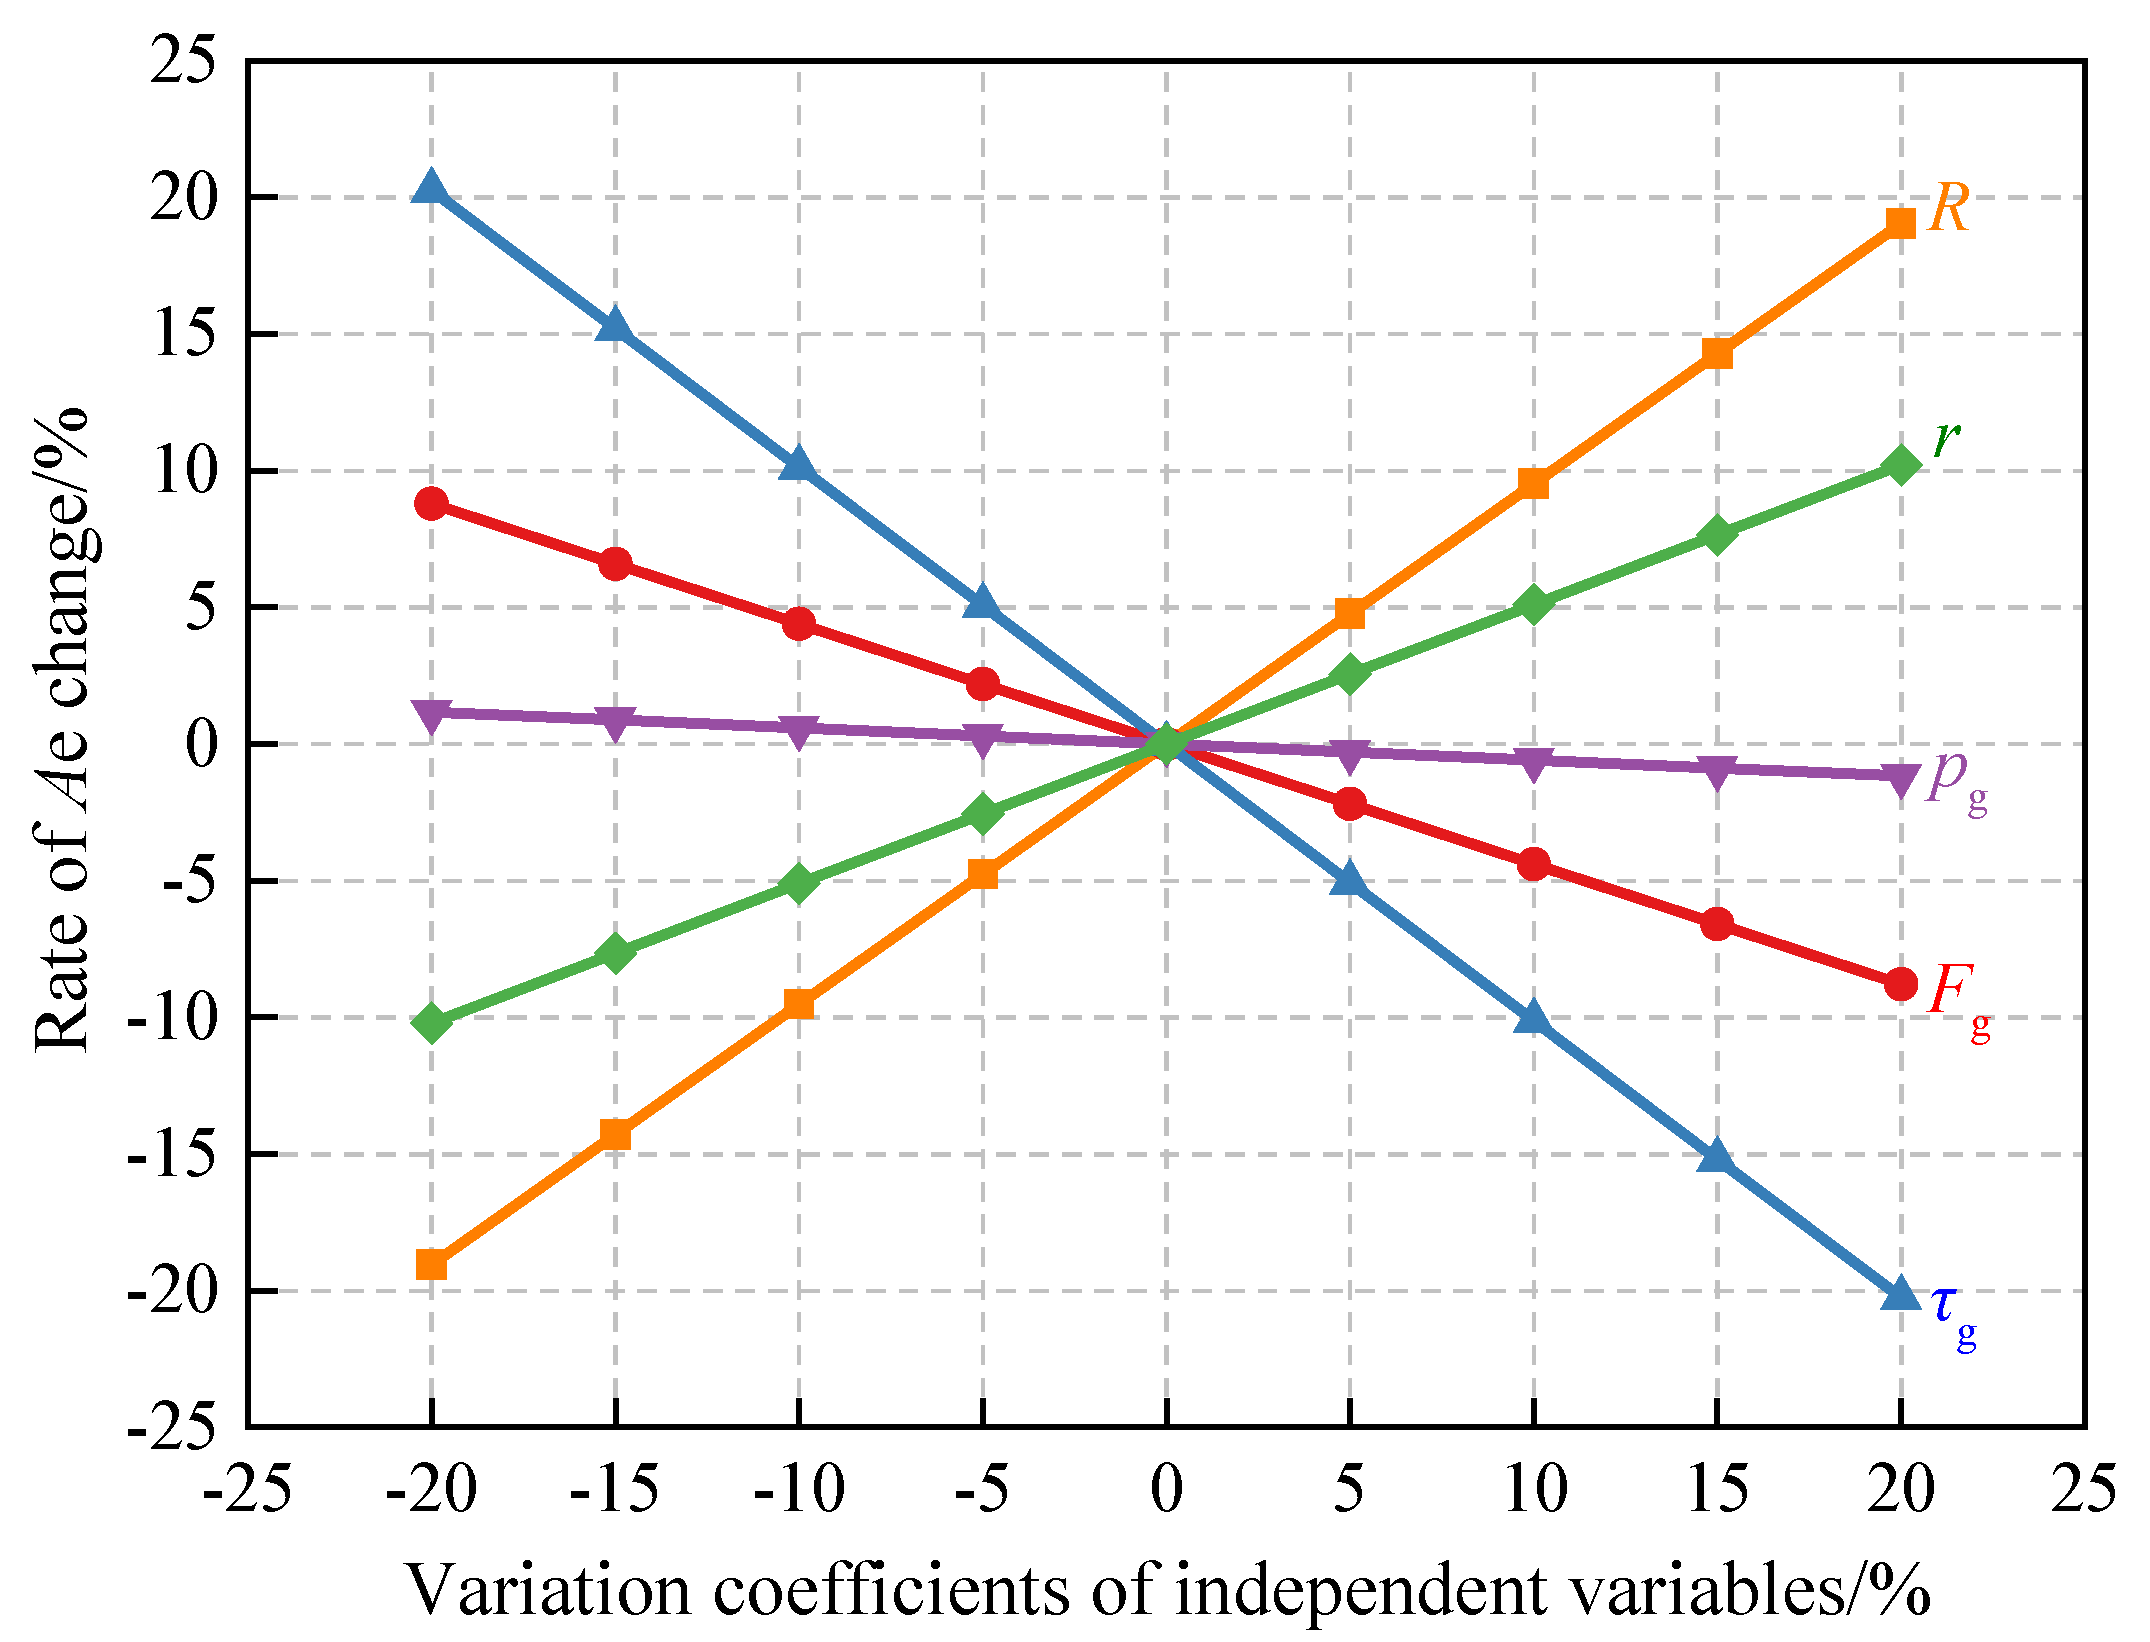
In order to find the sort orders of each parameter’s influence degree, we conduct a sensitivity analysis using τg, R, r, Fg, and pg as independent variables and Ae as the dependent variable. From the value ranges of these independent variables shown in Table 5, we set their base values at their median values, 1.58, 22.5%, 60 CNY/t, 15 CNY/t, and 0.08 m2/t, respectively, with the variation coefficients of the independent variables set at ±5%, ±10%, ±15%, and ±20%, respectively.
As shown in Figure 3, the sort orders of each parameter’s degree of influence on green mining are as follows: τg > R > r >Fg > pg. This once again proves that the reduction in τg and increase in R are the two most effective approaches to improving Ae and eventually improving the mining companies’ inclination towards adopting the green mining mode.

4.3. Impact of Production Scale

From behavior analysis of a company in Section 4.1, the production scale of a mine can affect the company’s inclination to upgrade technology. In this section, we discuss this phenomenon in more detail.
Taking a gold mine as an example, the minimum annual output, QR, should be more than 15,000 t in China. A mine that can produce more than 150,000 t of gold ore per annum belongs to the group of large mines, as shown in Table 6. The largest gold mine in China is in Shandong province, with an annual ore output of over 3.6 million t in 2018.
To quantify the green mining technology level, we divide the technical level into five grades by percentage (see Table 7). The values of five green mining technical parameters (τg, R, r, Fg, and pg) at each grade are calculated proportionally.
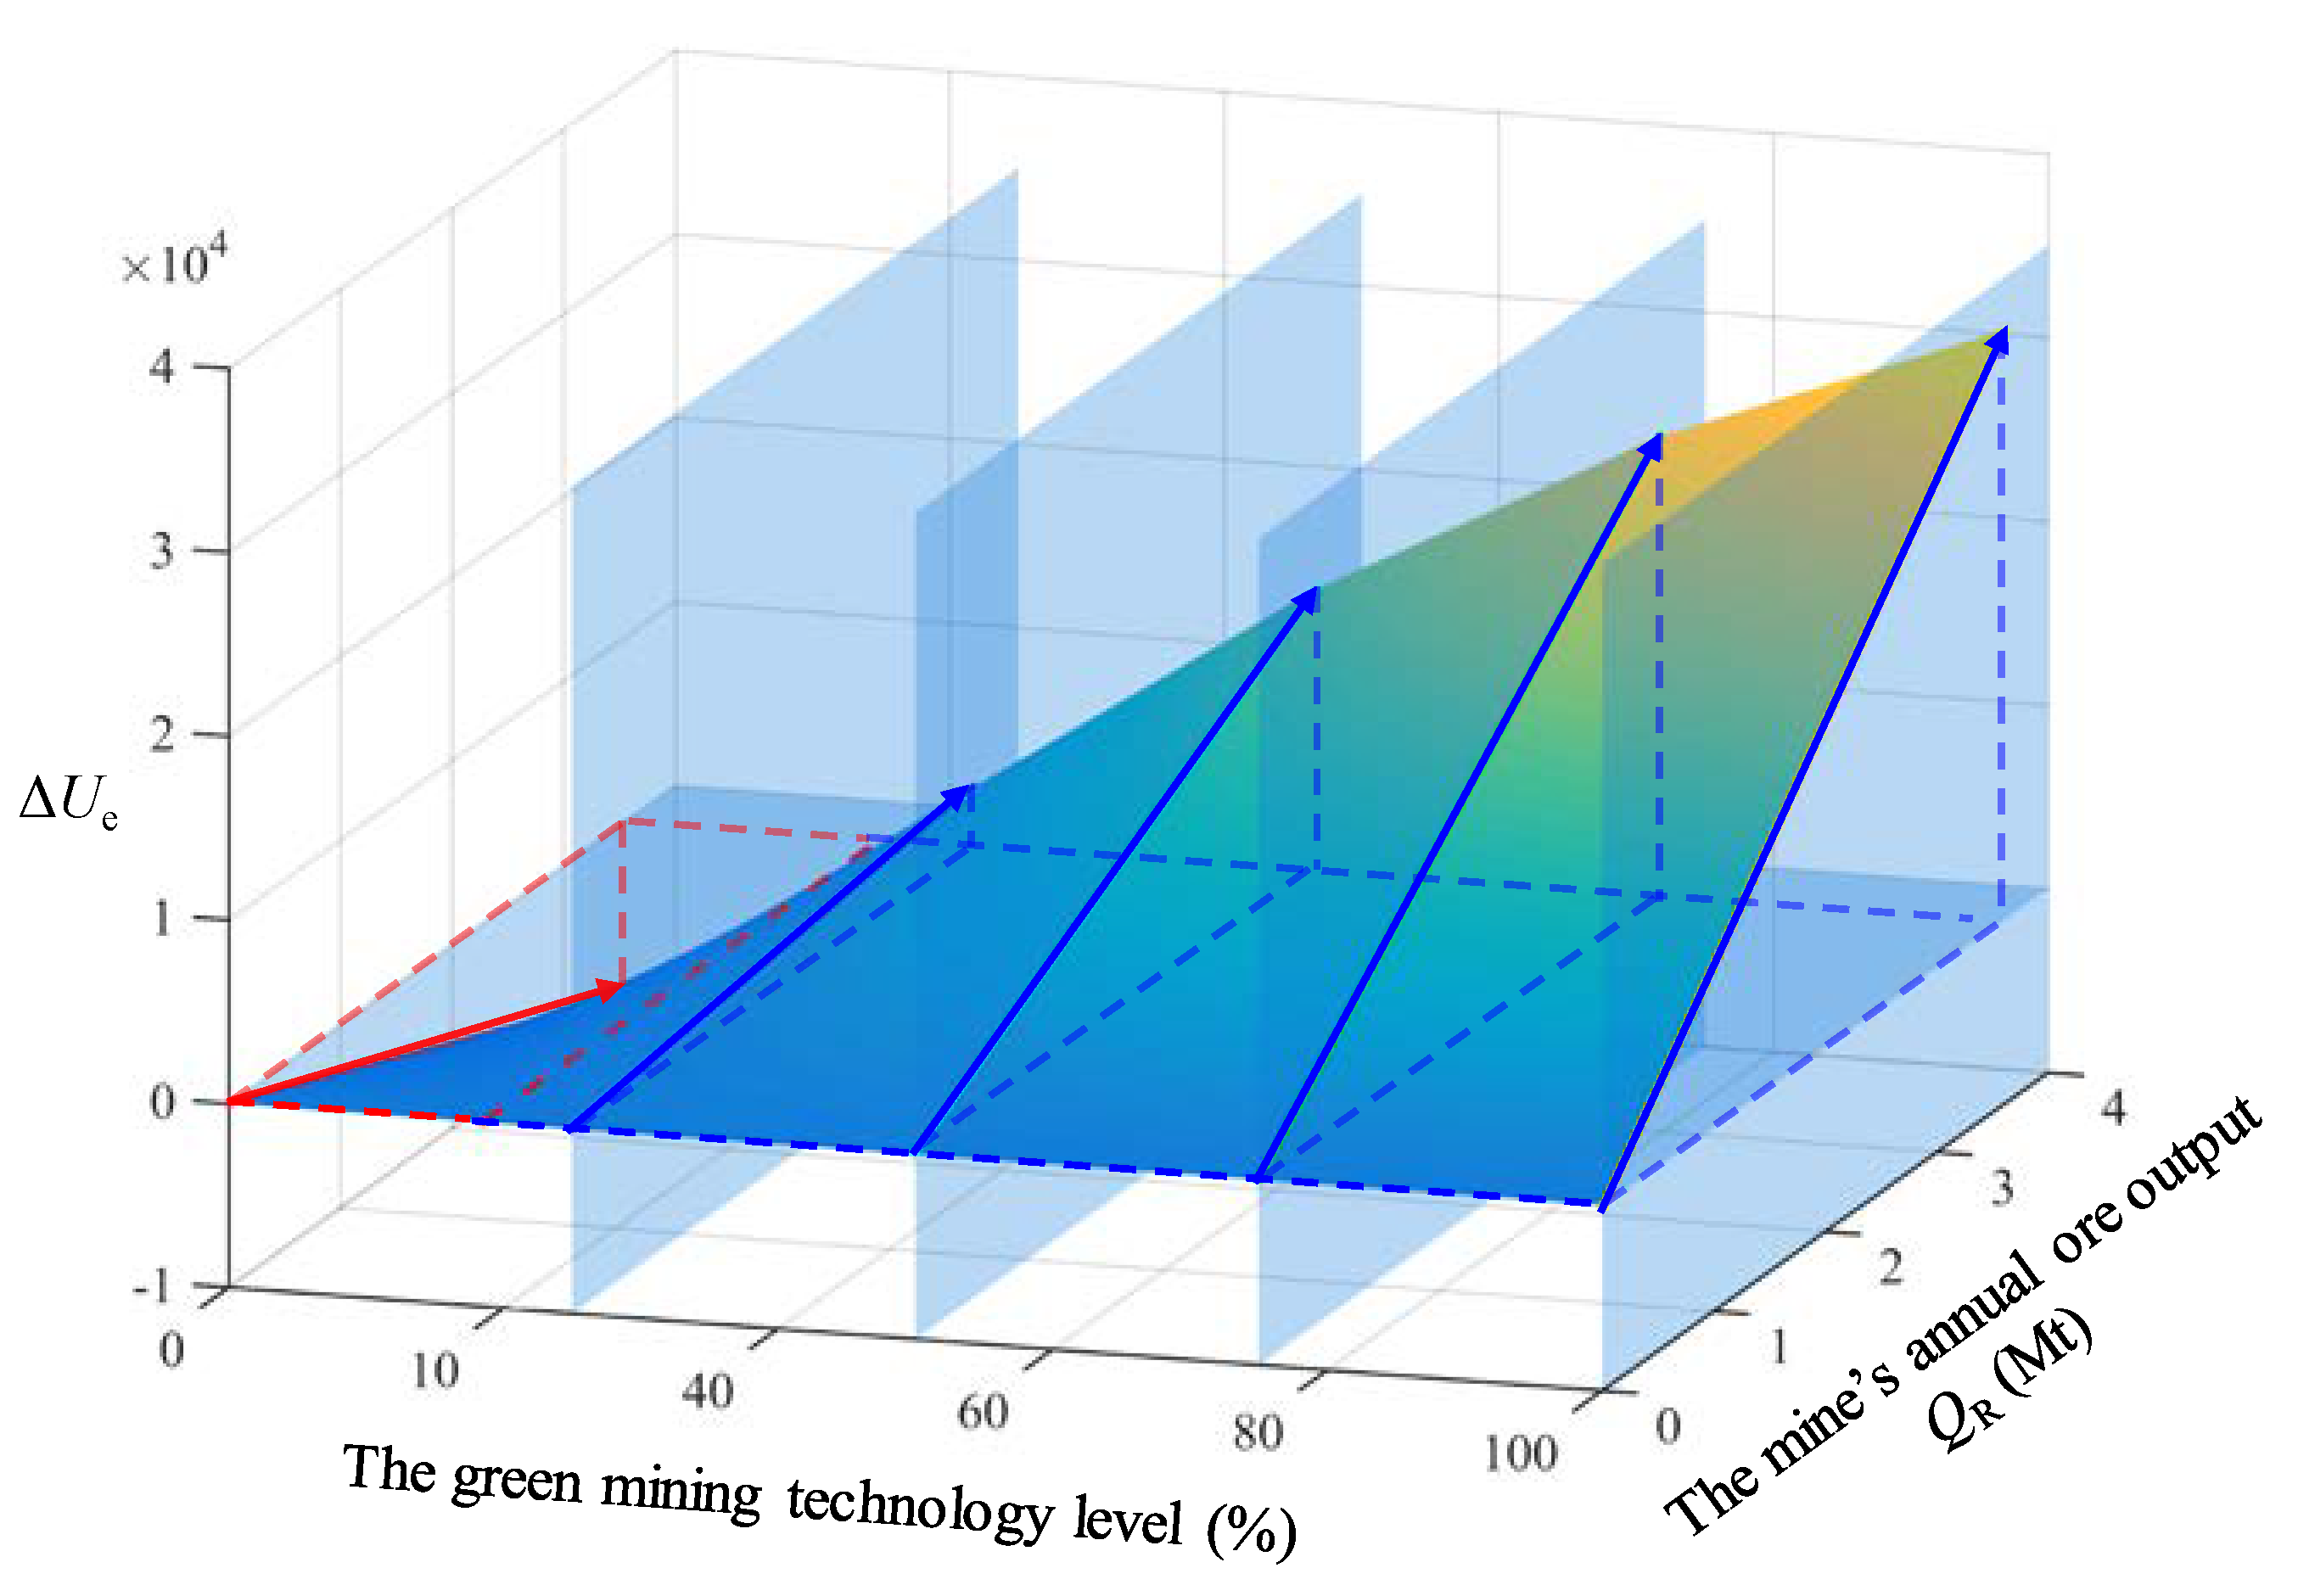
We calculate the company’s increased profits from adopting green mining, ∆Ue, under different green mining technology levels by inserting the data from Table 6 and Table 7 into Equations (21). Figure 4 plots the results as a 3D curved surface graph, using the green mining technology level, the mine’s annual ore output, and ∆Ue as the x-axis, y-axis, and z-axis, respectively.
From Figure 4 and Equation (22), an increase in QR can raise ∆Ue when Ae is greater than zero. By comparing the change in ∆Ue with the green mining technology level and QR, we find that ∆Ue changes when the green mining technology level increases with QR. If mining companies with different scales invest similarly to upgrade their green mining technology level, return on investment of small mines will be less, with a longer investment payoff period than that of large mines. Thus, large mines have more motivation to innovate on technology and upgrade the level of green mining technology than small mines.
Green mining can be graded into three modes as follows, based on the green technology level of each mining production link: The light green mode, where the green technologies adopted in most of the production links are of a low level, the medium green mode, where the green technologies adopted in nearly half of the production links are advanced, and the deep green mode, where the green technologies adopted in most of the production links are advanced and industry-leading. From the above analyses, large mines invest in green technology development and innovation to increase their own income and also to improve the technical level of the entire industry, but small mines investing too heavily in technology development may face investment risks due to the long payback period. Therefore, in the promotion of green mining, small mines, medium mines, and large mines are suitable for the light green, medium green, and deep green mining modes, respectively.
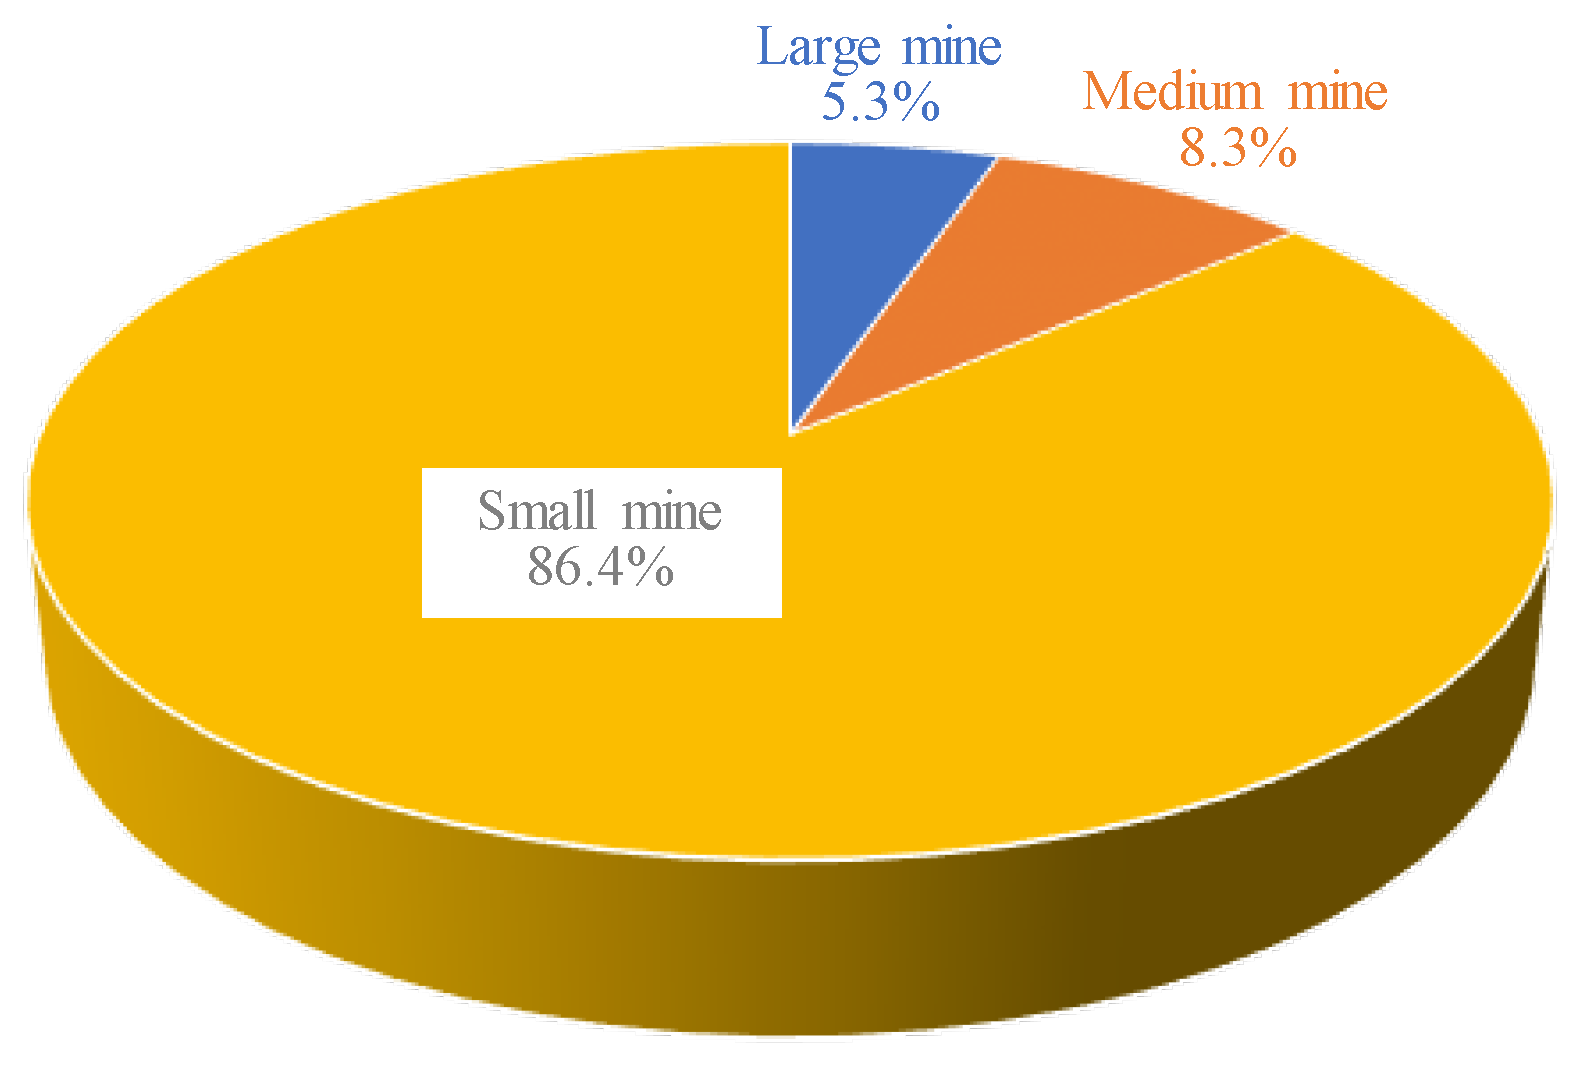
From the Chinese land and resources data, small mines accounted for more than 85% of the total mining companies in 2016 [8], as shown in Figure 5. To achieve cleaner production in the Chinese metal mining industry and to change all mines into green mines, improving small mines is a critical task. Since small mines lack the motivation for technical innovation, the Chinese central government should design subsidy policies and encourage mining associations or research institutes to promote mature green mining technology applicable to small mines. Some large mines can sell their own green mining technology and the total solutions to small mines, and develop themselves from simple ore production and processing companies to technology companies.

5. Conclusions

To promote the cleaner level of production in the Chinese metal mining industry, we established a game model between local governments and mining companies based on the current situation of metal mines in China. We analyzed the decision-making tendencies of the local governments and mining companies, and compare their utility under various strategic combinations. Then, we investigated the impact of the green mining technology level and mine scale on the mining companies’ decision-making. Compared with the current research situation, this game model has two major breakthroughs. Firstly, this game model adopts a quantitative analysis model, which can quantitatively analyse the influence of mine production scale, technical level of each mining link, and supervision cost of the government. Secondly, the influences of the green technology level of mining links and production scale on mining companies’ profits are discussed, which is very important in this topic, but there are very few discussions in current research. The summaries and suggestions are indicated as follows:
  • Considering the local government’s benefit from supervising metal mines in its administrative area, its inclination to supervise a mine is negatively related to the supervision cost and positively related to the production scale of this mine. Therefore, in order to encourage the local governments to supervise all mining companies with different scales strictly, the central government needs to help them to reduce the supervision costs by providing some efficient tools, such as the satellite imagery and aerial photography.
  • Developing a mining company’s green mining technologies can eventually improve its inclination towards adopting the green mining mode. Through comparative analysis of the effects of developing each kind of technology alone, the results show that mining companies can increase more profit by reducing the TWR yield and increasing comprehensive utilization rate. So, these two kinds of technologies need to be considered as priorities in the government’s technology extension programs.
  • A metal mining company’s increased profit from upgrading the green mining technology level is positively related with its production scale. Considering the returns on investment and investment payoff period, a mine that has a larger production scale will have more enthusiasm to develop green mining technologies. However, small mines may face operational risks if they invest too much money in upgrading technologies. Thus, small mines, medium mines, and large mines are suitable for light green, medium green, and deep green mining modes, respectively. In order to enhance the technological level of the entire metal mining industry, the government needs to encourage large mines in technological innovation and popularize the mature green mining technologies in small mines.
Several future directions are worth exploring. This paper mainly discusses the impact of supervision cost, green mining technology, and mines’ production scales. On the basis of this paper, the optimal strategy for the central government’s environmental policy in the mining industry is able to be studied in the next step. The subsidy policy of green mining technology also needs to be investigated carefully based on the mining companies’ profits from upgrading the technology levels in the further study.

Supplementary Materials

The following are available online at https://www.mdpi.com/2071-1050/12/7/2991/s1, Table S1: The Raw Data for Parameter Determination.

Author Contributions

Conceptualization, Y.Z. and G.Z.; investigation, D.P.; methodology, Y.Z. and J.Z.; writing- original draft preparation, Y.Z.; writing—review and editing, J.Z. and W.L.; visualization, J.Q.; supervision, G.Z. All authors have read and agreed to the published version of the manuscript.

Funding

This work was supported by the National Key Research and Development Program of China (2018YFC0604606); and the Fundamental Research Funds for the Central Universities of Central South University (2019zzts306).

Acknowledgments

The authors would like to thank all those at the Sanshandao Gold Mine who provided considerable support during data collection. We also sincerely thank the anonymous reviewers for their helpful and constructive suggestions and the editors for their careful and patient work.

Conflicts of Interest

The authors declare no conflict of interest.

References

  1. Azapagic, A. Developing a framework for sustainable development indicators for the mining and minerals industry. J. Clean. Prod. 2004, 12, 639–662. [Google Scholar] [CrossRef]
  2. Farjana, S.H.; Huda, N.; Parvez Mahmud, M.A.; Saidur, R. A review on the impact of mining and mineral processing industries through life cycle assessment. J. Clean. Prod. 2019, 231, 1200–1217. [Google Scholar] [CrossRef]
  3. Zhou, Z.; Wang, H.; Cai, X.; Chen, L.; E, Y.; Cheng, R. Damage evolution and failure behavior of post-mainshock damaged rocks under aftershock effects. Energies 2019, 12, 4429. [Google Scholar] [CrossRef] [Green Version]
  4. Zhou, Z.; Cai, X.; Li, X.; Cao, W.; Du, X. Dynamic response and energy evolution of sandstone under coupled static–dynamic compression: Insights from experimental study into deep rock engineering applications. Rock Mech. Rock Eng. 2019, 53, 1305–1331. [Google Scholar] [CrossRef]
  5. Liang, W.; Zhao, G.; Wang, X.; Zhao, J.; Ma, C. Assessing the rockburst risk for deep shafts via distance-based multi-criteria decision making approaches with hesitant fuzzy information. Eng. Geol. 2019, 260, 105211. [Google Scholar] [CrossRef]
  6. Minggao, Q. Technological system and green mining concept. Coal Sci. Technol. Mag. 2003, 4, 1–3. (In Chinese) [Google Scholar]
  7. Aznar-Sánchez, J.A.; Velasco-Muñoz, J.F.; Belmonte-Ureña, L.J.; Manzano-Agugliaro, F. Innovation and technology for sustainable mining activity: A worldwide research assessment. J. Clean. Prod. 2019, 221, 38–54. [Google Scholar] [CrossRef]
  8. MNR. China Land and Resources Statistical Yearbook; Geology Press: Beijing, China, 2017. (In Chinese) [Google Scholar]
  9. Weizhang, L.; Bing, D.; Guoyan, Z.; Hao, W. Wu assessing the performance of green mines via a hesitant fuzzy ORESTE–QUALIFLEX method. Mathematics 2019, 7, 788. [Google Scholar]
  10. Liang, W.; Luo, S.; Zhao, G. Evaluation of cleaner production for gold mines employing a hybrid multi-criteria decision making approach. Sustainability 2018, 11, 146. [Google Scholar] [CrossRef] [Green Version]
  11. Zhao, Y.S.; Du, X.L.; Yang, P.F. Discuss about the Sustainable Development Way for China Mining. Adv. Mater. Res. 2013, 869, 479–483. [Google Scholar] [CrossRef]
  12. Shang, D.; Yin, G.; Li, X.; Li, Y.; Jiang, C.; Kang, X.; Liu, C.; Zhang, C. Analysis for Green Mine (phosphate) performance of China: An evaluation index system. Resour. Policy 2015, 46, 71–84. [Google Scholar] [CrossRef]
  13. Fan, S.; Yan, J.; Sha, J. Innovation and economic growth in the mining industry: Evidence from China’s listed companies. Resour. Policy 2017, 54, 25–42. [Google Scholar] [CrossRef]
  14. Qi, R.; Liu, T.; Jia, Q.; Sun, L.; Liu, J. Simulating the sustainable effect of green mining construction policies on coal mining industry of China. J. Clean. Prod. 2019, 226, 392–406. [Google Scholar] [CrossRef]
  15. Madani, S.R.; Rasti-Barzoki, M. Sustainable supply chain management with pricing, greening and governmental tariffs determining strategies: A game-theoretic approach. Comput. Ind. Eng. 2017, 105, 287–298. [Google Scholar] [CrossRef]
  16. Mahmoudi, R.; Rasti-Barzoki, M. Sustainable supply chains under government intervention with a real-world case study: An evolutionary game theoretic approach. Comput. Ind. Eng. 2018, 116, 130–143. [Google Scholar] [CrossRef]
  17. Zhang, S.; Yu, Y.; Zhu, Q.; Qiu, C.M.; Tian, A. Green Innovation Mode under Carbon Tax and Innovation Subsidy: An Evolutionary Game Analysis for Portfolio Policies. Sustainability 2020, 12, 1385. [Google Scholar] [CrossRef] [Green Version]
  18. Zhao, R.; Neighbour, G.; McGuire, M.; Deutz, P. A software based simulation for cleaner production: A game between manufacturers and government. J. Loss Prev. Process Ind. 2013, 26, 59–67. [Google Scholar] [CrossRef]
  19. Zhao, R.; Neighbour, G.; Han, J.; McGuire, M.; Deutz, P. Using game theory to describe strategy selection for environmental risk and carbon emissions reduction in the green supply chain. J. Loss Prev. Process Ind. 2012, 25, 927–936. [Google Scholar] [CrossRef]
  20. Hafezalkotob, A.; Borhani, S.; Zamani, S. Development of a Cournot-oligopoly model for competition of multi-product supply chains under government supervision. Sci. Iran. 2017, 24, 1519–1532. [Google Scholar] [CrossRef] [Green Version]
  21. Hafezalkotob, A. Direct and indirect intervention schemas of government in the competition between green and non-green supply chains. J. Clean. Prod. 2018, 170, 753–772. [Google Scholar] [CrossRef]
  22. Shen, L.; Wang, Y. Supervision mechanism for pollution behavior of Chinese enterprises based on haze governance. J. Clean. Prod. 2018, 197, 571–582. [Google Scholar] [CrossRef]
  23. Zhou, X.; Zhao, R.; Cheng, L.; Min, X. Impact of policy incentives on electric vehicles development: A system dynamics-based evolutionary game theoretical analysis. Clean Technol. Environ. Policy 2019, 21, 1039–1053. [Google Scholar] [CrossRef]
  24. Ma, W.; Zhang, R.; Chai, S. What Drives Green Innovation? A Game Theoretic Analysis of Government Subsidy and Cooperation Contract. Sustainability 2019, 11, 5584. [Google Scholar] [CrossRef] [Green Version]
  25. Liu, Z.; Li, X.; Peng, X.; Lee, S. Green or nongreen innovation? Different strategic preferences among subsidized enterprises with different ownership types. J. Clean. Prod. 2020, 245, 118786. [Google Scholar] [CrossRef]
  26. Sheng, J.; Zhou, W.; Zhu, B. The coordination of stakeholder interests in environmental regulation: Lessons from China’s environmental regulation policies from the perspective of the evolutionary game theory. J. Clean. Prod. 2020, 249, 119385. [Google Scholar] [CrossRef]
  27. Cheng, Y.; Kaiguang, H.; Feng, L. The game model for the relationship between government regulation and mine pollution management. Miner. Eng. Res. 2015, 30, 76–80. (In Chinese) [Google Scholar]
  28. Li, X.; Wang, F. The game analysis of development of green mining economy of mining enterprises. Nat. Resour. Econ. China 2013, 5, 24–27. (In Chinese) [Google Scholar]
  29. Shaohong, C.; Renfa, L.; Qiulan, X. Game analysis on ecological compensation of mineral resources exploitation. Min. Res. Dev. 2011, 31, 103–107. (In Chinese) [Google Scholar]
  30. Canada, N.R. Glencore Raglan Mine Renewable Electricity Smart-Grid Pilot Demonstration. Available online: https://www.nrcan.gc.ca/science-and-data/funding-partnerships/funding-opportunities/current-investments/glencore-raglan-mine-renewable-electricity-smart-grid-pilot-demonstration/16662 (accessed on 29 June 2019).
  31. Gleeson, D. Goldcorp’s Borden all-Electric Underground Mine Moves Towards Production. Available online: https://im-mining.com/2018/10/25/goldcorps-borden-electric-gold-mine-moves-towards-production/ (accessed on 22 April 2019).
  32. Wang, C.; Harbottle, D.; Liu, Q.; Xu, Z. Current state of fine mineral tailings treatment: A critical review on theory and practice. Miner. Eng. 2014, 58, 113–131. [Google Scholar] [CrossRef]
  33. Li, C.; Sun, H.; Bai, J.; Li, L. Innovative methodology for comprehensive utilization of iron ore tailings. J. Hazard. Mater. 2010, 174, 71–77. [Google Scholar] [CrossRef]
  34. Johnson, D. Recent developments in microbiological approaches for securing mine wastes and for recovering metals from mine waters. Minerals 2014, 4, 279–292. [Google Scholar] [CrossRef]
  35. Mulchandani, A.; Westerhoff, P. Recovery opportunities for metals and energy from sewage sludges. Bioresour. Technol. 2016, 215, 215–226. [Google Scholar] [CrossRef] [PubMed] [Green Version]
  36. Deng, Y.; You, D.; Wang, J. Optimal strategy for enterprises’ green technology innovation from the perspective of political competition. J. Clean. Prod. 2019, 235, 930–942. [Google Scholar] [CrossRef]
  37. Ozdemir, B.; Kumral, M. Simulation-based optimization of truck-shovel material handling systems in multi-pit surface mines. Simul. Model. Pract. Theory 2019, 95, 36–48. [Google Scholar] [CrossRef]
  38. Feng, A.; Lv, Z.; Wu, Q.; Yang, H.; Wu, B.; Cao, J. Big data research on mining solid waste. Conserv. Util. Miner. Resour. 2018, 2, 40–43. (In Chinses) [Google Scholar]
  39. Chen, T.; Lei, C.; Yan, B.; Li, L.; Xu, D.; Ying, G.-G. Spatial distribution and environmental implications of heavy metals in typical lead (Pb)-zinc (Zn) mine tailings impoundments in Guangdong Province, South China. Environ. Sci. Pollut. Res. 2018, 25, 36702–36711. [Google Scholar] [CrossRef]
  40. Ministry of Natural Resources. China Mineral Resources; Geology Press: Beijing, China, 2018. [Google Scholar]
  41. National Development and Reform Commission. Annual Report on Comprehensive Utilization of China Resources. Recycl. Resour. Circ. Econ. 2014, 7, 3–8. (In Chinese) [Google Scholar]
  42. Ling, Y.; Yang, M.; Yuming, Z. Recovery and comprehensive utilization of gold tailings. GOLD 2010, 31, 52–56. (In Chinese) [Google Scholar]
  43. Jiqing, W.; Ping, W.; Xiaojuan, Z.; Xiangwei, L. Study and apply on comprehensive recovery of tailing ore of gold flotation. Glod Sci. Technol. 2010, 18, 87–89. (In Chinese) [Google Scholar]
Figure 1. The normal form of a game between the mining company and local government.
Sustainability 12 02991 g001
Figure 2. The impact of green mining technology level on Ae: (a) yield of tailings and waste rocks (TWR); (b) comprehensive utilization rate of TWR; (c) additional cost of environmentally friendly disposal; (d) profit of comprehensive utilization of TWR; (e) area of land polluted by unit mass TWR.
Sustainability 12 02991 g002aSustainability 12 02991 g002b
Figure 3. Sensitivity analysis of five green mining technology parameter levels.
Sustainability 12 02991 g003
Figure 4. Effect of mine scale and green technology level on ∆Ue.
Sustainability 12 02991 g004
Figure 5. Proportion of mining companies by scale in China in 2016 [8].
Sustainability 12 02991 g005
Table 1. Ore production parameters.
ParametersUnitDescription
QRtAnnual mine ore output.
γ-Concentrate yield; this refers to the mass ratio of concentrate produced to the ore consumed.
PCNY/tMine’s product price.
cCNY/tUnit concentrate production cost, including the cost of ore mining and ore dressing.
Table 2. Tailings and waste rocks (TWR) disposal parameters.
ParametersUnitDescription
QwtMine’s annual output of waste rock, Q w = ω ( 0 , g ) Q R .
ω0-Mass ratio between waste rock and ores under the conventional mining mode.
ωg-Mass ratio between waste rock and ores under green mining mode related to the level of mining technology, ω0 > ωg.
QttMine’s annual output of tailings, Q t = ( 1 γ ) Q R .
R%Comprehensive TWR utilization rate.
R ¯ %Average comprehensive TWR utilization rate under the current level of green mining technology.
rCNY/tProfit from comprehensive TWR utilization.
QtptAmount of piled TWR in the mine, Q t p = ( 1 R ) ( Q w + Q t ) .
F0CNY/tBasic cost of disposing of unit mass TWR conventionally.
FgCNY/tAdditional cost for disposing of unit mass TWR using environmentally friendly methods.
Table 3. Environmental governance parameters.
ParametersUnitDescription
GCNYCost of environmental restoration and treatment, G = Q t p F t p ( 0 , g ) .
FtCNY/m2Cost of treating the unit area of contaminated land, including the cost of mine drainage treatment, soil pollution control, mining area greening, and reclamation.
p0m2/tArea of land polluted by unit mass TWR when disposing of them conventionally.
pgm2/tArea of land polluted by unit mass TWR when disposing of them using environmentally friendly methods, p0 > pg.
Table 4. Local government supervision parameters.
ParametersUnitDescription
CCNYSupervision cost, such as government staff’s salary, cost of monitoring equipment, and whistleblower rewards.
TtCNY/tAd valorem resource tax levied on the sales of unit ore.
TpCNY/tSpecific duty environmental tax levied on pollutant emissions.
SCNYFines imposed when mining companies fail to control environmental pollution as required.
Table 5. Calculation model parameter values (gold mines are taken as example).
ParametersDescriptionUnitValue
Constant parameters
F0Basic cost of disposing of unit mass TWR conventionallyCNY/t20–40
τ0Yield of TWR in conventional mining-≈2.2
p0Area of land polluted by unit mass TWR when disposing them of conventionallym2/t≈0.13
TpSpecific duty environmental tax levied on pollutant emissionsCNY/t15
FtCost of treating unit area contaminated landCNY/m225–100
Parameters of green mining technology level
τgYield of TWR in for the green mining-τ0 > τ > 0.97
RComprehensive utilization rate of TWR%10–35
rProfit of comprehensive utilization of TWRCNY/t20–100
FgAdditional cost of disposing of unit mass TWR using environmentally friendly methodsCNY/t10–20
pgArea of land polluted by unit mass TWR when disposing of them using environmentally friendly methodsm2/tp0 > pg > 0.03
Table 6. The standard of division for gold mines by scale in China (unit: kilotonne).
TypeSmallMediumLargeMaximum Scale
Annual output15–6060–150≥ 1503600
Table 7. The value of green mining technical parameters at five levels.
ParametersUnitGreen Mining Technology Level
025%50%75%100%
τg-2.201.891.591.280.97
R%10.016.023.029.035.0
rCNY/t20.040.060.080.0100
FgCNY/t20.017.515.012.510.0
pgm2/t0.130.110.080.060.03

