Article

Using Virtual Reality to Assess Landscape: A Comparative Study Between On-Site Survey and Virtual Reality of Aesthetic Preference and Landscape Cognition

1
Department of Environmental Science and Landscape Architecture, Graduate School of Horticulture, Chiba University, Chiba 271-8510, Japan
2
Department of Tourism Management, Shanghai Business School, Shanghai 200235, China
*
Authors to whom correspondence should be addressed.
Sustainability 2020, 12(7), 2875; https://doi.org/10.3390/su12072875
Submission received: 10 February 2020 / Revised: 30 March 2020 / Accepted: 1 April 2020 / Published: 3 April 2020

Abstract

:
In recent years, research on landscape perception has been generally overoptimistic about the use of virtual reality (VR); however, few have questioned the validity of VR. It is necessary to examine whether on-site stimulation can be substituted by VR. The purpose of this study was to assess the degree of agreement between on-site survey and VR for landscape perception. The sample included 11 representative landscapes from Tsuchiura city and Tsukuba city, Japan. On-site survey data was collected for 17 items related to aesthetic preference and landscape cognition. The same scenes were produced by VR and same survey data as on-site was collected. The agreement of both the overall mean of all landscapes and the ratings of all individuals in each landscape confirmed the high level of concordance of most cognitive attributes between the two stimuli. The findings support immersive VR as a reliable tool for assessing landscape cognition.

1. Introduction

Public perceptions are related to and based on environmental attributes [1]. Therefore, it is essential to understand people’s landscape perceptions and aesthetic preferences to effectively design and set planning standards. These sensory experiences were previously only possible through real-life interactions. Traditional and mainstream environmental experiences require people to visit the site in person, which is expensive and time-consuming, and thus hinders the variety of landscape types that can be studied [2]. Since the 1970s, scholars have studied the representation validity of different visual materials to simulate landscapes, in order to find a simpler, cheaper, safer, and more transparent landscape evaluation method than on-site assessment. A prevalent though unstated assumption is that the more closely experimental conditions represent the “real-life” experience, the more accurately results reflect the response in “real life” to the environment studied [3]. As technology continues to advance, stimulating media have been expanding, from photographs, computer bitmaps and videos to virtual reality (VR) [2,4,5,6,7,8,9,10,11].
Lanier first used the term VR in 1989 and described it as a computer-simulated environment with, and within, which people interact [12]. Nowadays, VR has three types of systems: virtual environments presented on a flat screen, room-based systems such as cave automatic virtual environments (CAVEs), and head-mounted displays (HMD) [13,14]. In recent years, VR technology has been widely used by researchers, consumers, and enterprises, because many companies have introduced lightweight and affordable HMD devices. Compared with photos or photography, the visual information in VR matches up with the experience of the real world, where the visual scene updates with head movement. Therefore, most of the research works based on VR simulating the real environment are optimistic about its representation validity. VR is widely used in spatial cognition research, such as on the security of enclosed park spaces and the influence of virtual nature environments on mental actions [15,16,17]. At the same time, due to its high controllability and repeatability, VR can provide an even more in-depth experience than on-site observation. Recently, evaluation research projects, including on the coral reefs in Australia’s Great Barrier Reef, high-speed roads, metro journeys, and wind farm exposure, have been conducted through immersive VR [18,19,20,21].
Validity refers to the degree that something is as it purports to be [22]. Existing research on the ecological validity of VR has mainly focused on the fields of neurology, clinical psychology, and computer science, involving perception, path-finding, and self-cognition [23,24,25,26]. The conclusions of these studies indicate that VR is not only a useful tool for neuropsychology; the experience it produces is also an important research object. Research on the validity of VR in landscape evaluation is minimal. Lim et al. compared photos and 3D-modeled VR images and obtained a strong affirmation of the validity of VR images [27]. However, this research projected VR through the screen, and the perspectives of photos and VR images are basically the same, which may induce respondents to give similar scores. Riva et al. created three virtual parks with the same structure and objects but different atmospheres and compared the emotional differences of respondents in an immersive experience [12]. The study confirmed the interaction between “feeling in the field” and emotion in a VR environment. Neither of the above studies compared the stimuli of VR and on-site environments. Usoh et al. pointed out that the conclusions obtained when respondents experience the same type of environmental stimulus are questionable in cross-environmental experience comparisons, such as immersive VR compared to real, or desktop display compared to immersive VR [28]. Additionally, some scholars have also noted limitations and disadvantages of VR, e.g., the resolution of the display and the accuracy of body contact [13,29]. Therefore, a comparison between on-site observation and VR observation is necessary.
Choosing a suitable landscape representation method is also necessary. Landscape can be studied as a social structure or as an aesthetic object [30]. Sevenant and Antrop [2,31] and Filova et al. [32] pointed out that the main factors affecting the landscape representation are: rating variables, landscape types, sociodemographic characteristics, and the angle of view of the representation. The research paradigm of landscape perception mainly comes from the field of environmental psychology. Early studies aimed to determine the beauty of the overall landscape. In recent years, numerous studies have tried to explore more conceptual cognitive attributes to represent the landscape [33,34,35,36]. Van der Jagt et al. reevaluated and confirmed the effectiveness of the preference matrix as a standard of landscape aesthetics evaluation [37]. Filova et al. found that in all the interviewee characteristics tests, only the gender and the residence of the respondents are important [32]. Similar conclusions have been confirmed by other studies [38,39,40]. Sevenant and Antrop’s study discussed different horizontal perspectives by changing the width of the photos (normal and panoramic photos) and concluded that panoramic photos have advantages over normal photos [2]. Compared with a photo representing a specific view at a specific site, although VR can better reproduce the overall landscape, the observation range that observers prefer is unknown, and limited headset resolution is also a challenge.
To our best knowledge, few experiments have been carried out to compare the on-site survey data of landscape cognition with data stimulated by VR to check the representation validity of VR. To examine the potential of VR for substituting or complementing filed surveys and on-site landscape assessment, this research tried to answer the question whether the aesthetic preference and cognitive ratings of the on-site and VR stimuli are consistent. We compared landscape perception evaluation between on-site and VR stimuli, involving the overall landscape “beauty” score and the ratings of the 16 cognitive attribute variables. Both the concordance of mean variables for all vistas and the concordance of individuals for each vista were calculated, which, on the one hand, considers the impact of landscape types, and, on the other hand, excludes the impact of ecological fallacy caused by aggregated data. The findings are compared with earlier studies that investigated the validity of photographic stimuli.

2. Materials and Methods

2.1. Questionnaire

The questionnaire assesses cognitive items and aesthetic preferences. The first part was overall scoring of the scenery’s beauty (between 0 and 10). The second part consisted of 16 cognitive attributes to describe a more detailed perception using a 6-point Likert scale. Respondents needed to answer questions such as “To what extent do you consider the landscape is homogeneous?” The 16 cognitive attributes were: “vast,” “coherent,” “human-influenced,” “well-maintained,” “quiet,” “attractive plants,” “unspoiled,” “inviting to visit,” “of historical importance,” “valuable for conservation,” “homogeneous,” “bearing many functions,” “accessible,” and “typical.” This questionnaire was mainly derived from the research of Sevenant and Antrop [2,31] and also covered the classic theories of landscape perception [33,35]. In addition, respondents voluntarily filled in personal information, including nationality, age, and gender. The questionnaire was available in Chinese, Japanese, and English to meet the needs of tourists of different nationalities.

2.2. On-Site Survey Data Collection

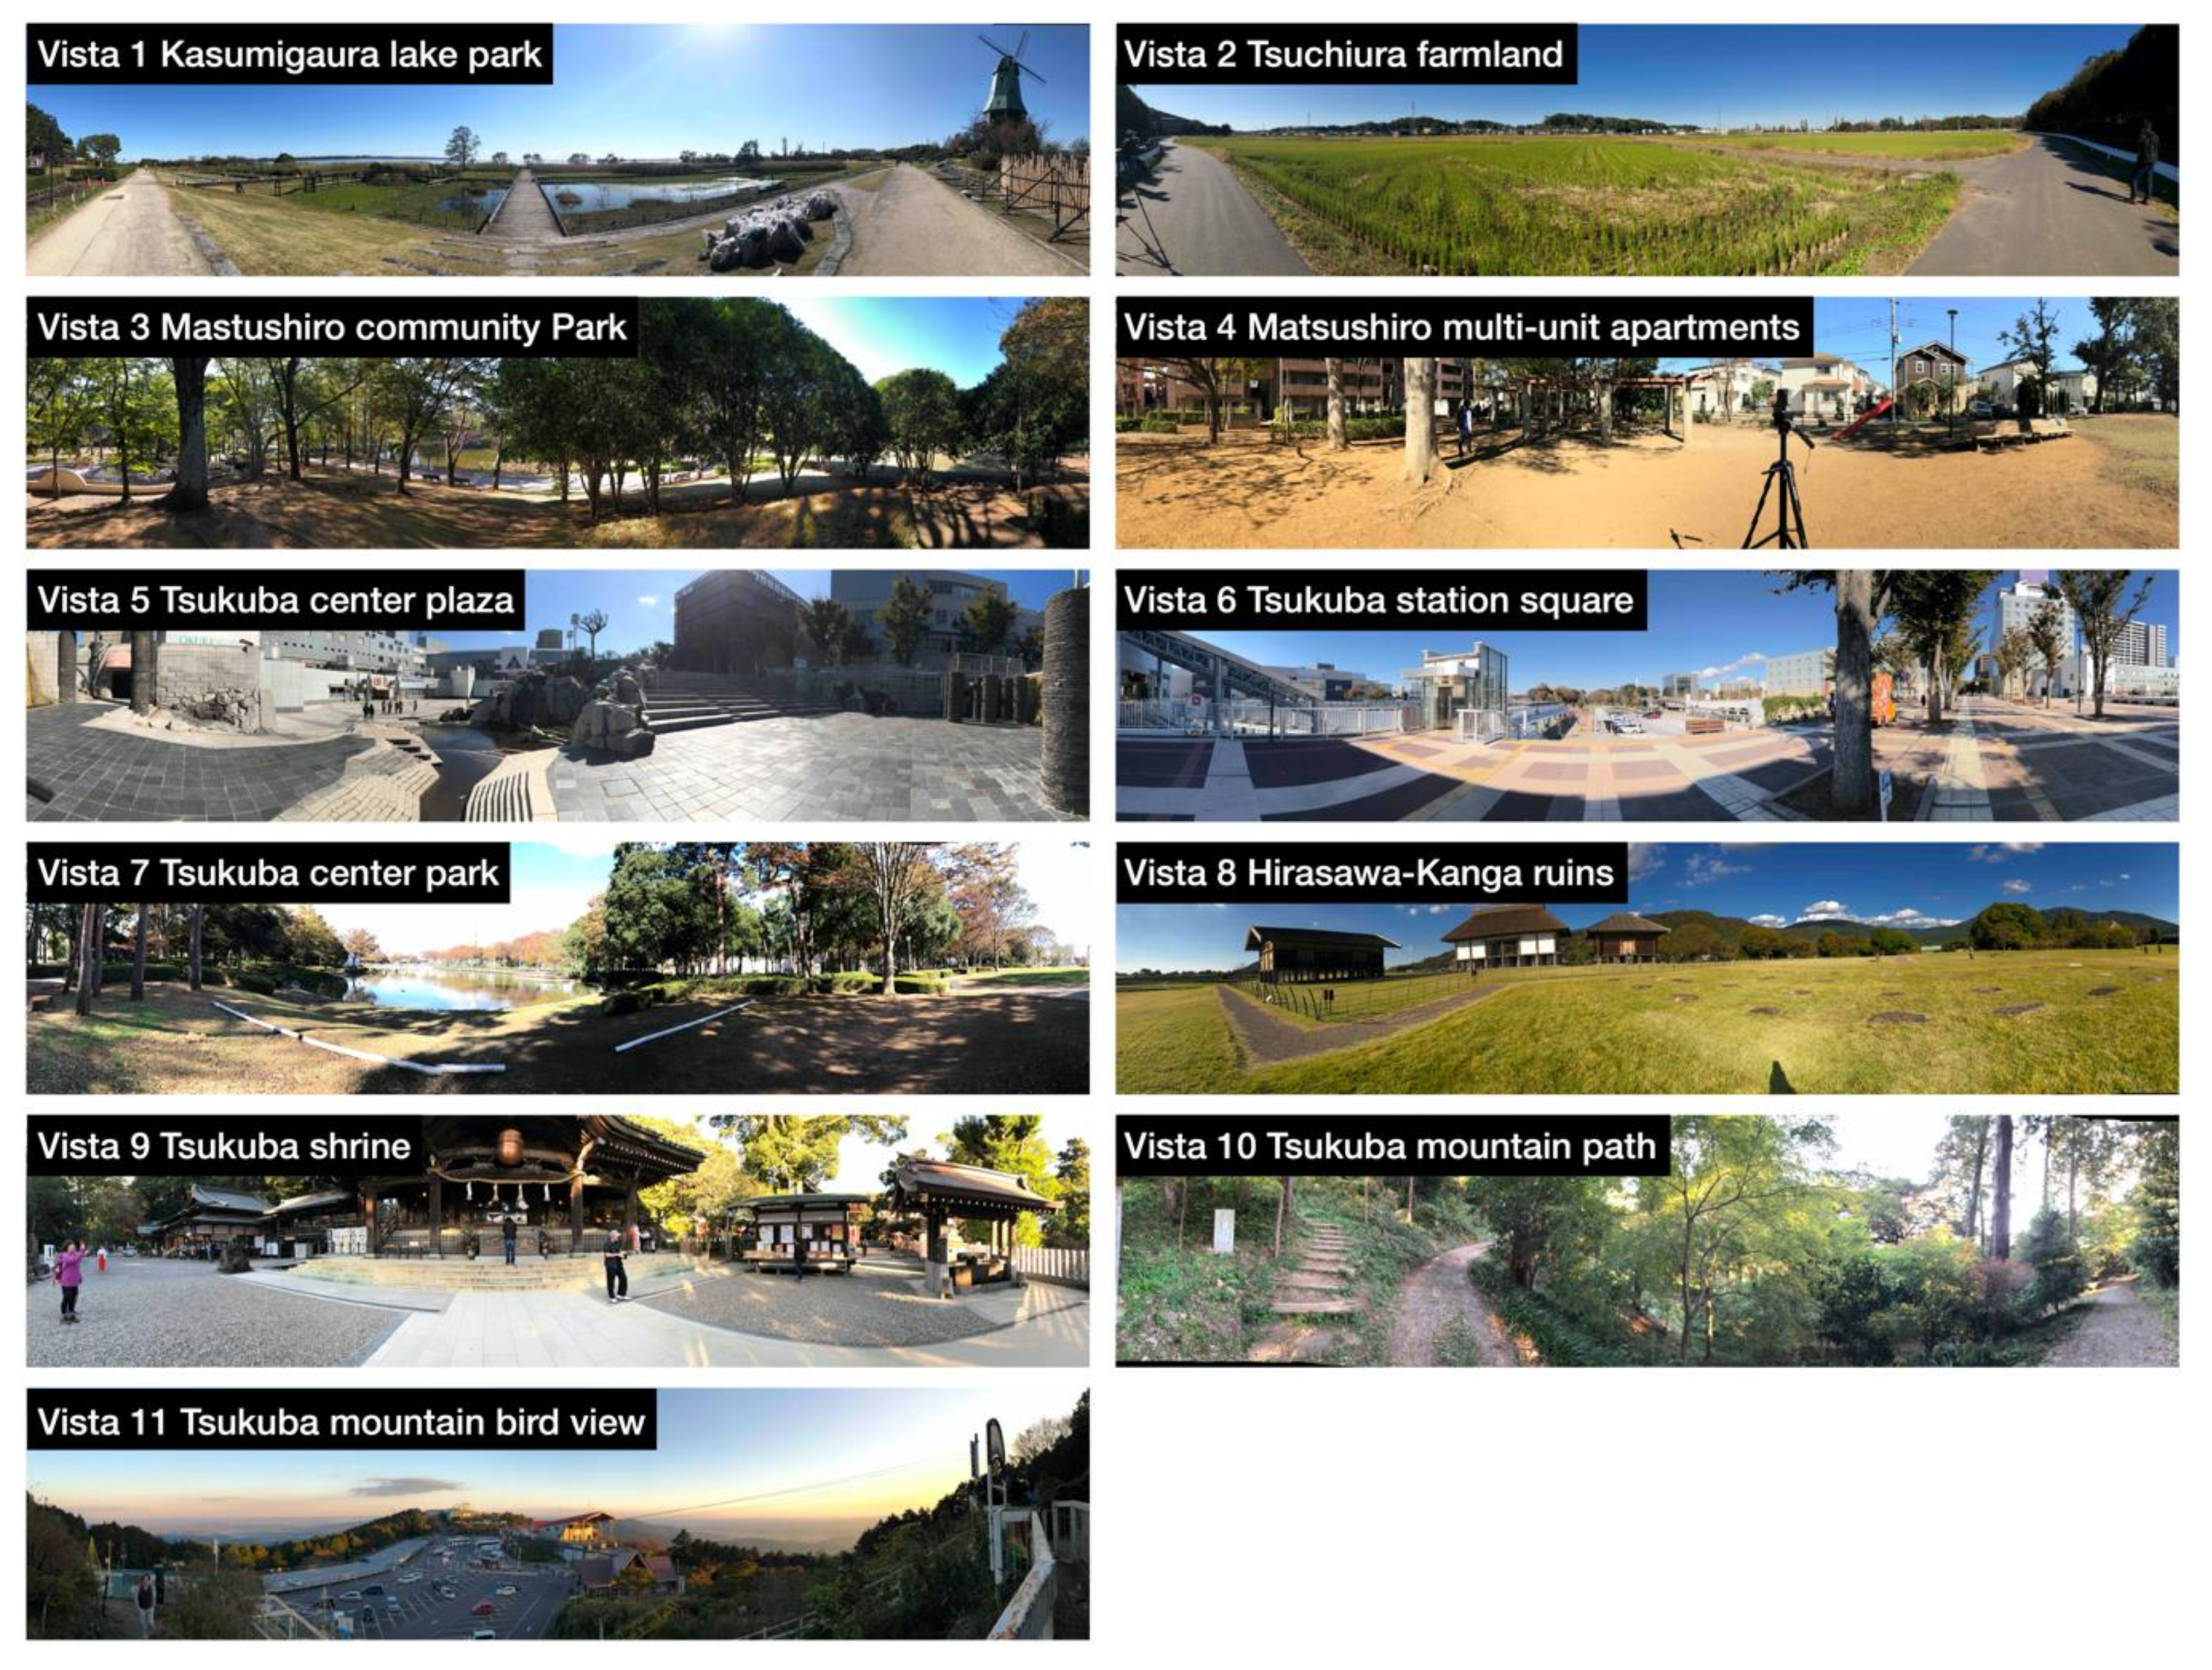
The on-site stimulation included 11 landscape observation points, which were non-randomly selected during the field trip in November 2018. The observation points were located in Tsuchiura city and Tsukuba city (see Figure 1), covering typical landscape types in the Kanto area of Japan, such as lakeside, mountain, farmland, urban center, urban community, historical ruins, and religious place. Table 1 illustrates the landscape features of the 11 vistas, including natural features including land cover and hydrology, as well as cultural features. The panoramic photos of the 11 vistas can be found in Appendix A Figure A1.
The on-site survey was conducted on 2 November 2018, a sunny day with few clouds and high visibility. Respondents stood at the designated position, observed the on-site landscape encompassing 360 degrees (without the designated observation angle), and filled in the questionnaire on site. The observation order of the on-site survey was from vistas 1 to 11 in turn. During the questionnaire, the respondents were not allowed to communicate with each other to ensure the independence of observation.

2.3. VR Data Collection

During the on-site survey, we collected data for VR stimulation. A tripod was placed at the observation point to fix the spherical camera (GoPro Fusion, GoPro, Inc., San Mateo, California, U.S.A.) at a height of 165 cm, matching the height of the average person’s eye-level. The camera with two 18-megapixel lenses recorded a 360° panoramic video. For each observation point, we filmed three 1-minute 360° videos (5.6 K 30 fps). Then, the high-res spherical content was stitched and rendered by GoPro Fusion Studio (GoPro, Inc., San Mateo, California, U.S.A.) into panoramic videos.
From December 2018 to January 2019, we conducted VR stimulation experiments in the laboratory. The HMD Oculus Go (Facebook Technologies, LLC, Irvine, California, U.S.A.), which was equipped with a 5.5-inch 2560 x 1440 resolution display, provided the immersive VR experience by tracking head motion to update the visual display. During the VR experience, respondents were asked to sit on a swivel chair in an open space and could rotate their body and head safely and freely. In order to eliminate the order effect, while wearing the headset, the respondents watched the panoramic videos in a random order stored on the device and answered the questionnaire verbally. The questionnaire was consistent with the on-site survey.

2.4. Respondents

Thirty-seven respondents (23 females and 14 males) aged 20–42 (M = 24.9, SD = 4.1) from Chiba University, who were recruited through posters, participated voluntarily in the study. Participants were students majoring in landscape architecture. They were assigned randomly to the on-site or VR experiment. Sixteen people participated in the on-site investigation, and 21 people participated in the VR stimulation experiment.

2.5. Statistical Analysis

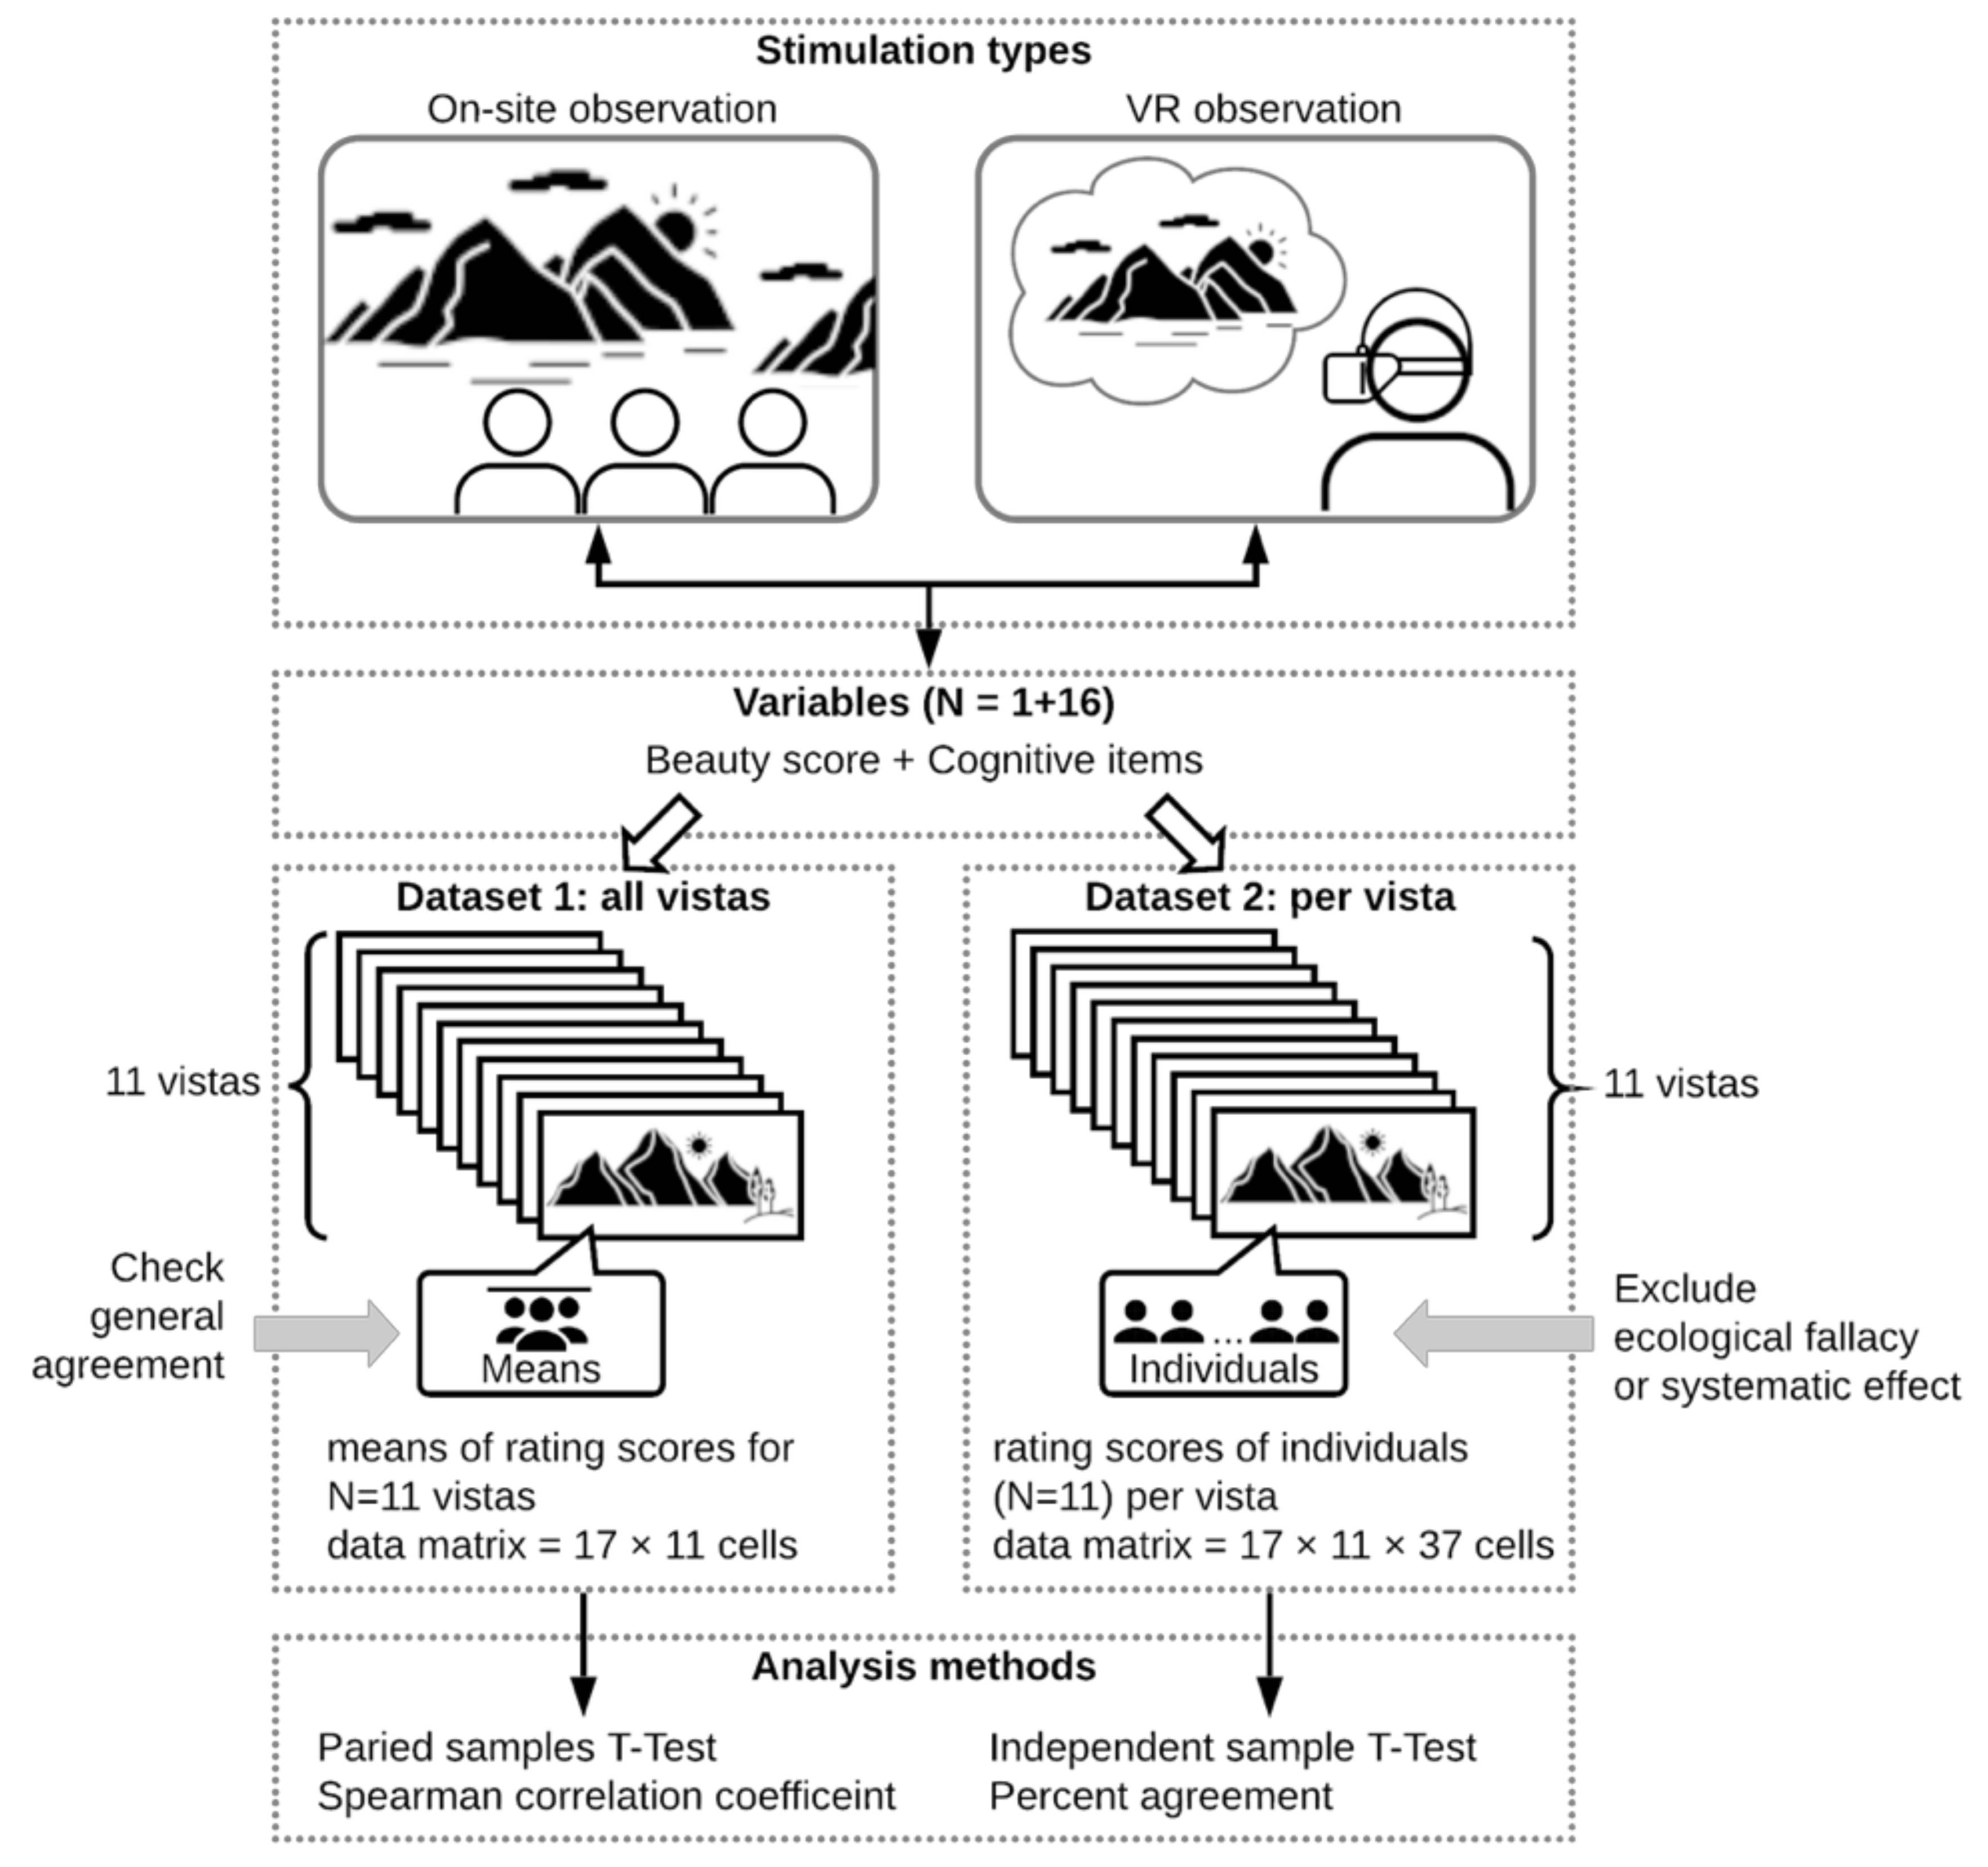
This study used two datasets (see Figure 2). Dataset 1 was the 17 variables (“beauty” score and 16 cognitive items) of all vistas, which were means rating scores for N = 11 vistas (data matrix = 17 × 11 cells). Dataset 2 was the variables per vista, which were rating scores of individuals (N = 37) per vista (data matrix = 17 × 11 × 37 cells).
Our study used a common repeatability experiment and comparative analysis to observe whether two different techniques that measure the same variable produce basically the same results, in order to evaluate the concordance of the two techniques. Therefore, Student’s t-test, as a usual method for numerical variables, was used to test the null hypothesis that the true mean difference is zero [41].
The open-source statistics software JASP (JASP Team, version 0.11. 1, University of Amsterdam, Amsterdam, The Netherlands) was used to measure the agreement and relationship between the on-site survey and VR. Cronbach’s alpha was used to measure the reliability of the dataset. To calculate the agreement between the two stimuli, paired samples t-tests and Spearman correlations were used for dataset 1, and independent samples t-tests and percent agreements were used for dataset 2.

3. Results

3.1. Reliability Analysis and Descriptive Statistics

The value of “beauty” scores was used to calculate the reliability for both stimuli because it has the largest standard deviation of all the variables. We supposed that respondents had similar scoring patterns, and the reliability of the “beauty” score can be extrapolated to other variables. Cronbach’s alpha was used to measure the intercorrelations, which should be greater than 0.7 to ensure reliability. To calculate the reliability, we considered the respondents as the variables and the landscapes as the cases. For the observation on-site and through VR, Cronbach’s alpha values were 0.837 and 0.708, respectively. The data for the two stimuli were reliable, which was the premise for further analysis. Table 2 provides the means and standard deviation of the “beauty” score variables per vista.
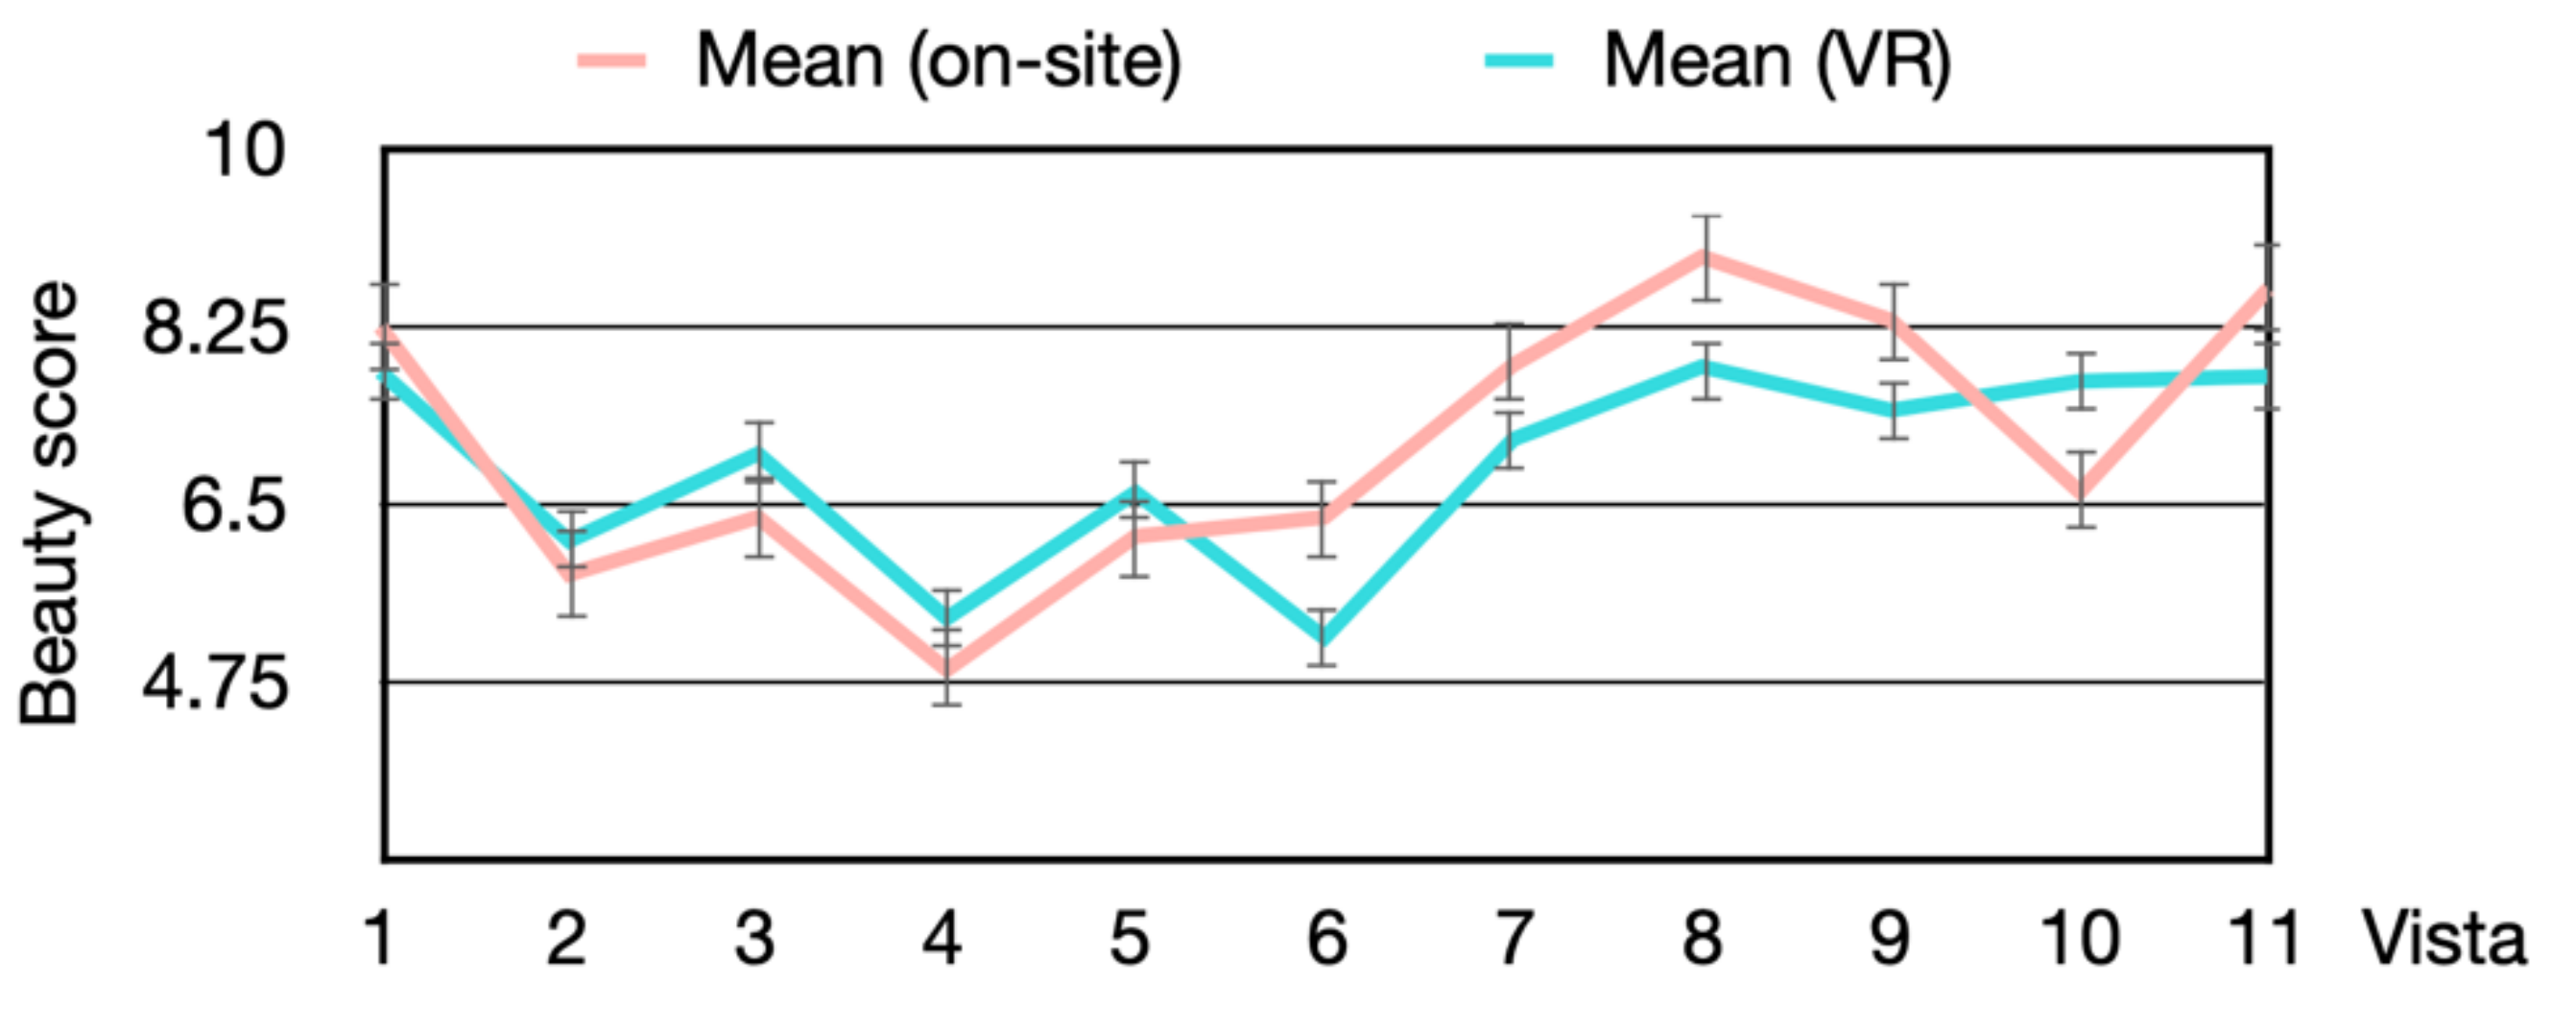
As Figure 3 shows, the mean “beauty” scores reflect the concentration trend of aesthetic preference. Six vistas have higher average scores for on-site stimuli, and the others increase in the VR environment. The trend of mean “beauty” score for on-site and VR were similar.
No matter what kind of stimulation, the three landscapes that obtained the highest average “beauty” score were vistas 1, 8, and 11, which all were natural landscapes. The three most “un-beautiful” landscapes according to on-site stimulation were vistas 2, 4, and 5, while for VR stimuli they were vistas 2, 4 and 6, which were all artificial landscapes. The standard deviation for all vistas indicated that the differences in aesthetic preference for VR stimuli (SD = 1.0) were smaller than those for on-site stimuli (SD = 1.3).

3.2. Aesthetic Preference

3.2.1. Agreement of Mean “Beauty” Scores for All Vistas

We used the paired sample t-test to estimate the effect size and test the null hypothesis that the average “beauty” scores of all vistas for the two stimuli are equal. The mean “beauty” scores for on-site stimuli were not significantly different from VR stimuli. t (10) = 0.82, p > 0.05, d = 0.25. The results showed agreement between the overall mean “beauty” scores of on-site and VR stimuli.

3.2.2. Agreement of “Beauty” Scores of Individuals per Vista

The independent samples t-test was used to check the significance of the difference between the two stimuli for “beauty” scores of individuals per vista, and the effect size was measured by Cohen’s d, which indicated that the d values of the small, medium, and large effect quantities correspond to 0.20, 0.50, and 0.80, respectively [42]. The results are shown in Table 3.
For vistas 1, 2, 3, 4, 5, 7, 8, and 10, there was no significant difference between the two stimuli (p > 0.05). For vistas 6, 9, and 11, the on-site stimuli achieved higher “beauty” scores than the VR stimuli, showing significant difference (p < 0.05). The values of Cohen’s d for these three vistas all were higher than 0.5 but lower than 0.8, indicating a moderate effect size. To sum up, 72.7% of the vista “beauty” scores showed agreement between on-site and VR, and the rest of the vistas had a medium difference between the two stimuli. Hence, combining the results of Section 3.2.1 and 3.2.2, VR can be used to assess landscape aesthetic preferences.

3.3. Cognitive Attributes

3.3.1. Agreement of Mean Cognitive Ratings for All Vistas

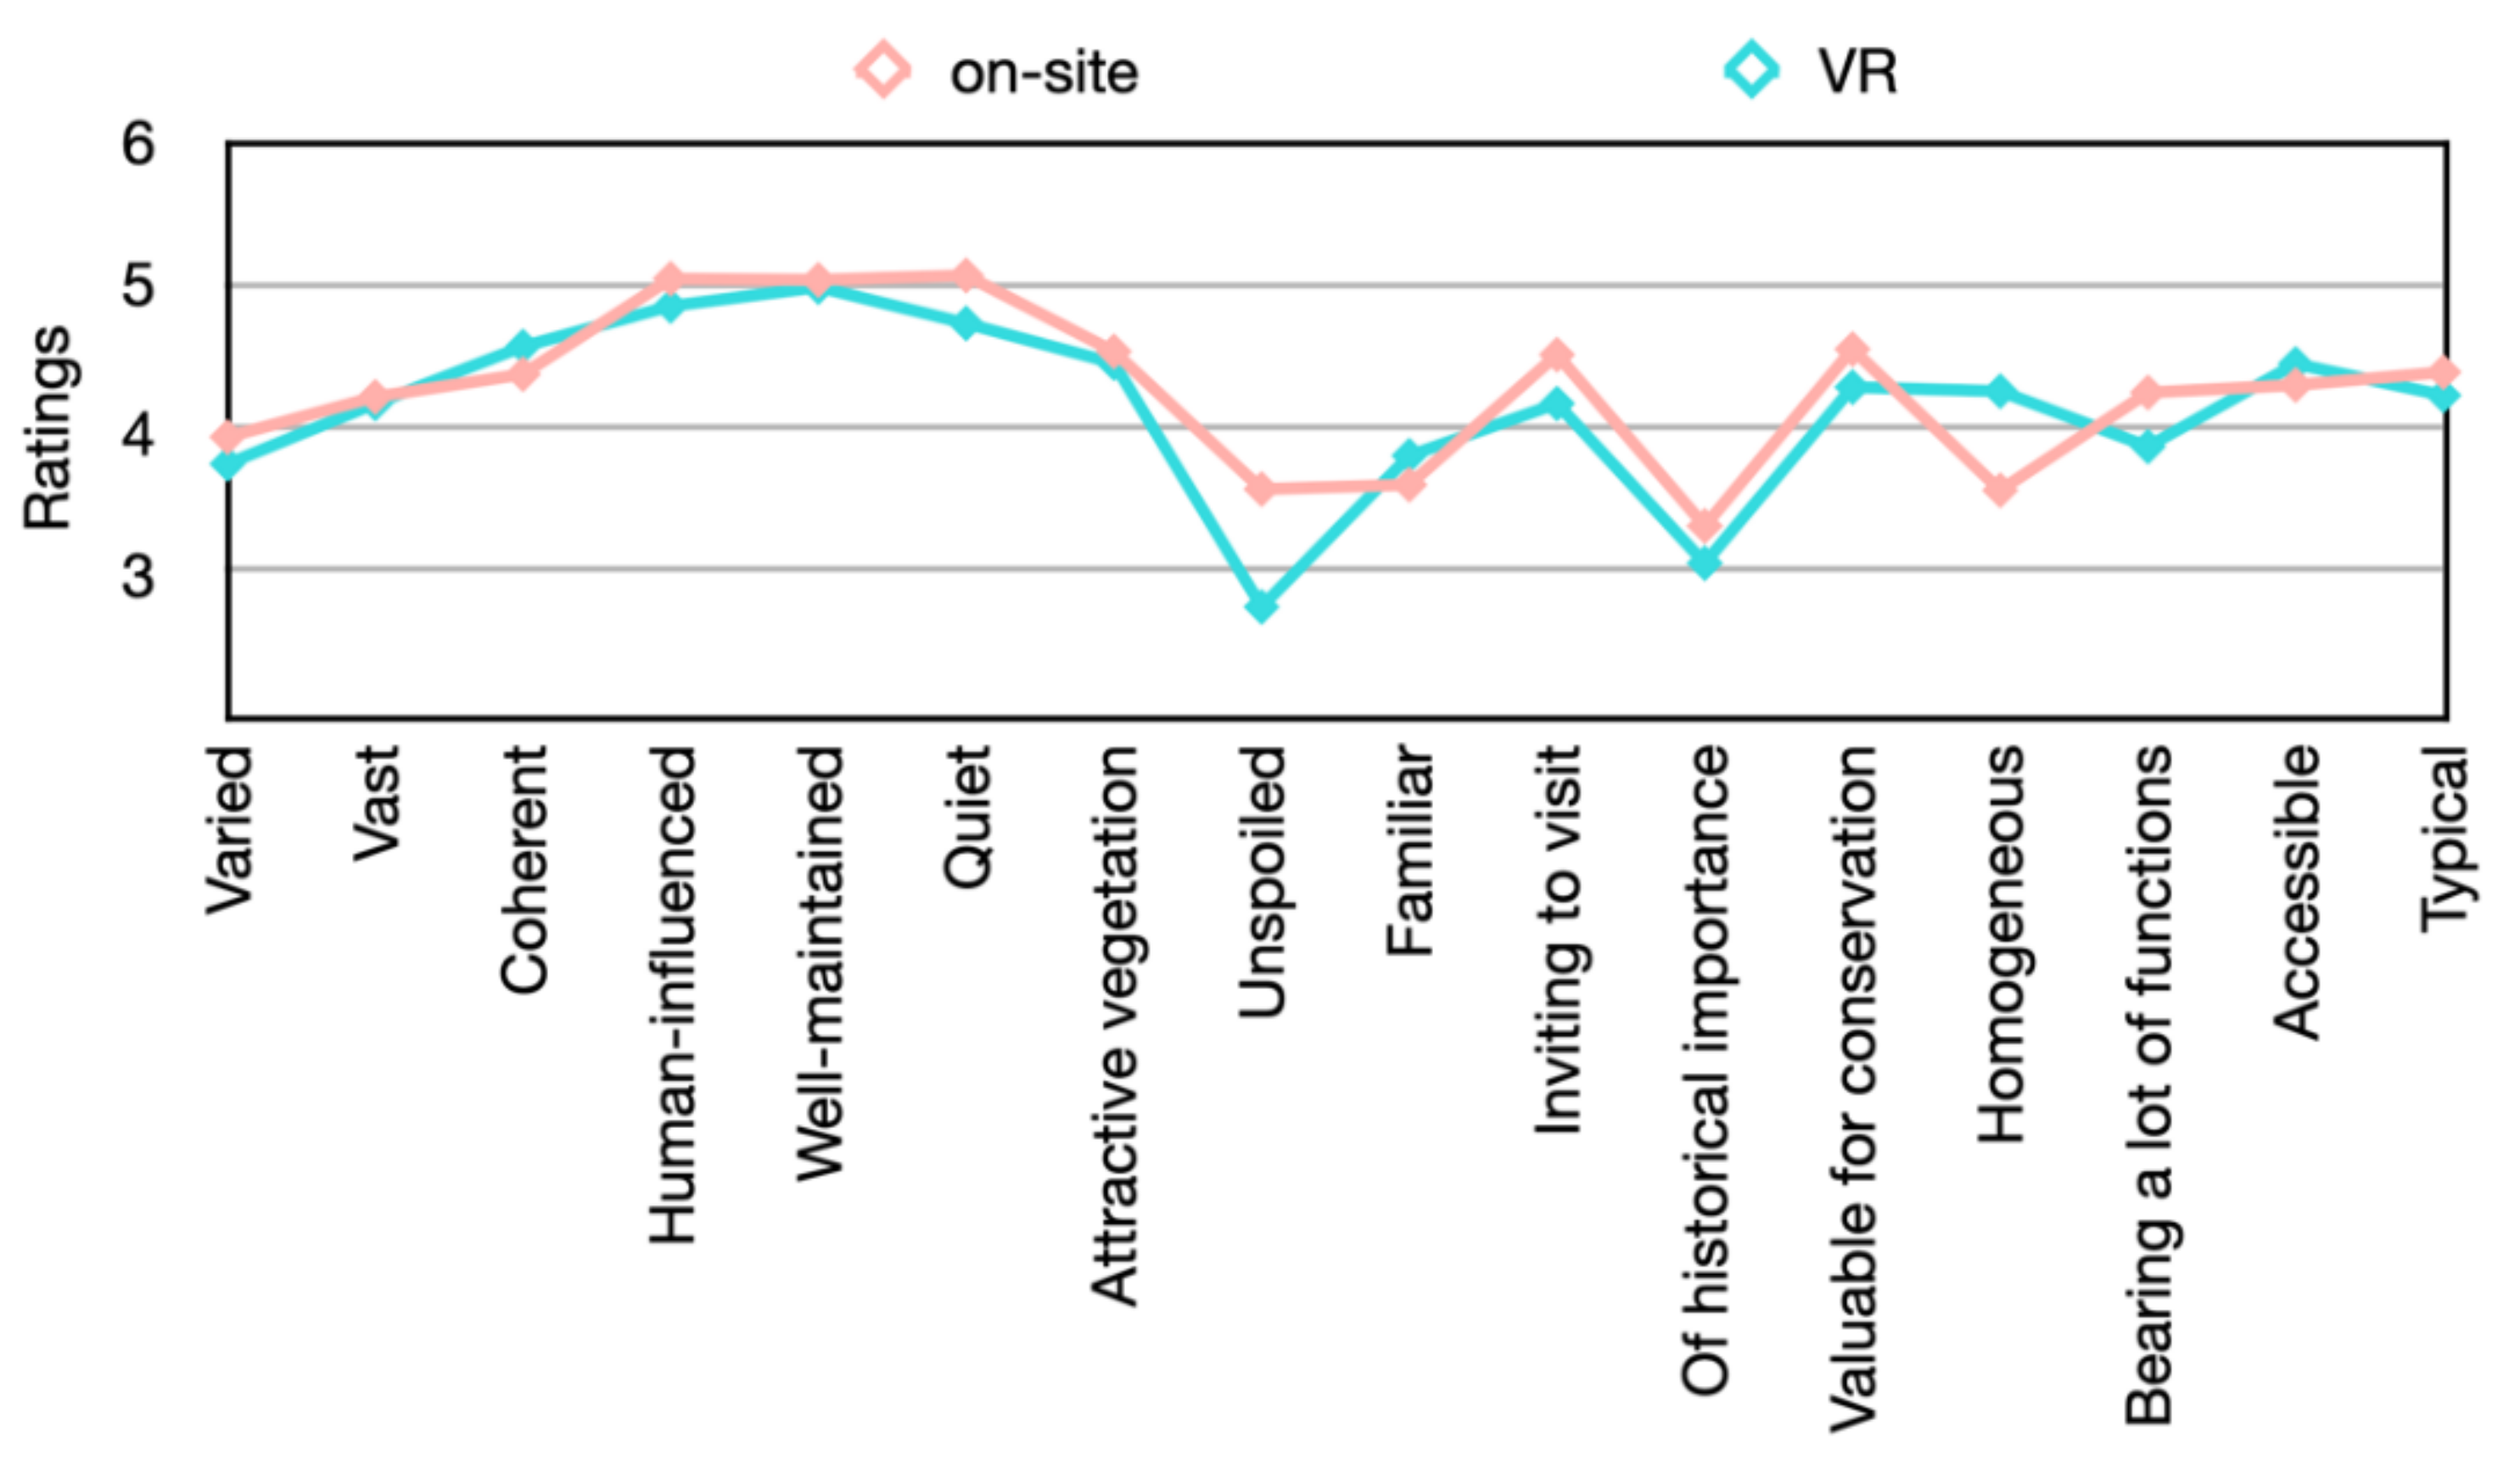
Figure 4 shows the comparison of the overall cognitive rating variable means for the 11 vistas. Similar to the mean “beauty” scores of all the vistas, the trend of both stimuli was similar. The population mean of the difference between paired data was calculated by paired samples t-test. As Table 4 shows, the mean variables of the cognitive items, except “unspoiled” and “homogeneous,” showed no difference between the two stimuli.
The “unspoiled” rating of on-site stimuli (M = 3.7, SD = 0.9) was significantly larger than that of VR stimuli (M = 3.1, SD = 0.8), t (10) = 6.315, p < 0.05, d = 1.904. Meanwhile, the “homogeneous” rating of the on-site stimuli (M = 3.7, SD = 0.4) was significantly less than that of VR stimuli (M = 4.2, SD = 0.5, t (10) = −3.55, p < 0.05, d = −1.07). The results indicated that respondents felt that the landscape stimulated on-site was more unspoiled and diverse than that stimulated by VR.
We used violin plots with box plots to show the entire distribution of the cognitive ratings for “unspoiled” and “homogeneous” (see Figure 5). The box plot elements show the median “unspoiled” cognition for on-site stimuli is higher than that for VR. The shape of the distribution indicates “unspoiled” ratings of VR are concentrated around the median, while “unspoiled” ratings of on-site have two peaks. Although the median “homogeneous” cognition for both stimuli are the same, the data distribution of both shows multiple peaks, which indicates the respondents may have several patterns of views on “homogeneous.”

3.3.2. Agreement of Cognitive Ratings of Individuals per Vista

An independent samples t-test was used to measure the difference caused by the stimulus per vista. As Table 5 shows, the cognitive ratings of “human-influenced,” “attractive vegetation,” “valuable for conservation,” “accessible,” and “typical” had no difference between the two stimuli in all the vistas. The differences between the two stimuli for the ratings of “varied,” “vast,” “coherent,” “well-maintained,” “unspoiled,” “familiar,” “inviting to visit,” “of historical importance,” and “bearing a lot of functions” were also very small and consistent in most vistas. The cognitive variables with the greatest divergence were “quiet and silent” and “homogeneous”; both significantly different in nearly half of the vistas (n = 5). In summary, the levels of agreement were high (≥80%) for 75.0% of the cognitive items and moderate (≥60% and <80%) for 12.5% of the cognitive items. Cognitive items with low agreement (<60%) included the ratings of “quiet and silent” and “homogeneous.” Combining this with the results of Section 3.3.1, we can say that VR can be used to assess the cognition of “varied,” “vast,” “coherent,” “human-influenced,” “well-maintained,” “attractive vegetation,” “familiar,” “inviting to visit,” “of historical importance,” “valuable for conservation,” “bearing a lot of function,” “accessible,” and “typical” landscapes.
It is worth noting that the results in Section 3.3.1 did not show a significant difference for the population means of “quiet” ratings between the two stimuli. Meanwhile, the population means of “unspoiled” ratings significantly differed between the two stimuli; however, for individuals per vista, only that of vista 1 was significantly different. This indicated a potential ecological fallacy problem for “quiet” ratings that used aggregate data to conclude the individuals’ ratings. Yet, contrary to the cognition of “quiet,” the cognition of “unspoiled” may be overgeneralized by the small sample size.
The number of significantly different cognitive variables per vista range between one and six (M = 3.5). The two stimuli showed excellent agreement on vista 3 (community park), vista 5 (center plaza), vista 9 (shrine), vista 10 (mountain path), and vista 11 (mountain bird view), with only one cognitive attribute being different. There were two vistas, vista 6 (station square) and vista 7 (center park), where the number of cognitive variables with a significant difference was more than 25.0% of the total (N > 4). Vista 6 and vista 7 represented a hard urbanization landscape and a soft parkland landscape, respectively. Compared with other vistas, they did not have special landscape elements to infer that the representational ability of VR failed for a specific landscape feature type. In summary, the levels of agreement were high (≥80%) for 72.7% of the vistas and moderate (≥60% and <80%) for the rest of the vistas, indicating that the representation validity of VR would not change much for different landscape types.

4. Discussion

4.1. Overview of Findings

In this study, the on-site survey is considered the gold-standard method. It is expected that observations made by VR stimuli will replace the gold-standard method because VR will be faster, cheaper, and more effective [41]. Before explaining the results, we must mention some limitations of our research. Opportunity samples, i.e., landscapes and respondents, were used in the study. The observation points were chosen based on a pre-survey in order to cover a diversity of landscape types. We also worked with students majoring in landscape as respondents, and the two stimuli types correspond to two independent respondent groups. Due to the limited materials of the on-site survey, the assignment to groups was not random, and the gender and the residence of respondents did not accord with the natural distribution. The use of opportunity samples may affect the validity of representation. However, the calculation of reliability within the group of respondents has produced satisfactory results. Therefore, some possible changes caused by the respondents’ background are excluded, enabling us to concentrate on the induced validity of stimulus and landscape types.
From intuitive descriptive statistics, the total mean “beauty” score of the on-site stimulation was slightly higher than that in the VR environment. However, the differences in aesthetic preferences for the VR observation were smaller than those of the on-site observation, indicating that people may have a more uniform aesthetic preference under VR stimulus.
We calculated the difference between the population mean variables of all vistas and found that “beauty” scores and most cognitive items showed no difference between the two stimuli in general. For the specific landscapes, the “beauty” scores of 72.7% of the vistas observed through VR were in concordance with those observed on-site. The percent agreement of the cognitive items was high for 75.0% and moderate for 12.5%. Additionally, the representation validity of VR will not change much for different landscape types. The above conclusions verify that immersive VR is a reliable tool to replace on-site investigations for landscape perception assessment.
Meanwhile, we found the ratings of “homogeneous” significantly differed between the two stimuli in both the population means for all vistas and individual ratings per vista, indicating that the validity of VR for representing “homogeneous” is doubtful. People may find the landscape more homogeneous when observing it through VR.

4.2. Ecological Fallacy and Systematic Effect

Several previous studies used the Spearman correlation coefficient (or Pearson correlation coefficient) to evaluate the agreement between the two methods (e.g., [2,22,43,44]). The high correlation between the two sets of data was as expected. However, a high correlation does not mean a high level of agreement. For example, the study of Sevenant and Antrop [2] found that on-site observation always obtained higher ratings than photo observation, although the correlation between the pairs of stimuli was significant, which means that photo observation has a significant systematic effect. Therefore, it cannot be proved that the two stimuli are concordant by the Spearman correlation coefficient.
In addition to systematic effects, inappropriate inferences also come from the loss or concealment of detailed information caused by aggregated data, which is called an ecological fallacy [45]. An ecological fallacy is not a statistical fallacy, which refers to a confusion between group average and total average. Statistically, when a correlation is evaluated at the group level, it tends to be greater than when it is evaluated at the individual level [46]. Palmer and Hoffman [22] indicated that there is an ecological fallacy in numerous research works on photo-based landscape preference; therefore, we should not only analyze the representation validity of VR in all landscape types but also measure whether it changes for different landscape types.
The paired t-test for all vistas suggested the population mean ratings of “unspoiled” were significantly different, which, however, differed in only one of the 12 vistas for individuals’ ratings per vista. On the contrary, the ratings of “quiet and silent” of individuals differed between the two stimuli in five vistas, although this difference was not reflected in the comparison of the average scores. We tried to explore the reasons for this result.
Spearman correlation coefficients were used to detect the mean variables of “unspoiled” for all vistas, r = 0.94, p < 0.000. We investigated whether a line of equality, represented by the 45-degree line passing through the origin in Figure 6, was conformed to by the paired data, which would indicate the sameness of the two scales. The rating scores of the two stimuli for “unspoiled” are highly correlated; however, there is no agreement between the data pairs, which means that there is an obvious systematic effect (bias) for the observer’s perception of the “unspoiled” landscape, i.e., the observer under VR stimulation always gives a lower “unspoiled” score than that give under on-site stimulation (Figure 6).
The cognitive rating of “quiet” is another situation with a poor correlation (r = 0.61); however, evidence of a systematic effect (bias) is lacking and, on average, there is agreement between the two stimuli methods. This indicates that cognition of “quiet and silent” through VR stimuli will change with the type of landscape. Therefore, it would be an ecological fallacy if we were to draw inferences about the cognition of “quiet” for each vista that were deduced from inferences about all vistas. Vistas 1, 2, 8, 9, and 10, which are lake park, agricultural land, historical site, shrine, and mountain path, respectively, differ in the cognition of “quiet” between the VR and on-site stimuli. These landscapes are usually considered quiet environments but get lower quiet ratings through VR than on-site. Instead, for some noisy environments, such as vista 5 (center plaza) and vista 6 (station square), VR and on-site measurement reached highly unanimous results. This suggests that the perceptions of quietness among independent respondents are considerably different in some landscapes, especially the quiet landscape. This is most likely due to the sound recorded by the camera, which cannot effectively represent the sound of the actual scene, because the wind, close footsteps, or meaningless noises are amplified by the headset. Thus, although statistical analysis for all of the vistas supports immersive VR as a reliable tool to replace on-site investigations, this result should be applied with caution, because the general landscape is not represented by each panorama but rather only specific views at specific sites, which is in line with that mentioned in previous research [2,22,47,48].

4.3. Comparing with the Validity of Using Photographs

Because the “descriptive terms” used in this study were almost the same as those used in Sevenant and Antrop’s study [2], it is possible to compare our results to the representation validity they found between on-site, normal photos, and panoramic photos. Table 6 shows the Spearman correlations of the population mean ratings between pairs of stimuli.
As we expected, the correlations of VR and on-site (M = 0.77) are equal to or higher than the two photo stimuli (M = 0.75 for panorama, M = 0.67 for normal photo) in aesthetic preference and most cognitive attributes. Previous studies have obtained the correlation coefficients between photos and on-site landscape: the average of 0.8, the minimum of 0.7 and the preferred of 0.9 [22,49]. There were seven cognitive attributes that reached the preferred correlation coefficient in the VR group (from high to low, these were “vast,” “valuable for conservation,” “human-influenced,” “unspoiled,” “accessible,” “beauty,” and “inviting to visit”), four in the panorama group (“unspoiled,” “coherent,” “vast,” and “inviting to visit”), and only one in the normal photo group (“vast”).
However, there are also some items that caught our attention. We found that VR is not as effective in the recognition of “quiet” as normal photos or panoramic photos. The reason was discussed in Section 4.2, i.e., the distortion of the soundscape of the VR environment. In addition to “quiet”, the correlation of “coherent” is also lower than that of the two photographic stimuli, which is counterintuitive. VR provides a borderless visual environment; thus, we supposed respondents could observe the continuity of the landscape better. The low correlations of “coherent” may be because we did not limit the perspective of observation, and all vistas were scored based on the intuitions of the respondents on the holistic landscape. The results in Table 5 show that vistas 2 and 4 had the largest difference. The representation validity of “coherent” for other vistas is good. Vista 2 was shot in a paddy filed surrounded by bushland and road for “coherent” rating, M = 3.8 on-site, M = 4.9 on VR; vista 4 was taken in a children’s playground surrounded by high-rise group apartments, for “coherent” rating, M = 3.1 on site, M = 3.7 on VR. VR received a higher average “coherent” rating in both vistas. It shows that observers may notice the borders of landscape patterns more easily in the field than in VR. In any case, previous measurements in this study show that VR can effectively represent the “coherent” cognition of landscapes.
Sevenant and Antrop [2] also focused on the ecological fallacy and excluded it by performing Repeated Measures ANOVA. They finally found that the validity of “vast,” “varied,” “familiar,” and “of historical importance” were very low for both panoramic and normal photos. Our findings indicate that the four cognitions do not differ between VR and on-site in most vistas. Especially for the “vast” variable, the validity of VR is obvious due to its ability to capture vastness that goes far beyond static photos.

5. Conclusions

The role of VR technology in cognitive research, such as spatial assessment, has attracted increasing attention. However, it is not only the knowledge of the environment, but also the perceptual participation of the public to promote ecologically conscious behavior. Little is known about the agreement of on-site observation and VR stimulus in terms of public perception. This study measured the feasibility, regarding preference and cognition, of using VR to assess landscapes. In summary, our results support that immersive VR is a reliable tool that can be used in place of on-site observation for cognitive assessment of landscapes. However, this result should be applied with caution, especially for the cognition of “homogeneous,” “quiet,” and “unspoiled.” People may find the landscape more homogeneous and spoiled when observing it through VR. Additionally, people may not accurately determine how noisy the scene is because the on-site sound is not accurately reproduced.
These results are important, because VR technology is rapidly developing. VR has made the relationship between human behavior and its impact on the environment less abstract. We are likely to witness a revolution in human interaction with VR technology and the environment within the next decade. VR provides the advantage of reducing costs and contributes to the sustainability of practices such as quality monitoring and landscape assessment. In addition, our results also support the validity of studies that analyze spatial cognition through immersive VR, providing more potential for fields such as environmental psychology, landscape therapy, open space development and public participant.
Further research needs to find more empirical evidence to evaluate generalizability. Landscape preference is directly related to human nature as a multi-sensory creature. Although assessment may mainly be based on the visual aspects of the environment, other aspects (such as touch, sound and smell) also contribute to landscape perception. Hence, in addition to capturing the visual characteristics of the landscape, more attention should be paid to the other aspects of environment when using VR.

Author Contributions

Conceptualization, K.F.; Data curation, J.S. and K.F.; Funding acquisition, K.Z. and K.F.; Methodology, J.S., T.H. and K.Z.; Software, J.S. and K.Z.; Supervision, T.H.; Visualization, J.S.; Writing – original draft, J.S.; Writing – review & editing, T.H., K.Z. and K.F. All authors have read and agreed to the published version of the manuscript.

Funding

This research is supported by the Shanghai Philosophy and Social Science Planning Project (2019BGL017). Besides, the first author gratefully acknowledges financial support from the China Scholarship Council.

Acknowledgments

The authors thank all interviewees for providing valuable feedback to questionnaires, and the experts for their suggestions on this paper.

Conflicts of Interest

The authors declare no conflict of interest.

Appendix A

Figure A1. Panoramic photos of 11 vistas.
Sustainability 12 02875 g0a1

References

  1. Buhyoff, G.J.; Miller, P.A.; Roach, J.W.; Zhou, D.; Fuller, L.G. An AI methodology for landscape visual assessments. AI Appl. 1994, 8, 1–13. [Google Scholar]
  2. Sevenant, M.; Antrop, M. Landscape Representation Validity: A Comparison between On-site Observations and Photographs with Different Angles of View. Landsc. Res. 2011, 36, 363–385. [Google Scholar] [CrossRef]
  3. Hetherington, J.; Daniel, T.C.; Brown, T.C. Is motion more important than it sounds: The medium of presentation in environment perception research. J. Environ. Psychol. 1993, 13, 283–291. [Google Scholar] [CrossRef]
  4. Zube, E.H.; Pitt, D.G.; Anderson, T.W. Perception and measurement of scenic resources in the Southern Connecticut River Valley. Landsc. Res. 1974, 1, 10–11. [Google Scholar] [CrossRef]
  5. Trent, R.B.; Neumann, E.; Kvashny, A. Presentation mode and question format artifacts in visual assessment research. Landsc. Urban Plan. 1987, 14, 225–235. [Google Scholar] [CrossRef]
  6. Kaplan, S. The restorative benefits of nature: Toward an integrative framework. J. Environ. Psychol. 1995, 15, 169–182. [Google Scholar] [CrossRef]
  7. Saito, K.; Furuya, K.; Subashiri, S. A Study on Landscape Evaluation by Video Image. Jpn. Inst. Landsc. Archit. 1985, 49, 179–184. [Google Scholar] [CrossRef]
  8. Daniel, T.C.; Meitner, M.M. Representational Validity of Landscape Visualizations: The Effects of Graphical Realism on Perceived Scenic Beauty of Forest Vistas. J. Environ. Psychol. 2001, 21, 61–72. [Google Scholar] [CrossRef] [Green Version]
  9. Bishop, I.D.; Wherrett, J.R.; Miller, D.R. Assessment of path choices on a country walk using a virtual environment. Landsc. Urban Plan. 2001, 52, 225–237. [Google Scholar] [CrossRef]
  10. Lange, E. The limits of realism: Perceptions of virtual landscapes. Landsc. Urban Plan. 2001, 54, 163–182. [Google Scholar] [CrossRef]
  11. Orland, B.; Budthimedhee, K.; Uusitalo, J. Considering virtual worlds as representations of landscape realities and as tools for landscape planning. Landsc. Urban Plan. 2001, 54, 139–148. [Google Scholar] [CrossRef]
  12. Riva, G.; Mantovani, F.; Capideville, C.S.; Preziosa, A.; Morganti, F.; Villani, D.; Gaggioli, A.; Botella, C.; Alcañiz, M. Affective Interactions Using Virtual Reality: The Link between Presence and Emotions. Cyberpsychol. Behav. 2007, 10, 45–56. [Google Scholar] [CrossRef] [PubMed]
  13. Wilson, C.J.; Soranzo, A. The Use of Virtual Reality in Psychology: A Case Study in Visual Perception. Comput. Math. Methods Med. 2015, 2015, 151702. [Google Scholar] [CrossRef] [PubMed] [Green Version]
  14. Cruz-Neira, C.; Sandin, D.J.; DeFanti, T.A. Surround-Screen Projection-Based Virtual Reality: The Design and Implementation of the CAVE. In Proceedings of the 20th Annual Conference on Computer Graphics and Interactive Techniques; Association for Computing Machinery: New York, NY, USA, 1993; pp. 135–142. [Google Scholar]
  15. Baran, P.K.; Tabrizian, P.; Zhai, Y.; Smith, J.W.; Floyd, M.F. An exploratory study of perceived safety in a neighborhood park using T immersive virtual environments. Urban For. Urban Green. 2018, 35, 72–81. [Google Scholar] [CrossRef]
  16. Yu, C.-P.; Lee, H.-Y.; Luo, X.-Y. The effect of virtual reality forest and urban environments on physiological and psychological responses. Urban For. Urban Green. 2018, 35, 106–114. [Google Scholar] [CrossRef]
  17. Wang, X.; Shi, Y.; Zhang, B.; Chiang, Y. The Influence of Forest Resting Environments on Stress Using Virtual Reality. Int. J. Environ. Res. Public. Health 2019, 16, 3263. [Google Scholar] [CrossRef] [Green Version]
  18. Vercelloni, J.; Clifford, S.; Caley, M.J.; Pearse, A.R.; Brown, R.; James, A.; Christensen, B.; Bednarz, T.; Anthony, K.; González-Rivero, M.; et al. Using virtual reality to estimate aesthetic values of coral reefs. R. Soc. Open Sci. 2018, 5, 172226. [Google Scholar] [CrossRef] [Green Version]
  19. Ruotolo, F.; Maffei, L.; Di Gabriele, M.; Iachini, T.; Masullo, M.; Ruggiero, G.; Senese, V.P. Immersive virtual reality and environmental noise assessment: An innovative audio–visual approach. Environ. Impact Assess. Rev. 2013, 41, 10–20. [Google Scholar] [CrossRef]
  20. Iachini, T.; Maffei, L.; Ruotolo, F.; Senese, V.P.; Ruggiero, G.; Masullo, M.; Alekseeva, N. Multisensory Assessment of Acoustic Comfort Aboard Metros: A Virtual Reality Study. Appl. Cogn. Psychol. 2012, 26, 757–767. [Google Scholar] [CrossRef]
  21. Ruotolo, F.; Senese, V.P.; Ruggiero, G.; Maffei, L.; Masullo, M.; Iachini, T. Individual reactions to a multisensory immersive virtual environment: The impact of a wind farm on individuals. Cogn. Process. 2012, 13, 319–323. [Google Scholar] [CrossRef]
  22. Palmer, J.F.; Hoffman, R.E. Rating reliability and representation validity in scenic landscape assessments. Landsc. Urban Plan. 2001, 54, 149–161. [Google Scholar] [CrossRef]
  23. Parsons, T.D. Ecological Validity in Virtual Reality- Based Neuropsychological Assessment. In Encyclopedia of Information Science and Technology; IGI Global: Hershey, PA, USA, 2015; pp. 1006–1015. ISBN 978-1-4666-5888-2. [Google Scholar]
  24. Parsons, T.D. Virtual Reality for Enhanced Ecological Validity and Experimental Control in the Clinical, Affective and Social Neurosciences. Front. Hum. Neurosci. 2015, 9, 660. [Google Scholar] [CrossRef] [PubMed] [Green Version]
  25. Sanchez-Vives, M.V.; Slater, M. From presence to consciousness through virtual reality. Nat. Rev. Neurosci. 2005, 6, 332–339. [Google Scholar] [CrossRef] [PubMed]
  26. Risko, E.F.; Laidlaw, K.; Freeth, M.; Foulsham, T.; Kingstone, A. Social attention with real versus reel stimuli: Toward an empirical approach to concerns about ecological validity. Front. Hum. Neurosci. 2012, 6, 143. [Google Scholar] [CrossRef] [Green Version]
  27. Lim, E.-M.; Honjo, T.; Umeki, K. The validity of VRML images as a stimulus for landscape assessment. Landsc. Urban Plan. 2006, 77, 80–93. [Google Scholar] [CrossRef]
  28. Usoh, M.; Catena, E.; Arman, S.; Slater, M. Using Presence Questionnaires in Reality. Presence Teleoperators Virtual Environ. 2000, 9, 497–503. [Google Scholar] [CrossRef]
  29. Ramirez, E.J. Ecological and ethical issues in virtual reality research: A call for increased scrutiny. Philos. Psychol. 2019, 32, 211–233. [Google Scholar] [CrossRef]
  30. Cosgrove, D.E. The Idea of Landscape. In Social Formation and Symbolic Landscape; Originally Croom Helm Historical Geography; University of Wisconsin Press: Madison, WI, USA, 1998; pp. 13–38. ISBN 978-0-299-15514-8. [Google Scholar]
  31. Sevenant, M.; Antrop, M. Cognitive attributes and aesthetic preferences in assessment and differentiation of landscapes. J. Environ. Manag. 2009, 90, 2889–2899. [Google Scholar] [CrossRef]
  32. Filova, L.; Vojar, J.; Svobodova, K.; Sklenicka, P. The effect of landscape type and landscape elements on public visual preferences: Ways to use knowledge in the context of landscape planning. J. Environ. Plan. Manag. 2015, 58, 2037–2055. [Google Scholar] [CrossRef]
  33. Tveit, M.; Ode, Å.; Fry, G. Key concepts in a framework for analysing visual landscape character. Landsc. Res. 2006, 31, 229–255. [Google Scholar] [CrossRef]
  34. Penning-Rowsell, E.C. A public preference evaluation of landscape quality. Reg. Stud. 1982, 16, 97–112. [Google Scholar] [CrossRef]
  35. Coeterier, J.F. Dominant Attributes in the Perception and Evaluation of the Dutch Landscape. Landsc. Urban Plan. 1996, 34, 27–44. [Google Scholar] [CrossRef]
  36. Sevenant, M.; Antrop, M. Settlement models, land use and visibility in rural landscapes: Two case studies in Greece. Landsc. Urban Plan. 2007, 80, 362–374. [Google Scholar] [CrossRef]
  37. Van der Jagt, A.P.N.; Craig, T.; Anable, J.; Brewer, M.J.; Pearson, D.G. Unearthing the picturesque: The validity of the preference matrix as a measure of landscape aesthetics. Landsc. Urban Plan. 2014, 124, 1–13. [Google Scholar] [CrossRef]
  38. Lyon, E. Demographic Correlates of Landscape Preference. Environ. Behav. 1983, 15, 487–511. [Google Scholar] [CrossRef]
  39. Strumse, E. Demographic Differences in the Visual Preferences for Agrarian Landscapes in Western Norway. J. Environ. Psychol. 1996, 16, 17–31. [Google Scholar] [CrossRef]
  40. Svobodova, K.; Sklenicka, P.; Molnarova, K.; Salek, M. Visual preferences for physical attributes of mining and post-mining landscapes with respect to the sociodemographic characteristics of respondents. Ecol. Eng. 2012, 43, 34–44. [Google Scholar] [CrossRef]
  41. Watson, P.F.; Petrie, A. Method agreement analysis: A review of correct methodology. Theriogenology 2010, 73, 1167–1179. [Google Scholar] [CrossRef] [Green Version]
  42. Cohen, J. The Effect Size Index: D. In Statistical Power Analysis for the Behavioral Sciences; Lawrence Erlbaum Associates: Mahwah, NJ, USA, 1988; pp. 20–26. ISBN 0-8058-0283-5. [Google Scholar]
  43. Roth, M. Validating the use of Internet survey techniques in visual landscape assessment—An empirical study from Germany. Landsc. Urban Plan. 2006, 78, 179–192. [Google Scholar] [CrossRef]
  44. Meitner, M.J. Scenic beauty of river views in the Grand Canyon: Relating perceptual judgments to locations. Landsc. Urban Plan. 2004, 68, 3–13. [Google Scholar] [CrossRef]
  45. Robinson, W.S. Ecological Correlations and the Behavior of Individuals. Am. Sociol. Rev. 1950, 15, 351–357. [Google Scholar] [CrossRef]
  46. John, J. Hsieh Ecological fallacy. Available online: https://www.britannica.com/science/ecological-fallacy (accessed on 31 January 2020).
  47. Stewart, T.R.; Middleton, P.; Downton, M.; Ely, D. Judgments of photographs vs. field observations in studies of perception and judgment of the visual environment. J. Environ. Psychol. 1984, 4, 283–302. [Google Scholar] [CrossRef]
  48. Bergen, S.D.; Ulbricht, C.A.; Fridley, J.L.; Ganter, M.A. The validity of computer-generated graphic images of forest landscape. J. Environ. Psychol. 1995, 15, 135–146. [Google Scholar] [CrossRef]
  49. Nunnally, J.C. Psychometric Theory, 2nd ed.; McGraw-Hill: New York, NY, USA, 1978; ISBN 978-0-07-047465-9. [Google Scholar]
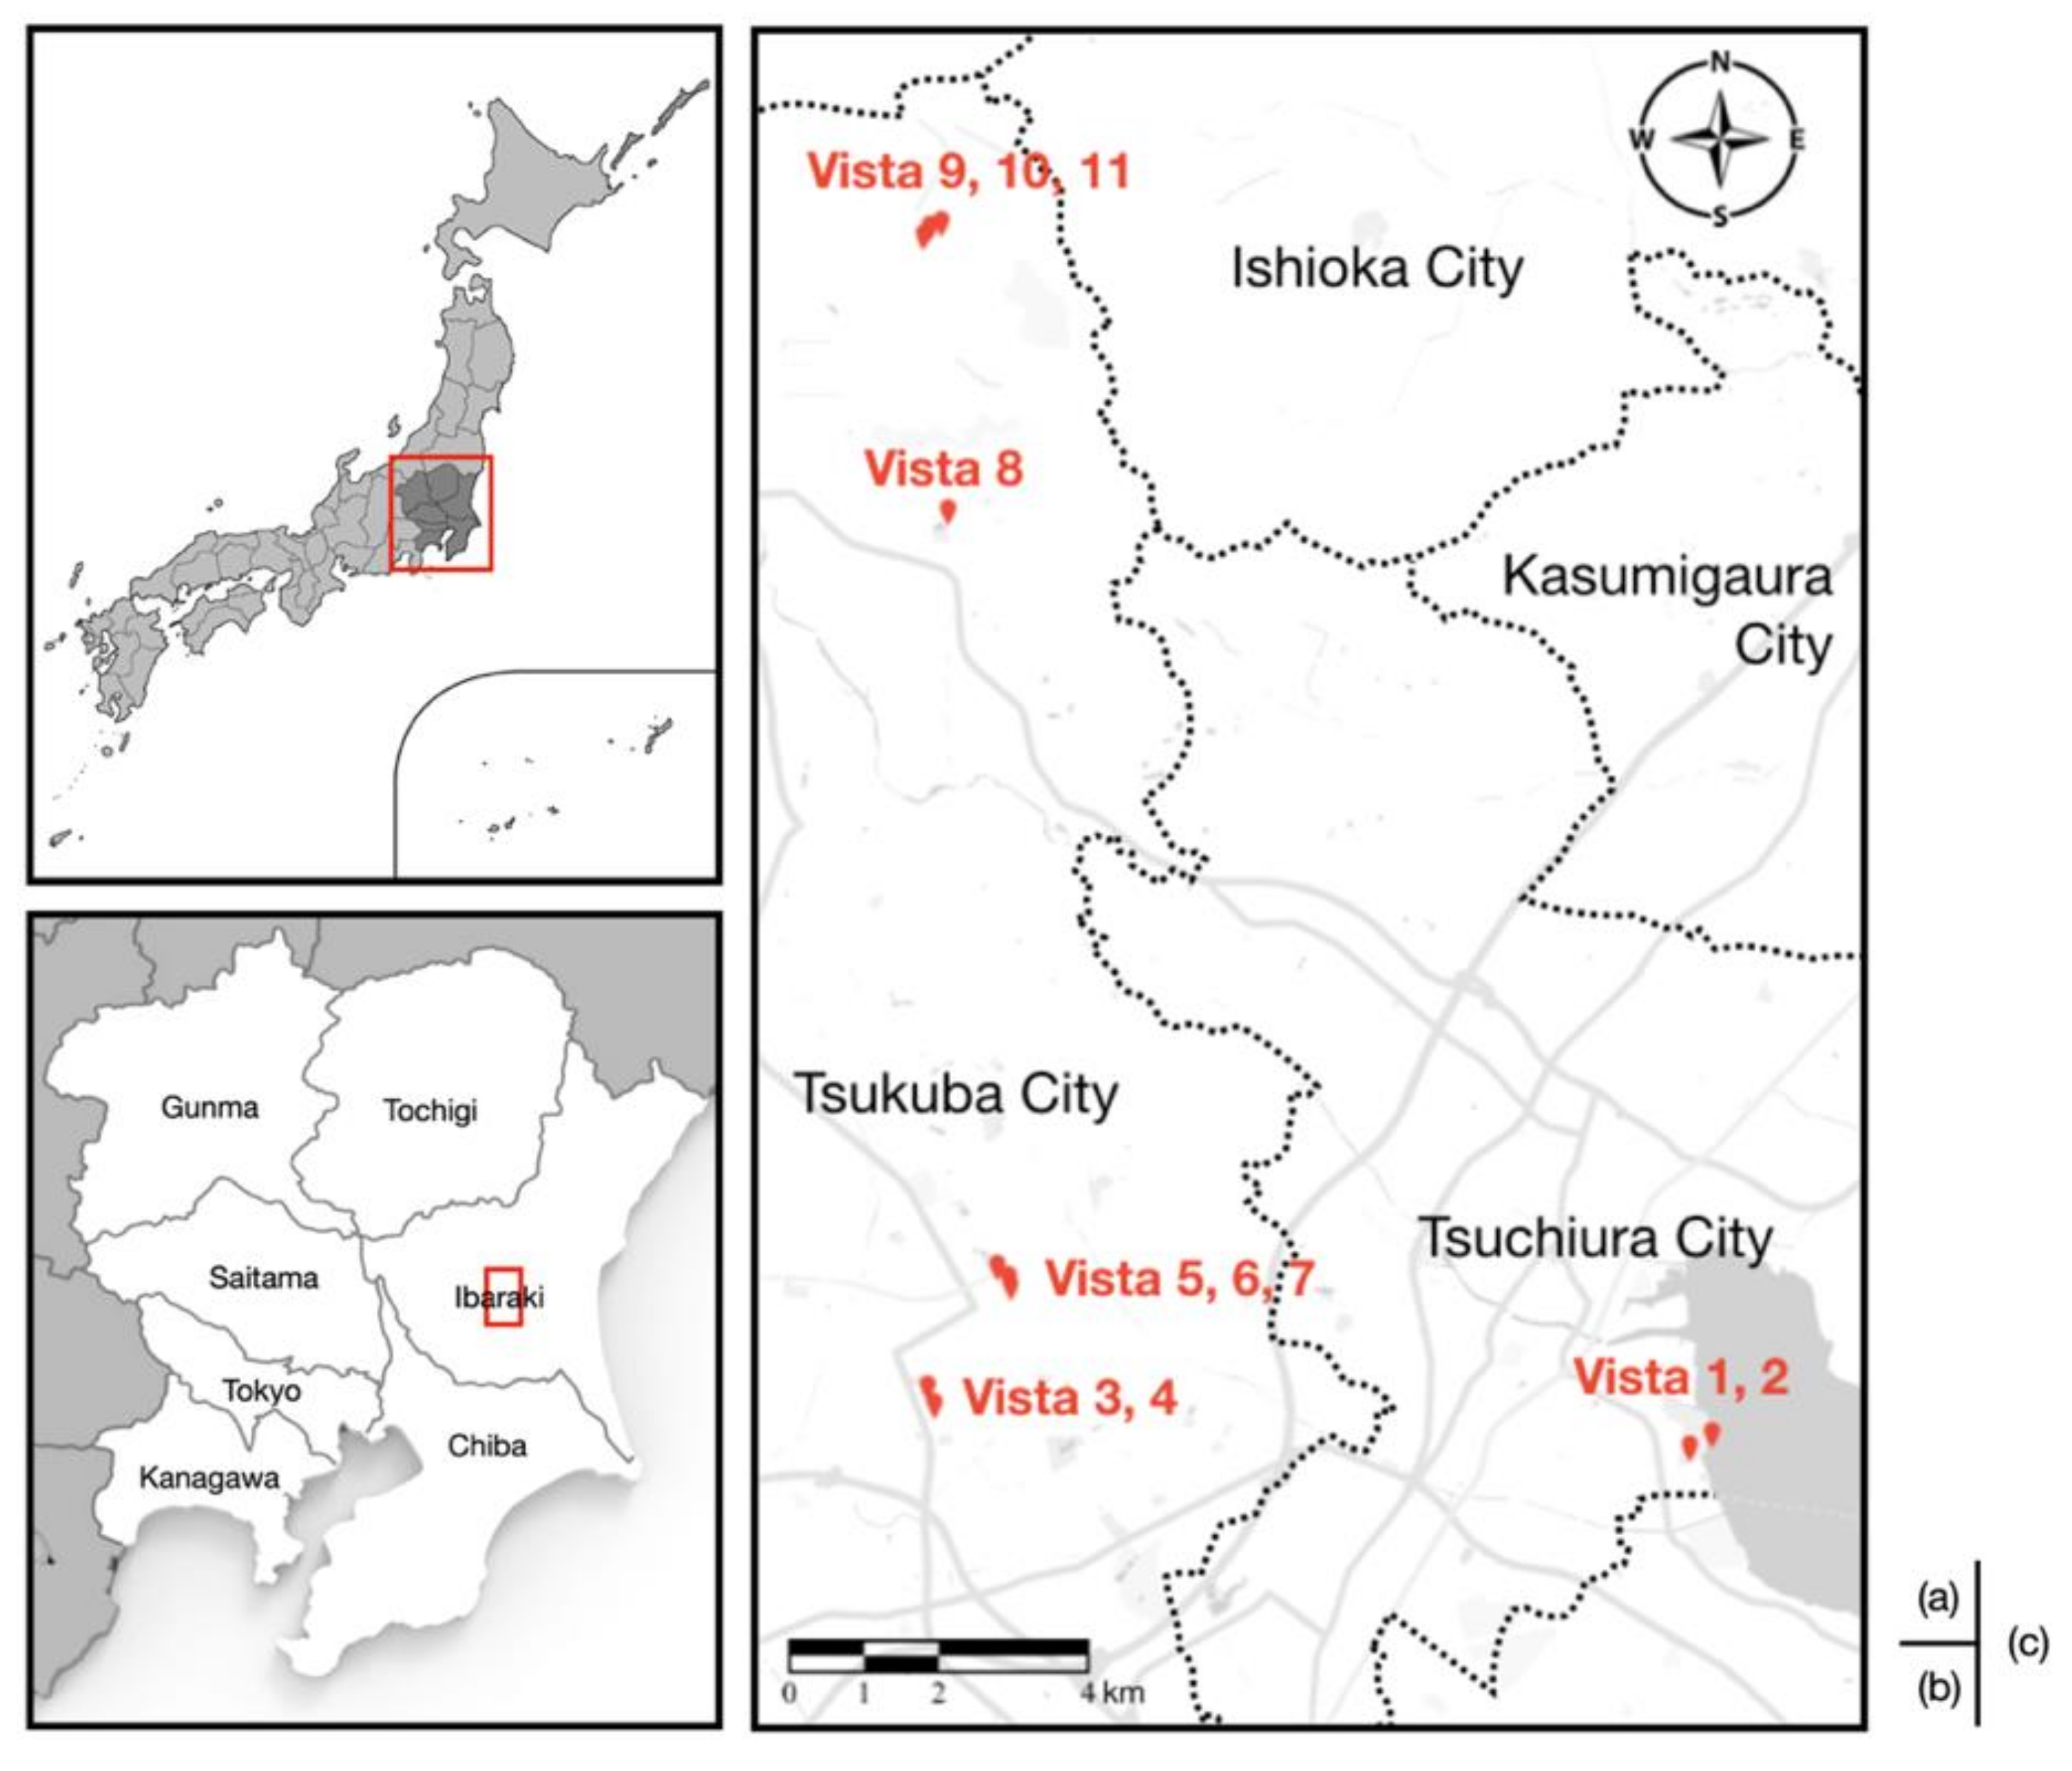
Figure 1. The location of study area. (a) Location of Kanto area in Japan; (b) Location of study area in Ibaraki, Kanto area; (c) Location of 11 vistas of the on-site survey in Tsuchiura City and Tsukuba City.
Sustainability 12 02875 g001
Figure 2. Comparison of two stimuli using two kinds of dataset.
Sustainability 12 02875 g002
Figure 3. Means “beauty” score per vista.
Sustainability 12 02875 g003
Figure 4. Overall cognitive rating variable means for the 11 vistas.
Sustainability 12 02875 g004
Figure 5. Distribution of cognitive ratings for two stimuli. (a) Cognitive ratings of “unspoiled”; (b) Cognitive ratings of “homogeneous”.
Sustainability 12 02875 g005
Figure 6. Diagram showing the association of cognitive ratings between the results of on-site stimuli and those of VR stimuli. (a) Cognitive ratings of “unspoiled”; (b) Cognitive ratings of “quiet”.
Sustainability 12 02875 g006
Table 1. Landscape features of the 11 vistas.
No.DescriptionLandcoverHydrologyCultural Features
Vista 1Kasumigaura lake parkPark and watersLakeRecreation structures
Vista 2Tsuchiura farmlandFarm land and bushlandPaddyFarming
Vista 3Mastushiro community parkPark and structuresPondRecreation structures
Vista 4Matsushiro multi-unit apartmentsStructuresNoneMulti-storey and recreation structures
Vista 5Tsukuba center plazaStructuresChannelCommercial buildings and recreation structures
Vista 6Tsukuba station squareStructuresNoneInfrastructures and commercial buildings
Vista 7Tsukuba center parkPark, water and forestPondMonument
Vista 8Hirasawa-Kanga ruinsMeadow and structuresNoneAncient houses
Vista 9Tsukuba shrineStructures and forestNoneReligious structures
Vista 10Tsukuba mountain pathForestNoneNone
Vista 11Tsukuba mountain bird viewStructures and farmlandNoneInfrastructures and farming
Table 2. Descriptive statistics of “beauty” scores per vista.
On-Site VR
Mean SDMeanSD
Vista 18.31.47.81.3
Vista 25.81.86.11.2
Vista 36.42.27.01.4
Vista 44.91.75.41.4
Vista 56.21.86.61.2
Vista 66.41.65.21.5
Vista 77.91.57.11.4
Vista 88.91.87.91.7
Vista 98.31.47.41.2
Vista 106.62.27.71.5
Vista 118.60.97.81.3
Table 3. Independent samples t-test for “beauty” scores of individuals per vista.
Beauty Scoretp Cohen’s d
Vista 10.98 0.33 0.33
Vista 2−0.670.51 −0.22
Vista 3−1.040.31 −0.34
Vista 4−1.000.32 −0.33
Vista 5−0.880.39 −0.29
Vista 62.290.03*0.76
Vista 71.490.14 0.50
Vista 81.880.07 0.62
Vista 92.130.04*0.71
Vista 10−1.790.08 −0.59
Vista 112.330.03*0.77
Note. Student’s t-test. df = 35; * p < 0.05; The significant p-values are highlighted in bold.
Table 4. Paired samples t-test for cognitive item means of all vistas.
Itemtp Cohen’s d
Varied0.890.40 0.27
Vast0.360.73 0.11
Coherent−1.070.31 −0.32
Human-influenced1.890.09 0.57
Well-maintained0.330.75 0.10
Quiet and silent1.500.17 0.45
Attractive vegetation0.590.57 0.18
Unspoiled6.320.00***1.90
Familiar−0.970.36 −0.29
Inviting to visit1.550.15 0.47
Of historical importance0.990.34 0.30
Valuable for conservation1.710.12 0.52
Homogenous−3.550.01*−1.07
Bearing a lot of functions2.150.06 0.65
Accessible−1.300.23 −0.39
Typical0.730.49 0.22
Note. Student’s t-test. df = 35; * p < 0.05, ** p < 0.005, *** p < 0.000.
Table 5. Overview of the p-value of the independent samples T-Test for cognitive items per vista.
Vista1234567891011
Items
Varied0.360.830.200.310.130.030.010.88 a0.230.44 a0.28
Vast0.960.04a0.990.820.680.030.880.640.350.500.77
Coherent0.540.00a0.23 a0.040.840.820.660.750.710.33 a0.78
Human-influenced0.600.570.130.160.880.490.100.290.980.810.95
Well-maintained0.120.080.180.050.720.350.610.020.560.610.48
Quiet and silent0.000.00a0.600.960.68 a0.670.620.02a0.020.030.09
Attractive vegetation0.460.210.680.131.000.590.550.260.080.930.74
Unspoiled0.010.08 a0.150.270.770.190.380.530.150.200.07
Familiar0.020.340.860.320.44 a0.000.010.630.440.870.48
Inviting to visit0.820.990.710.040.460.000.060.050.050.520.47
Of historical importance0.26a0.210.420.220.150.030.010.22 a0.470.08 a0.39
Valuable for conservation0.830.63 a0.49 a0.450.400.05 a0.050.980.940.430.69
Homogenous0.860.010.000.010.740.000.000.95 a0.960.070.94
Bearing a lot of functions0.540.150.100.330.040.380.030.600.650.820.03a
Accessible0.940.820.900.06 a0.40 a0.170.590.700.810.850.76
Typical0.96 a0.210.480.060.250.500.31 a0.070.110.380.16
Note. Student’s t-test. df = 35; a If Levene’s test is significant (p < 0.05) while Shapiro–Wilk’s test is significant (p < 0.05), suggesting the data sets are not normally distributed with unequal variances, conduct a Mann–Whitney U test instead; The significant p-values are highlighted in bold.
Table 6. Spearman correlations of the population mean ratings between pairs of stimuli.
Rating VariablePair of Stimulus Types
On-Site & Panorama PhotoOn-Site & Normal PhotoOn-Site & VR
Beauty0.84 ***0.77 **0.87 ***
Varied0.550.410.63 *
Vast0.90 ***0.87 ***0.95 ***
Coherent0.91 ***0.63 *0.50
Well-maintained0.71 ***0.85 ***0.65 *
Quiet and silent0.71 **0.70 *0.58
Attractive vegetation0.72 **0.81 ***0.79 **
Unspoiled0.92 ***0.85 ***0.93 ***
Familiar0.62 *0.360.73 *
Inviting to visit0.87 ***0.69 *0.86 ***
Of historical importance0.59 *0.280.80 **
Valuable for conservation0.85 ***0.74 **0.95 ***
Bearing a lot of functions0.75 **0.570.76 **
Accessible0.560.63 *0.88 ***
Human-influenced0.77 **0.84 ***0.93 ***
Homogenous0.77 **0.72 **0.61 *
Note. * p < 0.05, ** p < 0.005, *** p < 0.000. Data of Spearman correlation coefficients between on-site, panoramic photos and normal photos are referenced from Sevenant and Antrop [2].