Article

Efficiency Gap Caused by the Input Data in Evaluating Energy Efficiency of Low-Income Households’ Energy Retrofit Program

1
Center for Built Environment, Sungkyunkwan University, Suwon 16419, Korea
2
R&D center, LG Hausys, 30 Magokjungang 10-ro, Gangseo-gu, Seoul 07796, Korea
3
Ecotope, Inc. 1917 1st Ave., Seattle, WA 98101, USA
4
School of Civil, Architectural Eng., and Landscape Architecture, Sungkyunkwan University, Suwon 16419, Korea
*
Author to whom correspondence should be addressed.
Sustainability 2020, 12(7), 2774; https://doi.org/10.3390/su12072774
Submission received: 3 March 2020 / Revised: 27 March 2020 / Accepted: 31 March 2020 / Published: 1 April 2020
(This article belongs to the Section Energy Sustainability)

Abstract

:
Energy efficiency policies are made to reduce the energy necessary to achieve a given level of indoor heating and to decrease the greenhouse gas emission worldwide. National and state regulators routinely tighten the energy efficiency building code appliance standards. In particular, for low-income households, the government has been implementing an energy efficiency program, and the most common measures include furnace replacement, attic and wall insulation, and infiltration reduction. The belief that the energy efficiency programs are beneficial and lead to energy reductions often fails, which is known as the ‘efficiency gap.’ This paper analyzed the effect of input data in calculating the energy savings of the energy efficiency program for low-income households as a cause of the energy efficiency gap in energy efficiency treatments for low-income households. According to the retrofit of the low-income household, the energy saving effect predicted through the input data of detailed measurement was 65%, which was higher than 41% of the conventional prediction method (walk-through audit). The resulting greenhouse gas (GHG) reduction effect was also the same as the energy savings, and the results predicted by the existing prediction methods were less predicted than the detailed measurement results.

1. Introduction

South Korea recorded the seventh largest CO2 emission and the ninth largest total final consumption of energy in the world as of 2015 [1]. The building sector accounted for 23% of the total final energy consumption [2]. The Korean government announced its goals, which is a 2030 mitigation target of a 37% reduction in greenhouse gas (GHG) emissions (315 million tons), compared to the business as usual (BAU) emission of 851 million tons at the Conference of the Parties (COP21) of the United Nations Framework Convention on Climate Change (UNFCCC) [3,4]. The building sector aims to reduce greenhouse gas by 132.7 million tons, which is 32.7% of building BAU (197.2 million tons), by 2030, since Korea’s building energy consumption is rapidly increasing and its impact on GHG emission is large compared to other sectors. The building sector’s greenhouse gas reduction is treated as the core issue in the accomplishment of a national GHG reduction plan. The Korean government is promoting the policies that minimize the GHG emission in the building sector. All new government or public buildings should be constructed as zero energy buildings by 2020, and other buildings from 2025 onward. Also, the energy performance improvement of existing buildings is implemented [5].
Most energy in the building sector is consumed by existing buildings, while the replacement rate of existing buildings by the new-build is only around 1.0–3.0% per annum [6]. Furthermore, over the whole building stock, the largest portion of carbon savings by 2030 is in retrofitting existing buildings and replacing energy using equipment due to the slow turnover of the stock [7]. The large immediate potential for energy savings lies in the current building stock for reasons that include the long lifespan of buildings [8]. Retrofit or refurbishment forms a key part of the mitigation strategy in countries with established building stocks [9,10].
In Korea, the residential building consumes more than 47% of the energy in the entire building sector [2]. According to Korea’s 2018 Population and Housing Census, Korea has 16.7 million households, of which 2.8 million older homes are more than 30 years old, accounting for 16.8% of the total. Low-income people especially are more likely to live in old buildings with poor envelope conditions [11]. Of the lowest income quartiles in Korea, 67.7% of the first income decile live in older homes built before 1995. The insulation and airtightness level of these homes are low levels, and low energy efficiency has significantly contributed to the recent growth of fuel poverty [12]. Most EU countries have adopted energy efficiency policies as a strategy to solve fuel poverty problems [13]. The Weatherization Assistance Program (WAP) of the United States Department of Energy (DOE) provides energy efficiency services to reduce energy bills for low-income households [14]. Furthermore, the Korean government formalized an Energy and Welfare Statement; the Energy Act was legislated in 2006, and the government has operated the residential energy efficiency (retrofit) program for low-income households. The aims of this program are to improve the thermal performance and airtightness of households in fuel poverty, as well as to reduce heat loss, lower energy bills, and improve the thermal comfort and health problems of residents [15]. This program involves the strengthening of insulation in walls and/or the replacement of old windows, doors, and boilers. A maximum of a 1.5 million Korean Won (KRW) (1500 USD) subsidy is supported for each low-income household. At the beginning of 2007, about 10 billion KRW (10 million USD) was supported and it increased to about 48.9 billion KRW (48.9 million USD) in 2016. About 435,000 households, or 363 billion KRW (363 million USD) was provided until 2016.
Recently, these energy saving issues have been linked to national greenhouse gas reduction goals. One of the first steps required to meet future GHG emission related targets is to ensure that a robust energy savings measurement and certification procedure is in place [16]. The EU approved the Energy Performance of Building Directive (EPBD) on 16 December, 2002 to strengthen control over the total energy consumption of buildings [17]. In order to reduce the Union’s energy consumption by 20% by 2020, EU countries must set minimum energy performance requirements for new buildings for the major renovation of buildings and the replacement or retrofit of building elements (heating and cooling systems, roofs, walls, and so on). The main objective of the energy certification of buildings is to provide clear guidelines for the energy performance of buildings to improve the energetic quality of new buildings and existing building stocks [18]. Existing buildings that are subject to a major renovation should, therefore, meet the minimum energy performance requirements adapted to the local climate. Since 2010, the Korean government has implemented the Building Energy Efficiency Ratings (BEER) system to evaluate the energy performance of buildings, including energy consumption and carbon dioxide emissions from buildings [19]. The current BEER system in Korea is suitable for the commercial and public buildings, where voluntary participation and energy conservation goals are required. On the other hand, it is hard to adopt the current certification system to the retrofit project of the residential buildings supported by the government’s building energy efficiency program.
In the case of Korea, low-income households apply for the energy efficiency program and the local sub-grantees (typically community action agencies) are tasked with identifying and serving eligible households before implementing the weatherization retrofit [12]. The households selected for the weatherization retrofit receive free energy audits and a home retrofit. Community action staff conduct an energy audit of the home. The purpose of the audit is to make recommendations regarding which efficiency improvements should be implemented at home. During the visit, program auditors collect information about the building structure and other construction details, heating and cooling systems, appliances, etc. However, this audit is not a detailed measurement, but a walk-through audit, which is done by drawings or the visual inspection of the household. The analysis of the energy use of the recipient households is conducted before and after the retrofit and quantify the returns on the energy efficiency program. However, there is a large and persistent difference between the levels of energy efficiency that are projected to save energy use and the actual use. This has become known as the “efficiency gap” or “rebound effect.” Over the last three decades, a wide variety of explanations have been offered for this apparent failure of consumers to avail themselves of profitable investment opportunities [20,21,22].
Sanders et al. [23] suggest that the best estimate of the gap between the technical potential and the actual in-situ performance of energy efficiency measures is 50%, with 35% coming from performance gaps and 15% coming from ‘comfort taking’ or direct rebound effects. Other analyses also note that the gap between technical potential and actual performance is likely to vary by measure, with the range extending from 0% for measures such as solar water heating to 50% for measures such as improved heating controls [24].
Most of the evaluation of home energy efficiency programs depend on calculated rather than measured levels of energy consumption. This fails to take into account the discrepancies that have been observed in practice between the calculated and actual energy consumption both before and after refurbishment [22].
This study focuses on the energy efficiency gap between the energy projection method. This study analyzes the difference in the energy saving effect at the energy efficiency retrofit program for low-income households. As a cause of the efficiency gap, this study examines the impact of the input values in calculating energy efficiency. As a case study, the energy saving effect of the energy efficiency (retrofit) program for low-income households in Korea is analyzed. The building energy performance before and after the retrofit is investigated for the recipient household. The analysis is conducted in two ways: the first one is the case where the walk-through audit gathers the input data as a conventional method, and the second one is the case where the detailed and precise measurement data is used as input data.
Therefore, this paper contributes to four primary aspects, namely: (1) to emphasize the influence of input data in the calculation of energy savings in the retrofit program; (2) to fill the gap in the current projection method for energy saving effect; (3) to provide a better understanding of the energy saving potential of the energy efficiency (retrofit) program for low-income households.
The paper is structured as follows: in Section 2, we describe the method to quantify energy performance before and after the energy efficiency program for low-income households; Section 3 analyzes the results of including measurement and simulation and discusses their implications; finally, Section 4 discusses the results and concludes the paper by summarizing the key findings and proposing ideas for future work.

2. Method

2.1. Overview of the Target Household

The target household is a recipient of the energy efficiency program supported by the Korea Energy Foundation. The target household is a 16.42 m2 sized studio located on the rooftop of a two-story detached house located in Gyeonggi-do, Korea. As shown in Figure 1, the target household is composed of a 10.5 m2 sized bedroom space and a 5.92 m2 sized kitchen and utility space. The target building was constructed with masonry walls and concrete slabs, and an approximately 1.6 m2 sized window is located in the bedroom. This building was constructed in 1997 and is a small studio.
As shown in Figure 2 and Table 1, the wall before the retrofit works was composed of 50 mm redbrick, 10 mm mortar, 100 mm cement brick, 100 mm concrete, and no insulation. Through a retrofit project, an additional insulation reinforcement was conducted with a 30 mm thick insulation (extrude polystyrene), a 12 mm thick air layer, and a 9.5 mm thick gypsum board on the inside wall, according to the Building Design Criteria for Energy Saving (BDCES) in Korea. BDCES is a mandatory regulation for new construction building or retrofitted building projects in Korea and defines the insulation performance of the building envelope [25]. The existing wooden window was replaced by a Polyvinyl Chloride (PVC) window with excellent airtightness and heat insulation performance (Table 2).

2.2. Walk-Through Audit

Comprehensive energy audits are traditionally conducted in the quantification of the energy efficiency program of low-income housing units. However, these audits are relatively costly and time-consuming. Instead, readily available data such as monthly energy bills, building construction information, and visual inspection data can be used to identify the energy saving effect before and after the retrofit [26].
In Korea, the community action agencies conducted a walk-through audit of the served households to define energy performance before and after the retrofit (Figure 3). During the visit, the program auditors collected information about the building structure, heating and cooling systems, appliances, ventilation, and so on. A retrofit or construction strategy was prepared, considering the supported cost for retrofitting. The as-is energy performance was analyzed based on the checklist of the target house. After construction, the energy performance or energy saving effect was also analyzed based on the checklist of the construction. The analysis of energy performance was accomplished by a computer-based audit tool (Figure 4). The energy performance analysis program was based on the ISO 13790 international standard [27] and it was a simplified calculation method for the assessment of the annual energy use for the space heating of a residential or non-residential building. This method can be used for the calculations, which are a monthly quasi-steady state method and a simplified hourly method. The input value for the prediction of the energy performance is straightforward and based on the checklist data for the convenience of a field worker.

2.3. Detailed Field Measurement

In this study, a detailed field measurement was accomplished to analyze the building energy performance of the target building before and after the energy efficiency retrofit, the thermal performance of the wall and window, and the airtightness were measured. The measurement was conducted before the retrofit (13 November~16 November) and after the retrofit (20 November~24 November). The measurement items and contents are as shown in Table 3 and Figure 5 and Figure 6.
The thermal performance of the walls was measured through the heat flux method [28]. The heat flux method (HFM), defined in ISO 9869, measures the heat flow density using a heat flowmeter while simultaneously measuring the indoor and outdoor air temperatures using thermocouples.
The window performances before and after the retrofit of the target building for the building energy performance were measured. The Solar Heat Gain Coefficient (SHGC) value, along with UV, visible light, and infrared transmission values were measured by the Window Energy Profiler (EDTM-WP 4200). The airtightness performance of the target building was measured through a Blower Door Test method. In the test, a blower door was installed at the door of the bedroom of the target building (Figure 6).

2.4. Simulation

The simulation study was accomplished to analyze the projected energy efficiency gap between the simple method (based on the walk-through audit) and the detailed method for the calculation of the energy saving effect by retrofit. The validity of simulation modeling was analyzed in comparison with the experiment results [29]. In the simulation, the three sets of measurement data obtained in this study were used and divided into Case 1-1, Case 1-2, and Case 2. Case 1-1 represents the target building energy performance before the retrofit and is based on the walk-through audit data. Case 1-2 corresponds to the case before the retrofit and is based on the detailed field measurement data. Case 2 represents the energy performance of the target house after the retrofit and is based on the detailed field measurement data. The heating load, heating energy consumption, and consequent greenhouse gas emissions were reviewed through the simulations. Moreover, the indoor thermal environment and human thermal comfort before and after retrofit were analyzed. EnergyPlus was used as an energy efficiency analysis tool rather than the existing energy performance analysis program for the walk-through audit process, as shown in Figure 4. The existing audit program was difficult when reflecting the detailed input data by precise measurement results because the input values of the energy audit program were simple. Therefore, EnergyPlus was used to compare the quantitative difference of the heating load according to the used value in the walk-through audit process (Case 1-1) and the detailed value in measurement (Case 1-2 and Case 2).
The simulation was carried out for six months from November to April—the heating period in Korea. The set-point temperature of indoor was set to 22 ℃, according to the Energy Saving Design Standards for Buildings in Korea [30] Table 4 and Table 5.

3. Results

3.1. Measurement results

The wall U-values, window material properties, and airtightness of the target building before and after the energy retrofit are as shown in Table 6. The performance before the energy retrofit was classified into walk-through audit results (Case 1-1) and detailed measurement results (Case 1-2). The results of the thermal performance (U-value) of the walls before the retrofit was 0.58 W/m2oC by walk-through audit and 2.07 W/m2oC by detailed measurement, and 1.07 W/m2oC after the retrofit. As for the performance of the window, the calculated U-value by walk-through audit was 3.84 W/m2oC, while the measured value was 5.3 W/m2•K. The U-value of the window was strengthened as 3.1 W/m2oC by the retrofit. The SHGC of the window was calculated as 0.7. However, the measured value was 0.35. This value was changed to 0.91 by the retrofit. The calculated airtightness performance was 0.7 ach, and the measured value was 0.8 ach. The airtightness also improved as 0.3 ach.

3.2. Simulation Results

The input data for the energy projection simulation analysis are different according to the audit method, as shown in Table 6.

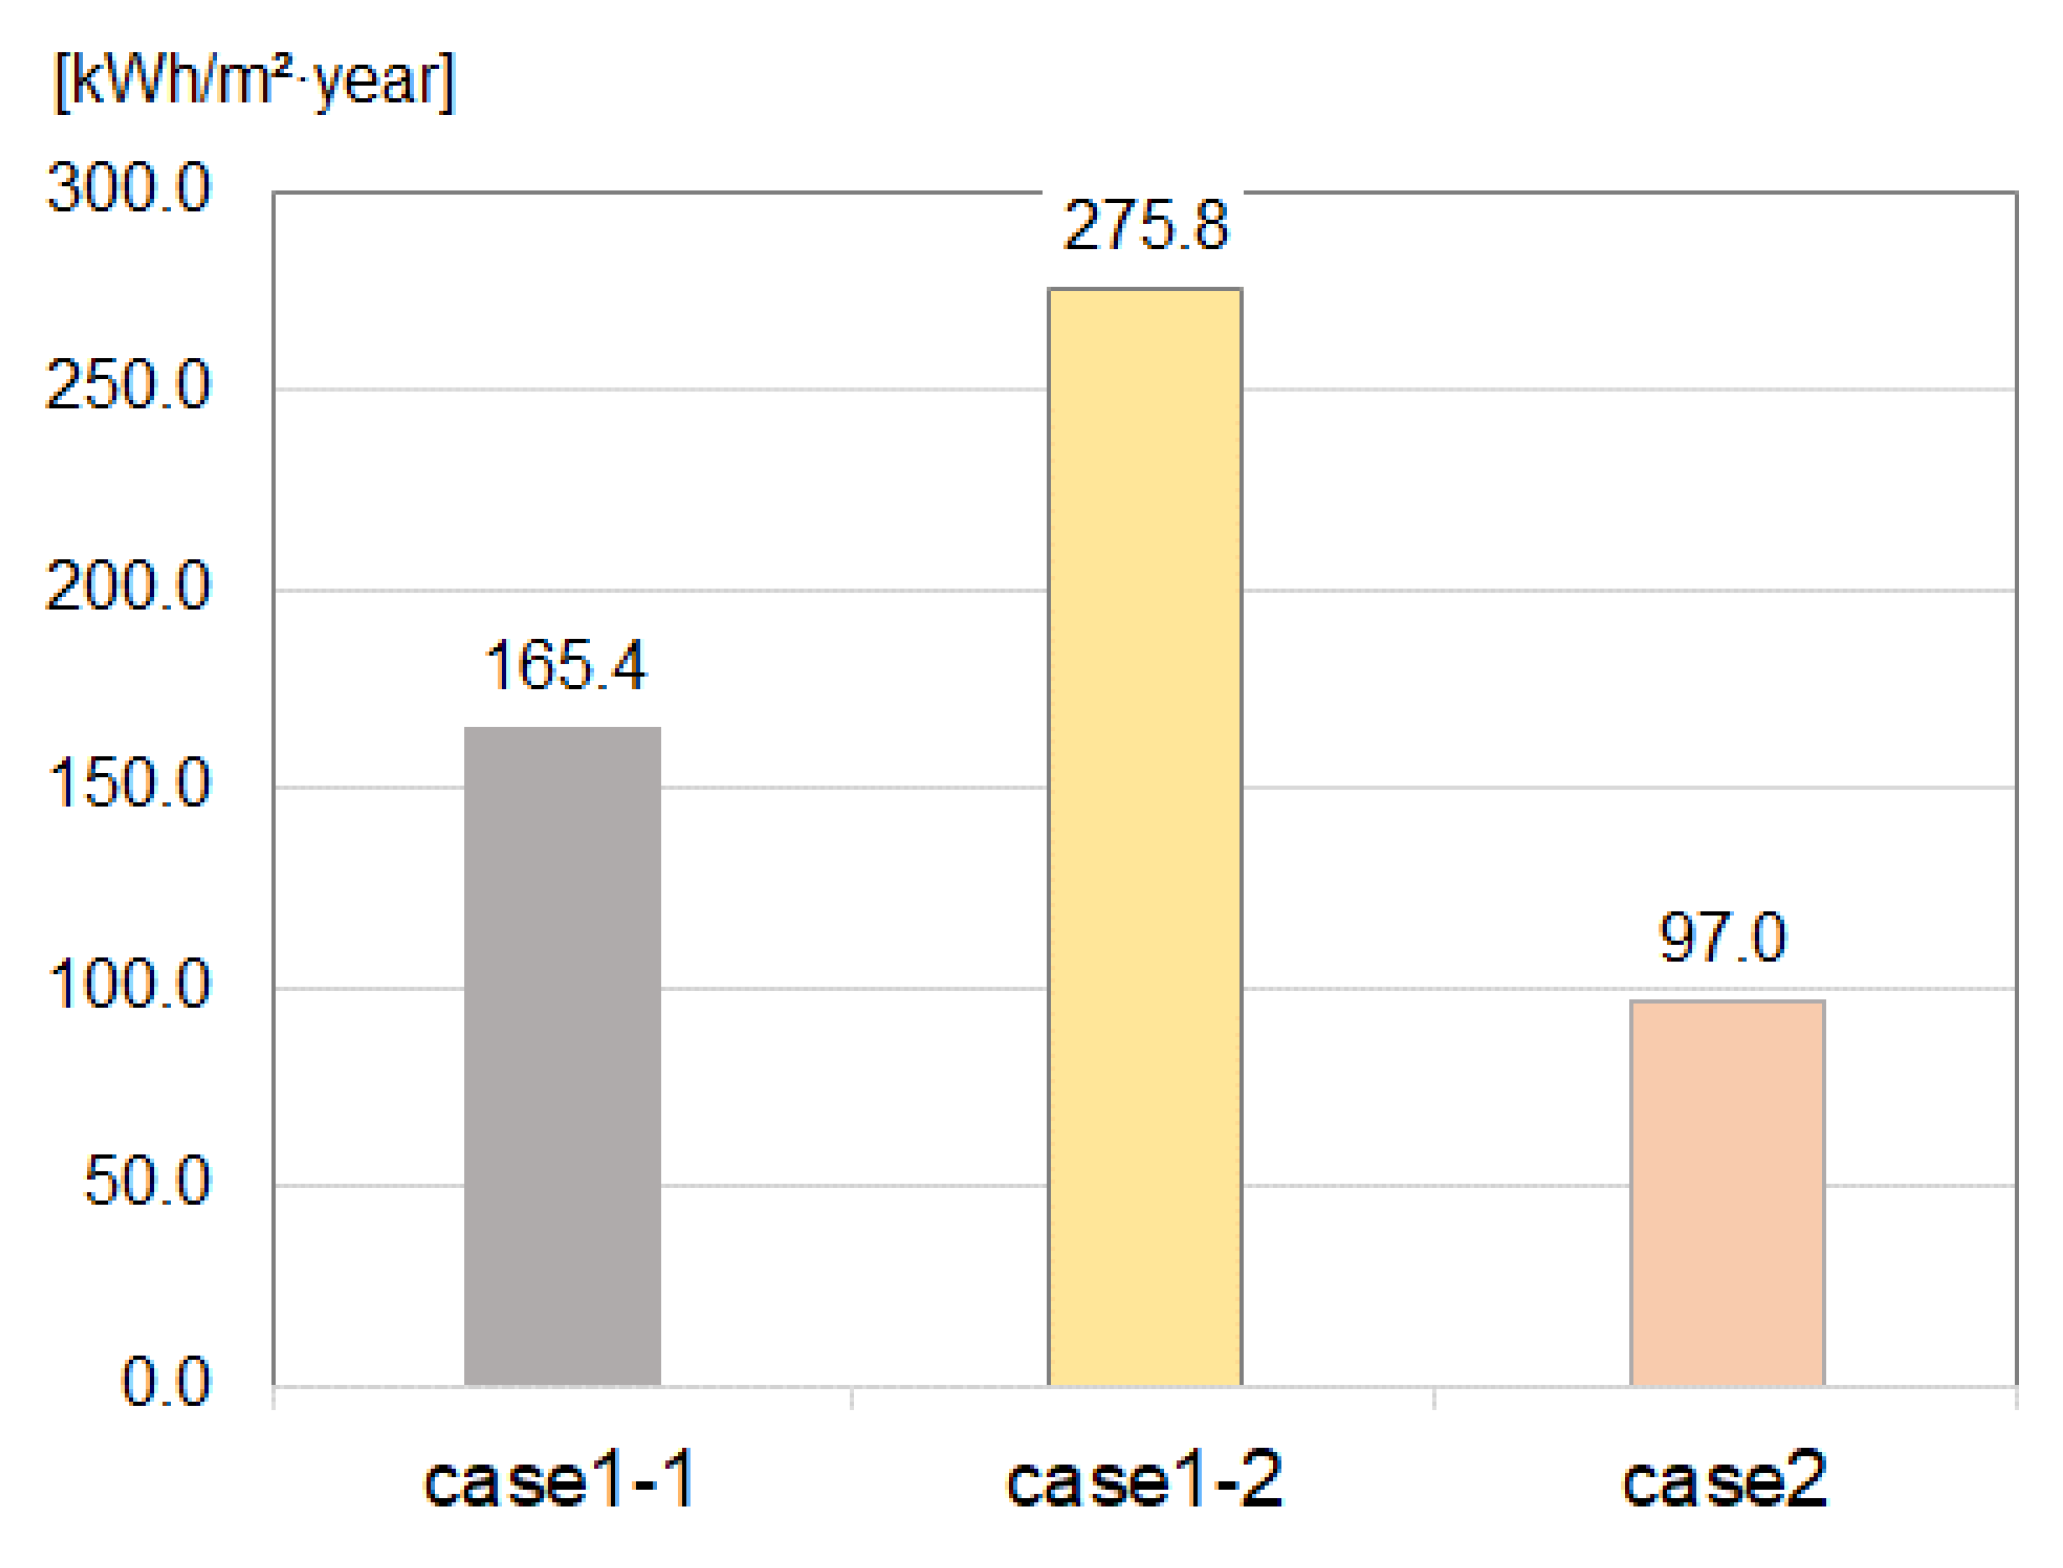
3.2.1. Differences in heating demand and GHG emissions

Figure 7 and Figure 8 show the heating demand before and after the retrofit. The heating demand for Case 1-1 is the results calculated based on the walk-through audit data. The prediction result of the building heating demand before the retrofit showed very different results depending on the input value.
The heating demand calculated by the walk-through audit (Case 1-1) corresponded to 60% of Case 1-2 based on the detailed measurement data. There is a tendency to evaluate that the thermal performance of the target building evaluated through walk-through audits was superior to the actual thermal performance of the target building.
The heating demand of Case 2 was calculated based on the measurement data after the building retrofit was reduced to about 65%, compared to before the retrofit (Case 1-2). However, the heating demand reduction effect after the retrofit (Case 2) compared to the load estimated based on walk-through data before the retrofit (Case 1-1) can be estimated as little as about 41%. This result showed that the reduction of heating demand based on the input data of the walk-through audit can be underestimated more than the results of detailed measurements.
Table 7 indicates the greenhouse gas (GHG) reduction effect of the energy efficiency program for low-income households. About 65% of greenhouse gas could be reduced by the building retrofit (Case 1-2 to Case 2) for the target households in this study. However, if we predicted with walk-through audit results, as in Case 1-1, the reduction effect was as little as 41%.

4. Discussion and Conclusions

The results of this study emphasize that one of the causes of the efficiency gap or efficiency difference is due to the input values in evaluating the energy performance in the retrofit program of low-income households. According to the results of this study, the energy saving effect, according to the retrofit of the low-income household, predicted through the results of detailed measurement was 65%, which was higher than 41% of the conventional prediction method. The resulting GHG reduction effect was also the same as the energy savings, and the results predicted by the existing prediction methods were less predicted than the detailed measurement results. This is because the energy performance evaluation of the target building before the retrofit depended on the walk-through audit, so it was not considered to reflect the deterioration due to the aging of the building, and there was a tendency to judge the thermal performance of the building envelope to be better than it is. Though a sufficient retrofit and precise and detailed measurements were not possible with a limited budget, it seems somewhat unreasonable to establish a national building energy saving policy with these results. Energy diagnosis that prioritizes the convenience of field workers and energy efficiency by a retrofit that is evaluated based only on the walk-through audit results can lead to very different results from actual efficiency. For the energy efficiency improvement program for the low-income household to realize efficient energy saving and comfort for residents, an energy diagnosis must first be appropriately conducted. In this sense, it is important to increase the subsidies for energy improvement programs for low-income households, as well as set energy performance diagnostic costs properly.

Author Contributions

Conceptualization, D.S.; software, J.K.; formal analysis, J.K.; investigation, J.M.; resources, J.M.; data curation, J.M. and H.L.; writing—original draft preparation, J.K.; supervision, D.S.; project administration, D.S.; funding acquisition, D.S. All authors have read and agreed to the published version of the manuscript.

Funding

This research was supported by a grant (20AUDP-B099686-06) from Residential Environment Research Program funded by Ministry of Land, Infrastructure and Transport of Korean government.

Conflicts of Interest

The authors declare no conflict of interest.

References

  1. International Energy Agency. CO2 Emissions from Fuel Combustion 2017; International Energy Agency: Paris, France, 2017. [Google Scholar] [CrossRef]
  2. International Energy Agency. World Energy Balances 2017; International Energy Agency: Paris, France, 2017. [Google Scholar] [CrossRef]
  3. Kim, T.; Chae, C.U. Evaluation analysis of the CO2 emission and absorption life cycle for precast concrete in Korea. Sustainability 2016, 8, 663. [Google Scholar] [CrossRef] [Green Version]
  4. UNFCCC. Synthesis Report on the Aggregate Effect of the Intended Nationally Determined Contributions; Author Paris; UNFCCC: New York, NY, USA, 2015. [Google Scholar]
  5. MOSF. 1st Master Plan for Response to Climate Change; MOSF: Seoul, Korea, 2016. [Google Scholar]
  6. Ma, Z.; Cooper, P.; Daly, D.; Ledo, L. Existing building retrofits: Methodology and state-of-the-art. Energy Build. 2012, 55, 889–902. [Google Scholar] [CrossRef]
  7. Levine, M.; Urge-Vorsatz, D.; Blok, L.; Geng, D.; Harvey, S.; Lang, G.; Levermore, A.; Mongameli Mehlwana, S.; Mirasgedis, A.; Novikova, J. Chapter 6: Resdiential and Commercial Buildings. IPCC AR4 WGIII. 2008. Available online: http://www.ipcc.ch/pdf/assessment-report/ar4/wg3/ar4-wg3-chapter6.pdf (accessed on 20 April 2009).
  8. Tommerup, H.; Svendsen, S. Energy savings in Danish residential building stock. Energy Build. 2006, 38, 618–626. [Google Scholar] [CrossRef]
  9. Edenhofer, O.; Pichs-Madruga, R.; Sokona, Y.; Agrawala, S.; Bashmakov, I.; Blanco, G.; Broome, J.; Bruckner, T.; Brunner, S.; Bustamante, M. Summary for policymakers. In Climate Change 2014: Mitigation of Climate Change; Cambridge University Press: Cambridge, UK, 2014. [Google Scholar]
  10. Lomas, K.J. Carbon reduction in existing buildings: A transdisciplinary approach. Build. Res. Inf. 2010, 38, 1–11. [Google Scholar] [CrossRef]
  11. Statics Korea. 2018 Population and Housing Census; Statics Korea: Seoul, Korea, 2018. [Google Scholar]
  12. Lee, T. A Survey Study of Poverty Policy; Korea Institute for Health and Social Affairs: Yeongi-gun, Korea, 2011. [Google Scholar]
  13. Scott, S.; Lyons, S.; Keane, C.; McCarthy, D.; Tol, R.S. Fuel Poverty in Ireland: Extent, Affected Groups and Policy Issues; ESRI Working paper: Dublin, Ireland, 2008. [Google Scholar]
  14. USDOE. Weatherization Assistance Program Briefing Book; USDOE: Washington, DC, USA, 2016. [Google Scholar]
  15. Park, S.; Kim, J.; Song, D. The Effect of an Energy Refurbishment Scheme on Adequate Warmth in Low-income Dwellings. Sustainability 2019, 11, 2574. [Google Scholar] [CrossRef] [Green Version]
  16. Jordaan, S.M.; Romo-Rabago, E.; McLeary, R.; Reidy, L.; Nazari, J.; Herremans, I.M. The role of energy technology innovation in reducing greenhouse gas emissions: A case study of Canada. Renew. Sustain. Energy Rev. 2017, 78, 1397–1409. [Google Scholar] [CrossRef]
  17. EU. Directive 2010/31/EU of the European Parliament and of the Council of 19 May 2010 on the energy performance of buildings. Off. J. Eur. Union 2010, 53, 13–35. [Google Scholar]
  18. Kelly, S.; Crawford-Brown, D.; Pollitt, M.G. Building performance evaluation and certification in the UK: Is SAP fit for purpose? Renew. Sustain. Energy Rev. 2012, 16, 6861–6878. [Google Scholar] [CrossRef]
  19. Koo, C.; Hong, T.; Lee, M.; Park, H.S. Development of a new energy efficiency rating system for existing residential buildings. Energy Policy 2014, 68, 218–231. [Google Scholar] [CrossRef] [Green Version]
  20. Fowlie, M.; Greenstone, M.; Wolfram, C. Do energy efficiency investments deliver? Evidence from the weatherization assistance program. Q. J. Econ. 2018, 133, 1597–1644. [Google Scholar] [CrossRef] [Green Version]
  21. Milne, G.; Boardman, B. Making cold homes warmer: The effect of energy efficiency improvements in low-income homes A report to the Energy Action Grants Agency Charitable Trust. Energy Policy 2000, 28, 411–424. [Google Scholar] [CrossRef]
  22. Rosenow, J.; Galvin, R. Evaluating the evaluations: Evidence from energy efficiency programmes in Germany and the UK. Energy Build. 2013, 62, 450–458. [Google Scholar] [CrossRef]
  23. Sanders, C.; Phillipson, M. Review of Differences between Measured and Theoretical Energy Savings for Insulation Measures; Centre for Research on Indoor Climate and Health, Glasgow Caledonian University: Glasgow, UK, 2006. [Google Scholar]
  24. DECC. How the Green Deal will Reflect the In-situ Performance of Energy Efficiency Measures; UK Department for Energy and Climate Change: London, UK, 2012. [Google Scholar]
  25. Evans, M.; Chon, H.; Shui, B.; Lee, S. Country report on building energy codes in Republic of Korea. Pac. Northwest Natl. Lab. 2009, 1, 1–26. [Google Scholar] [CrossRef] [Green Version]
  26. Krarti, M. Weatherization and Energy Efficiency Improvement for Existing Homes: An Engineering Approach; CRC Press: Boca Raton, FL, USA, 2016. [Google Scholar]
  27. ISO13790:2007; Thermal Performance of Buildings-Calculation of Energy Use for Space Heating; ISO: Geneva, Switzerland, 2007.
  28. ISO9869:1994; Thermal Insulation—Building Elements—In-Situ Measurement of Thermal Resistance and Thermal Transmittance; ISO: Geneva, Switzerland, 1994.
  29. Balci, O. A methodology for certification of modeling and simulation applications. ACM Trans. Modeling Comput. Simul. (TOMACS) 2001, 11, 352–377. [Google Scholar] [CrossRef]
  30. Shim, J.; Song, D.; Kim, J. The Economic Feasibility of Passive Houses in Korea. Sustainability 2018, 10, 3558. [Google Scholar] [CrossRef] [Green Version]
Figure 1. Floor plan and elevation of the target low-income household.
Sustainability 12 02774 g001
Figure 2. Wall composition of the target house.
Sustainability 12 02774 g002
Figure 3. Conventional walk-through audit process.
Sustainability 12 02774 g003
Figure 4. Energy audit program.
Sustainability 12 02774 g004
Figure 5. Wall thermal performance test. (a): Heat flux method test at before retrofit (inside); (b): Heat flux method test at after retrofit (inside); (c): Heat flux method test at before retrofit (outside); (d): Heat flux method test at after retrofit (outside).
Sustainability 12 02774 g005
Figure 6. Window performance and airtightness test.
Sustainability 12 02774 g006
Figure 7. Total heating loads.
Sustainability 12 02774 g007
Figure 8. Annual heating energy demand.
Sustainability 12 02774 g008
Table 1. Wall composition.
LayerMaterialsBefore Retrofit (mm)After Retrofit (mm)
OutsideRedbrick5750
2Mortar1010
3Cement brick100100
4Concrete100100
5Insulation-30
6Air-12
InsideGypsum board-9.5
Table 2. Window Composition.
Before RetrofitAfter Retrofit
Wood frame + 3 mm single glassPVC frame with 6 mm double glass
Table 3. Measuring items and devices.
Measurement ItemMeasuring DeviceMeasurement Results
Wall insulation
Performance
Heat flux method-ISO 9869 [28]U-value
[W/m2hoC]
Window performanceWindow Energy Profiler-EDTM-WP 4200SHGC, UV, Visible Light,
and Infrared Transmission
Airtightness performance
(infiltration)
Minneapolis blower door systemAirtightness
[ACH at 50 Pa]
Table 4. Simulation input conditions.
ItemRemarks
Person/m20.109
Metabolic rate0.9
HeatingSet-point temp.22 ℃
Floor heating systemnatural gas boiler (COP : 0.823)
Ventilation systemWithout
Lightning density0.73 W/m2
Analyzed cases
-
Case 1-1 : before retrofit and based on the walk-through audit data
-
Case 1-2 : before retrofit and based on the detailed measurement data
-
Case 2 : after retrofit based on the detailed measurement data
Table 5. Occupancy schedule.
ItemSchedule
Occupancy~24 : 1.00
Lighting~08 : 0.50, 08~18 : 1.00, 18~24 : 0.50
Floor heating~24 : 1.00
Table 6. Thermal performance of the target house before and after the retrofit.
ComponentBefore RetrofitAfter Retrofit
Walk-Through Audit
(Case 1-1)
Detailed Measurement
(Case 1-2)
Detailed
Measurement
(Case 2)
Wall U-value [W/m2·K]0.582.07 1.07
WindowU-value [W/m2·K]3.845.3 3.1
SHGC [-]0.70.350.91
Airtightness [ach]0.70.80.3
Table 7. Greenhouse gas (GHG) reduction effect of the retrofit.
kg-CO2/m2·yearReduction
Case 1-1337.8-
Case 1-2563.1-
Case 2198.141% of the Case 1-1 and 65% of the Case 1-2

