Determinants of Individuals’ E-Waste Recycling Decision: A Case Study from Romania

 ,
, 


Abstract
1. Introduction
2. Literature Review
3. Material and Methods
3.1. Survey Design
3.2. Distribution
3.3. Data Analysis
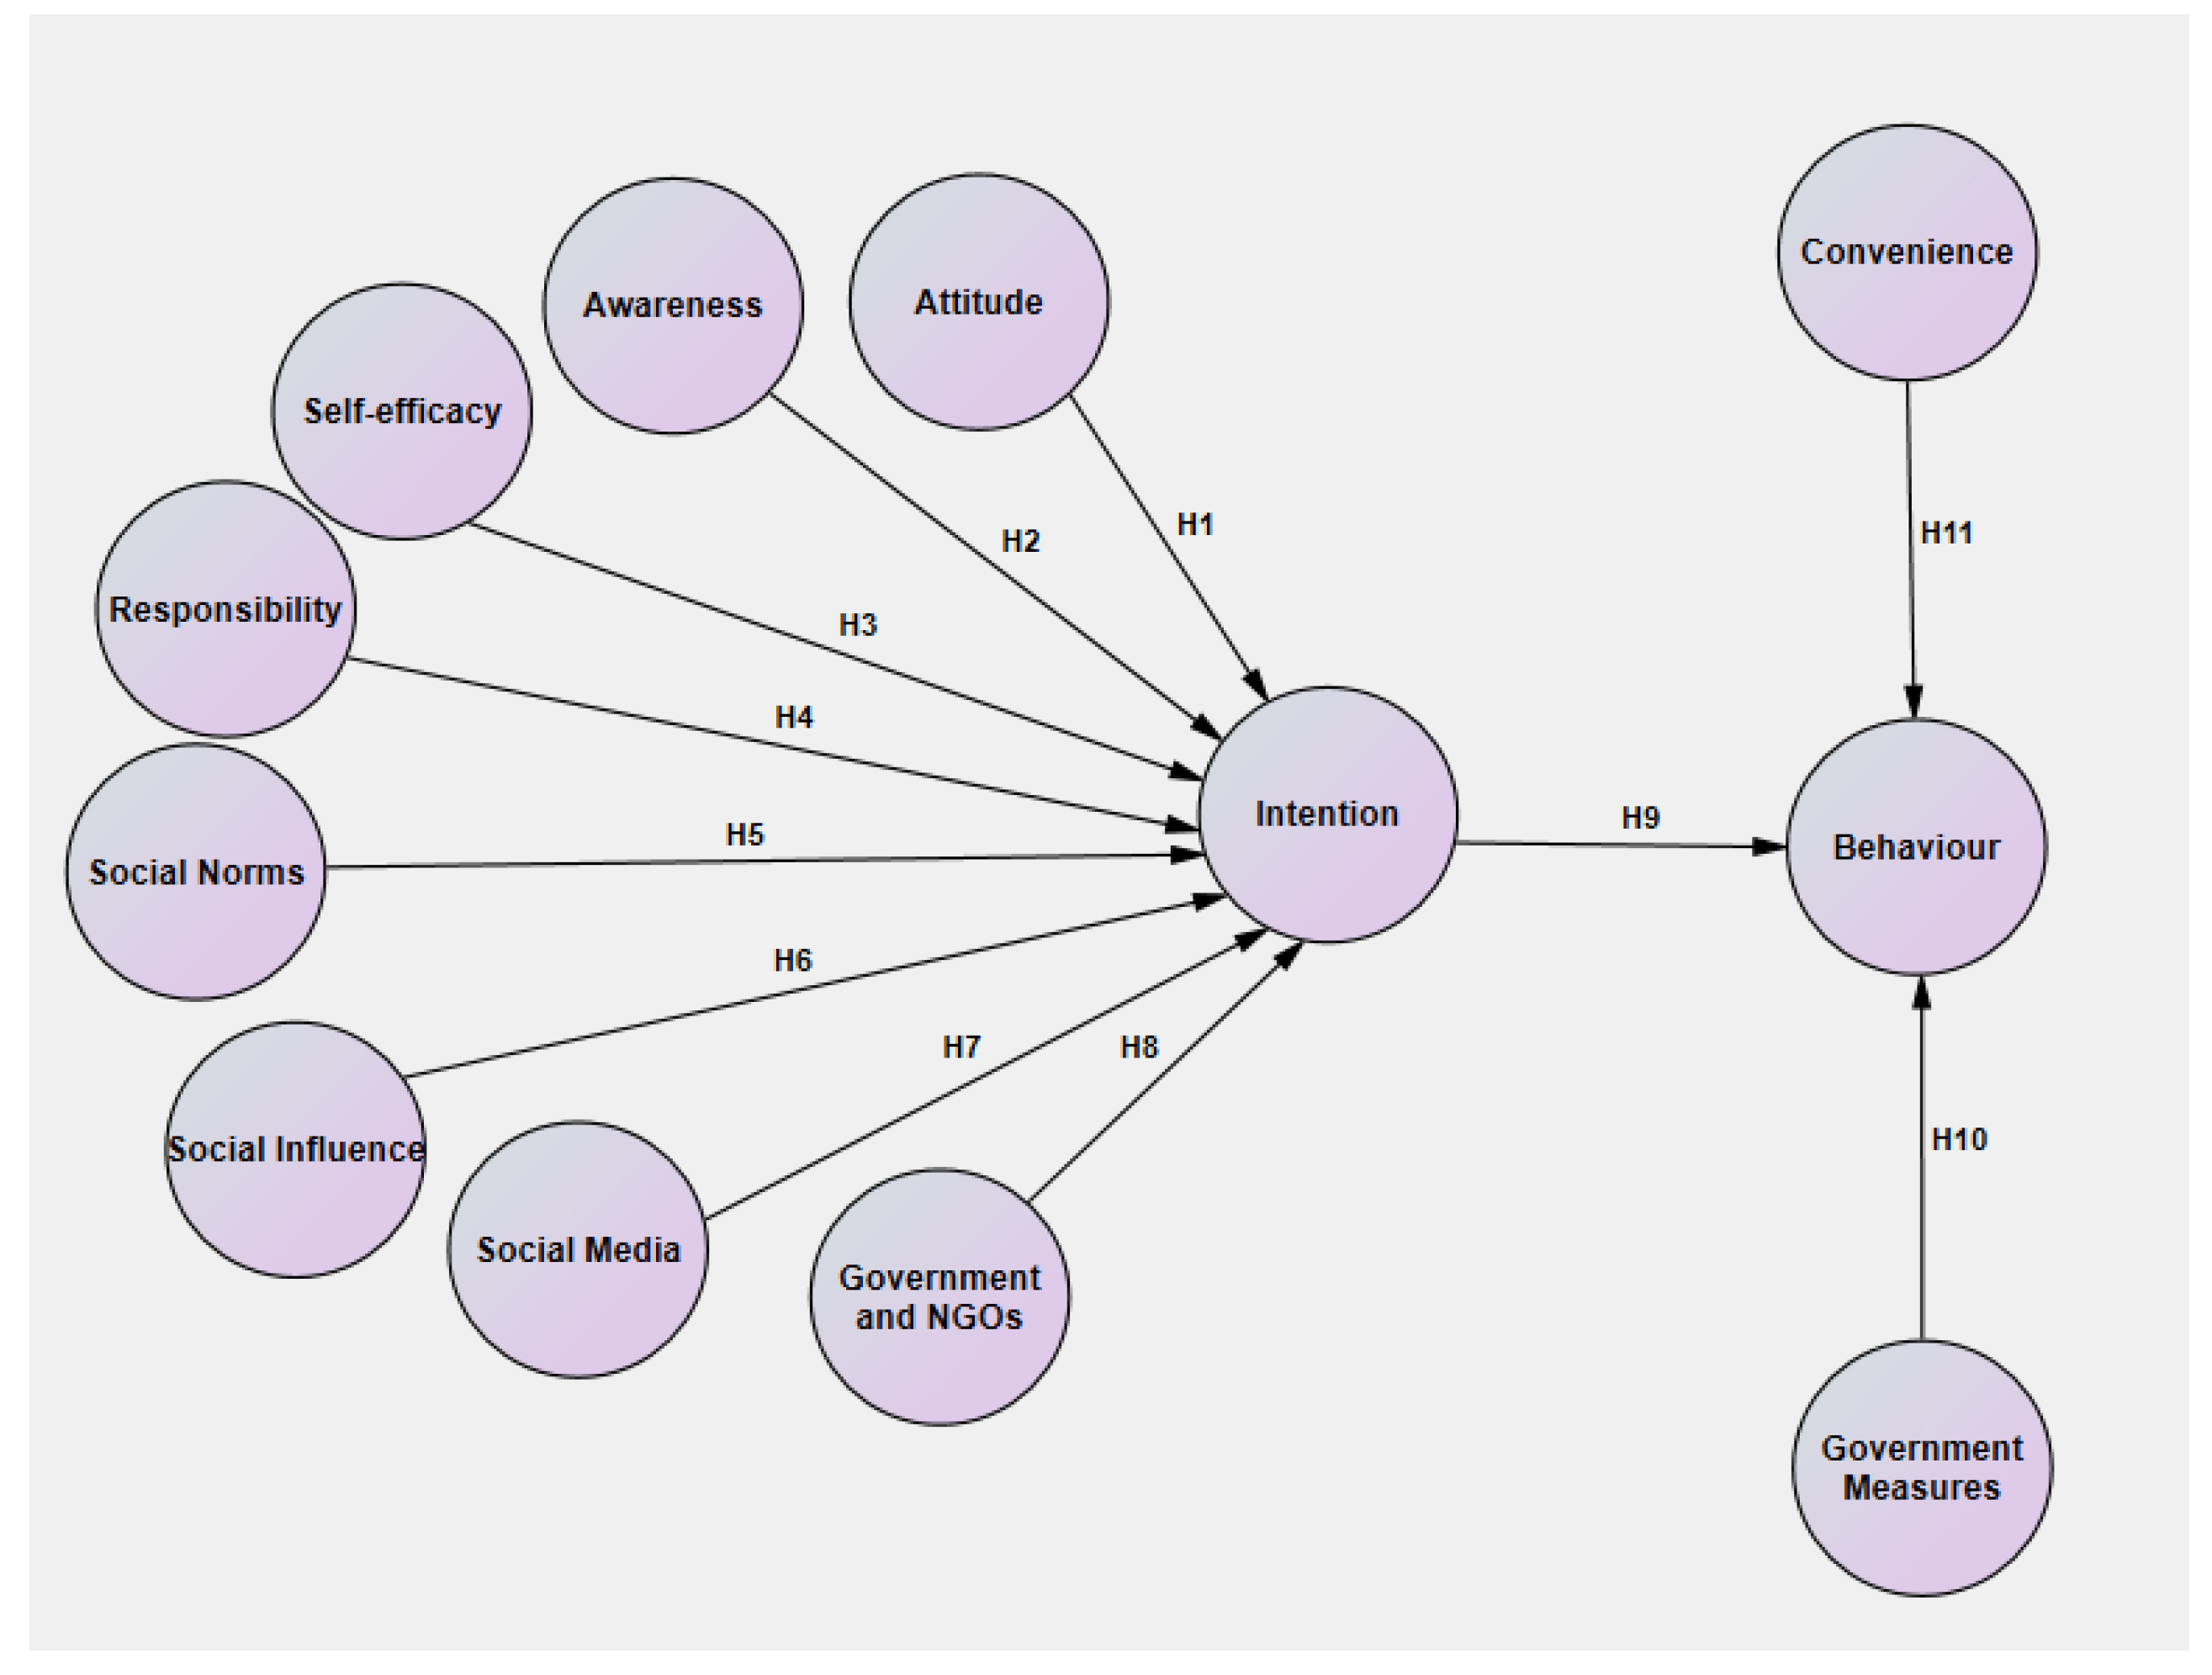
3.4. Hypotheses
4. Case Study
4.1. Demographic and Socio-Economic Characteristics
4.2. E-Waste Behavior
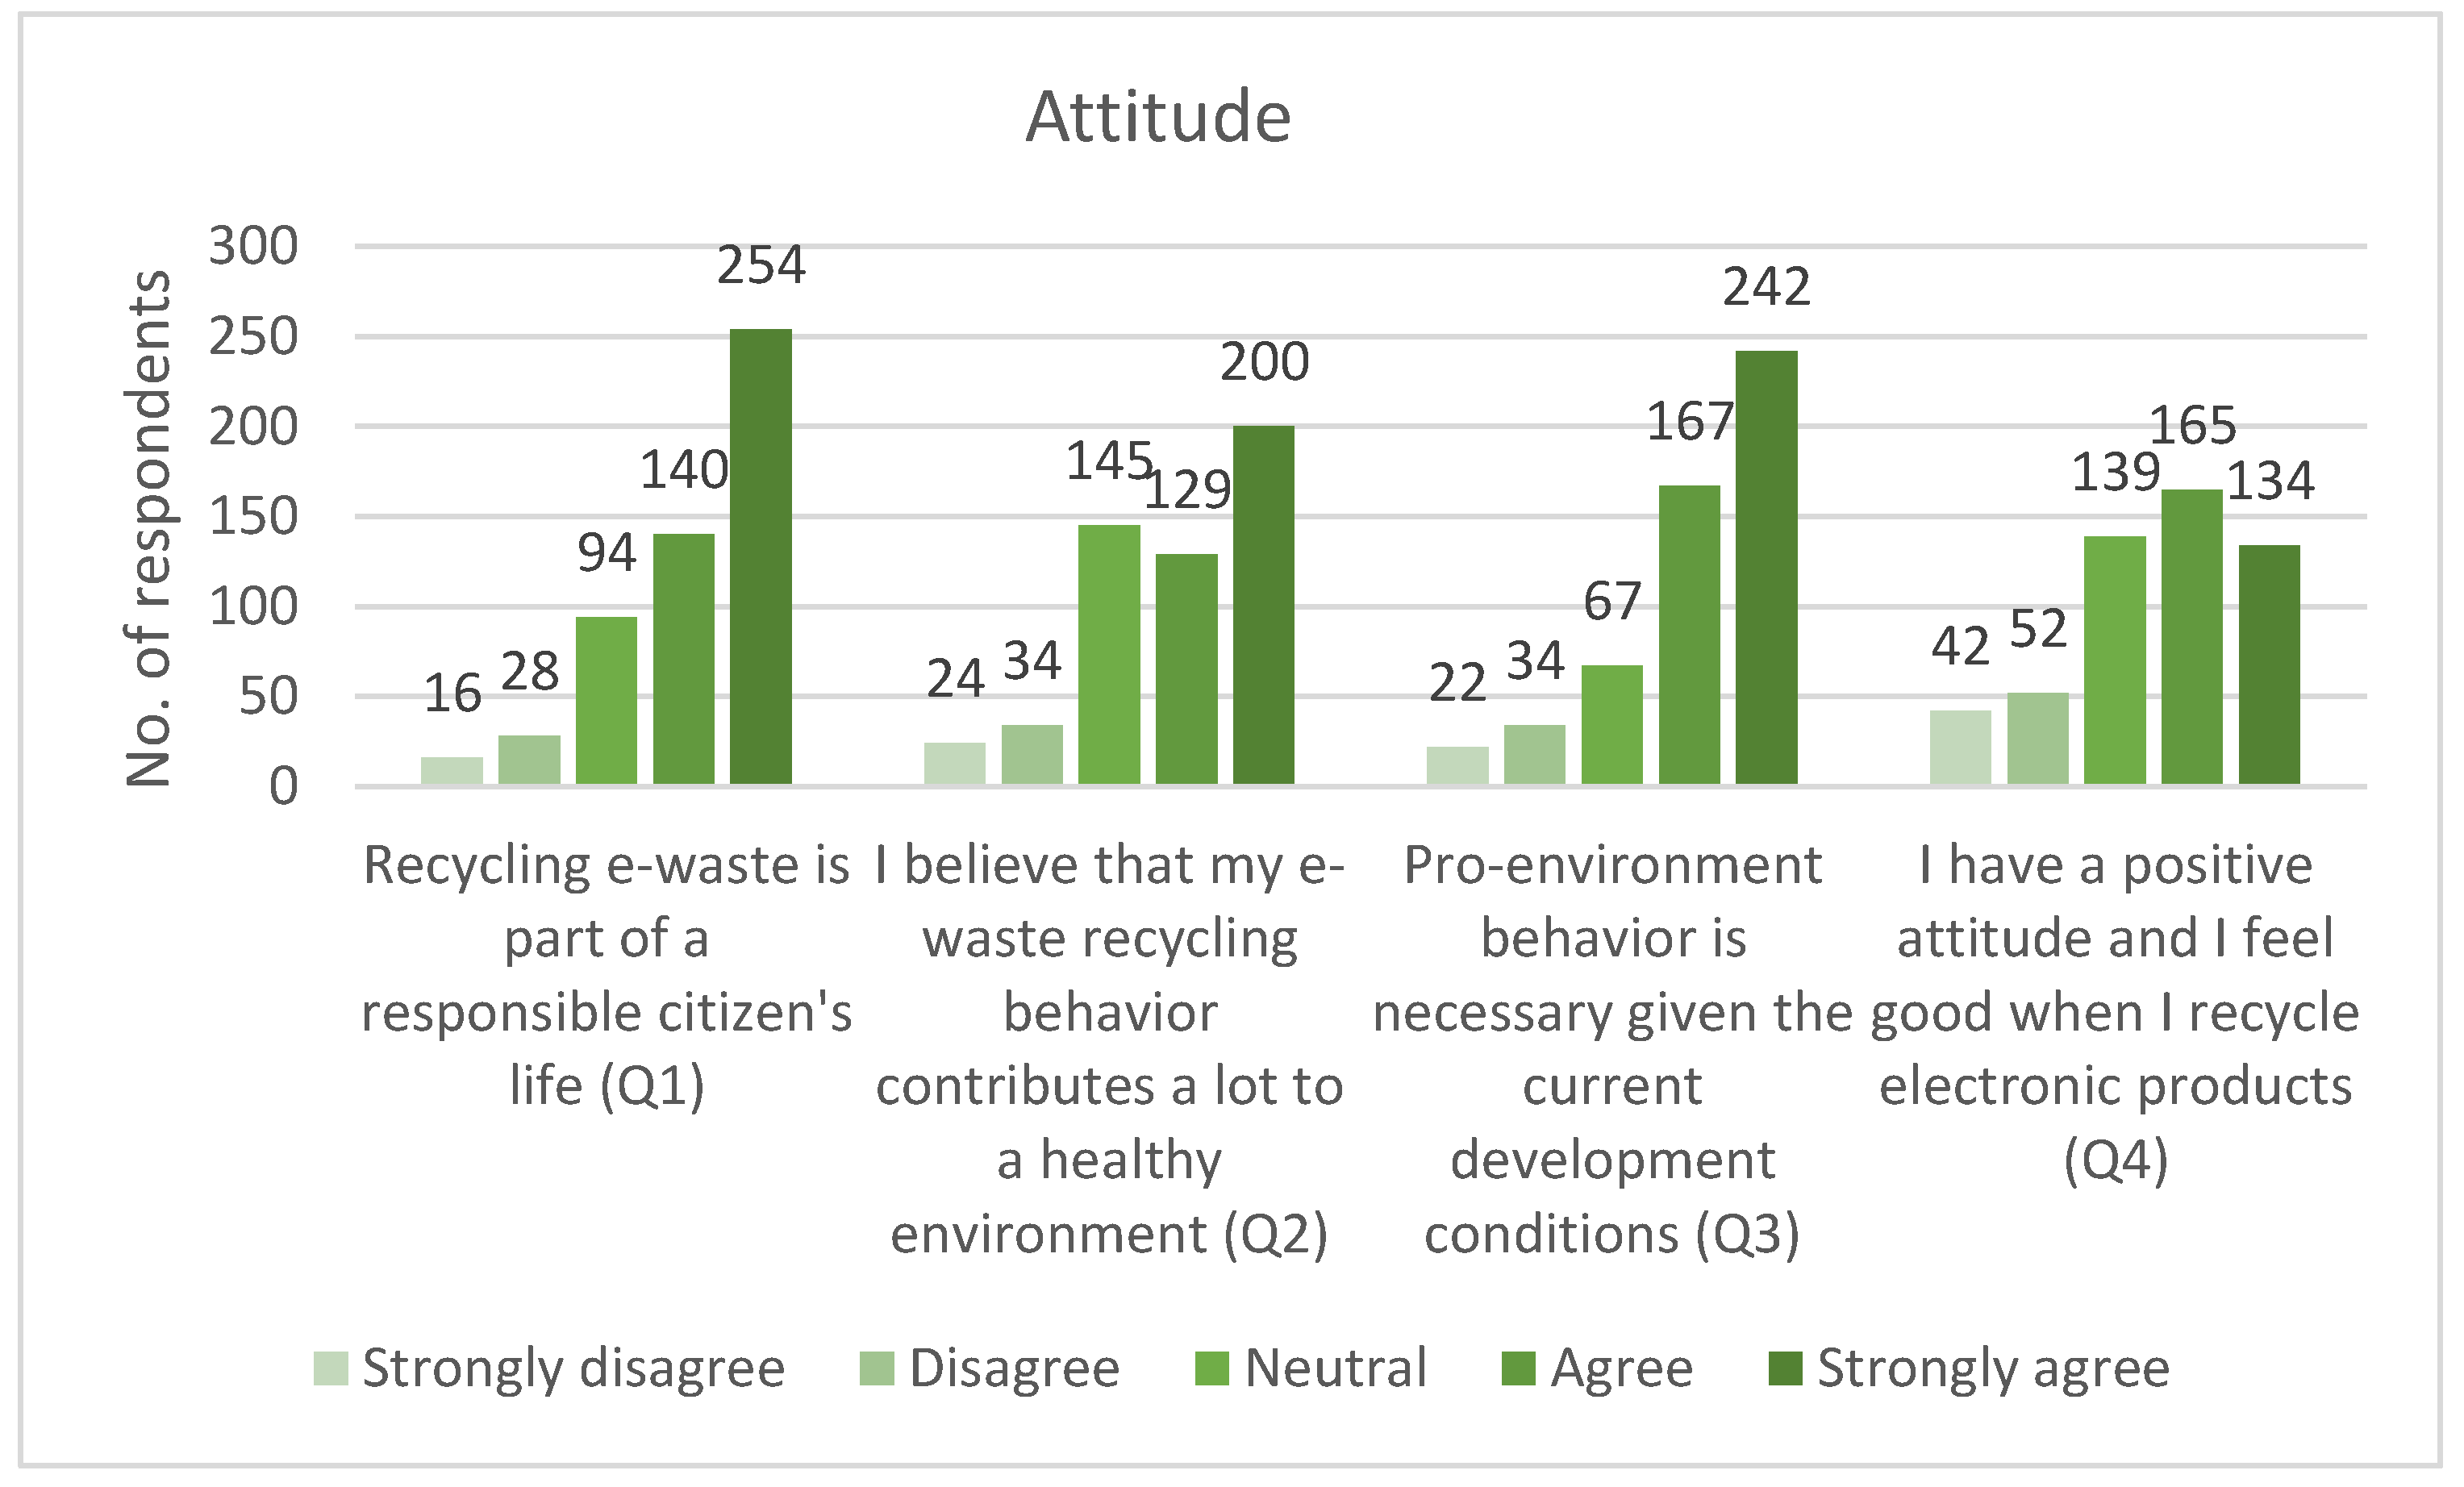
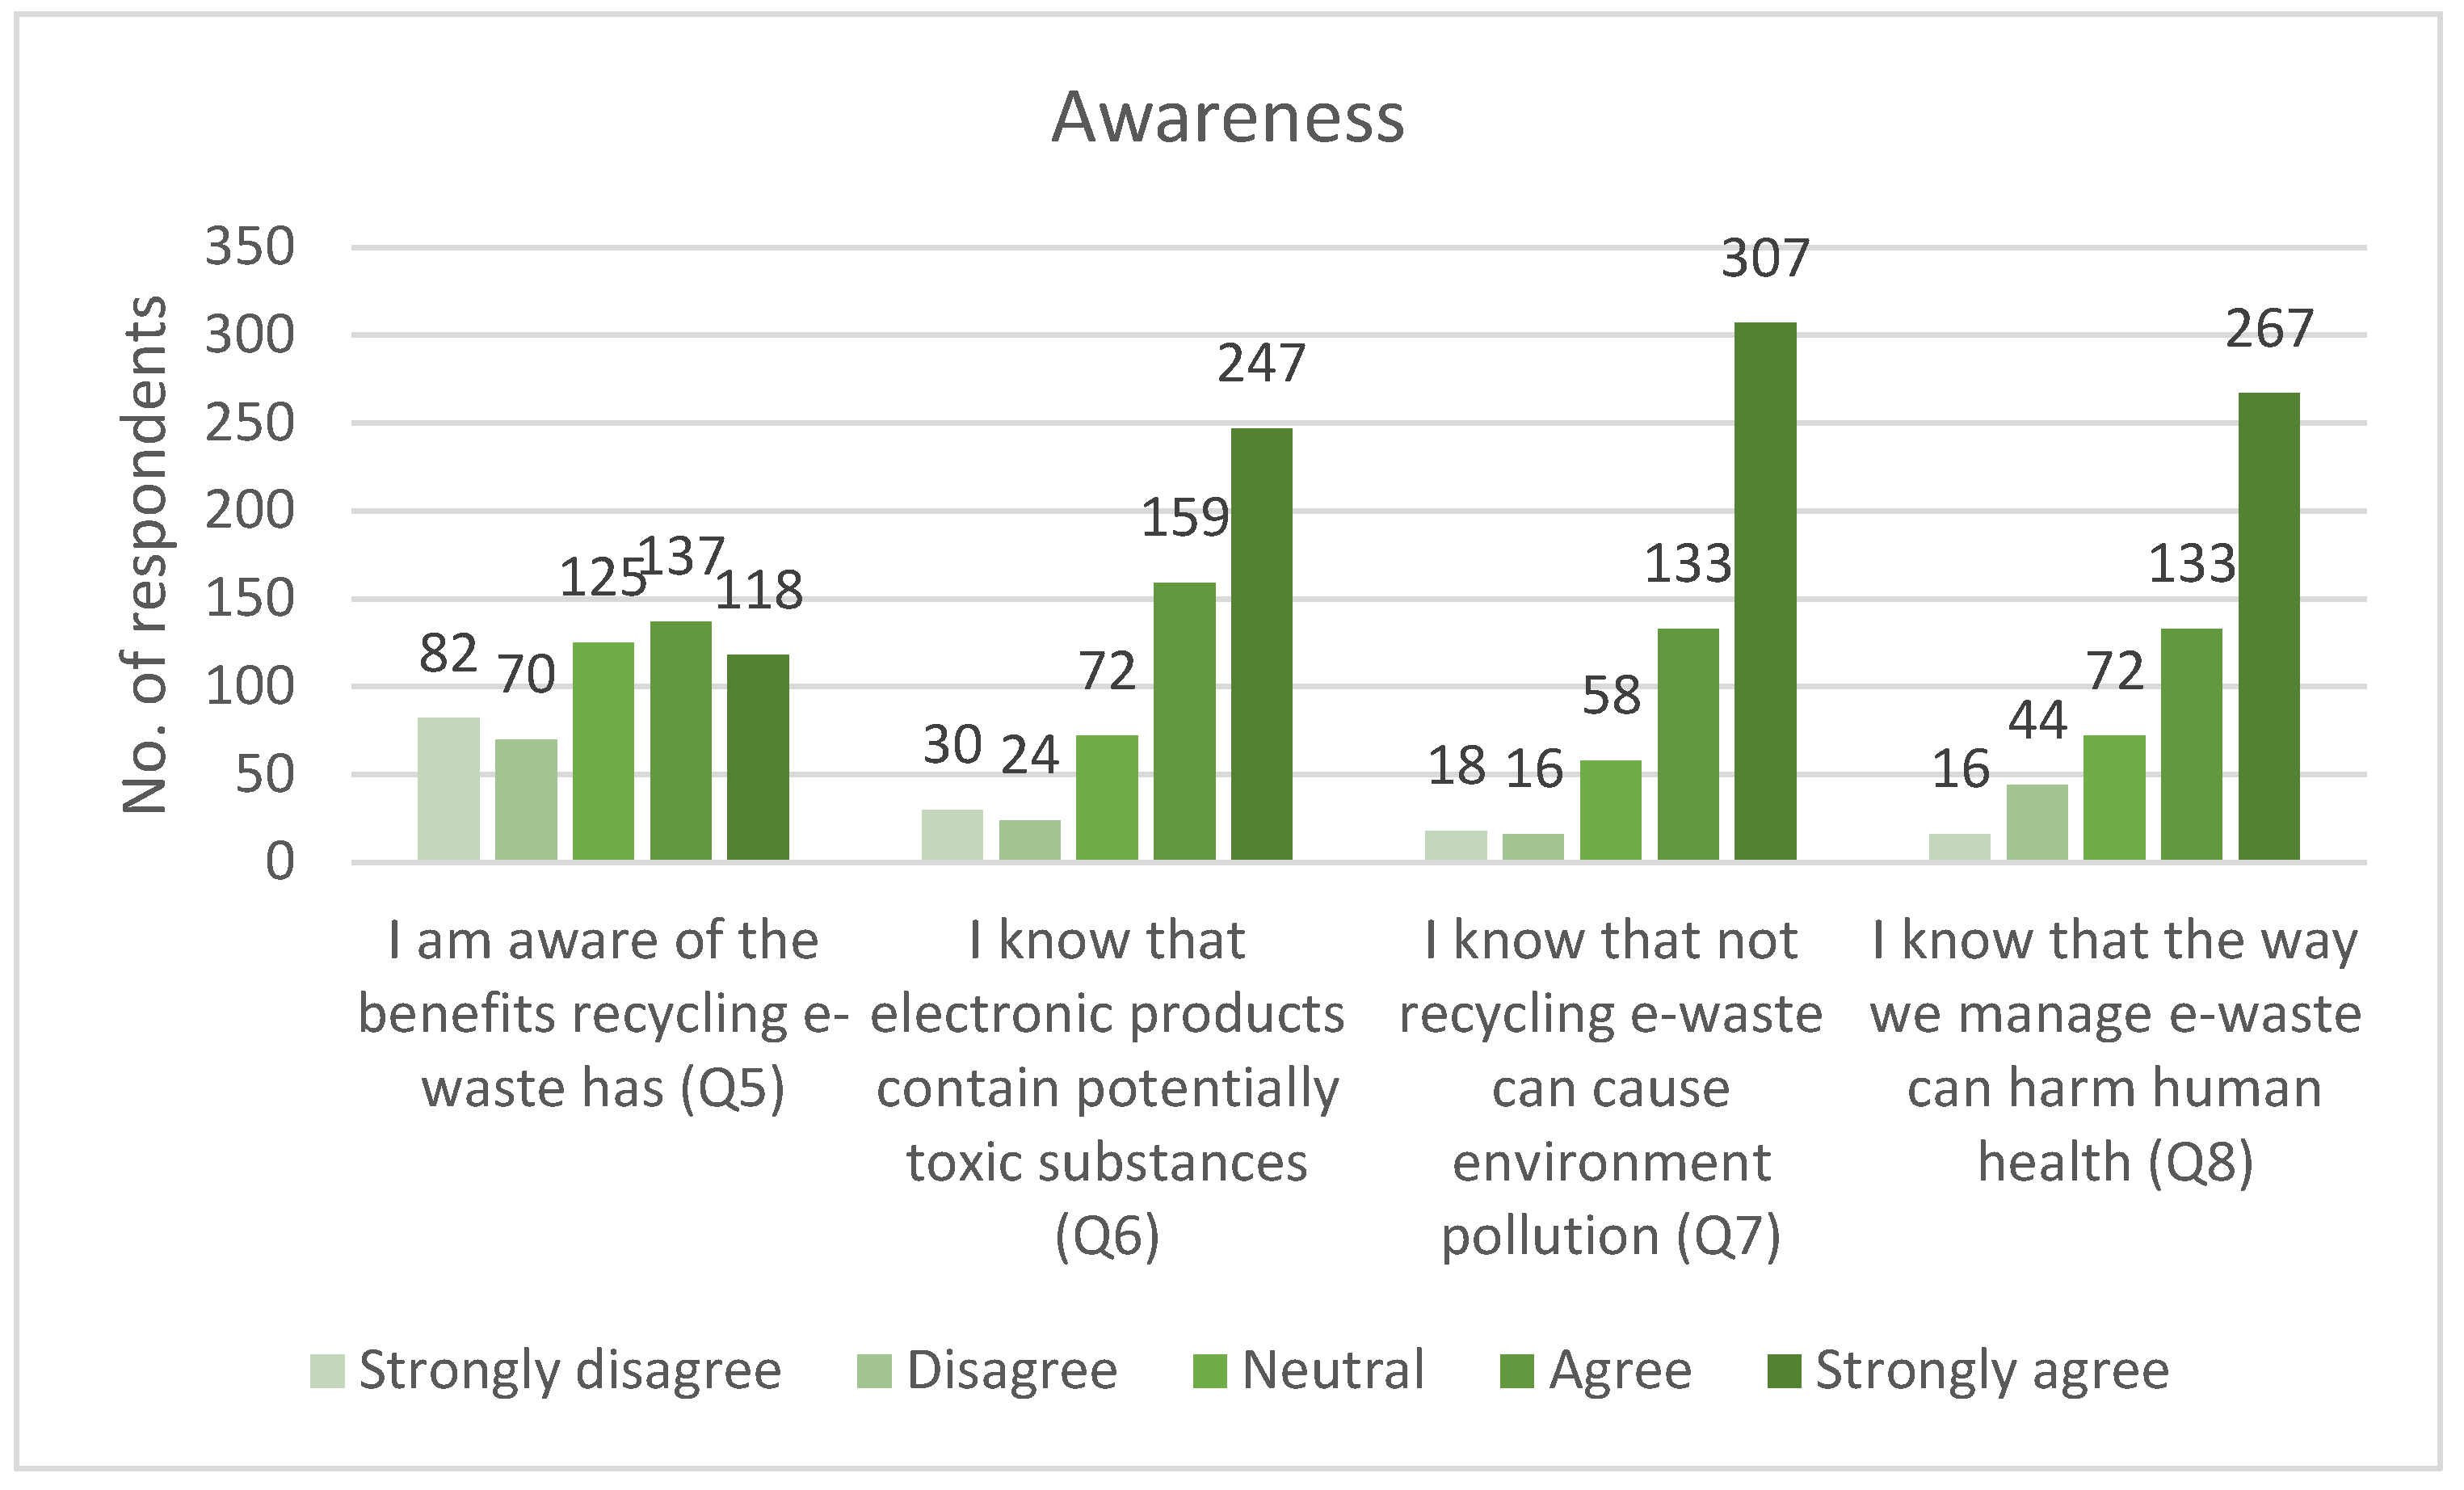
4.2.1. Attitude and Awareness of E-Waste Recycling
4.2.2. Self-efficacy and Responsibility in the E-Waste Recycling Context
4.2.3. Social Norms, Social Influence, and Social Media
4.2.4. Government and NGOs’ Actions vs. Government Measures
4.2.5. Convenience
4.2.6. Ownership and Knowledge of the E-Waste Products
4.2.7. E-Waste Recycling Intention and Recycling Behavior
4.3. Structural Model’s Results
4.4. Contribution of Demographic Variables
4.4.1. Gender Contribution
4.4.2. Age Contribution
5. Conclusions
Author Contributions
Funding
Acknowledgments
Conflicts of Interest
Appendix A

| Issue | Acronym | Questions | Strongly Disagree | Disagree | Neutral | Agree | Strongly Agree |
|---|---|---|---|---|---|---|---|
| Attitude | AT | Recycling e-waste is part of a responsible citizen’s life (Q1) | □ | □ | □ | □ | □ |
| I believe that my e-waste recycling behavior contributes a lot to a healthy environment (Q2) | □ | □ | □ | □ | □ | ||
| Pro-environment behavior is necessary given the current development conditions (Q3) | □ | □ | □ | □ | □ | ||
| I have a positive attitude and I feel good when I recycle electronic products (Q4) | □ | □ | □ | □ | □ | ||
| Awareness | AW | I am aware of the benefits recycling e-waste has (Q5) | □ | □ | □ | □ | □ |
| I know that electronic products contain potentially toxic substances (Q6) | □ | □ | □ | □ | □ | ||
| I know that not recycling e-waste can cause environment pollution (Q7) | □ | □ | □ | □ | □ | ||
| I know that the way we manage e-waste can harm human health (Q8) | □ | □ | □ | □ | □ | ||
| Self-efficacy | SE | I know which are the items that can be recycled in e-waste recycling process (Q9) | □ | □ | □ | □ | □ |
| I know where to take my e-waste for recycling (Q10) | □ | □ | □ | □ | □ | ||
| I find it easy to participate in the e-waste recycling activities (Q11) | □ | □ | □ | □ | □ | ||
| Responsibility | RESP | I feel responsible to take actions in order to manage the level of e-waste I generate (Q12) | □ | □ | □ | □ | □ |
| I feel responsible for the environment pollution due e-waste generation (Q13) | □ | □ | □ | □ | □ | ||
| Social Norms | SN | My family expect me to engage in e-waste recycling behavior (Q14) | □ | □ | □ | □ | □ |
| My friends expect me to engage in e-waste recycling behavior (Q15) | □ | □ | □ | □ | □ | ||
| Other persons with whom I am in contact expect me to engage in e-waste recycling behavior (Q16) | □ | □ | □ | □ | □ | ||
| Social Influence | SI | Family/friends/people around me talk about e-waste recycling and/or recommend me to engage in e-waste recycling (Q17) | □ | □ | □ | □ | □ |
| Family/friends/people around me would appreciate if I engage in an e-waste recycling behavior (Q18) | □ | □ | □ | □ | □ | ||
| The opinions of family/friends/people around regarding e-waste recycling matters to me (Q19) | □ | □ | □ | □ | □ | ||
| Social Media | SM | Posts of links related to e-waste recycling appear in the newsfeed of my social media accounts (Q20) | □ | □ | □ | □ | □ |
| Posts of discussions initiated by my friends on social media related to e-waste recycling appear in the newsfeed of my social media accounts (Q21) | □ | □ | □ | □ | □ | ||
| Posts of commercials related to e-waste recycling appear in the newsfeed of my social media accounts (Q22) | □ | □ | □ | □ | □ | ||
| Posts of videos related to e-waste recycling appear in the newsfeed of my social media accounts (Q23) | □ | □ | □ | □ | □ | ||
| Government and NGOs | GNGO | The actions made by the government and/or NGOs for encouraging e-waste collection makes me happy (Q24) | □ | □ | □ | □ | □ |
| The services offered by the government ease the e-waste recycling process (Q25) | □ | □ | □ | □ | □ | ||
| NGOs are one of the main actors that encourage the e-waste recycling process (Q26) | □ | □ | □ | □ | □ | ||
| A program by the authorities for collecting electronic products for recycling from people’s houses would be useful (Q27) | □ | □ | □ | □ | □ | ||
| Convenience | CONV | Near my house there are many recycling centers for electronic products (Q28) | □ | □ | □ | □ | □ |
| I found it to be easy and convenient to access the curbside pick-ups for the e-waste (Q29) | □ | □ | □ | □ | □ | ||
| Government Measures | GM | Some specific laws on the recycling of electronic products would make me recycle more (Q30) | □ | □ | □ | □ | □ |
| I believe that if the government enforced the rules for e-waste more electronics product will be recycled (Q31) | □ | □ | □ | □ | □ | ||
| Recycling Intention | RI | I plan on recycling more e-waste even though it will not necessarily be too easy (Q32) | □ | □ | □ | □ | □ |
| I plan on participating in the recycling activities advocated in social media (Q33) | □ | □ | □ | □ | □ | ||
| I intend to put more effort into everything related to the recycling of electronic products (Q34) | □ | □ | □ | □ | □ | ||
| In the future I intend to buy electronic products that can be recycled (Q35) | □ | □ | □ | □ | □ | ||
| Recycling Behavior | RB | I recycle large household appliances (e.g., washing machines, dishwashers, air conditioners, refrigerators, microwaves, etc.) (Q36) | □ | □ | □ | □ | □ |
| I recycle small household appliances (e.g., toasters, vacuum cleaners, coffee machines, appliances for toothbrushing, shaving, hair drying, etc.) (Q37) | □ | □ | □ | □ | □ | ||
| I recycle information technology and telecommunications equipment (e.g., laptops, personal computers, notebooks, telephones, cell phones, printers, etc.) (Q38) | □ | □ | □ | □ | □ | ||
| I recycle consumer equipment (e.g., video recorders, stereo recorders, musical instruments, radios, televisions, etc.) (Q39) | □ | □ | □ | □ | □ | ||
| I recycle light equipment (Q40) | □ | □ | □ | □ | □ | ||
| I recycle other categories of e-waste (not listed above, e.g., electronical and electronic tools, leisure equipment, medical devices, monitoring and control instruments, automatic dispensers, etc.) (Q41) | □ | □ | □ | □ | □ |
References
- Gill, G.N. Electronic Waste. Available online: https://www.britannica.com/technology/electronic-waste (accessed on 4 March 2020).
- LeBlanc, R. Learn More about E-Waste Recycling with These Facts and Figures. Available online: https://www.thebalancesmb.com/e-waste-recycling-facts-and-figures-2878189 (accessed on 4 March 2020).
- Blade, C.P.; Forti, V.; Gray, V.; Kuehr, R.; Stegmann, P. The Global E-Waste Monitor. 2017. Available online: https://www.itu.int/en/ITUD/Climate-Change/Documents/GEM%202017/Global-E-waste%20Monitor%202017%20.pdf (accessed on 22 February 2019).
- Eurostat Statistics Eurostat. Available online: https://ec.europa.eu/eurostat/databrowser/view/cei_wm050/default/table?lang=en (accessed on 4 March 2019).
- Huisman, J.; Leroy, P.; Tertre, F.; Söderman, M.L.; Chancerel, P.; Cassard, D.; Løvik, A.N.; Wäger, P.; Kushnir, D.; Rotter, V.S.; et al. Prospecting Secondary Raw Materials in the Urban Mine and Mining Wastes (ProSUM). Available online: http://prosumproject.eu/sites/default/files/DIGITAL_Final_Report.pdf (accessed on 4 March 2019).
- The World Counts. Electronic Waste Facts. Available online: https://www.theworldcounts.com/stories/Electronic-Waste-Facts (accessed on 4 February 2020).
- Blake, V.; Farrelly, T.; Hannon, J. Is Voluntary Product Stewardship for E-Waste Working in New Zealand? A Whangarei Case Study. Sustainability 2019, 11, 3063. [Google Scholar] [CrossRef]
- Jaiswal, A.; Samuel, C.; Patel, B.S.; Kumar, M. Go Green with WEEE: Eco-friendly Approach for Handling E-waste. Procedia Comput. Sci. 2015, 46, 1317–1324. [Google Scholar] [CrossRef]
- Kiddee, P.; Naidu, R.; Wong, M.H. Electronic waste management approaches: An overview. Waste Manag. 2013, 33, 1237–1250. [Google Scholar] [CrossRef] [PubMed]
- Robinson, B.H. E-waste: An assessment of global production and environmental impacts. Sci. Total Environ. 2009, 408, 183–191. [Google Scholar] [CrossRef]
- Shevchenko, T.; Laitala, K.; Danko, Y. Understanding Consumer E-Waste Recycling Behavior: Introducing a New Economic Incentive to Increase the Collection Rates. Sustainability 2019, 11, 2656. [Google Scholar] [CrossRef]
- El-Mously, H. Innovating green products as a mean to alleviate poverty in Upper Egypt. Ain Shams Eng. J. 2018, 9, 2039–2056. [Google Scholar] [CrossRef]
- De Medeiros, J.F.; Ribeiro, J.L.D. Environmentally sustainable innovation: Expected attributes in the purchase of green products. J. Clean. Prod. 2017, 142, 240–248. [Google Scholar] [CrossRef]
- Zhang, W.; He, Y. Optimal policies for new and green remanufactured short-life-cycle products considering consumer behavior. J. Clean. Prod. 2019, 214, 483–505. [Google Scholar] [CrossRef]
- Dobrowolski, J.W.; Bedla, D.; Czech, T.; Gambuś, F.; Górecka, K.; Kiszczak, W.; Kuźniar, T.; Mazur, R.; Nowak, A.; Śliwka, M.; et al. Integrated Innovative Biotechnology for Optimization of Environmental Bioprocesses and a Green Economy. In Optimization and Applicability of Bioprocesses; Purohit, H.J., Kalia, V.C., Vaidya, A.N., Khardenavis, A.A., Eds.; Springer: Singapore, 2017; pp. 27–71. ISBN 978-981-10-6863-8. [Google Scholar]
- D’Adamo, I. Adopting a Circular Economy: Current Practices and Future Perspectives. Soc. Sci. 2019, 8, 328. [Google Scholar] [CrossRef]
- Liu, X.; Tanaka, M.; Matsui, Y. Electrical and electronic waste management in China: Progress and the barriers to overcome. Waste Manag. Res. 2006, 24, 92–101. [Google Scholar] [CrossRef]
- Wang, W.; Tian, Y.; Zhu, Q.; Zhong, Y. Barriers for household e-waste collection in China: Perspectives from formal collecting enterprises in Liaoning Province. J. Clean. Prod. 2017, 153, 299–308. [Google Scholar] [CrossRef]
- Miner, K.J.; Rampedi, I.T.; Ifegbesan, A.P.; Machete, F. Survey on Household Awareness and Willingness to Participate in E-Waste Management in Jos, Plateau State, Nigeria. Sustainability 2020, 12, 1047. [Google Scholar] [CrossRef]
- Sujata, M.; Khor, K.-S.; Ramayah, T.; Teoh, A.P. The role of social media on recycling behaviour. Sustain. Prod. Consum. 2019, 20, 365–374. [Google Scholar] [CrossRef]
- Statista. Social Media Penetration Rate Worldwide. 2019. Available online: https://www.statista.com/statistics/269615/social-network-penetration-by-region/ (accessed on 5 March 2020).
- Rodrigues, A.C.; Boscov, M.E.G.; Günther, W.M.R. Domestic flow of e-waste in São Paulo, Brazil: Characterization to support public policies. Waste Manag. 2020, 102, 474–485. [Google Scholar] [CrossRef]
- Kumar, A.; Holuszko, M. Electronic Waste and Existing Processing Routes: A Canadian Perspective. Resources 2016, 5, 35. [Google Scholar] [CrossRef]
- Wong, N.W.M. Electronic Waste Governance under “One Country, Two Systems”: Hong Kong and Mainland China. Int. J. Environ. Res. Public Health 2018, 15, 2347. [Google Scholar] [CrossRef]
- Steuer, B. What Institutional Dynamics Guide Waste Electrical and Electronic Equipment Refurbishment and Reuse in Urban China? Recycling 2016, 1, 286. [Google Scholar] [CrossRef]
- Lee, S.; Na, S. E-Waste Recycling Systems and Sound Circulative Economies in East Asia: A Comparative Analysis of Systems in Japan, South Korea, China and Taiwan. Sustainability 2010, 2, 1632–1644. [Google Scholar] [CrossRef]
- Xue, R.; Zhang, F.; Tian, F. A System Dynamics Model to Evaluate Effects of Retailer-Led Recycling Based on Dual Chains Competition: A Case of e-Waste in China. Sustainability 2018, 10, 3391. [Google Scholar] [CrossRef]
- Wang, Z.; Wang, Q.; Chen, B.; Wang, Y. Evolutionary game analysis on behavioral strategies of multiple stakeholders in E-waste recycling industry. Resour. Conserv. Recycl. 2020, 155, 104618. [Google Scholar] [CrossRef]
- Abarca-Guerrero, L.; Roa-Gutiérrez, F.; Rudín-Vega, V. WEEE Resource Management System in Costa Rica. Resources 2018, 7, 2. [Google Scholar] [CrossRef]
- Daum, K.; Stoler, J.; Grant, R.J. Toward a More Sustainable Trajectory for E-Waste Policy: A Review of a Decade of E-Waste Research in Accra, Ghana. Int. J. Environ. Res. Public Health 2017, 14, 135. [Google Scholar] [CrossRef] [PubMed]
- Asante, K.A.; Agusa, T.; Biney, C.A.; Agyekum, W.A.; Bello, M.; Otsuka, M.; Itai, T.; Takahashi, S.; Tanabe, S. Multi-trace element levels and arsenic speciation in urine of e-waste recycling workers from Agbogbloshie, Accra in Ghana. Sci. Total Environ. 2012, 424, 63–73. [Google Scholar] [CrossRef] [PubMed]
- Aidonis, D.; Achillas, C.; Folinas, D.; Keramydas, C.; Tsolakis, N. Decision Support Model for Evaluating Alternative Waste Electrical and Electronic Equipment Management Schemes—A Case Study. Sustainability 2019, 11, 3364. [Google Scholar] [CrossRef]
- Radulovic, V. Portrayals in Print: Media Depictions of the Informal Sector’s Involvement in Managing E-Waste in India. Sustainability 2018, 10, 966. [Google Scholar] [CrossRef]
- Isernia, R.; Passaro, R.; Quinto, I.; Thomas, A. The Reverse Supply Chain of the E-Waste Management Processes in a Circular Economy Framework: Evidence from Italy. Sustainability 2019, 11, 2430. [Google Scholar] [CrossRef]
- Cruz-Sotelo, S.E.; Ojeda-Benítez, S.; Jáuregui Sesma, J.; Velázquez-Victorica, K.I.; Santillán-Soto, N.; García-Cueto, O.R.; Alcántara Concepción, V.; Alcántara, C. E-Waste Supply Chain in Mexico: Challenges and Opportunities for Sustainable Management. Sustainability 2017, 9, 503. [Google Scholar] [CrossRef]
- Cordova-Pizarro, D.; Aguilar-Barajas, I.; Romero, D.; Rodriguez, C.A. Circular Economy in the Electronic Products Sector: Material Flow Analysis and Economic Impact of Cellphone E-Waste in Mexico. Sustainability 2019, 11, 1361. [Google Scholar] [CrossRef]
- Nduneseokwu, C.; Qu, Y.; Appolloni, A. Factors Influencing Consumers’ Intentions to Participate in a Formal E-Waste Collection System: A Case Study of Onitsha, Nigeria. Sustainability 2017, 9, 881. [Google Scholar] [CrossRef]
- Gunarathne, N.; de Alwis, A.; Alahakoon, Y. Challenges facing sustainable urban mining in the e-waste recycling industry in Sri Lanka. J. Clean. Prod. 2020, 251, 119641. [Google Scholar] [CrossRef]
- Cheng, C.; Lin, C.; Wen, L.; Chang, T. Determining Environmental Costs: A Challenge in a Governmental E-Waste Recycling Scheme. Sustainability 2019, 11, 5156. [Google Scholar] [CrossRef]
- Tonglet, M.; Phillips, P.S.; Read, A.D. Using the Theory of Planned Behaviour to investigate the determinants of recycling behaviour: A case study from Brixworth, UK. Resour. Conserv. Recycl. 2004, 41, 191–214. [Google Scholar] [CrossRef]
- Kahhat, R.; Kim, J.; Xu, M.; Allenby, B.; Williams, E.; Zhang, P. Exploring e-waste management systems in the United States. Resour. Conserv. Recycl. 2008, 52, 955–964. [Google Scholar] [CrossRef]
- Thi Thu Nguyen, H.; Hung, R.-J.; Lee, C.-H.; Thi Thu Nguyen, H. Determinants of Residents’ E-Waste Recycling Behavioral Intention: A Case Study from Vietnam. Sustainability 2019, 11, 164. [Google Scholar] [CrossRef]
- Pãcesilã, M.; Ciocoiu, C.; Colesca, S.E.; Burcea, S. Current Trends in WEEE Management in Romania. Theor. Empir. Res. Urban Manag. 2016, 11, 46–60. [Google Scholar]
- Eurostat Waste Statistics. Electrical and Electronic Equipment—Statistics Explained. Available online: https://ec.europa.eu/eurostat/statistics-explained/index.php?title=Waste_statistics_-_electrical_and_electronic_equipment&oldid=470242 (accessed on 8 March 2020).
- Urban Mine Platform. Waste Generated. Available online: http://www.urbanmineplatform.eu/urbanmine/eee/weightpercapita (accessed on 8 February 2020).
- Lakatos, E.; Cioca, L.-I.; Dan, V.; Ciomos, A.; Crisan, O.; Barsan, G. Studies and Investigation about the Attitude towards Sustainable Production, Consumption and Waste Generation in Line with Circular Economy in Romania. Sustainability 2018, 10, 865. [Google Scholar] [CrossRef]
- Kianpour, K.; Jusoh, A.; Mardani, A.; Streimikiene, D.; Cavallaro, F.; Nor, K.M.; Zavadskas, E. Factors Influencing Consumers’ Intention to Return the End of Life Electronic Products through Reverse Supply Chain Management for Reuse, Repair and Recycling. Sustainability 2017, 9, 1657. [Google Scholar] [CrossRef]
- Meng, Q.; Zhu, H.; Li, Z.; Du, J.; Wang, X.; Jeong Kim, M. How Green Building Product Decisions from Customers Can Be Transitioned to Manufacturers: An Agent-Based Model. Sustainability 2018, 10, 3977. [Google Scholar] [CrossRef]
- Delcea, C.; Cotfas, L.-A.; Trică, C.; Crăciun, L.; Molanescu, A. Modeling the Consumers Opinion Influence in Online Social Media in the Case of Eco-friendly Products. Sustainability 2019, 11, 1796. [Google Scholar] [CrossRef]
- Wang, F.; Huisman, J.; Meskers, C.E.M.; Schluep, M.; Stevels, A.; Hagelüken, C. The Best-of-2-Worlds philosophy: Developing local dismantling and global infrastructure network for sustainable e-waste treatment in emerging economies. Waste Manag. 2012, 32, 2134–2146. [Google Scholar] [CrossRef]
- Vaccari, M.; Vinti, G.; Cesaro, A.; Belgiorno, V.; Salhofer, S.; Dias, M.I.; Jandric, A. WEEE Treatment in Developing Countries: Environmental Pollution and Health Consequences—An Overview. Int. J. Environ. Res. Public Health 2019, 16, 1595. [Google Scholar] [CrossRef]
- Arain, A.L.; Pummill, R.; Adu-Brimpong, J.; Becker, S.; Green, M.; Ilardi, M.; Van Dam, E.; Neitzel, R.L. Analysis of e-waste recycling behavior based on survey at a Midwestern US University. Waste Manag. 2020, 105, 119–127. [Google Scholar] [CrossRef] [PubMed]
- Meneses, G.D.; Palacio, A.B. Recycling Behavior: A Multidimensional Approach. Environ. Behav. 2016, 37, 837–860. [Google Scholar] [CrossRef]
- Rousta, K.; Bolton, K.; Lundin, M.; Dahlén, L. Quantitative assessment of distance to collection point and improved sorting information on source separation of household waste. Waste Manag. 2015, 40, 22–30. [Google Scholar] [CrossRef] [PubMed]
- Ylä-Mella, J.; Keiski, R.L.; Pongrácz, E. Electronic waste recovery in Finland: Consumers’ perceptions towards recycling and re-use of mobile phones. Waste Manag. 2015, 45, 374–384. [Google Scholar] [CrossRef] [PubMed]
- Sivathanu, D.B. User’s Perspective: Knowledge and Attitude towards E-Waste. Int. J. Appl. Environ. Sci. 2016, 11, 413–423. [Google Scholar]
- Klöckner, C.A. A comprehensive model of the psychology of environmental behaviour—A meta-analysis. Glob. Environ. Chang. 2013, 23, 1028–1038. [Google Scholar] [CrossRef]
- D’Adamo, I.; Gastaldi, M.; Rosa, P. Recycling of end-of-life vehicles: Assessing trends and performances in Europe. Technol. Forecast. Soc. Chang. 2020, 152, 119887. [Google Scholar] [CrossRef]
- Wang, B.; Ren, C.; Dong, X.; Zhang, B.; Wang, Z. Determinants shaping willingness towards on-line recycling behaviour: An empirical study of household e-waste recycling in China. Resour. Conserv. Recycl. 2019, 143, 218–225. [Google Scholar] [CrossRef]
- Doha, A.; Elnahla, N.; McShane, L. Social commerce as social networking. J. Retail. Consum. Serv. 2019, 47, 307–321. [Google Scholar] [CrossRef]
- Asim, Y.; Malik, A.K.; Raza, B.; Shahid, A.R. A trust model for analysis of trust, influence and their relationship in social network communities. Telemat. Inf. 2019, 36, 94–116. [Google Scholar] [CrossRef]
- Kujur, F.; Singh, S. Engaging customers through online participation in social networking sites. Asia Pac. Manag. Rev. 2017, 22, 16–24. [Google Scholar] [CrossRef]
- Lim, H.; Kumar, A. Variations in consumers’ use of brand online social networking: A uses and gratifications approach. J. Retail. Consum. Serv. 2017, 51, 450–457. [Google Scholar] [CrossRef]
- Wang, F.; Jiang, W.; Li, X.; Wang, G. Maximizing positive influence spread in online social networks via fluid dynamics. Future Gener. Comput. Syst. 2018, 86, 1491–1502. [Google Scholar] [CrossRef]
- Delcea, C.; Popa, C.D.S.; Boloş, M. Consumers’ Decisions in Grey Online Social Networks. J. Grey Syst. 2015, 27, 12–27. [Google Scholar]
- Chen, C.-C.; Chen, C.-W.; Tung, Y.-C. Exploring the Consumer Behavior of Intention to Purchase Green Products in Belt and Road Countries: An Empirical Analysis. Sustainability 2018, 10, 854. [Google Scholar] [CrossRef]
- Piligrimienė, Z.; Žukauskaitė, A.; Korzilius, H.; Banytė, J.; Dovalienė, A. Internal and External Determinants of Consumer Engagement in Sustainable Consumption. Sustainability 2020, 12, 1349. [Google Scholar] [CrossRef]
- Burns, K.N.; Sun, K.; Fobil, J.N.; Neitzel, R.L. Heart Rate, Stress, and Occupational Noise Exposure among Electronic Waste Recycling Workers. Int. J. Environ. Res. Public Health 2016, 13, 140. [Google Scholar] [CrossRef]
- Barletta, I.; Larborn, J.; Mani, M.; Johannson, B. Towards an Assessment Methodology to Support Decision Making for Sustainable Electronic Waste Management Systems: Automatic Sorting Technology. Sustainability 2016, 8, 84. [Google Scholar] [CrossRef]
- Efthymiou, L.; Mavragani, A.; Tsagarakis, K.P. Quantifying the Effect of Macroeconomic and Social Factors on Illegal E-Waste Trade. Int. J. Environ. Res. Public Health 2016, 13, 789. [Google Scholar] [CrossRef]
- Kusch, S.; Hills, C.D. The Link between e-Waste and GDP—New Insights from Data from the Pan-European Region. Resources 2017, 6, 15. [Google Scholar] [CrossRef]
- Ramayah, T.; Lee, J.W.C.; Lim, S. Sustaining the environment through recycling: An empirical study. J. Environ. Manag. 2012, 102, 141–147. [Google Scholar] [CrossRef] [PubMed]
- Oakley, R.L.; Salam, A.F. Examining the impact of computer-mediated social networks on individual consumerism environmental behaviors. Comput. Hum. Behav. 2014, 35, 516–526. [Google Scholar] [CrossRef]
- Park, N.; Yang, A. Online environmental community members’ intention to participate in environmental activities: An application of the theory of planned behavior in the Chinese context. Comput. Hum. Behav. 2012, 28, 1298–1306. [Google Scholar] [CrossRef]
- Keramitsoglou, K.M.; Tsagarakis, K.P. Public participation in designing a recycling scheme towards maximum public acceptance. Resour. Conserv. Recycl. 2013, 70, 55–67. [Google Scholar] [CrossRef]
- Barr, S.; Gilg, A.W.; Ford, N.J. Differences between household waste reduction, reuse and recycling behaviour: A study of reported behaviours, intentions and explanatory variables. Environ. Waste Manag. 2001, 4, 69–82. [Google Scholar]
- Sidique, S.F.; Lupi, F.; Joshi, S.V. The effects of behavior and attitudes on drop-off recycling activities. Resour. Conserv. Recycl. 2010, 54, 163–170. [Google Scholar] [CrossRef]
- Knussen, C.; Yule, F.; MacKenzie, J.; Wells, M. An analysis of intentions to recycle household waste: The roles of past behaviour, perceived habit, and perceived lack of facilities. J. Environ. Psychol. 2004, 24, 237–246. [Google Scholar] [CrossRef]
- Zhang, D.; Huang, G.; Yin, X.; Gong, Q. Residents’ Waste Separation Behaviors at the Source: Using SEM with the Theory of Planned Behavior in Guangzhou, China. Int. J. Environ. Res. Public Health 2015, 12, 9475–9491. [Google Scholar] [CrossRef]
- Gonul Kochan, C.; Pourreza, S.; Tran, H.; Prybutok, V.R. Determinants and logistics of e-waste recycling. Int. J. Logist. Manag. 2016, 27, 52–70. [Google Scholar] [CrossRef]
- Xu, L.; Ling, M.; Lu, Y.; Shen, M. Understanding Household Waste Separation Behaviour: Testing the Roles of Moral, Past Experience, and Perceived Policy Effectiveness within the Theory of Planned Behaviour. Sustainability 2017, 9, 625. [Google Scholar] [CrossRef]
- Falcone, P.M.; Tani, A.; Tartiu, V.E.; Imbriani, C. Towards a sustainable forest-based bioeconomy in Italy: Findings from a SWOT analysis. For. Policy Econ. 2020, 110, 101910. [Google Scholar] [CrossRef]
- IBM. IBM SPSS Amos. Available online: https://www.ibm.com/ro-en/marketplace/structural-equation-modeling-sem (accessed on 6 March 2020).
- Spanos, Y.E.; Lioukas, S. An examination into the causal logic of rent generation: Contrasting Porter’s competitive strategy framework and the resource-based perspective. Strateg. Manag. J. 2001, 22, 907–934. [Google Scholar] [CrossRef]
- Delcea, C.; Bradea, I.-A. Patients’ perceived risks in hospitals: A grey qualitative analysis. Kybernetes 2017, 46, 1408–1424. [Google Scholar] [CrossRef]
- Fornell, C.; Larcker, D.F. Evaluating Structural Equation Models with Unobservable Variables and Measurement Error. J. Mark. Res. 1981, 18, 39–50. [Google Scholar] [CrossRef]
- Brown, T.A. Confirmatory Factor Analysis for Applied Research, 2nd ed.; Methodology in the Social Sciences; The Guilford Press: New York, NY, USA; London, UK, 2015; ISBN 978-1-4625-1779-4. [Google Scholar]
- Byrne, B.M. Structural Equation Modeling With AMOS: Basic Concepts, Applications, and Programming, 3rd ed.; Routledge: Abigdon, Great Britain, 2016; ISBN 978-1-317-63312-9. [Google Scholar]
- Hu, L.; Bentler, P.M. Cutoff criteria for fit indexes in covariance structure analysis: Conventional criteria versus new alternatives. Struct. Equ. Model. Multidiscip. J. 1999, 6, 1–55. [Google Scholar] [CrossRef]
- Harrington, D. Confirmatory Factor Analysis; Pocket Guides to Social Work Research Methods; Oxford University Press: Oxford, NY, USA, 2009; ISBN 978-0-19-533988-8. [Google Scholar]
- Paswan, A.; D’Souza, D.; Zolfagharian, M.A. Toward a Contextually Anchored Service Innovation Typology. Decis. Sci. 2009, 40, 513–540. [Google Scholar] [CrossRef]
- Bandura, A. Social Foundations of Thought and Action: A Social Cognitive Theory, 1st ed.; Prentice Hall: Englewood Cliffs, NJ, USA, 1985; ISBN 978-0-13-815614-5. [Google Scholar]
- Wang, Z.; Guo, D.; Wang, X. Determinants of residents’ e-waste recycling behaviour intentions: Evidence from China. J. Clean. Prod. 2016, 137, 850–860. [Google Scholar] [CrossRef]
- Ma, J.; Hipel, K.W.; Hanson, M.L.; Cai, X.; Liu, Y. An analysis of influencing factors on municipal solid waste source-separated collection behavior in Guilin, China by Using the Theory of Planned Behavior. Sustain. Cities Soc. 2018, 37, 336–343. [Google Scholar] [CrossRef]
- Chan, L.; Bishop, B. A moral basis for recycling: Extending the theory of planned behaviour. J. Environ. Psychol. 2013, 36, 96–102. [Google Scholar] [CrossRef]
- Khan, F.; Ahmed, W.; Najmi, A. Understanding consumers’ behavior intentions towards dealing with the plastic waste: Perspective of a developing country. Resour. Conserv. Recycl. 2019, 142, 49–58. [Google Scholar] [CrossRef]
- Ewing, G. Altruistic, Egoistic, and Normative Effects on Curbside Recycling. Environ. Behav. 2001, 33, 733–764. [Google Scholar] [CrossRef]
- Vining, J.; Ebreo, A. What Makes a Recycler? A Comparison of Recyclers and Nonrecyclers. Environ. Behav. 1990, 22, 55–73. [Google Scholar] [CrossRef]
- Derksen, L.; Gartrell, J. The Social Context of Recycling. Am. Sociol. Rev. 1993, 58, 434–442. [Google Scholar] [CrossRef]
- Margai, F.L. Analyzing Changes in Waste Reduction Behavior in a Low-Income Urban Community Following a Public Outreach Program. Environ. Behav. 1997, 29, 769–792. [Google Scholar] [CrossRef]
- Scott, D. Equal Opportunity, Unequal Results: Determinants of Household Recycling Intensity. Environ. Behav. 1999, 31, 267–290. [Google Scholar] [CrossRef]
- Saphores, J.-D.M.; Nixon, H.; Ogunseitan, O.A.; Shapiro, A.A. Household Willingness to Recycle Electronic Waste: An Application to California. Environ. Behav. 2006, 38, 183–208. [Google Scholar] [CrossRef]
- Oskamp, S.; Harrington, M.J.; Edwards, T.C.; Sherwood, D.L.; Okuda, S.M.; Swanson, D.C. Factors Influencing Household Recycling Behavior. Environ. Behav. 1991, 23, 494–519. [Google Scholar] [CrossRef]
- Corral-Verdugo, V. Dual ‘realities’ of conservation behavior: Self-reports vs. Observations of re-use and recycling behavior. J. Environ. Psychol. 1997, 17, 135–145. [Google Scholar] [CrossRef]
- Werner, C.M.; Turner, J.; Shipman, K.; Shawn Twitchell, F.; Dickson, B.R.; Bruschke, G.V.; von Bismarck, W.B. Commitment, behavior, and attitude change: An analysis of voluntary recycling. J. Environ. Psychol. 1995, 15, 197–208. [Google Scholar] [CrossRef]
- Schultz, P.W.; Oskamp, S.; Mainieri, T. Who recycles and when? A review of personal and situational factors. J. Environ. Psychol. 1995, 15, 105–121. [Google Scholar] [CrossRef]
- Johnson, C.Y.; Bowker, J.M.; Cordell, H.K. Ethnic Variation in Environmental Belief and Behavior: An Examination of the New Ecological Paradigm in a Social Psychological Context. Environ. Behav. 2004, 36, 157–186. [Google Scholar] [CrossRef]
- Gamba, R.J.; Oskamp, S. Factors Influencing Community Residents’ Participation in Commingled Curbside Recycling Programs. Environ. Behav. 1994, 26, 587–612. [Google Scholar] [CrossRef]
- Do Valle, P.O.; Reis, E.; Menezes, J.; Rebelo, E. Behavioral Determinants of Household Recycling Participation: The Portuguese Case. Environ. Behav. 2004, 36, 505–540. [Google Scholar] [CrossRef]
- Darby, L.; Obara, L. Household recycling behaviour and attitudes towards the disposal of small electrical and electronic equipment. Resour. Conserv. Recycl. 2005, 44, 17–35. [Google Scholar] [CrossRef]
- Arcury, T.A.; Scollay, S.J.; Johnson, T.P. Sex differences in environmental concern and knowledge: The case of acid rain. Sex Roles 1987, 16, 463–472. [Google Scholar] [CrossRef]
- Wang, Z.; Zhang, B.; Yin, J.; Zhang, X. Willingness and behavior towards e-waste recycling for residents in Beijing city, China. J. Clean. Prod. 2011, 19, 977–984. [Google Scholar] [CrossRef]
- Domina, T.; Koch, K. Convenience and Frequency of Recycling: Implications for Including Textiles in Curbside Recycling Programs. Environ. Behav. 2002, 34, 216–238. [Google Scholar] [CrossRef]
- Perry, G.D.R.; Williams, I.D. The participation of ethnic minorities in kerbside recycling: A case study. Resour. Conserv. Recycl. 2007, 49, 308–323. [Google Scholar] [CrossRef]
- Granzin, K.L.; Olsen, J.E. Characterizing Participants in Activities Protecting the Environment: A Focus on Donating, Recycling, and Conservation Behaviors. J. Public Policy Mark. 1991, 10, 1–27. [Google Scholar] [CrossRef]
- Hansmann, R.; Bernasconi, P.; Smieszek, T.; Loukopoulos, P.; Scholz, R.W. Justifications and self-organization as determinants of recycling behavior: The case of used batteries. Resour. Conserv. Recycl. 2006, 47, 133–159. [Google Scholar] [CrossRef]


| AT | AW | SE | RESP | SN | SI | SM | GNGO | CONV | GM | RI | RB | |
|---|---|---|---|---|---|---|---|---|---|---|---|---|
| Q1 | 0.796 | |||||||||||
| Q2 | 0.848 | |||||||||||
| Q3 | 0.723 | |||||||||||
| Q4 | 0.835 | |||||||||||
| Q5 | 0.580 | |||||||||||
| Q6 | 0.732 | |||||||||||
| Q7 | 0.856 | |||||||||||
| Q8 | 0.876 | |||||||||||
| Q9 | 0.864 | |||||||||||
| Q10 | 0.853 | |||||||||||
| Q11 | 0.691 | |||||||||||
| Q12 | 0.786 | |||||||||||
| Q13 | 0.773 | |||||||||||
| Q14 | 0.609 | |||||||||||
| Q15 | 0.726 | |||||||||||
| Q16 | 0.556 | |||||||||||
| Q17 | 0.713 | |||||||||||
| Q18 | 0.794 | |||||||||||
| Q19 | 0.797 | |||||||||||
| Q20 | 0.749 | |||||||||||
| Q21 | 0.573 | |||||||||||
| Q22 | 0.667 | |||||||||||
| Q23 | 0.616 | |||||||||||
| Q24 | 0.518 | |||||||||||
| Q25 | 0.837 | |||||||||||
| Q26 | 0.781 | |||||||||||
| Q27 | 0.812 | |||||||||||
| Q28 | 0.603 | |||||||||||
| Q29 | 0.837 | |||||||||||
| Q30 | 0.720 | |||||||||||
| Q31 | 0.652 | |||||||||||
| Q32 | 0.904 | |||||||||||
| Q33 | 0.600 | |||||||||||
| Q34 | 0.737 | |||||||||||
| Q35 | 0.658 | |||||||||||
| Q36 | 0.838 | |||||||||||
| Q37 | 0.833 | |||||||||||
| Q38 | 0.868 | |||||||||||
| Q39 | 0.848 | |||||||||||
| Q40 | 0.549 | |||||||||||
| Q41 | 0.692 | |||||||||||
| AVE | 0.643 | 0.593 | 0.651 | 0.608 | 0.402 | 0.591 | 0.428 | 0.560 | 0.532 | 0.472 | 0.538 | 0.634 |
| CR | 0.928 | 0.906 | 0.907 | 0.846 | 0.763 | 0.884 | 0.829 | 0.892 | 0.787 | 0.750 | 0.884 | 0.936 |
| Demographic and Socio-Economic Variables | Group/Components | Frequency | Percentage |
|---|---|---|---|
| Gender | Female | 317 | 59.59% |
| Male | 215 | 40.41% | |
| Age | 18–30 | 198 | 37.22% |
| 30–50 | 251 | 47.18% | |
| ≥50 | 83 | 15.60% | |
| Educational level | Secondary education | 157 | 29.51% |
| University | 294 | 55.26% | |
| Post-university | 81 | 15.23% | |
| Residential area | Urban | 385 | 72.37% |
| Rural | 147 | 27.63% | |
| Marital status | Single | 169 | 31.77% |
| Married | 363 | 68.23% | |
| Occupation | Services | 207 | 38.91% |
| Production | 144 | 27.07% | |
| Student | 102 | 19.17% | |
| Others | 79 | 14.85% | |
| Family size | 1–2 persons | 162 | 30.45% |
| 3–4 persons | 259 | 48.68% | |
| ≥5 persons | 111 | 20.87% | |
| Income (per month) | ≤500 € | 130 | 24.44% |
| 500–1000 € | 327 | 61.46% | |
| ≥1000 € | 75 | 14.10% | |
| Number of years in e-waste recycling | Do not practice | 112 | 21.05% |
| ≤1 year | 106 | 19.92% | |
| 1–3 years | 223 | 41.92% | |
| ≥3 years | 91 | 17.11% | |
| Number of hours spent on social media | ≤1 h | 92 | 17.29% |
| 1–2 h | 154 | 28.95% | |
| 3–4 h | 271 | 50.94% | |
| ≥5 h | 15 | 2.82% | |
| Most frequently used social media | 237 | 44.55% | |
| 57 | 10.71% | ||
| 199 | 37.41% | ||
| 36 | 6.77% | ||
| Others | 3 | 0.56% |
| Issue | Questions | Strongly Disagree | Disagree | Neutral | Agree | Strongly Agree |
|---|---|---|---|---|---|---|
| SE | I know which are the items that can be recycled in e-waste recycling process (Q9) | 10 (1.88%) | 16 (3.01%) | 53 (9.96%) | 149 (28.01%) | 304 (57.14%) |
| I know where to take my e-waste for recycling (Q10) | 21 (3.95%) | 32 (6.02%) | 86 (16.17%) | 172 (32.33%) | 221 (41.54%) | |
| I find it easy to participate in the e-waste recycling activities (Q11) | 20 (3.76%) | 30 (5.64%) | 89 (16.73%) | 178 (33.46%) | 215 (40.41%) | |
| RESP | I feel responsible to take actions in order to manage the level of e-waste I generate (Q12) | 12 (2.26%) | 18 (3.38%) | 91 (17.11%) | 170 (31.95%) | 157 (45.30%) |
| I feel responsible for the environment pollution due to e-waste generation (Q13) | 16 (3.01%) | 16 (3.01%) | 117 (21.99%) | 157 (29.51%) | 226 (42.48%) |
| Hypotheses | Relationship | Structural Path Coefficients | Decision |
|---|---|---|---|
| H1 | Attitude -> Intention | 0.277 *** | Supported |
| H2 | Awareness -> Intention | 0.202 ** | Supported |
| H3 | Self-efficacy -> Intention | 0.121 ** | Supported |
| H4 | Responsibility -> Intention | 0.083 ** | Supported |
| H5 | Social norms -> Intention | 0.075 * | Supported |
| H6 | Social influence -> Intention | 0.102 *** | Supported |
| H7 | Social media -> Intention | 0.071 ** | Supported |
| H8 | Government and NGOs -> Intention | 0.024 + | Supported |
| H9 | Intention -> Behavior | 0.608 ** | Supported |
| H10 | Government measures -> Behavior | 0.057 * | Supported |
| H11 | Convenience -> Behavior | 0.026 + | Supported |
| Hypotheses | Relationship | Structural Path Coefficients | Significance | |
|---|---|---|---|---|
| Female | Male | |||
| H1 | Attitude -> Intention | 0.307 *** | 0.261 ** | Both |
| H2 | Awareness -> Intention | 0.147 * | 0.198 ** | Both |
| H3 | Self-efficacy -> Intention | 0.063 * | 0.156 *** | Both |
| H4 | Responsibility -> Intention | 0.104 ** | 0.031 | Female |
| H5 | Social norms -> Intention | 0.095 * | 0.061 | Female |
| H6 | Social influence -> Intention | 0.098 ** | 0.087 ** | Both |
| H7 | Social media -> Intention | 0.064 ** | 0.070 * | Both |
| H8 | Government and NGOs -> Intention | 0.011 | 0.032 * | Male |
| H9 | Intention -> Behavior | 0.549 ** | 0.606 *** | Both |
| H10 | Government measures -> Behavior | 0.029 | 0.063 ** | Male |
| H11 | Convenience -> Behavior | 0.014 | 0.057 * | Male |
| Hypotheses | Relationship | Structural Path Coefficients | Significance | ||
|---|---|---|---|---|---|
| ≤30 | 30–50 | ≥50 | |||
| H1 | Attitude -> Intention | 0.251 * | 0.284 *** | 0.265 * | All |
| H2 | Awareness -> Intention | 0.174 ** | 0.222 * | 0.180 * | All |
| H3 | Self-efficacy -> Intention | 0.147 * | 0.104 | 0.087 | ≤30 |
| H4 | Responsibility -> Intention | 0.033 | 0.091 ** | 0.102 * | 30–50; ≥50 |
| H5 | Social norms -> Intention | 0.062 | 0.094 ** | 0.091 * | 30–50; ≥50 |
| H6 | Social influence -> Intention | 0.134 *** | 0.097 ** | 0.083 * | All |
| H7 | Social media -> Intention | 0.088 *** | 0.064 * | 0.049 | ≤30; 30–50 |
| H8 | Government and NGOs -> Intention | 0.042 * | 0.011 | 0.008 | ≤30 |
| H9 | Intention -> Behavior | 0.583 ** | 0.596 ** | 0.611 *** | All |
| H10 | Government measures -> Behavior | 0.040 | 0.063 | 0.059 * | ≥50 |
| H11 | Convenience -> Behavior | 0.019 | 0.031 * | 0.024 | 30–50 |
© 2020 by the authors. Licensee MDPI, Basel, Switzerland. This article is an open access article distributed under the terms and conditions of the Creative Commons Attribution (CC BY) license (http://creativecommons.org/licenses/by/4.0/).
Share and Cite
Delcea, C.; Crăciun, L.; Ioanăș, C.; Ferruzzi, G.; Cotfas, L.-A. Determinants of Individuals’ E-Waste Recycling Decision: A Case Study from Romania. Sustainability 2020, 12, 2753. https://doi.org/10.3390/su12072753
Delcea C, Crăciun L, Ioanăș C, Ferruzzi G, Cotfas L-A. Determinants of Individuals’ E-Waste Recycling Decision: A Case Study from Romania. Sustainability. 2020; 12(7):2753. https://doi.org/10.3390/su12072753
Chicago/Turabian StyleDelcea, Camelia, Liliana Crăciun, Corina Ioanăș, Gabriella Ferruzzi, and Liviu-Adrian Cotfas. 2020. "Determinants of Individuals’ E-Waste Recycling Decision: A Case Study from Romania" Sustainability 12, no. 7: 2753. https://doi.org/10.3390/su12072753
APA StyleDelcea, C., Crăciun, L., Ioanăș, C., Ferruzzi, G., & Cotfas, L.-A. (2020). Determinants of Individuals’ E-Waste Recycling Decision: A Case Study from Romania. Sustainability, 12(7), 2753. https://doi.org/10.3390/su12072753