Article

Technical, Economic, and Environmental Assessment of a Collective Integrated Treatment System for Energy Recovery and Nutrient Removal from Livestock Manure

1
Department of Agricultural and Environmental Sciences, University of Milan, 20133 Milan, Italy
2
Department of Environmental Science and Policy, University of Milan, 20133 Milan, Italy
*
Author to whom correspondence should be addressed.
Sustainability 2020, 12(7), 2756; https://doi.org/10.3390/su12072756
Submission received: 24 February 2020 / Revised: 26 March 2020 / Accepted: 30 March 2020 / Published: 1 April 2020

Abstract

:
The aim of this 5-year study was to evaluate the technical, economic, and environmental performances of a collective-based integrated treatment system for bioenergy production and nutrients removal to improve the utilization efficiency and reduce the environmental impact of land applied livestock manure. The study involved 12 livestock production units located in an intensive livestock area designated as nitrate vulnerable zone with large N surplus. The treatment system consisted of an anaerobic digestion unit, a solid–liquid separation system, and a biological N removal process. Atmospheric emissions and nutrient losses in water and soil were examined for the environmental assessment, while estimated crop removal and nutrient utilization efficiencies were used for the agronomic assessment. The integrated treatment system achieved 49% removal efficiency for total solids (TS), 40% for total Kjeldahl nitrogen (TKN), and 41% for total phosphorous (TP). A surplus of 58kWh/t of treated manure was achieved considering the electricity produced by the biogas plant and consumed by the treatment plant and during transportation of raw and treated manure. A profit of 1.61 €/t manure treated and an average reduction of global warming potential by 70% was also achieved. The acidification potential was reduced by almost 50%. The agronomic use of treated manure eliminated the TKN surplus and reduced the TP surplus by 94%. This collective integrated treatment system can be an environmentally and economically sustainable solution for farms to reduce N surplus in intensive livestock production areas.

Graphical Abstract

1. Introduction

The gradual intensification of livestock farming systems can increase their total environmental impact, resulting in higher emissions of pollutants such as greenhouse gases (GHG), ammonia (NH3), and odors that derive from housing, storage, and field application of manure and slurry. In Europe, animal manures contribute about 65% of total anthropogenic NH3, 40% of N2O, and 10% of CH4 emissions [1]. These pollutants impact environmental quality (e.g., acidification, eutrophication, climate change) and human health (e.g., respiratory diseases) even beyond the boundaries of areas characterized by high livestock intensity [2]. Moreover, when used for crop fertilization, the amount of nutrients from intensive livestock systems commonly exceeds crop requirements of local soil–crop systems. This imbalance increases the risk of nitrogen (N) and phosphorus (P) losses in water and soil [3,4,5,6], mainly via nitrate leaching (NO3) to groundwater and runoff losses of NO3, ammonium (NH4+), and phosphate (PO43−) to surface waters [7]. To address this environmental issue, different alternatives for improving management of nutrients in livestock manure have been developed and most have achieved satisfactory performances. The feasibility of any manure treatment system depends on its size, the required level of nutrient removal, the possibility to produce bioenergy, and the cost of installation and operation [1,8]. Hence, there is no universally suitable technological strategy that is adapted to every specific and local condition [9]. However, the integration of various treatment systems can be an effective way to achieve higher overall efficiencies than can be accomplished in single systems. To reduce the nutrient surpluses in manure and slurry, two approaches can be adopted: nutrient recovery and nutrient removal. In both cases, anaerobic digestion (AD) can be considered as a relevant process step because, even if it does not affect the nutrients content [9,10], it facilitates economic income and produces an effluent adaptable to downstream treatment for either recovering nutrients [11,12,13,14] or removing nutrients [15]. Commonly, AD reduces GHG emissions, however during the storage period and in some cases in land application, the digestate could cause higher emissions of GHG than raw manure [16]. To identify the most suitable type of integrated treatment system for a specific situation, it is necessary to assess the magnitude of nutrient surplus at both farm and regional scales. Where the N surplus is small at both scales, a sufficient solution can be to relocate a manure application site or, for a slurry-based system, to introduce solid–liquid separation, because the solid fraction is easier and more economical to transport farther or export to other farms than is slurry [17].
When the N surplus cannot be effectively managed through relocation, solid–liquid separation can represent a valuable pre-treatment for subsequent nutrient removal or recovery. Removal can be accomplished through nitrification–denitrification (NDN) systems and sequencing batch reactor (SBR) treatment plants [8,18,19,20,21]. N recovery can be accomplished by ammonia stripping [14], membrane filtration followed by cold stripping [22], or by struvite formation [23,24]. These management solutions can be applied on an individual farm or on a centralized basis to service many farms, depending on whether the nutrient surplus exists at farm or regional scale, or on the technological complexity of the process [9]. Small or medium-sized farms located in intensive livestock production areas can more easily access treatment systems for managing their N surpluses if they adopt a collective-based management system. However, constituting a collective management system depends first on whether farmers have a shared goal and the capability to cooperate [25]. The second requirement is that a sufficient total quantity of livestock manure exists and is located within an acceptable distance that facilitates economical transfers [20,26]. Nevertheless, the implementation of full-scale collective treatment systems is limited [8,10,27]. Besides satisfying technical, economic, and energetic requirements, a treatment system must also satisfy agronomic and environmental objectives [26,28,29]. From a technical perspective, it is important to verify both the correct functioning of every treatment and the appropriate characteristics of the outputs that become inputs for subsequent treatment processes. With respect to the economic aspects, a treatment system can be considered feasible and sustainable if the cost–benefit ratio is optimized. For example, an expensive treatment process such as biological aerobic treatment becomes economically feasible only if accompanied by a treatment that produces an economic income (e.g., anaerobic digestion) or if shared among several farms (i.e., collective management). Closely linked to economic constraints, energy-related considerations are important because they include monitoring energy consumption and production, which could offset consumption. A successful treatment system must also address agronomic considerations, and it is fundamental to evaluate if it produces an output with a balanced nutrient content, compared to crop requirements. Evaluation of environmental aspects must consider that a treatment technology can reduce the emissions of some pollutants but could increase other emissions. However, this pollution “swapping” is difficult to assess and prevent because of complex interactions between emission processes and their process variables [30]. Therefore, detailed studies of a potential treatment system should be performed prior to selection and installation.
The objective of this study was to evaluate the performance of a collective-based integrated treatment system for bioenergy production and nutrients removal in the nitrogen vulnerable zone (NVZ) of the Lombardy region (Northern Italy) and compare it as an alternative to the conventional on-farm manure management systems commonly used. The plant was monitored for 5 years to collect data to assess its technical, economic, agronomic, energetic, and environmental performances. Each unit process of the integrated treatment system (manure receiving, treatments, storage, and transport) was analyzed by monitoring the amount and composition of input, energy consumption/production, efficiency of treatment, and amount and composition of output returned to the farms.

2. Materials and Methods

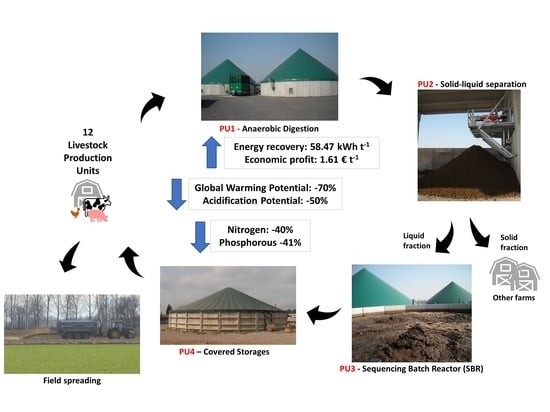
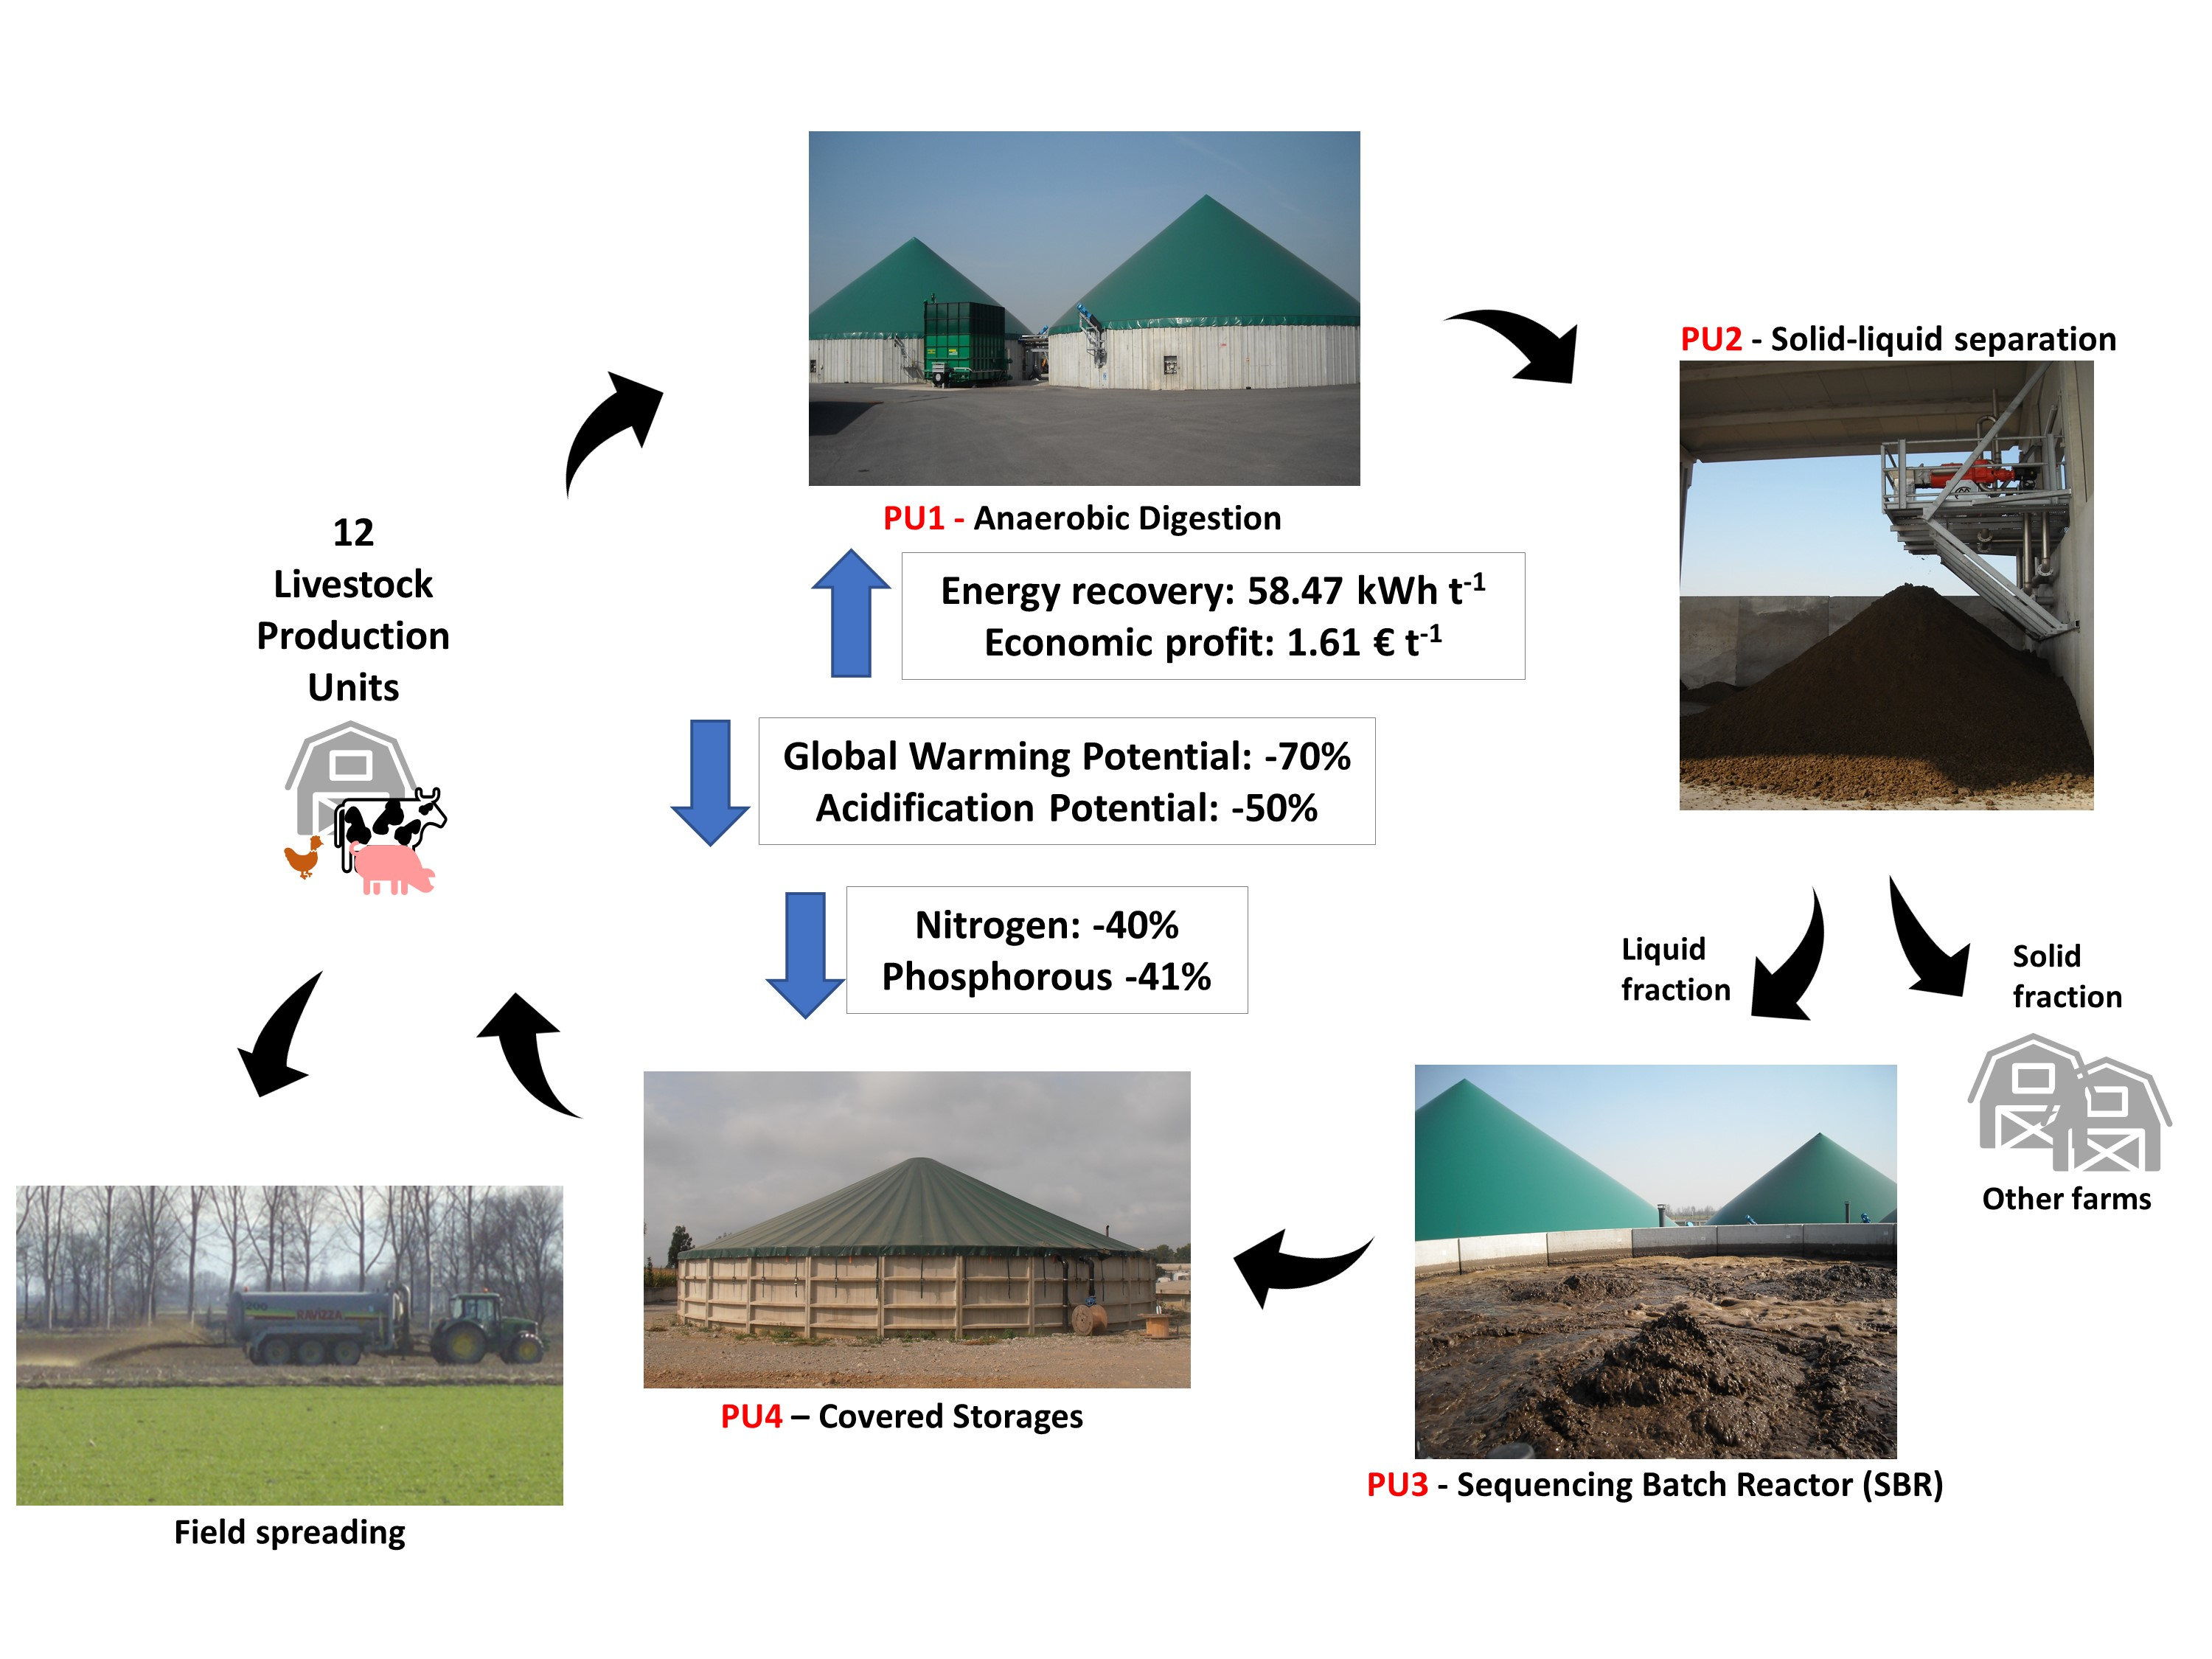
2.1. Description of the Management System

The treatment system was a collective treatment plant that consisted of four main process units (PU). As shown in Figure 1, the PUs were: an anaerobic digestion plant (PU1) for energy production, a solid–liquid separation system (PU2), a biological N removal plant, through a NDN process (SBR, PU3) and manure storage facilities (PU4). The whole plant was controlled by programmable logic controllers (PLCs) for each PUs and the flow of materials was traced by the recordkeeping system of the plant. The collective plant was located in Bergamo province (Martinengo, Lombardy, Italy), an intensive production livestock area that had a large surplus of N and was designated as an NVZ. Therefore, the maximum amount of N from livestock manure for field spreading is 170 kg N/ha year.
The collective treatment plant served 12 livestock production units (LPUs) belonging to 10 farms (cattle, pigs, and poultry) located 0.5–6 km from the plant, which delivered in total around 280 m3/d of manure to the plant. The manure consisted of cattle slurry (93.56%), pig slurry (2.5%), farmyard manure (2.10%), and poultry litter (1.84%). The manure was integrated with co-substrates (maize silage, flour cereals, and molasses) to give an input feed rate of about 10 t/d. The products leaving the plant were the solid fraction of digestate (sold to farms outside the collective) and the liquid fraction of digestate after being treated for N removal, which was transported back to the collective farms. The utilized agricultural area (UAA) available for field application of the outputs was 452 ha, mainly cultivated with grass, cereals (Hordeum vulgare, Triticum aestivum), and maize (Zea mays). Part of this agricultural area (170 ha) was managed in double cropping and the rotation was herbage (Lolium multiflorum) followed by maize silage.

2.2. Scheme of the System and Treatment Units

The processing line of the collective treatment plant consisted of the following steps.
Reception and Mixing. Raw slurry received from the 12 LPUs was collected in to an 885 m3 reception pit, with a retention time of approx. 3 days. The co-substrates were stored in a silage clamp, while solid manure and poultry manure were stored on a manure pad. Slurry was transported by slurry tanker, except that from the closest farm, which was transferred by means of a pipeline. Solid products were moved with a loading hopper and raw slurry was withdrawn from the reception pit.
Anaerobic Digestion (PU1). The collected slurry and added co-substrates were treated in the AD plant for energy production. AD took place at mesophilic temperature (38–40 °C) in two stirred digesters, followed by two stirred post-digesters in line. The total volume of digesters was 4560 m3, while the post-digesters had a combined capacity of 6370 m3, providing a total hydraulic retention time (HRT) of 38 d. The produced biogas was dehumidified, chilled, and treated to remove hydrogen sulfide (H2S) and then used to feed the combined heat and power (CHP) unit (999 kW). Some heat was used to maintain digesters and post-digesters at mesophilic temperature.
Solid–liquid separation (PU2). The digested slurry leaving the post-digesters went through a screw-press (SM260, Cri-man S.p.A., Italy), in the first two years to separate solids and liquid; thereafter the screw-press was replaced by a decanter centrifuge (Jumbo 2, Pieralisi, Italy). The solid fraction was stored and sold to nearby horticultural farms, while the liquid fraction was directed to the next treatment step (PU3) for nitrogen removal.
Biological nitrogen removal (PU3). The liquid fraction was treated using an NDN process to remove N [19,20,21]. This treatment was carried out in two SBRs reactors of 660 m3 each, in which four operational phases occurred: (i) fill and draw phase (during which liquid fractions were pumped into the reactors and treated slurries were conveyed to storages); (ii) mixing phase (denitrification); (iii) aerobic phase (nitrification); and (iv) sedimentation phase.
Final storage (PU4). The treated effluent from the SBRs was pumped to the final storage that consisted of two covered storage tanks of 7750 m3 total volume. Trucks and slurry tankers collected the effluent and returned it to farms participating in the collective, where it was stored prior to field application as organic fertilizer.

2.3. Monitoring and Data Collection

The treatment plant was monitored following the common evaluation and monitoring protocol developed in the European Union-sponsored LIFE +MANEV project (LIFE09 ENV/ES/000453) [8]. Monitoring covered 5 years of steady operation of the treatment plant (January 2011–December 2015). Information (e.g., operation records) and data were collected at three frequencies.
Daily records: The main parameters of the process line and of each process unit at key points were recorded automatically and manually daily. These included incoming daily flows (raw slurry, co-substrate biomasses, and solid manure) and outgoing daily flows (solid fraction of digestate and liquid fraction of digestate after SBR treatment), temperatures, pH, energy production and consumption, biogas quality in PU1, and temperatures, pH and dissolved oxygen (DO) in PU3.
Monthly sampling of manure: Representative samples of manure in each process unit were collected monthly. Analyses of the samples for total solids (TS), volatile solids (VS), total Kjeldahl nitrogen (TKN), total ammoniacal nitrogen (TAN), pH, electrical conductivity (EC), total phosphorus (TP), and potassium (K) were performed according to standard methods [31].
Periodical data: Analyses of pathogenic agents (E. coli and Salmonella) and heavy metals copper (Cu2+) and Zinc (Zn2+) in treated effluent from the SBRs, and of the biomasses used as feedstock were performed periodically. Analysis of NO2-N and NO3-N, and measures of redox status and conductivity were made on samples taken periodically from the SBR reactors.
The monitoring of emissions from SBR reactors was carried out during three different periods (i.e., spring, late spring, and summer). In each period, one of the SBRs was monitored during one 6-h cycle that included the four phases: 30 min for phase 1 (fill and draw phase), 2 h 30 min for phase 2 (mixing phase), 2 h 30 min for phase 3 (aerobic phase), and 30 min for phase 4 (sedimentation phase). GHG and NH3 emissions were measured using a dynamic chamber method [32,33] from the surface of SBR contents. Measurements were performed by using floating funnel systems [34] placed at two different points on the slurry surface. Each measuring system covered 0.07065 m2 of slurry surface and consisted of a polyvinyl chloride funnel fixed on floats, a vacuum pump, a volume meter, and a flow meter. Airflow through the funnel system was approximately 9 L/min. The system was connected to a photoacoustic gas trace analyzer (P-TGA, 1302 Photoacoustic gas-monitor, Innova AirTech Instruments, Denmark) to measure GHG (CH4, CO2, and N2O) and NH3 concentrations.
The instrument was operated using automatic corrections for cross interferences between CO2-H2O and N2O and between CO2-H2O and CH4 [35,36]. Fluxes were calculated using Equation (1):
F = (Q × (Cin − Cout))/A,
where F is the GHG flux (mg/m2/h), Q is the air flux (m3/h), Cin is the NH3, N2O, CH4, and CO2 concentrations of the air above the slurry surface covered by the funnel (mg/m3), Cout is the corresponding background GHG concentrations in air (mg/m3), and A is the funnel surface (m2).

2.4. Mass Balance and Nutrient Balance

The mass balance of the integrated treatment plant was determined considering flows among the individual PUs based on the data collected during the 5-year monitoring (Section 2.3). Input substrates to AD, the solid fraction from AD, and the effluent from the storage after SBR treatment were weighed. The digestate leaving AD that was sent to the solid–liquid separator could not be measured but was quantified by summing the amounts of solid and liquid fractions. The liquid fraction to SBR was considered equal to the effluent from SBR. The balance of TS and nutrients (TKN, TAN, and P) was determined using the mass balance of liquid and solid fractions and the concentrations determined by the chemical analyses performed at each step of the integrated treatment system.

2.5. Methodology to Assess the Manure Management System

Six criteria were selected and analyzed for the global evaluation of the manure management system. The four main criteria were environment, agronomy, economy, and energy. Social and biosecurity considerations completed the evaluation framework (Table 1). Each criterion included a list of indicators quantified through specific parameters and homogenized based on reference units using characterization factors.

2.5.1. Environmental Balance

Contributions of the 12 LPUs to N and P release in soil and water were evaluated with and without consideration of the integrated treatment plant. For the case that included the treatment plant, the average annual quantity of N and P that left the treatment plant (PU4) was quantified to assess land availability for field application of the effluent in the NVZ. In practice, the effluent leaving the SBR plant was transported to farms to be stored prior to land application. During this storage on the farm, N losses occurred and, in compliance with national regulations, were considered equal to 15% [37]. The amounts of N and P leaving PU4 were compared with the land available for the effluent distribution after treatment in the plant. Nutrients contained in the separated solids were not counted because they were relocated to farms outside the collective. For the case ignoring the treatment plant, based on the amounts of nutrients input into the treatment plant, it was possible to estimate the amount of land needed for field application, considering the average annual quantity of nutrients that farmers should have managed without the collective treatment plant. In addition for this case, N losses from storage were considered equal to 15%. Periodical analysis of Cu2+ and Zn2+ contents of the liquid fraction of digestate allowed to assess the load of these heavy metals on the 452 ha available for land application of digestate. Swine slurry is the most critical slurry for heavy metals contamination [38], but in this treatment plant, only 2.5% of the total treated slurry derived from swine livestock system. The Cu2+ and Zn2+ content applied to the soil is similar to the initial slurry content and the amount applied is in balance with crop uptake [38]. This applies also to the solid fraction as, although it has a higher concentration of heavy metals, it is applied to the soil at a lower dose. Atmospheric emissions of CO2, CH4, N2O, NOx, NH3, and SO2 were calculated separately for each stage of the slurry management, both with and without considering the treatment plant, to estimate global warming potential (GWP) and acidification potential (AP) in accordance with [27]. In more detail, IPCC Tier 2 and Tier 3 were used for CO2, CH4, and N2O emissions assessment, while EEA Tier 2 for NOX and NH3, and EEA Tier 1 for SO2 emission. This was carried out for every phase of the slurry management, therefore including storage, transport, and field application [39,40].

2.5.2. Agronomic Balance

The agronomic balance was determined by evaluating the N and P applied to the available land (inputs) with respect to the crop requirements (uptake). The balance considered the 12 LPUs and was evaluated both with and without considering the integrated treatment plant. In the case without the treatment plant, the N and P available for application was the average annual quantity of nutrients in livestock manure conferred by the 12 LPUs. Whereas, for the case with the treatment plant, N and P available for application was the average annual quantity of nutrients leaving the SBR plant (PU3). Nutrients contained in the solid fraction were not included in the balance as they were relocated to farms outside the collective. Similar to the evaluation of the environmental balance, N losses of 15% due to on-farm storage were assumed. For both N and P, the “effective” amounts (i.e., plant available amounts) were determined using values fixed in regional action plans for the implementation of the European Union’s “Nitrate Directive 91/676/CEE” [37] and national rural development programs [41]. The amount of effective N was calculated as a weighted average among different types of manure and slurry and their respective efficiency values (utilization efficiency) established by regional regulations. In particular, cattle slurry and manure and other biomasses had an efficiency value of 50% (or 55% for digested material), pig slurry was assigned 60% (65% digested), and poultry manure had a value of 60% (65% digested). The effective P was established at 75% of total P.

2.5.3. Economic Balance

Assessment of the economic performance of the manure treatment system included the incomes and expenses for the treatment plant process units (AD, solid–liquid separation, SBR, and storage) and transport costs of materials to and from the plant. Incomes were derived almost entirely from the electricity sold, and to a much lesser extent, from the sale of solid fraction. Because the electricity produced at the plant was generated from renewable sources, it benefitted from public subsidies (280 €/MWh) established by the national law 99/2009 for renewable energy production. The expenses included: consumption of electricity for AD and SBR, consumables, such as reagents used in the plants operation (flocculants, coagulants, and antifoaming agents), maintenance of the treatment plant’s equipment (replacement of devices, lubricating oil, etc.), wages for staff according to the number and qualifications of employees operating the treatment plant, transport of raw manure, by-products and end products, acquisition of co-substrates, external assistance, taxes and insurance, and other costs such as depreciation (asset costs, including all costs related to project, building, and starting up) and financing costs (the price of obtaining loan capital).

2.5.4. Energy Balance

An energy balance was determined considering both energy consumption and production. Energy production was calculated as the electricity produced by the CHP unit and sold net of self-consumption within the treatment plant, as recorded daily. The heat produced by the CHP unit was used partially to heat digesters, while the surplus was dissipated. The heat energy was therefore not included in the energy balance. Energy consumption included the electricity consumed daily by the AD and SBR process units and the fuel consumed during transport of materials to and from the treatment plant. Manure/slurry from the 12 LPUs was transported to the treatment plant and SBR effluent was transported from the plant back to these farms. The solid fraction arising from treatment was sold and transported to farms outside the collective. Given the large number of transits, it was assessed the impact of fuel consumption associated with the transport of manure/slurry, SBR effluent, and solid fractions by both slurry tankers and trucks. The number of transits to and from the plant, the total weight of the effluent input and output, and the average weight of each transit were accounted. Total fuel consumption was calculated following guidelines from the Intergovernmental Panel on Climate Change [40].

2.5.5. Social Impact and Biosecurity

The social impact of the collective treatment plant was assessed by examining three factors: odor, noise, and impact on local activity. Odor was measured following the standardized dynamic olfactometry method defined by EN-13725 “Air quality—Determination of odor concentration by dynamic olfactometry” [42]. Noise was assessed directly following the standardized methodology and reference limits specified by Directive 2002/49/CE. Impact on local activity was assessed by quantifying the number of hours of employment created by the collective treatment plant. Biosecurity was assessed by characterizing E. coli [43] and Salmonella according to [44], in livestock manure. The assessment was made analyzing samples of raw manure and end-products produced by the treatment plant.

3. Results and Discussion

3.1. Mass Balance and Nutrient Balance

The 5-year sampling plan produced the necessary data to quantify mass and nutrient balances. In total, 59 samples were collected from slurry and manure received by the treatment plant, as were 37 samples of digestate after anaerobic digestion, 26 samples of liquid fraction, 27 samples of solid fraction, and 94 samples of SBR effluent. The mass balance for the treatment plant is summarized in Figure 2. The overall performance of the treatment system was 66%, 40%, 38%, 41%, respectively for TS, TKN, TAN, and TP.

3.1.1. Anaerobic Digestion (PU1)

During the 5 years, the average feeding of the AD plant (PU1) was 105,931 metric tons (t)/y, corresponding to 290 t/d. The residual digestate mass after AD was 101,658 t/y, corresponding to 4% less than the input feeding mass. This reduction was due to the production of biogas (4364 t/y) and it was comparable to the findings by Schievano et al. [45]. They reported a similar biogas production in plants with the same electrical power installed but fed with biomasses with a higher TS content (12.1%–18.4%) which resulted in a mass reduction of digestate around 8.3%–13.3%. The mass reduction was comparable to the reduction of TS content from 7.90% in the feedstock to 4.24% in the digestate, which corresponded to 4000 t of TS present in digestate (about 49% less than the feedstock TS). In this case, Schievano et al. [46] showed a much higher values around 63%–73%, probably due to the initial TS in feedstock. TKN concentration in digestate (3.64 kg/t) was very close to that of the feedstock (3.67 kg/t), but the total mass of TKN decreased during AD by about 5%, from 389,000 kg in feedstock to 370,000 kg in digestate after AD. In [45], the reduction was close to this value in two of the three plants studied (5.9%–6.0%), while it was higher in the third (9.2%). Even if minor (<1%), this N decrease could be connected to the precipitation of struvite [23] and ammonium carbonate, while traces of N were volatilized in the biogas stream, as also found by [47]. TP exhibited a similar mass decrease of 5%, from 120,000 kg in AD feedstock to 113,000 kg in digestate; this was probably due to settlement of material to the bottom of digesters. The TP reduction was lower than that found by [45,47], who generally observed small TP reductions (i.e., <10%), although these could be as much as 36%. TAN concentration increased by about 24% (from 1.81 to 2.34 kg/t) during AD due to the mineralization of organic matter. In the two plants fed with agricultural feedstock studied by [45], the increases of TAN were comparable (20.6%–27.7%).

3.1.2. Solid–Liquid Separation (PU2)

After solid–liquid separation (PU2) of AD digestate, the solid fraction amounted to about 5090 t/y. Relative to the amounts in AD digestate, the solid fraction from PU2 contained an average of only 27% as much TS, 9% as much TKN, 5% as much TAN, and 19% as much TP. Solid–liquid separation was a key treatment process. First, because the solid fraction from PU2 was sold to farms outside the collective, this process reduced the nutrient load to be managed on the collective farms. Second, PU2 removed the coarse solids from the AD digestate, which made the remaining liquid fraction more amenable for subsequent biological N removal. Given the importance of PU2, the screw-press separator used for the first two years was replaced by a centrifuge decanter. As a result, the TS removal efficiency of PU2 increased from 13% (screw-press) to 35% (centrifuge decanter); likewise, removal efficiency increased from 3% to 13% for TKN, and from 6% to 30% for TP. These values were generally lower than those reported by [17], who determined the separation index (namely the mass of a component in the solid fraction compared to the mass of the same component in the original raw slurry) for the screw-press to be 11% for volume, 37% for dry matter (DM), 15% for TKN, and 17% for TP. The separation index for the decanter centrifuge studied by [17] showed a better performance, equal to 14% for volume, 61% for DM, 28% for TKN, and 71% for TP.

3.1.3. SBR Treatment Plant (PU3) and Final Storage (PU4)

The last process of the integrated treatment system included biological N removal from the liquid fraction of AD digestate and was carried out in the SBR. The digestate after the SBR plant (PU3) treatment was stored for a short period in covered storages (PU4) before being brought back to farms, and the analyses were performed on samples taken from these storages. The SBR reduced TKN by 30% and TAN by 47%. The TP content was reduced by 23%, probably due to sedimentation of cellular biomass as sludge at the bottom of the reactors [48]. TKN, TAN, and TP removal rates achieved by the SBR were far less than those reported by other authors in studies at the laboratory or pilot scale; frequently removals of over 90% for both TKN and TAN were observed [49,50,51]. For full scale studies on pig slurry, TKN and TAN removal rates ranging from 66% [52] to 90% [53] were reported. Some authors reported P removal efficiencies of 48.8%–70.6% [48,49,50,51,52]. Figure 3 portrays the variation in dissolved oxygen (DO) content in the SBR during one working day of the reactor (four cycles). The oxygen content increased quite slowly during the aeration phase due to the high oxygen requirement by microorganisms for the degradation of organic matter. DO content in the aerobic phase remained between 3.5 and 4.0 mg/L. The pH showed limited variation during the process, assuming the value 9 during anoxic (phase 2) and 9.15 during aerobic phase (phase 3). The pH values recorded in the SBR plant were higher compare to values of digestate (7.8 ± 0.18) and liquid fraction of digestate in input in the SBR plant (8.1 ± 0.2). The reason for this increase of pH value could be caused by the stripping of CO2 due to aeration [54].
Figure 4 shows the concentration of NH3, CH4, CO2, and N2O in the air just above the surface of the SBR contents during one cycle (6 h) of operation. During the aerobic phase (i.e., phase 3), NH3 concentrations reached their maximum values (95 mg/m3), as did CO2 concentrations (average concentration of 2900 mg/m3). N2O concentrations during treatment were low and stable during all four phases, whereas CH4 concentrations were variable (10–70 mg/m3).
Similar to NH3 concentrations, NH3 emission fluxes were much higher during the aerobic phase than in the anoxic (phase 2). The highest NH3 emission flux (360 mg/m2/h) was recorded at the end of the aerobic phase (i.e., last 30 min of aeration). During the anoxic phase, NH3 fluxes were similar to those observed during the fill-and-draw and sedimentation phases (150 mg/m2/h) (phases 1 and 4, respectively). N2O emission flux also varied during the SBR cycle. The mixing phase (anoxic conditions) contributed more to N2O emissions than the subsequent aerobic phase. During the fill-and-draw and sedimentation phases, N2O emissions were close to 0. CO2 and CH4 emission fluxes were also much higher during the aerobic phase than in the anoxic. The higher CH4 emissions in the aerobic phase were probably due to CH4 stripping that was produced during the previous anoxic phase. Table 2 shows the values of gaseous emissions from the SBR calculated on a daily basis (g/m3/d) based on observations during the 6 h of monitoring in each of the three monitoring periods (spring, late spring, and summer). Results are reported per phase in the cycle.
On a daily basis, the average emission of NH3 was 1.08 g/m3/d, with a maximum emission rate of 2.4 g/m3/d. As shown in Figure 2, the reduction of TKN content due to biological aerobic treatment was 1.06 kg/m3 (from 3.48 to 2.42 kg/m3). Therefore, NH3 emission from the SBR compared with the N removed was negligible (≈ 0.1%). Low daily emissions of N2O and CH4 were observed (0.01 and 0.63 g/m3/d, respectively), but the daily emission of CO2 was 23.36 g/m3/d. Loyon et al. [55] reported emissions per unit volume of biologically treated slurry to be 15.11 g/m3 NH3, 35 g/m3 N2O, 996 g/m3 CO2, and 437.7 g/m3 CH4, which were higher respect to all gaseous emissions from the SBR. The differences for CO2 and CH4 in the two studies may depend on AD, which was absent in [55]. In the present study, AD reduced the TS content of digestate, thus reducing the amount of carbon that could be removed as CH4 and CO2 during SBR treatment.

3.1.4. Comparison with Other Case Studies

Overall, the integrated treatment plant removed 40% of TKN and 41% of TP from feedstock. These reductions depended especially on the relocation of the solid fraction of AD digestate to non-collective farms and on the effectiveness of the SBR treatment. Relocation of solid fraction eliminated 33,000 kg/y of TKN (8.6% of the initial TKN content of feedstock) and 22,000 kg/y of TP (18.2% of the initial TP content in feedstock). The SBR reduced the TKN content of the liquid fraction of AD digestate by 102,000 kg/y (i.e., by 30.0%) and the TP content by 21,000 kg/y (i.e., by 23%).
Although no similar treatment plant as the one analyzed in this study was found in literature, several research studies have been done on treatment plants composed of multiple treatment processes. Most of them treat swine slurry achieving higher performances in the reduction of TKN and TP than digestate, probably because swine slurry has a lower TS content and a higher TAN /TKN ratio that make them easier to treat. For example, [8] studied various full-scale integrated treatment plants consisting of solid–liquid separation, coagulation–flotation, and NDN, and reported 91% TKN removal and 89% TP removal. The researchers reported similar performance (85% TKN removal; 86% TP removal) for a Sharon-SBR biological treatment process that was preceded by AD and solid–liquid separation. Removal efficiencies higher than 90% for TKN and TP were reported also by [56] who analyzed an integrated treatment plant with solid separation, nitrification–denitrification, and soluble phosphorus removal/disinfection, as well as by [57] who treated swine slurry in AD, followed by flocculation and struvite precipitation, a biological treatment to co-cultivate algae and bacteria, and a final advanced treatment with activated carbon adsorption. When digestate was treated in integrated treatment plants, the technologies used were different and the removal efficiencies were lower. Ledda et al. [22] examined an integrated system consisting of AD, solid–liquid separation, membrane separation (ultrafiltration and reverse osmosis), and ammonia stripping. They reported a 22% recovery of TKN (as ammonium sulfate) from cattle manure digestate and 45% TKN recovery from pig manure digestate. For a similar plant, but without the final treatment of ammonia stripping, [58] showed performances in line with those of Ledda et al. [22]. They observed a TKN recovery in reverse osmosis of 17% from cattle manure digestate and 41% from pig manure digestate.

3.2. Assessment of the Manure Management System

Table 3 reports the results of the evaluation of the six criteria described in Table 1, and highlights that for all criteria, the scenario without the treatment system has worse results than the one with the treatment system. The economic and energetic criteria have values equal to zero in the case without treatment because the manure management in the farm after treatment is the same than without treatment.

3.2.1. Environmental Balance

The average annual amount of TKN into the treatment plant as feedstock was 389,000 kg (368,000 kg from livestock manure/slurry and 21,000 kg from other types of biomass), and the average annual quantity leaving the SBR was 234,000 kg. This reduction was of almost 40% and included TKN exported to farms outside the collective. Ignoring the treatment plant, the TKN produced by the 12 LPUs in the collective (and reduced by 15% for the N losses due to on-farm storage) amounted to 312,800 kg. When distributed over the 452 ha of land available of the 10 farms, the applied TKN corresponded to 692 kg N/ha, which was 522 kg N/ha higher than allowed. Thus, without the treatment plant, a further area of 1388 ha would be needed to reduce the N load to the 170 kg/ha allowed by law [4]. As noted above, the TKN leaving the SBR was 234,000 kg. However, this amount was reduced to 189,000 kg considering that 95% of the TKN originated from livestock and that 15% of the N was lost from on-farm storage. To comply with the limitations of the Nitrate Directive (170 kg N/ha) and considering the 452 ha of land available at the collective farms, an additional land of 660 ha was needed to accommodate this TKN load. Ignoring the treatment plant, the production of P by the 12 LPUs was 115,000 kg that would result in a quite high dose of 254 kg P/ha when applied to the 452 ha. However, considering the treatment plant, the P leaving the SBR was 71,000 kg. If applied uniformly, it would result in 157 kg P/ha, which is still quite high but much lower than for the case without the treatment plant. As in the previous case, also for P, the availability of additional land for slurry spreading would help in reducing the amount of nutrients applied on field. Alternatively, the residual surplus of P could be solved by introducing an additional treatment step to enhance P removal with a struvite precipitation [23] or P precipitation by adding Ca(OH)2 or Al2(SO4)3 [59].
The analyses of heavy metals on the treated effluent from the SBRs showed a low content equal to 4.31 and 14.17 mg/kg, respectively for Cu2+ and Zn2+, compared to data reported for pig and cattle slurry [38,60,61], the effluent of this integrated treatment system could be considered as low impacting on soil pollution in regard of heavy metals load.
The contribution of the treatment plant emissions to GWP was 20.79 kg CO2 eq./t of treated manure, while AP was 0.90 kg SO2 eq./t of treated manure. Compared to the management system without the treatment plant, the system with treatment reduced GWP by 70% and AP by almost 50%. These results are in line with [8,62]. The GWP reduction obtained with the treatment system was greatly influenced by the renewable energy production achieved by AD (−35%), by the low CH4 emissions (6% from the treatment plant and 34% from farm storage), by the low N content of treated effluent in the final storage, and by the land application of treated AD digestate. Regarding AP, the reduction was mainly due to the reduced release of NH3 emissions from the treatment plant (17%) and from the final storage and land application (81%), while NOX and SO2 had a very limited contribution to AP.

3.2.2. Agronomic Balance

The amounts of N and P produced by the 12 LPUs were evaluated in comparison to the crop requirements, and Table 4 reports this balance. Considering that grass, cereals, and maize were the main crops cultivated on the 452 ha of UAA of farms, and considering the presence of about 170 ha in double cropping (herbage + maize silage), the total annual uptake of crops results in 159,347 kg N (352 kg/ha) and 51,046 kg of P (113 kg/ha). Without the treatment plant, 52% of the N produced by the 12 LPUs net of storage losses (163,000 kg or 361 kg/ha) was considered available to satisfy crop requirements. With the treatment plant, the N output from PU4 was 234,000 kg; considering the losses from storages (15%) and a N efficiency equal to 57%, which (due to AD) was greater than that in the case without treatment, the effectively available N leaving the PU4 amounted to 113,000 kg (250 kg/ha). Hence, crop requirements for N exceeded the amount of N available in the treated effluents, requiring to supplement the treatment-supplied nutrients with mineral fertilizer. Without the treatment plant, effective P (75% of total P) deriving from the 12 LPUs amounted to 86,250 kg (191 kg/ha). In contrast, the treatment plant yielded 53,250 kg of effective P (118 kg/ha). In both cases, the crop requirements for P were lower than the amount supplied by either raw manure or treated effluents. Although this surplus was much lower (by approximately 94%) in the system with the treatment plant, to eliminate the residual P surplus, additional treatment steps could be introduced [23,59].

3.2.3. Economic Balance

The incomes and expenses relevant to the entire treatment process (AD, solid–liquid separation, SBR, and storage) included on-site storage and transport costs (from farms to plant and vice versa). The current income (99% from energy production and 1% from the sale of solid end-products) was 18.43 €/t of treated feedstock and the ongoing cost amounted to 16.82 €/t of treated feedstock, generating an economic profit of 1.61 €/t. The expenses for the treatment system were mainly attributed to co-substrates (27%), depreciation (19%), maintenance (18%), and transportation (17%), manpower (5%), interest (4%), external assistance (3%), other cost (energy consumption, tax and insurance, consumables), (7%). The investment cost was 4,300,000 € + VAT (as of 2010). The economic viability of this treatment system, eliminating the profit, was maintained as long as the public incentive exceeded 255 €/MWh. This threshold could have been lowered to 240 €/MWh by considering the lower costs related to the smaller land needed to apply the treated effluent. The cost per ton of manure treated was in line with that reported by [63] in the simulation of a similar integrated treatment system (AD, solid–liquid separation by centrifugation, liquid fraction treated with NDN) treating 100,000 m3 of pig slurry, but based on the performance observed at the pilot-scale. These researchers determined a gross cost of 13.74 €/t that was significantly greater (29.79 €/t) if the proportion of slurry in feedstock decreased to 60% and the remaining 40% had to be replaced by vegetable residues from commercial sources. The income from such systems is difficult to compare among countries because of the different public subsidies and tariffs.

3.2.4. Energy Balance

The average electricity produced by the AD process unit was 73.18 kWh/t treated digestate (Table 3). The average energy consumption by the entire treatment plant was 14.71 kWh/t treated digestate (AD process unit 7.41 kWh/t, solid–liquid separation 0.7 kWh/t, SBR NDN 5.61 kWh/t, and fuel for transportation to and from the plant 0.99 kWh/t). Therefore, the plant produced an energy “surplus” of 58.47 kWh/t of treated effluent, thanks to the bioconversion of manure and slurry.

3.2.5. Social Impact and Biosecurity

The treatment plant employed four workers full-time and one specialized technician part-time. The odor emissions from the plant easily satisfied ambient air quality standards. Furthermore, odor measurements highlighted the very low odorous emissivity (<200 OUe/s) of the SBRs during the aerobic phase (phase 3). The acoustic impact conformed to limits specified by local regulations (emissions < 45 dB(A) during nighttime and < 55 dB(A) during daytime). Additionally, the treatment plant achieved a 99% reduction of pathogenic agents (E. coli) in both solid and liquid products from the plant. Nevertheless, Salmonella Spp. was present, especially in the solid fraction.

4. Conclusions

The results of the study promoted understanding of whether and how the use of a collective plant for the treatment of livestock manure is feasible. This type of plant can facilitate processing raw manure, reducing potential N and P surplus and pollution of surface and ground waters in intensive livestock areas. These objectives can be achieved within overall positive environmental, economic, energy, agronomic, and social balances, all of which have achieved satisfactory results. Although the results of this case study are positive, the public financial support for “green” energy generation is crucial to compensate the cost of biological N removal through SBR. Furthermore, the overall N removal efficiency of the SBR plant achieved during the 5-year study was good (average value 30%) and higher efficiency (up to 60%) was observed for short periods. Nevertheless, the total N removed was less than anticipated based on the plant design. Moreover, in future installations, it would be more environmentally friendly and cheaper to replace the N removal process with a N recovery process, which allows to easily relocate the removed nutrients (e.g., ammonia stripping). Future research should endeavor to define the range of variables (e.g., number of collective farms, transportation distances, feasible crop production systems, support levels for green energy, additional treatments to reduce N and P surplus etc.) that assure collective treatment of livestock wastes the highest possible economic and environmental benefits.

Author Contributions

Conceptualization, G.P. and A.F.; methodology, G.P., G.M. and E.R.; formal analysis, A.F., G.P., and G.M.; investigation, G.M and E.R.; data curation, A.F., G.P., and G.M.; writing—Original draft preparation, A.F., G.P., D.L. and G.M.; writing—Review and editing, A.F., D.L. and G.P.; supervision, G.P.; project administration, G.P.; All authors have read and agreed to the published version of the manuscript.

Funding

This research was funded by the European Union under the project LIFE + MANEV (No. LIFE9-ENV-ES-0453) “Evaluation of manure management and treatment technologies for environmental protection and sustainable livestock farming in Europe” (http://www.lifemanev.eu/).

Acknowledgments

The authors are grateful to Emanuele Cattaneo for help during project monitoring and for providing plant performance data.

Conflicts of Interest

The authors declare no conflict of interest.

References

  1. Hou, Y.; Velthof, G.; Lesschen, J.P.; Staritsky, I.G.; Oenema, O. Nutrient Recovery and Emissions of Ammonia, Nitrous Oxide, and Methane from Animal Manure in Europe: Effects of Manure Treatment Technologies. Environ. Sci. Technol. 2016, 51, 375–383. [Google Scholar] [CrossRef] [PubMed]
  2. Erisman, J.W.; Bleeker, A.; Hensen, A.; Vermeulen, A. Agricultural air quality in Europe and the future perspectives. Atmospheric Environ. 2008, 42, 3209–3217. [Google Scholar] [CrossRef] [Green Version]
  3. Bouraoui, F.; Grizzetti, B. Long term change of nutrient concentrations of rivers discharging in European seas. Sci. Total. Environ. 2011, 409, 4899–4916. [Google Scholar] [CrossRef] [PubMed]
  4. Burton, C.H.; Turner, C. Manure Management: Treatment Strategies for Sustainable Agriculture, 2nd ed.; Silsoe Research Institute: Bedford, UK, 2003; pp. 57–108. [Google Scholar]
  5. Loyon, L. Overview of manure treatment in France. Waste Manag. 2017, 61, 516–520. [Google Scholar] [CrossRef]
  6. Petersen, S.O.; Sommer, S.G.; Béline, F.; Burton, C.; Dach, J.; Dourmad, J.; Leip, A.; Misselbrook, T.; Nicholson, F.; Poulsen, H.; et al. Recycling of livestock manure in a whole-farm perspective. Livest. Sci. 2007, 112, 180–191. [Google Scholar] [CrossRef]
  7. Oenema, O.; Oudendag, D.; Velthof, G. Nutrient losses from manure management in the European Union. Livest. Sci. 2007, 112, 261–272. [Google Scholar] [CrossRef]
  8. González, M.C.G.; Riaño, B.; Teresa, M.; Herrero, E.; Ward, A.J.; Provolo, G.; Moscatelli, G.; Piccinini, S.; Bonmati, A.; Bernal, M.P.; et al. Treatment of swine manure: Case studies in European’s N-surplus areas. Sci. Agricola 2016, 73, 444–454. [Google Scholar] [CrossRef] [Green Version]
  9. Flotats, X.; Foged, H.L.; Bonmati, A.; Palatsi, J.; Magri, A.; Schelde, K.M. Manure Processing Technologies; Technical Report No. II Concerning “Manure Processing Activities in Europe” to the European Commission, Directorate-General Environment; Agro Business Park: Tjele, Denmark, 28 October 2011. [Google Scholar]
  10. Flotats, X.; Bonmati, A.; Fernández, B.; Magrí, A. Manure treatment technologies: On-farm versus centralized strategies. NE Spain as case study. Bioresour. Technol. 2009, 100, 5519–5526. [Google Scholar] [CrossRef]
  11. Bonmati, A.; Flotats, X. Air stripping of ammonia from pig slurry: Characterisation and feasibility as a pre- or post-treatment to mesophilic anaerobic digestion. Waste Manag. 2003, 23, 261–272. [Google Scholar] [CrossRef]
  12. Guštin, S.; Marinšek-Logar, R. Effect of pH, temperature and air flow rate on the continuous ammonia stripping of the anaerobic digestion effluent. Process. Saf. Environ. Prot. 2011, 89, 61–66. [Google Scholar] [CrossRef]
  13. Jiang, A.; Zhang, T.; Zhao, Q.-B.; Li, X.; Chen, S.; Frear, C.S. Evaluation of an integrated ammonia stripping, recovery, and biogas scrubbing system for use with anaerobically digested dairy manure. Biosyst. Eng. 2014, 119, 117–126. [Google Scholar] [CrossRef]
  14. Provolo, G.; Perazzolo, F.; Mattachini, G.; Finzi, A.; Naldi, E.; Riva, E. Nitrogen removal from digested slurries using a simplified ammonia stripping technique. Waste Manag. 2017, 69, 154–161. [Google Scholar] [CrossRef] [PubMed]
  15. Bernet, N. Combined anaerobic–aerobic SBR for the treatment of piggery wastewater. Water Res. 2000, 34, 611–619. [Google Scholar] [CrossRef]
  16. Finzi, A.; Riva, E.; Bicoku, A.; Guido, V.; Shallari, S.; Provolo, G. Comparison of techniques for ammonia emission mitigation during storage of livestock manure and assessment of their effect in the management chain. J. Agric. Eng. 2019, 50, 12–19. [Google Scholar] [CrossRef]
  17. Hjorth, M.; Christensen, K.; Christensen, M.L.; Sommer, S.G. Solid—liquid separation of animal slurry in theory and practice. A review. Agron. Sustain. Dev. 2010, 30, 153–180. [Google Scholar] [CrossRef] [Green Version]
  18. Choi, E.; Kim, D.; Eum, Y.; Yun, Z.; Min, K.-S. Full-Scale Experience for Nitrogen Removal from Piggery Waste. Water Environ. Res. 2005, 77, 381–389. [Google Scholar] [CrossRef] [PubMed]
  19. Deng, L.; Cai, C.; Chen, Z. The treatment of pig slurry by a full-scale Anaerobic-Adding Raw Wastewater-Intermittent Aeration Process. Biosyst. Eng. 2007, 98, 327–334. [Google Scholar] [CrossRef]
  20. Lopéz-Ridaura, S.; Van Der Werf, H.M.G.; Paillat, J.M.; Le Bris, B. Environmental evaluation of transfer and treatment of excess pig slurry by life cycle assessment. J. Environ. Manag. 2009, 90, 1296–1304. [Google Scholar] [CrossRef]
  21. Magrí, A.; Flotats, X. Modelling of biological nitrogen removal from the liquid fraction of pig slurry in a sequencing batch reactor. Biosyst. Eng. 2008, 101, 239–259. [Google Scholar] [CrossRef]
  22. Ledda, C.; Schievano, A.; Salati, S.; Adani, F. Nitrogen and water recovery from animal slurries by a new integrated ultrafiltration, reverse osmosis and cold stripping process: A case study. Water Res. 2013, 47, 6157–6166. [Google Scholar] [CrossRef]
  23. Perera, P.A.; Wu, W.-X.; Chen, Y.-X.; Han, Z.-Y. Struvite Recovery from Swine Waste Biogas Digester Effluent through a Stainless Steel Device under Constant pH Conditions. Biomed. Environ. Sci. 2009, 22, 201–209. [Google Scholar] [CrossRef]
  24. Vaneeckhaute, C.; Lebuf, V.; Michels, E.; Belia, E.; Vanrolleghem, P.; Tack, F.M.G.; Meers, E. Nutrient Recovery from Digestate: Systematic Technology Review and Product Classification. Waste Biomass- Valorization 2016, 8, 21–40. [Google Scholar] [CrossRef] [Green Version]
  25. Asai, M.; Langer, V.; Frederiksen, P.; Jacobsen, B. Livestock farmer perceptions of successful collaborative arrangements for manure exchange: A study in Denmark. Agric. Syst. 2014, 128, 55–65. [Google Scholar] [CrossRef]
  26. Zemo, K.H.; Termansen, M. Farmers’ willingness to participate in collective biogas investment: A discrete choice experiment study. Resour. Energy Econ. 2018, 52, 87–101. [Google Scholar] [CrossRef]
  27. Provolo, G.; Mattachini, G.; Finzi, A.; Cattaneo, M.; Guido, V.; Riva, E. Global Warming and Acidification Potential Assessment of a Collective Manure Management System for Bioenergy Production and Nitrogen Removal in Northern Italy. Sustainability 2018, 10, 3653. [Google Scholar] [CrossRef] [Green Version]
  28. Massé, D.I.; Talbot, G.; Gilbert, Y. On farm biogas production: A method to reduce GHG emissions and develop more sustainable livestock operations. Anim. Feed. Sci. Technol. 2011, 436–445. [Google Scholar] [CrossRef]
  29. Yiridoe, E.; Gordon, R.; Brown, B.B. Nonmarket cobenefits and economic feasibility of on-farm biogas energy production. Energy Policy 2009, 37, 1170–1179. [Google Scholar] [CrossRef]
  30. De Vries, J.; Groenestein, C.; Schröder, J.; Hoogmoed, W.; Sukkel, W.; Koerkamp, P.G.; De Boer, I.J.M. Integrated manure management to reduce environmental impact: II. Environmental impact assessment of strategies. Agric. Syst. 2015, 138, 88–99. [Google Scholar] [CrossRef]
  31. Standard methods for the examination of water and wastewater. Choice Rev. Online 2012, 49, 49.
  32. Dinuccio, E.; Berg, W.; Balsari, P. Gaseous emissions from the storage of untreated slurries and the fractions obtained after mechanical separation. Atmospheric Environ. 2008, 42, 2448–2459. [Google Scholar] [CrossRef] [Green Version]
  33. Petersen, S.O.; Andersen, A.J.; Eriksen, J. Effects of Cattle Slurry Acidification on Ammonia and Methane Evolution during Storage. J. Environ. Qual. 2012, 41, 88–94. [Google Scholar] [CrossRef] [PubMed]
  34. Balsari, P.; Airoldi, G.; Dinuccio, E.; Gioelli, F. Ammonia emissions from farmyard manure heaps and slurry stores—Effect of environmental conditions and measuring methods. Biosyst. Eng. 2007, 97, 456–463. [Google Scholar] [CrossRef]
  35. Chowdhury, A.; De Neergaard, A.; Jensen, L.S. Composting of solids separated from anaerobically digested animal manure: Effect of different bulking agents and mixing ratios on emissions of greenhouse gases and ammonia. Biosyst. Eng. 2014, 124, 63–77. [Google Scholar] [CrossRef]
  36. Yamulki, S.; Jarvis, S.C. Automated chamber technique for gaseous flux measurements: Evaluation of a photoacoustic infrared spectrometer-trace gas analyzer. J. Geophys. Res. Space Phys. 1999, 104, 5463–5469. [Google Scholar] [CrossRef] [Green Version]
  37. Ministerial Decree n.5046/2016. On “General Technical Criteria and Standards for the Regional Regulations of the Agronomic Use of Farm Effluents and Wastewater and for the Production and Agronomic Use of Digestate”. Available online: https://www.gazzettaufficiale.it/eli/id/2016/04/18/16A02762/sg. (accessed on 18 January 2020).
  38. Provolo, G.; Manuli, G.; Finzi, A.; Lucchini, G.; Riva, E.; Sacchi, G.A. Effect of Pig and Cattle Slurry Application on Heavy Metal Composition of Maize Grown on Different Soils. Sustainability 2018, 10, 2684. [Google Scholar] [CrossRef] [Green Version]
  39. European Environment Agency. EMEP/EEA Air Pollution Emission Inventory Guidebook 2016; Publications Office of the European Union: Brussels, Belgium, 2016; pp. 1–28. [Google Scholar]
  40. Eggleston, H.S.; Buendia, L.; Miwa, K.; Ngara, T.; Tanabe, K. IPCC Guidelines for National Greenhouse Gas Inventories; Intergovernmental Panel on Climate Change, Ed.; IGES: Hayama, Japan, 2006; Volumes 2–4, Chapter 3; pp. 10–11. [Google Scholar]
  41. National Guidelines for Integrated Production, Act n.4/2011. Available online: https://www.reterurale.it/flex/cm/pages/ServeBLOB.php/L/IT/IDPagina/3928 (accessed on 18 January 2020).
  42. European Committee for Standardization (CEN). Air quality—Determination of Odour Concentration by Dynamic Olfactometry. BS EN 2003, 13725, 2003. [Google Scholar]
  43. AOAC. Official Methods of Analysis of the Association of Official Analytical Chemists 17th ed. Current through Revision Arlington, USA: Method Nr. 991;14. Available online: http://eoma.aoac.org/methods/info.asp?ID=46949 (accessed on 18 January 2020).
  44. International Standard Organization. Microbiology of Food and Animal Feeding Stuffs—Horizontal Method for the Detection of Salmonella spp.; ISO: Geneva, Switzerland, 2008; pp. 1–27. [Google Scholar]
  45. Schievano, A.; D’Imporzano, G.; Salati, S.; Adani, F. On-field study of anaerobic digestion full-scale plants (Part I): An on-field methodology to determine mass, carbon and nutrients balance. Bioresour. Technol. 2011, 102, 7737–7744. [Google Scholar] [CrossRef]
  46. Schievano, A.; D’Imporzano, G.; Orzi, V.; Adani, F. On-field study of anaerobic digestion full-scale plants (Part II): New approaches in monitoring and evaluating process efficiency. Bioresour. Technol. 2011, 102, 8814–8819. [Google Scholar] [CrossRef]
  47. Möller, K.; Müller, T. Effects of anaerobic digestion on digestate nutrient availability and crop growth: A review. Eng. Life Sci. 2012, 12, 242–257. [Google Scholar] [CrossRef]
  48. Deng, L.; Zheng, P.; Chen, Z.; Mahmood, Q. Improvement in post-treatment of digested swine wastewater. Bioresour. Technol. 2008, 99, 3136–3145. [Google Scholar] [CrossRef]
  49. Han, Z.; Wu, W.; Chen, Y.; Zhu, J. Characteristics of a twice-fed sequencing batch reactor treating swine wastewater under control of aeration intensity. J. Environ. Sci. Heal. Part A 2007, 42, 361–370. [Google Scholar] [CrossRef] [PubMed]
  50. Obaja, D. Biological nutrient removal by a sequencing batch reactor (SBR) using an internal organic carbon source in digested piggery wastewater. Bioresour. Technol. 2005, 96, 7–14. [Google Scholar] [CrossRef]
  51. Zhu, J.; Zhang, Z.; Miller, C. A Laboratory Scale Sequencing Batch Reactor with the Addition of Acetate to remove Nutrient and Organic Matter in Pig Slurry. Biosyst. Eng. 2006, 93, 437–446. [Google Scholar] [CrossRef]
  52. Lo, K.V.; Liao, P.H. A full-scale sequencing batch reactor system for swine wastewater treatment. J. Environ. Sci. Heal. Part B 2007, 42, 237–240. [Google Scholar]
  53. Bortone, G. Integrated anaerobic/aerobic biological treatment for intensive swine production. Bioresour. Technol. 2009, 100, 5424–5430. [Google Scholar] [CrossRef] [PubMed]
  54. Dube, P.; Vanotti, M.; Szogi, A.; González, M.C.G. Enhancing recovery of ammonia from swine manure anaerobic digester effluent using gas-permeable membrane technology. Waste Manag. 2016, 49, 372–377. [Google Scholar] [CrossRef] [Green Version]
  55. Loyon, L.; Guiziou, F.; Béline, F.; Peu, P. Gaseous Emissions (NH3, N2O, CH4 and CO2) from the aerobic treatment of piggery slurry—Comparison with a conventional storage system. Biosyst. Eng. 2007, 97, 472–480. [Google Scholar] [CrossRef]
  56. Vanotti, M.; Szögi, A.A.; Millner, P.D.; Loughrin, J. Development of a second-generation environmentally superior technology for treatment of swine manure in the USA. Bioresour. Technol. 2009, 100, 5406–5416. [Google Scholar] [CrossRef]
  57. Wang, L.; Addy, M.; Liu, J.; Nekich, C.; Zhang, R.; Peng, P.; Cheng, Y.; Cobb, K.; Liu, Y.; Wang, H.; et al. Integrated process for anaerobically digested swine manure treatment. Bioresour. Technol. 2019, 273, 506–514. [Google Scholar] [CrossRef]
  58. Bolzonella, D.; Fatone, F.; Gottardo, M.; Frison, N. Nutrients recovery from anaerobic digestate of agro-waste: Techno-economic assessment of full scale applications. J. Environ. Manag. 2018, 216, 111–119. [Google Scholar] [CrossRef]
  59. Cattaneo, M.; Finzi, A.; Guido, V.; Riva, E.; Provolo, G. Effect of ammonia stripping and use of additives on separation of solids, phosphorus, copper and zinc from liquid fractions of animal slurries. Sci. Total. Environ. 2019, 672, 30–39. [Google Scholar] [CrossRef] [PubMed]
  60. Nicholson, F.; Chambers, B.; Williams, J.; Unwin, R. Heavy metal contents of livestock feeds and animal manures in England and Wales. Bioresour. Technol. 1999, 70, 23–31. [Google Scholar] [CrossRef]
  61. Moral, R.; Murcia, M.D.P.; Espinosa, A.P.; Moreno-Caselles, J.; Paredes, C.; Rufete, B. Salinity, organic content, micronutrients and heavy metals in pig slurries from South-eastern Spain. Waste Manag. 2008, 28, 367–371. [Google Scholar] [CrossRef] [PubMed]
  62. Bacenetti, J.; Sala, C.; Fusi, A.; Fiala, M. Agricultural anaerobic digestion plants: What LCA studies pointed out and what can be done to make them more environmentally sustainable. Appl. Energy 2016, 179, 669–686. [Google Scholar] [CrossRef] [Green Version]
  63. De Vrieze, J.; Colica, G.; Pintucci, C.; Sarli, J.; Pedizzi, C.; Willeghems, G.; Bral, A.; Varga, S.; Prat, D.; Peng, L.; et al. Resource recovery from pig manure via an integrated approach: A technical and economic assessment for full-scale applications. Bioresour. Technol. 2019, 272, 582–593. [Google Scholar] [CrossRef] [PubMed]
Figure 1. Process line of the collective treatment plant consisting of four process units (PU): Anaerobic digestion, PU1; Solid–liquid separation, PU2; Biological N removal plant (SBR), PU3; Storage, PU4.
Sustainability 12 02756 g001
Figure 2. Mass balance of the integrated treatment plant based on the mass (Q) of material treated annually and the analyses of total solids (TS), total Kjeldahl nitrogen (TKN), total ammoniacal nitrogen (TAN), and total phosphorus (TP). The PUs were: PU1—anaerobic digestion, PU2—solid–liquid separation, PU3—biological N removal plant (SBR).
Sustainability 12 02756 g002
Figure 3. O2 concentration (blue line) and pH trend (red line) in the sequencing batch reactor (SBR) during one working day (four cycles).
Sustainability 12 02756 g003
Figure 4. Concentrations of NH3 (a), N2O (b), CO2 (c) and CH4 (d) in the air above the surface of the SBR contents during one 6-h monitoring period. Phase 1 (ph.1) fill and draw, phase 2 (ph.2) anoxic phase, Phase 3 (ph.3) aerobic phase, Phase 4 (ph.4) sedimentation).
Sustainability 12 02756 g004
Table 1. Criteria, indicators, and parameters established for the common evaluation and monitoring protocol developed in the LIFE + MANEV project.
CriteriaIndicatorsParameter
EnvironmentWATER: EutrophicationN balance, P balance
AIR: AcidificationNH3, SO2, NOx emissions
AIR: Global WarmingCO2, CH4, N2O emissions
AgronomyFertilizing units NPNP Balance
EconomyIncomesEnergy production, end-products
ExpensesDepreciation, energy consumption, chemicals, maintenance, manpower
EnergyEnergy productionElectricity and heat
Energy consumptionElectricity, heat, and fuel
Social impactOdorReference values
NoiseReference values
Impact in local activityJobs created
BiosecurityE. coliReduction/No reduction
SalmonellaReduction/No reduction
Table 2. Mean values of gaseous emissions from the sequencing batch reactor calculated on daily basis (g/m3/d) during each phase of a 6-h cycle. The data reported are the mean and standard deviation (in brackets) for the three periods monitored (spring, late spring, and summer).
PhaseN-NH3N2OCO2CH4
1. Filling/decanting (g/m3/cycle)0.014 (0.01)0.000 (0.00)0.088 (0.10)0.010 (0.01)
2. Anoxic reaction/mixing (g/m3/cycle)0.076 (0.03)0.002 (0.00)0.437 (0.19)0.058 (0.02)
3. Aerobic reaction (g/m3/cycle)0.163 (0.07)0.001 (0.00)5.221 (1.39)0.086 (0.04)
4. Settling/sedimentation (g/m3/cycle)0.017 (0.00)0.000 (0.00)0.093 (0.03)0.005 (0.00)
Total cycle (g/m3/cycle)0.271 (0.10)0.003 (0.00)5.840 (1.61)0.157 (0.06)
Day (g/m3/d)1.08 (0.41)0.01 (0.02)23.36 (6.44)0.63 (0.25)
Table 3. Summary of the monitoring and evaluation results of the collective treatment system.
CriteriaParameterUnitsWith Treatment SystemWithout Treatment System
Environment (1)Global Warming Potentialkg CO2 eq./t treated20.7974.30
Acidification potentialkg SO2 eq./t treated0.901.83
Land available (170 kgN/ha)ha11121840
Agronomy (1)Nitrogen Balancekg N/ha250361
Phosphorus Balancekg P/ha118191
Economy (2)Incomes€/t18.430
Expenses€/t16.820
Energy (3)Electrical Energy BalancekWh/t58.470
Thermal Energy BalancekWh/t-0
FuelkWh/t0.990
Social Impact (2)Job demand—Operatorh/y68000
Job demand—Technicianh/y4250
Odor1(little)-4(much)1-
NoiseYES/NONO-
BiosecuriyPathogens reductionE. coli99.6%0%
Pathogens reductionSalmonellaabsent/presentpresent
(1) Values refer to the whole manure management system from farm storage to land application. (2) Values refer to the process line of the treatment plant including plant storage and transport farm/plant, but not to the field distribution (assumed equal in both scenarios). (3) Values are referred to process units PU1 (anaerobic digestion), PU2 (solid–liquid separation), and PU3 (biological treatment by sequencing batch reactor).
Table 4. Agronomic balance for N and P of systems with and without the collective treatment plant.
NutrientCrop RequirementsOutput without Treatment PlantSurplusOutput with Treatment PlantSurplus
kg/ha
Nitrogen (*)3523619250−102
Phosphorus (**)113191781185
(*) considering 15% N loss during farm storage and 52% N availability efficiency for untreated manure and 57% N availability efficiency for treated effluent. (**) considering 75% P availability efficiency for untreated manure and treated effluents.

