Article

Changes in the Historical and Current Habitat Ranges of Rare Wild Mammals in China: A Case Study of Six Taxa of Small- to Large-Sized Mammals

1
Jiangsu Provincial Key Laboratory of Geographic Information Science and Technology, Key Laboratory for Land Satellite Remote Sensing Applications of Ministry of Natural Resources, School of Geography and Ocean Science, Nanjing University, Nanjing 210023, China
2
School of Life Sciences, Nanjing University, Nanjing 210023, China
3
Jiangsu Center for Collabarative Innovation in Geographical Information Resource Development and Applicaiton, Nanjing 210023, China
*
Authors to whom correspondence should be addressed.
Sustainability 2020, 12(7), 2744; https://doi.org/10.3390/su12072744
Submission received: 21 February 2020 / Revised: 22 March 2020 / Accepted: 28 March 2020 / Published: 31 March 2020
(This article belongs to the Special Issue Wildlife Conservation: A Sustainability Perspective)

Abstract

:
Through history, the habitats of wild mammals have changed greatly in China. Habitat changes may reflect changes in the environment and human–wildlife conflicts. This study focused on how the habitat changed for six taxa of rare wild mammals (one family, one genus, and four species) in mainland China. Their historical and current habitats were estimated according to their historical and current presence occurrences and three sets of environmental data (climate data, topography data, and human activity data), using the Maximum Entropy Model. Then, spatial statistical methods were used to analyze the changes in their habitats, and how human activities have influenced changes in their habitat. The results suggest that the habitats of all six taxa of mammals have shrunk considerably, compared to their historical ranges. With regards to current or past habitats, on average, 68.3% of habitats have been lost. The Asian elephant, which is facing the most serious habitat losses, has lost 93.1% of its habitat. By investigating the relationship between the changes in habitats and the anthropogenic impacts for each taxa, human activities have an obvious negative influence on mammal habitats. The sensitivity of habitats to human activities varies among different mammals: the tiger, Asian elephant, Bactrian camel, and snub-nosed monkey are more sensitive to human activities than musk deer and Chinese water deer.

1. Introduction

The distribution of wild animals has undergone substantial changes in China. Many wild animals, which were once widely distributed across China, are nowadays endangered or even extinct. Changes to the distribution of wild animals, and the factors driving these changes, may reflect changes to both natural and anthropogenic impacts on the environment.
Records of the distribution of wild animals can be traced back to prehistoric cave paintings. However, due to the vagueness of the delineation of species and of taxonomies used during different periods of history, the historical distribution of wild animals in China is unclear. The systematic collection of, and research on, the historical records began in the last century. R. Wen and H. Wen have contributed to the identification and verification of several ancient and modern species of wild animals [1,2], with ancient and modern species distribution maps being one of their most important contributions. Similar difficulties in reviewing historical records exist not only in China, but also worldwide. Considerable progress has been made in historical biogeography [3]. Santos-Reis and da Luz Mathias [4] summarized the historical distribution of 95 species of mammals in Portugal using available sources of information, such as published papers. Long [5,6] detailed the historical distribution of introduced animals to illustrate their attempts at translocation to support decision making on methods for dealing with introduced species. Boshoff, Landman et al. [7] used written records and supporting records to map the distribution of several larger animals in historical times with biomes and bioregions, and interpreted their historical spatial patterns.
Higher animals, such as mammals, have been demonstrated to be significantly influenced by human activities, and the destruction of natural habitats is considered to be the major threat to wild animals [8]. According to the IUCN (International Union for Conservation of Nature) Red List [9], 286 species of 5801 mammalian species recorded are listed as EX (extinct) or EW (extinct in the wild). For the reasons stated above, we focused on changes to the habitats of wild mammals in this study.
Studies on the historical distribution of wild mammals deal with different topics, such as molecular phylogenies in biogeography, biodiversity, and conservation evaluations, and species introduction [10]. Some researchers delineated the historical distribution of a large number of species within their research areas, while others focused on only one or several species. Costa [11] evaluated the genetic diversity of small mammals, in addition to patterns of geographical distribution of clades, to explain the historical relationship between habitats. Boshoff, Kerley et al. [12,13] used the historical occurrences and ecological requirements of 42 medium- to large-sized mammals to estimate their potential distributions. Cui, Milnergulland et al. [14] focused on the assessment of the historical distribution and migration patterns of the saiga antelope, Saiga tatarica, to determine potential reintroduction sites.
In recent years, more researches have focused on how anthropogenic and climate changes influence the persistence of wild mammals by exploring historical records in various ways. Turvey, Crees et al. studied historical extinction or last-occurrence data [15] and extinction selectivity shifting [16] based on the datasets of dated historical records. Wan and Zhang [17] were interested in historical latitudinal distribution changes and extinction time. Zhao, Ren et al. [18] constructed the distribution shifting of snub-nosed monkeys on both 100-year and 10-year time scales using historical records. Nüchel, Bøcher et al. [19] used the historical distribution data of snub-nosed monkeys when modeling the climatic suitable habitat, considering that threatened species might not live in the most favorable habitat currently.
A recently published work also used the historical records of several mammals in mainland China, in which species local extinction information was obtained, and was analyzed to tease out relationships between body mass, historical anthropogenic factors, and historical temperature [20].
Historical records provide us with information on the distribution and extinction of animals in the past, and present perspectives unavailable from current data. However, there is likely a lack of certainty in historical data across a full range and all time periods. Therefore, we attempted to reconstruct a relatively comprehensive historical habitat range from limited records, allowing further spatial analysis to be conducted.
In this study, we focused our analysis on geographical changes in the habitat ranges of rare wild mammals in mainland China. The historical habitat ranges were obtained on the basis of animal occurrences. Owing to limits in the quality of historical records, some species cannot easily be distinguished from each other. Therefore, the estimated historical and current habitats of six taxa of rare wild mammals (one family, one genus, and four species) were constructed, accompanied by an analysis of their habitat changes and the relationship between habitat change and human activities.

2. Methods and Data

2.1. Rare Mammal Species

Six taxa, comprised of one family, one genus, and four species, were selected for this study (Table 1), including one carnivore, one omnivore, and four herbivores. These mammals used to be widely distributed across China, but now are facing threats to varying degrees. Five of these taxa are categorized as level-I national protection and the other species is categorized as level-II. In the IUCN Red List, the Bactrian camel, Camelus bactrianus, is even categorized as Critically Endangered (CR) due to the loss of habitat and illegal hunting.
Of the mammals listed above, the tiger is the only carnivore. The tiger, classified in the family Felidae, is a predator that requires large contiguous areas of habitat. Three tiger subspecies currently inhabit in China: the Siberian tiger (P. t. altaica), South China tiger (P. t. amoyensis), and Indochinese tiger (P. t. corbetti); of these, the South China tiger and Indochinese tiger have not been seen resident in the wild in China in the last decade. The Asian elephant is a large herbivore that occurs in grasslands, shrublands, forests, and sometimes cultivated lands, and still survives in remnant habitats in Yunnan province. The Bactrian camel is the only species that lives in desert that was included in this study; it is adapted to extremely arid areas with sparse vegetation. Musk deer and Chinese water deer are small- and medium-sized ruminants that inhabit forests, shrublands, grasslands, and rocky mountainous areas. All of the three species in the genus Rhinopithecus that are found in China are endemic to China. As an arboreal primate that are only resident in forests, Rhinopithecus are facing habitat fragmentation due to the loss of primary and young forest [21].
The six taxa of rare mammals involved in this study include carnivores, omnivores, and herbivores. Their sizes vary from small (the forest musk deer weighs around 6–9 kg) to large (the Asian elephant weighs around 3–5 t). Their range covers almost every natural zonation in China.

2.2. Estimation of Habitats

The habitats of the wild mammals were estimated using the Maximum Entropy Model, based on presence occurrences and environmental factors.
Maximum Entropy was first presented by Jaynes [22,23], and originated in statistical mechanics. Phillips, Anderson et al. [24] and Phillips and Dudik [25] introduced this theory into species geographic distribution modeling. The model expresses the distribution in probability from a set of environmental layers and a set of animal occurrence locations. The model is free from feature independence assumptions, which means that the features can be freely chosen regardless of case specific problems.
In this study, the model was introduced in both current and historical zoogeography, enabling historical habitats to be quantitatively measured and analyzed in addition to current habitats. A program named Maximum Entropy Species Distribution Modeling (the MaxEnt program) was used to estimate possible historical and current habitats. In order to assess MaxEnt model performance, AUC (area under the Receiver Operating Characteristic Curve, i.e. ROC curve) was used in this study. AUC values vary between 0 and 1, where 0.5 indicates a random prediction, and 1 indicates a high performance of prediction.

2.3. Presence Occurrence Data

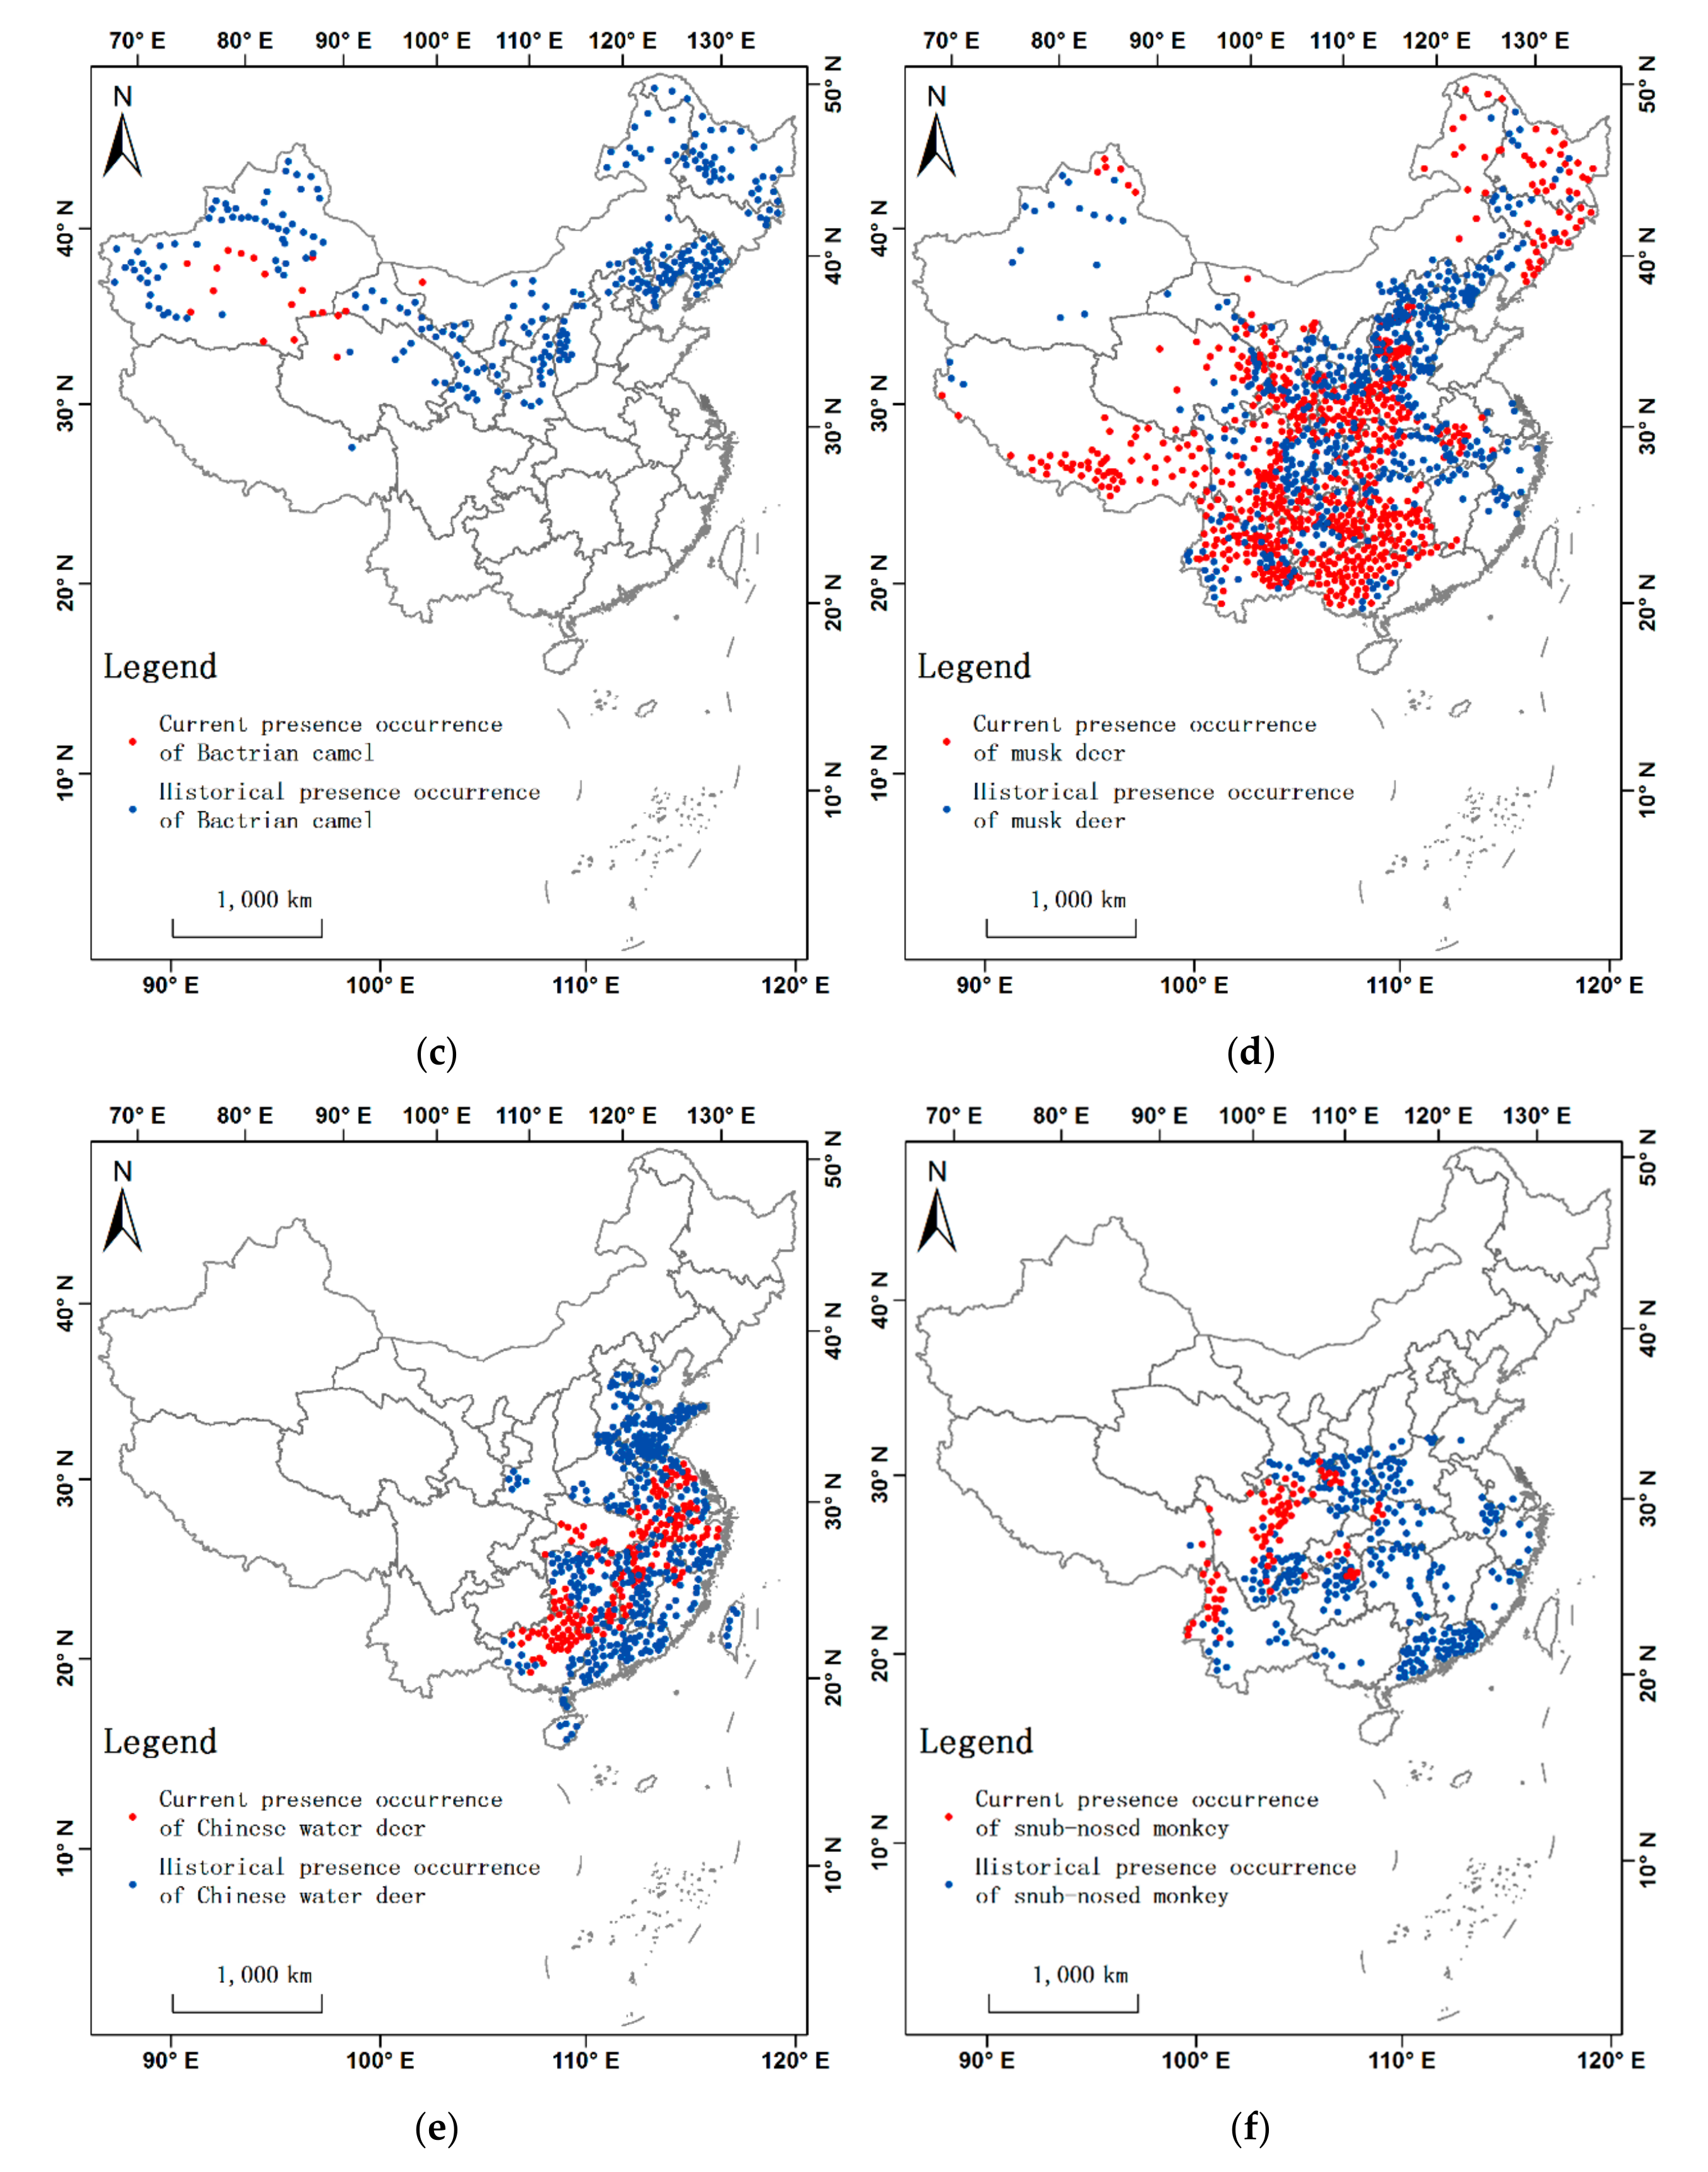
The historical presence occurrences of mammals (blue points in Figure 1) were obtained based on the work of Wen [2]. Wen unearthed a wealth of valuable historical data, including documented records and literary works. Further identification and mapping was provided by Wen to distinguish species with similar appearances and ancient names, or to merge records of the same species that had different ancient names. In this study, maps from Wen’s work were used to geo-locate historical occurrences of mammals.
To obtain the current presence occurrences of the six taxa of mammals, additional updated current ranges [26,27] were used to overlay current presences, excluding those located in places where species have gone locally extinct in recent decades (red points in Figure 1).
According to the data sources mentioned above, the historical period is defined as being from circa 2070 B.C. to the 1980s, i.e., from the Pre-Qin Period to when the study of wild animals begin in the People’s Republic of China, and when the influence of human activities on wildlife habitats was not fully understood. As a result, the current period is defined as starting in the 1980s. Most historical records were found in local chronicles compiled during the Ming, Qing, and the Republic of China periods, in which local species were recorded in detail. Because of the uncertainties in historical records, it is hard to delineate the real distribution completely from historical occurrence data. The Maximum Entropy Model enables historical habitats to be estimated from limited occurrence points.

2.4. Environmental Factor Data

Because the Maximum Entropy Model has the ability to freely incorporate various areas of problem-specific knowledge in terms of feature functions, arbitrary environmental factors can be chosen in order to reflect the characteristics of a research area as faithfully as possible [25]. Three sets of environmental factor data were used in this study: climate data, the topography data, and the human activity data.
A set of 30 arc-second resolution global climate layers named WorldClim was used for climate data (accessed via the WorldClim website: https://www.worldclim.org/data/index.html). The dataset WorldClim contains 19 layers derived from the monthly temperature and rainfall values (Table 2), in order to generate more biologically meaningful variables [28].
The topography data were comprised of Digital Elevation Model (DEM), slope, and relief. DEM was sourced from ASTER GDEM version 2. Considering the significance of this factor, relief was defined as the difference between the maximum and minimum elevation within a radius of 21 kilometers in this research [29].
The human activity data were comprised of a population grid and the Human Influence Index (HII). The population is at a 1-km grid size generated based on the population in 2010. The HII is an open dataset of the Last of the Wild Project published in 2005, accessed via the Socioeconomic Data and Applications Center (SEDAC). It maps anthropogenic impacts on the environment in geographic projection at a 30-arc-second resolution. The HII was created from nine global data layers covering three aspects of human influence—human population pressure (population density), human land use and infrastructure (built-up areas, nighttime lights, and land use/land cover), and human access (coastlines, roads, railroads, and navigable rivers) [30].
In ArcGIS 10.2, all environmental raw data were resampled to the same resolution of 30 arc-seconds, with their spatial reference set as GCS_WGS_1984. All environmental layers were extracted to the same extent and then converted in the ESRI ASCII grid format, a raster file format beginning with header information followed by cell values designed by Environmental Systems Research Institute, Inc. (ESRI) that can be inputted in the MaxEnt program.

3. Results

3.1. The Estimated Historical and Current Habitat Ranges

The climate data and the topography data were used to estimate historical habitats, while the climate data, the topography data, and the human activity data were used to estimate current habitats. Due to the absence of historical human activity data, it is assumed that human activities in the current period have had a much greater effect on current habitat ranges than during the historical period.
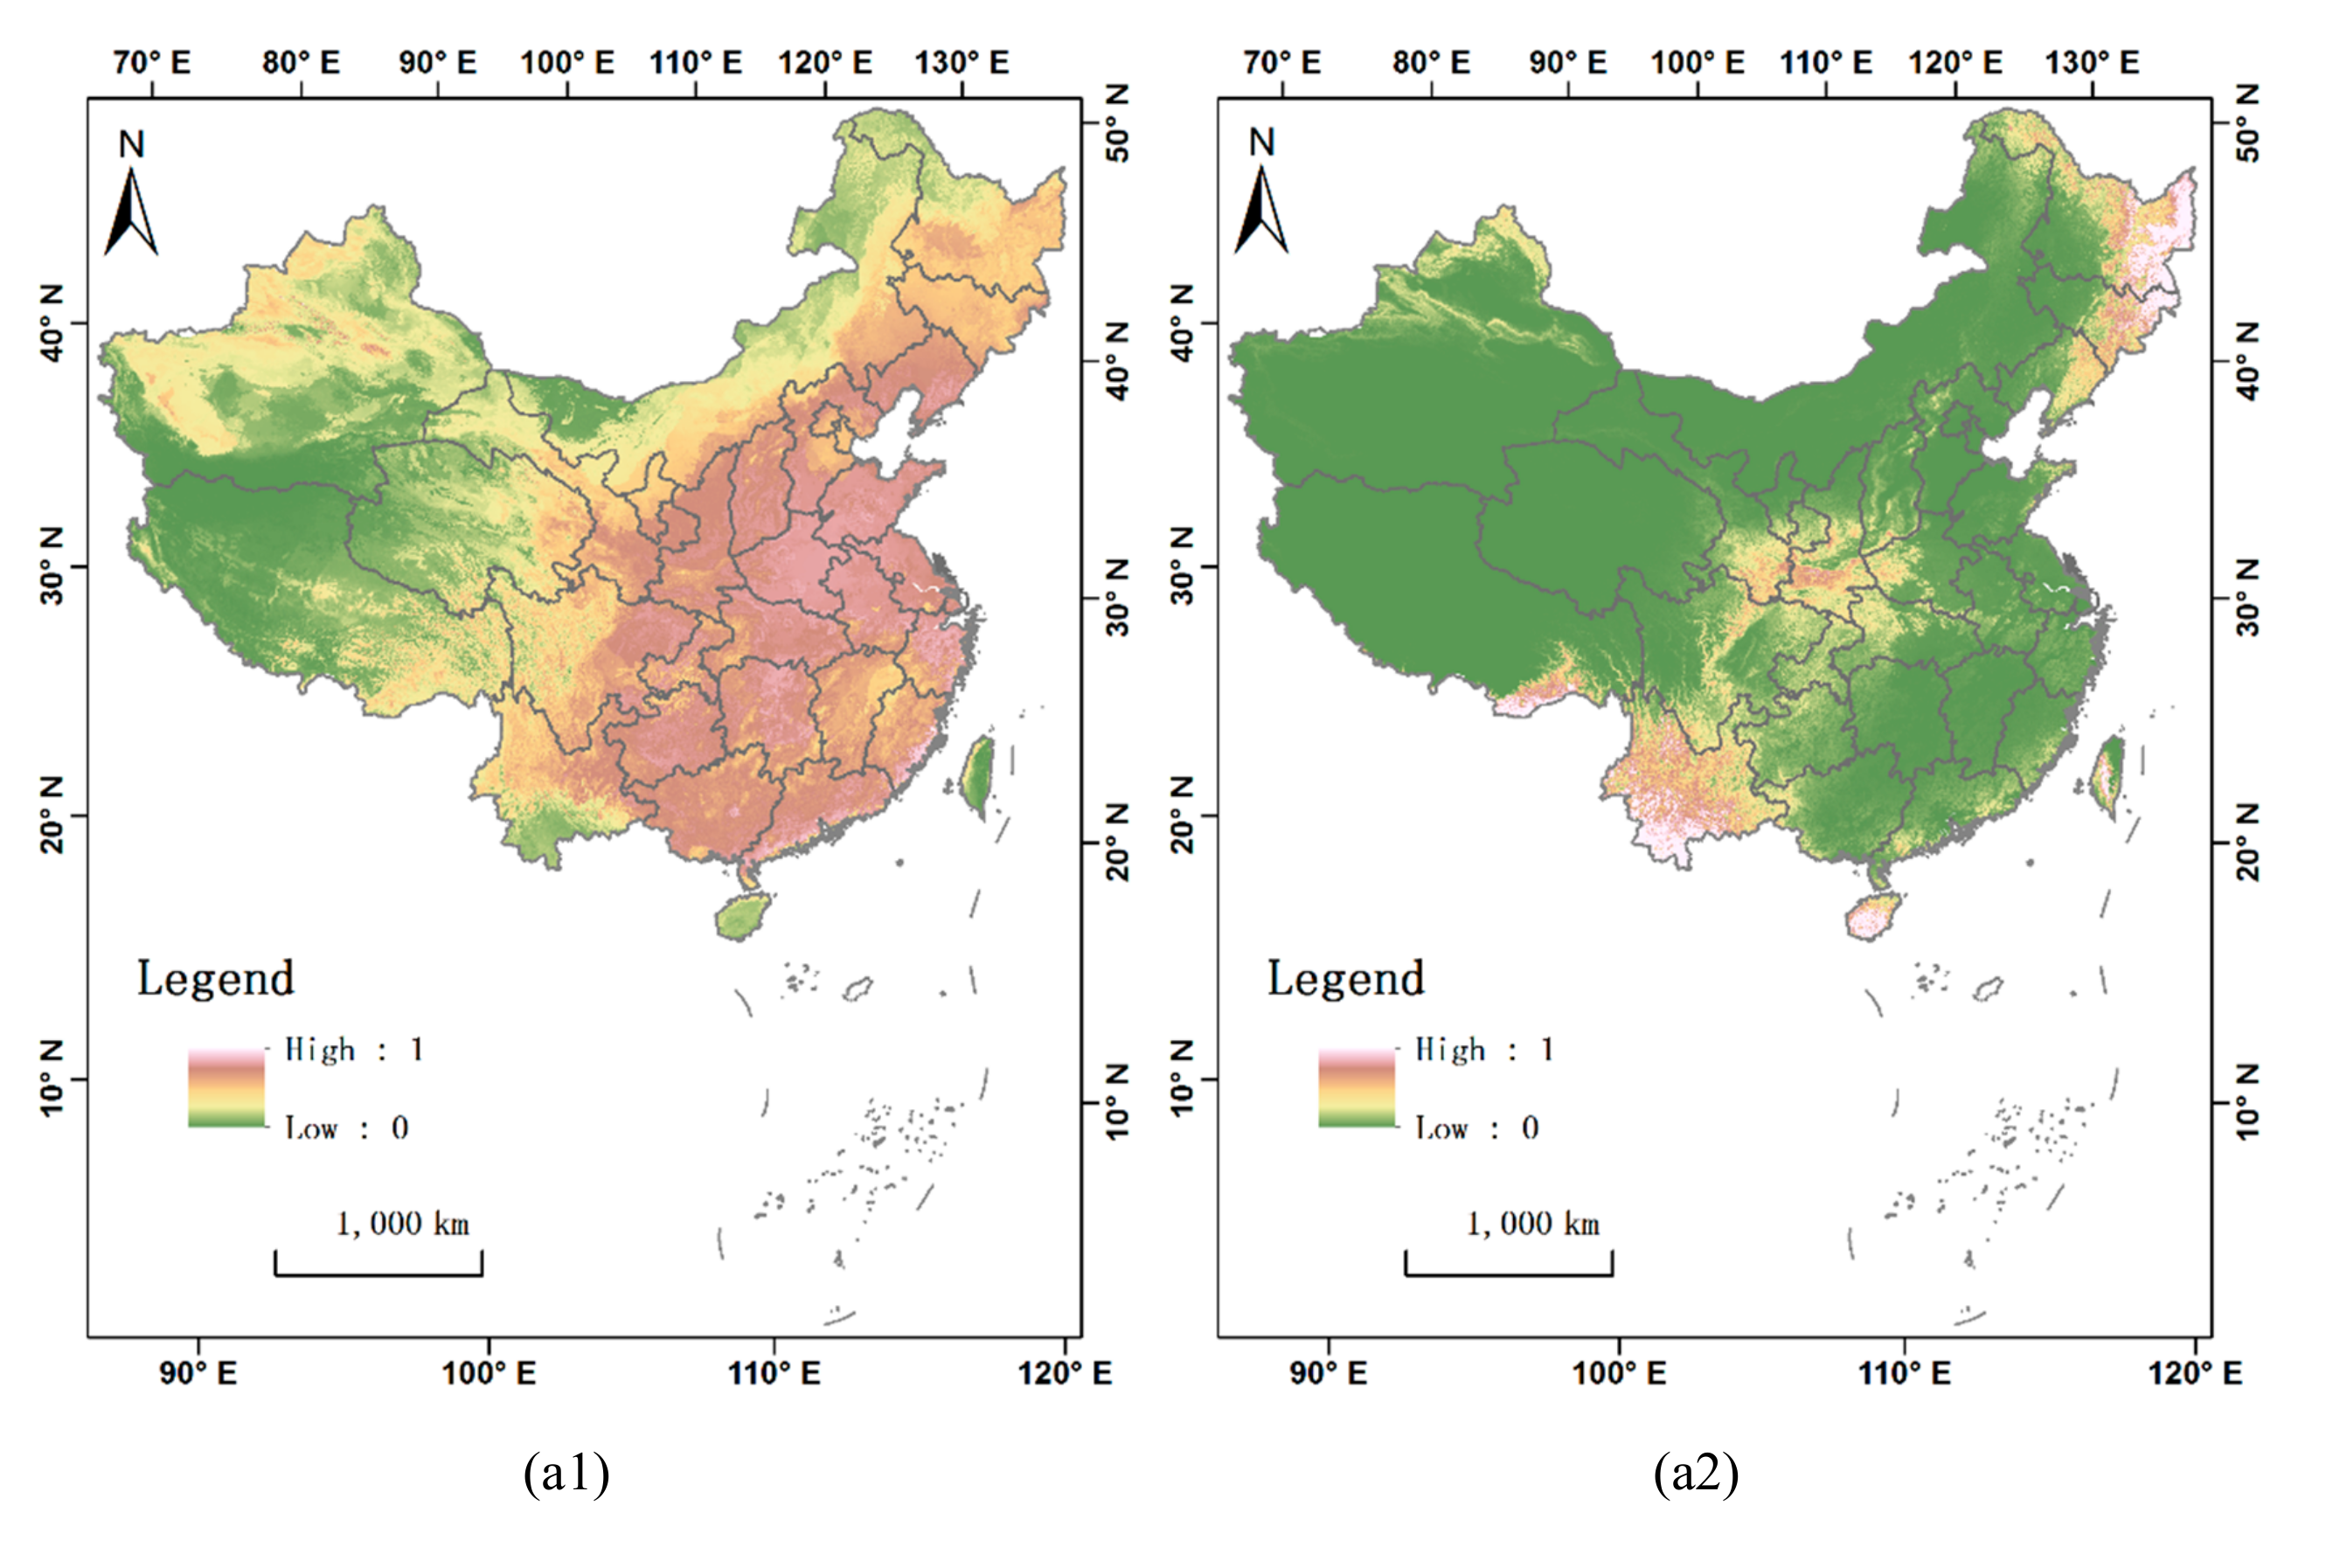
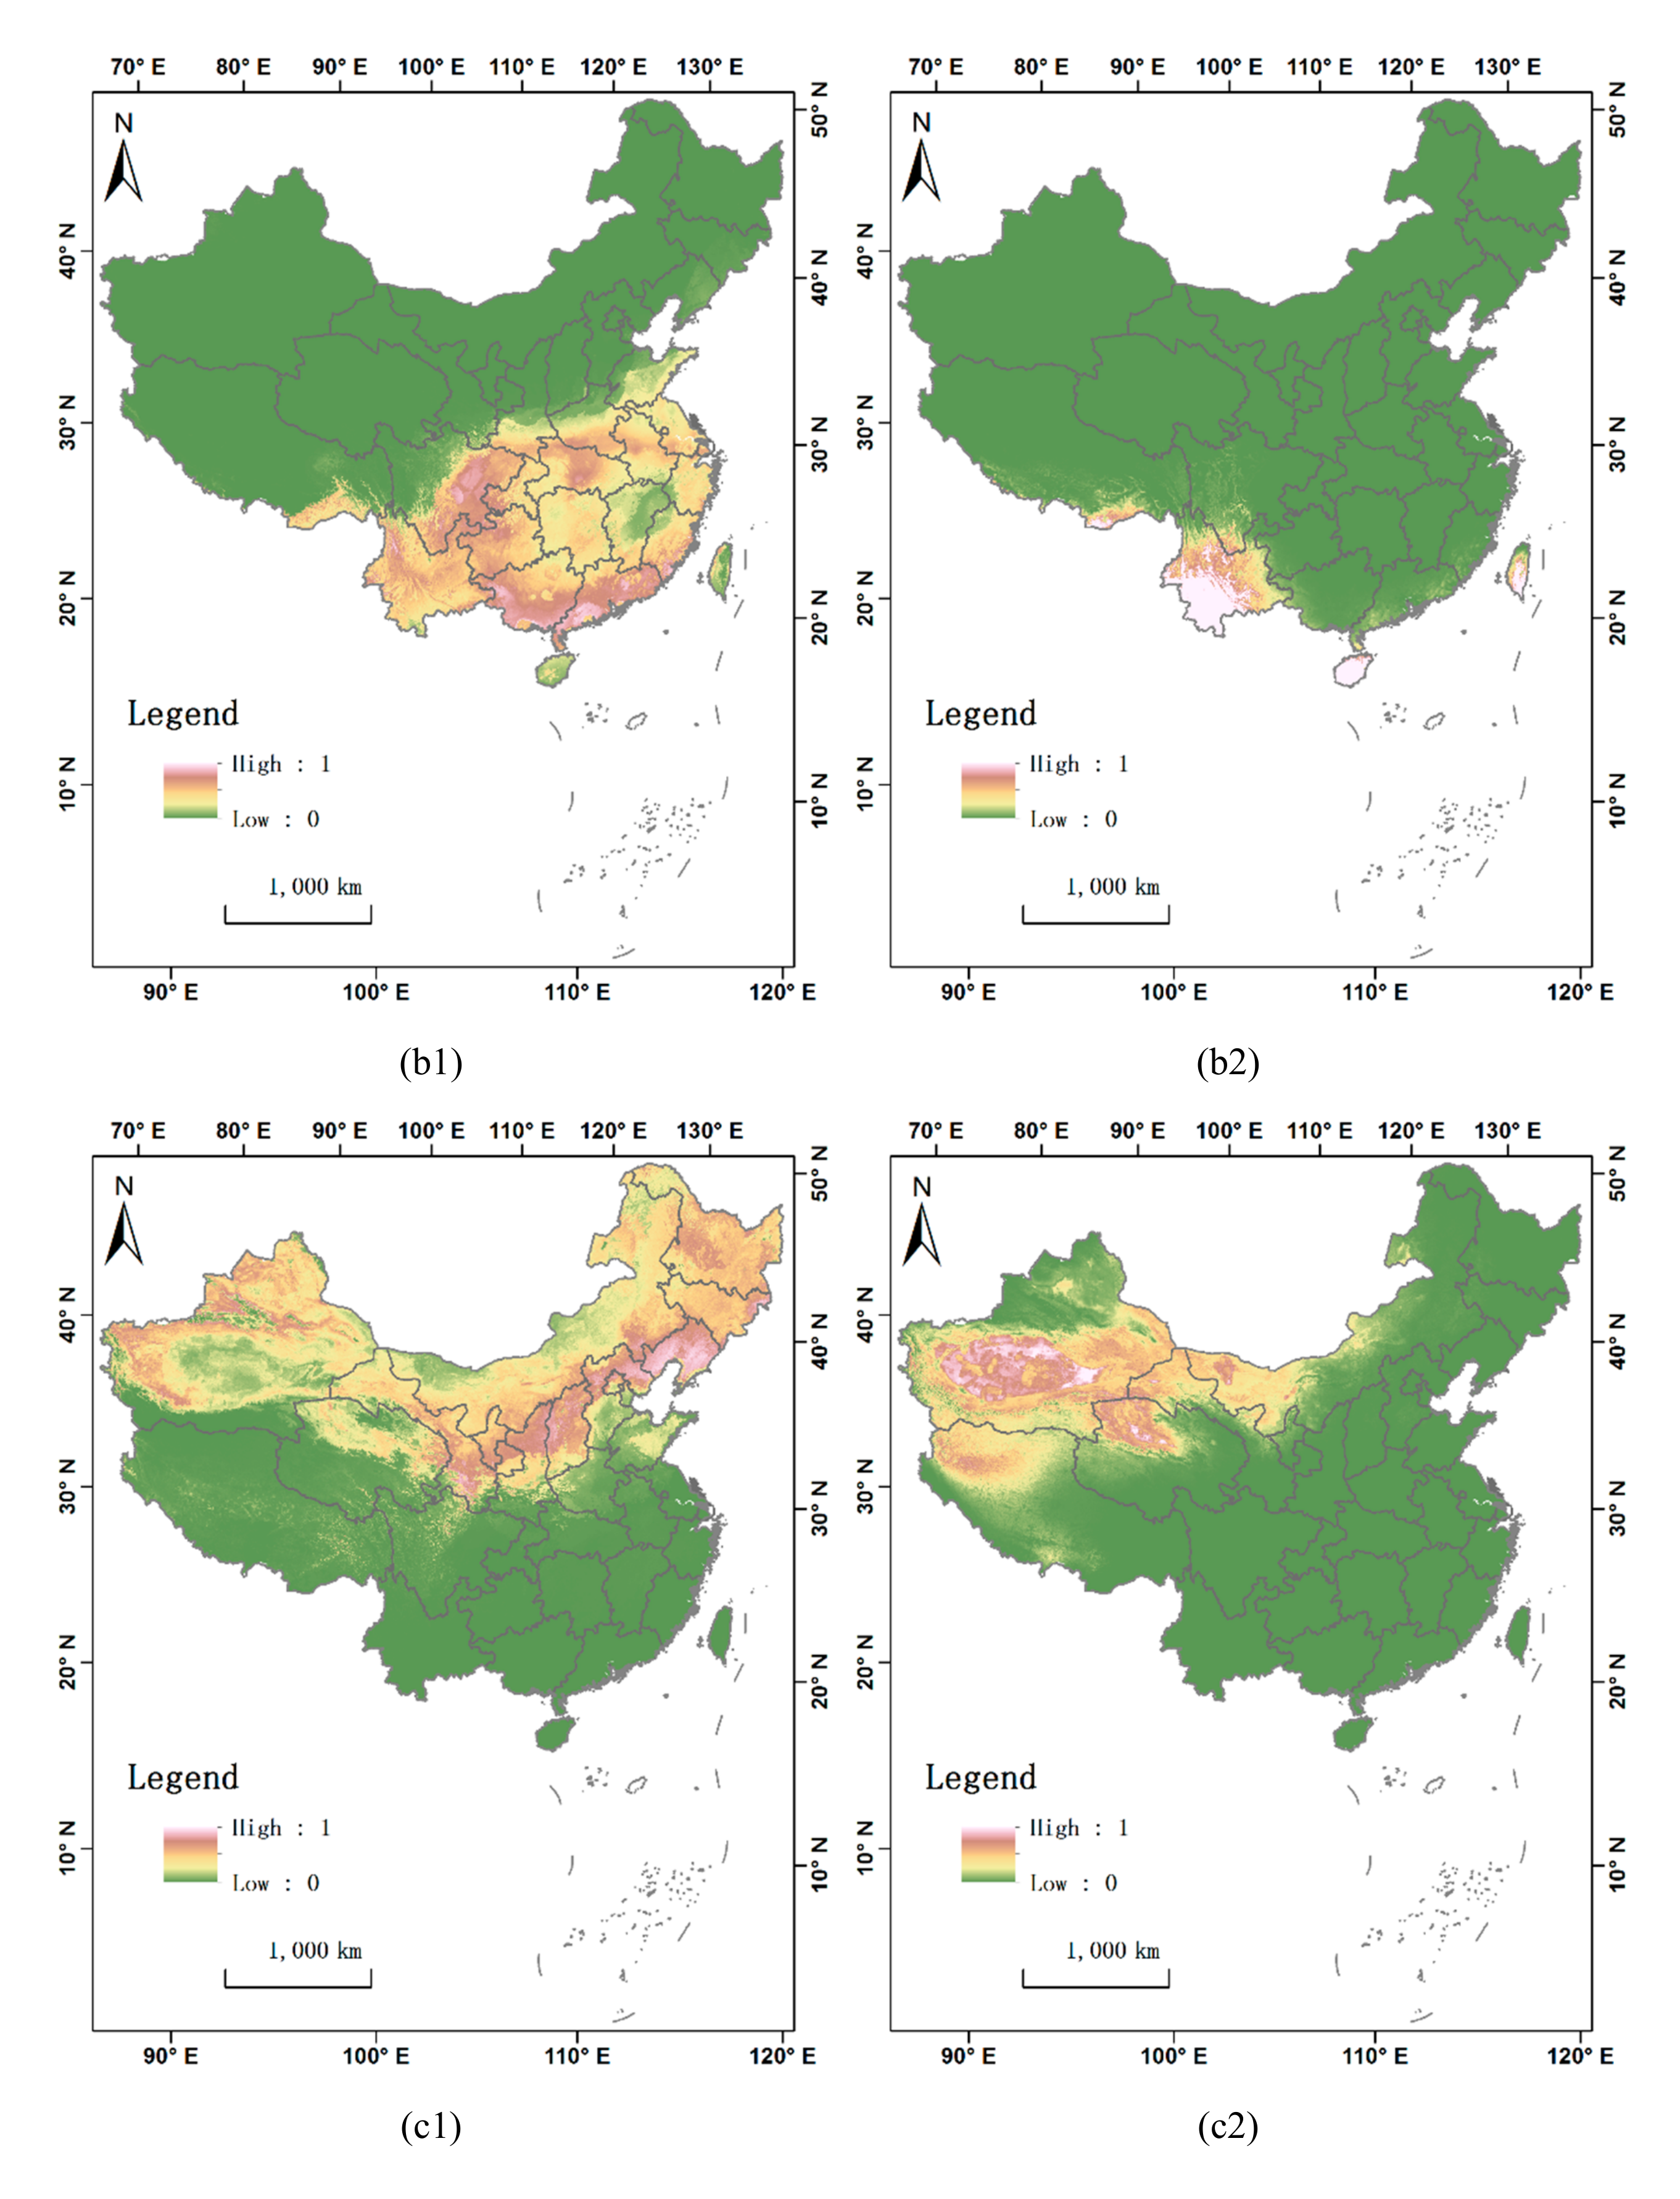
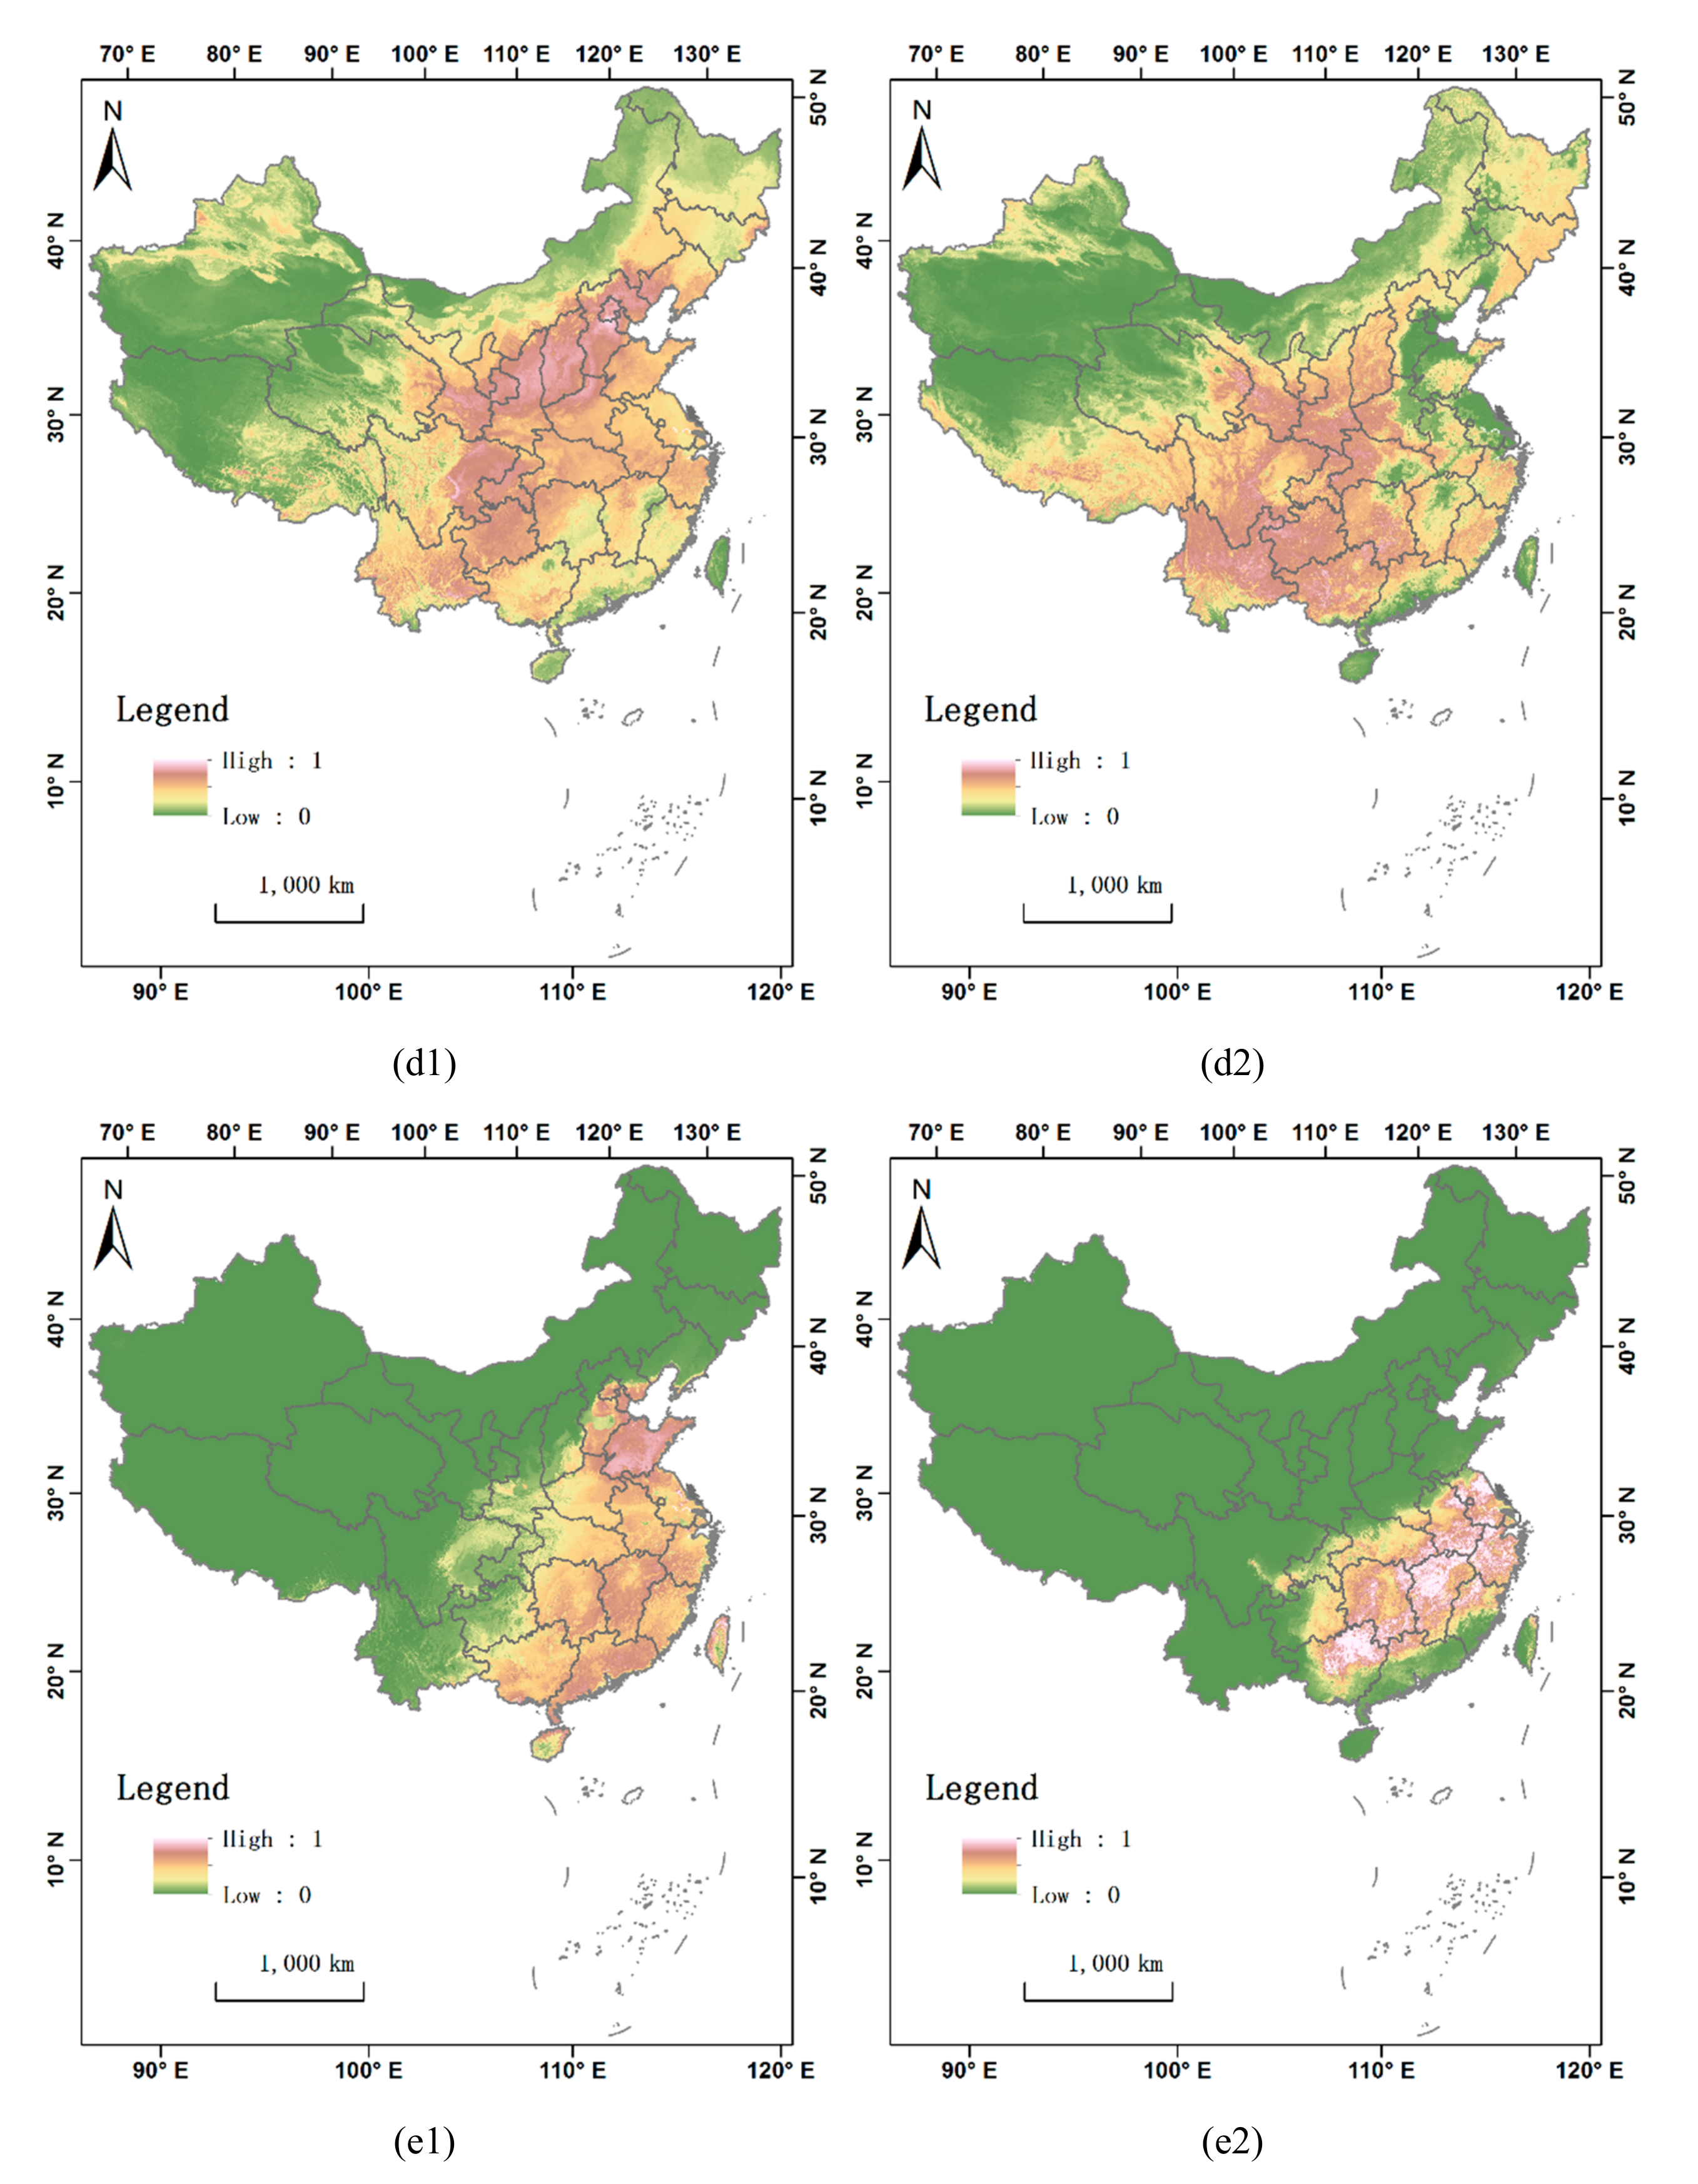
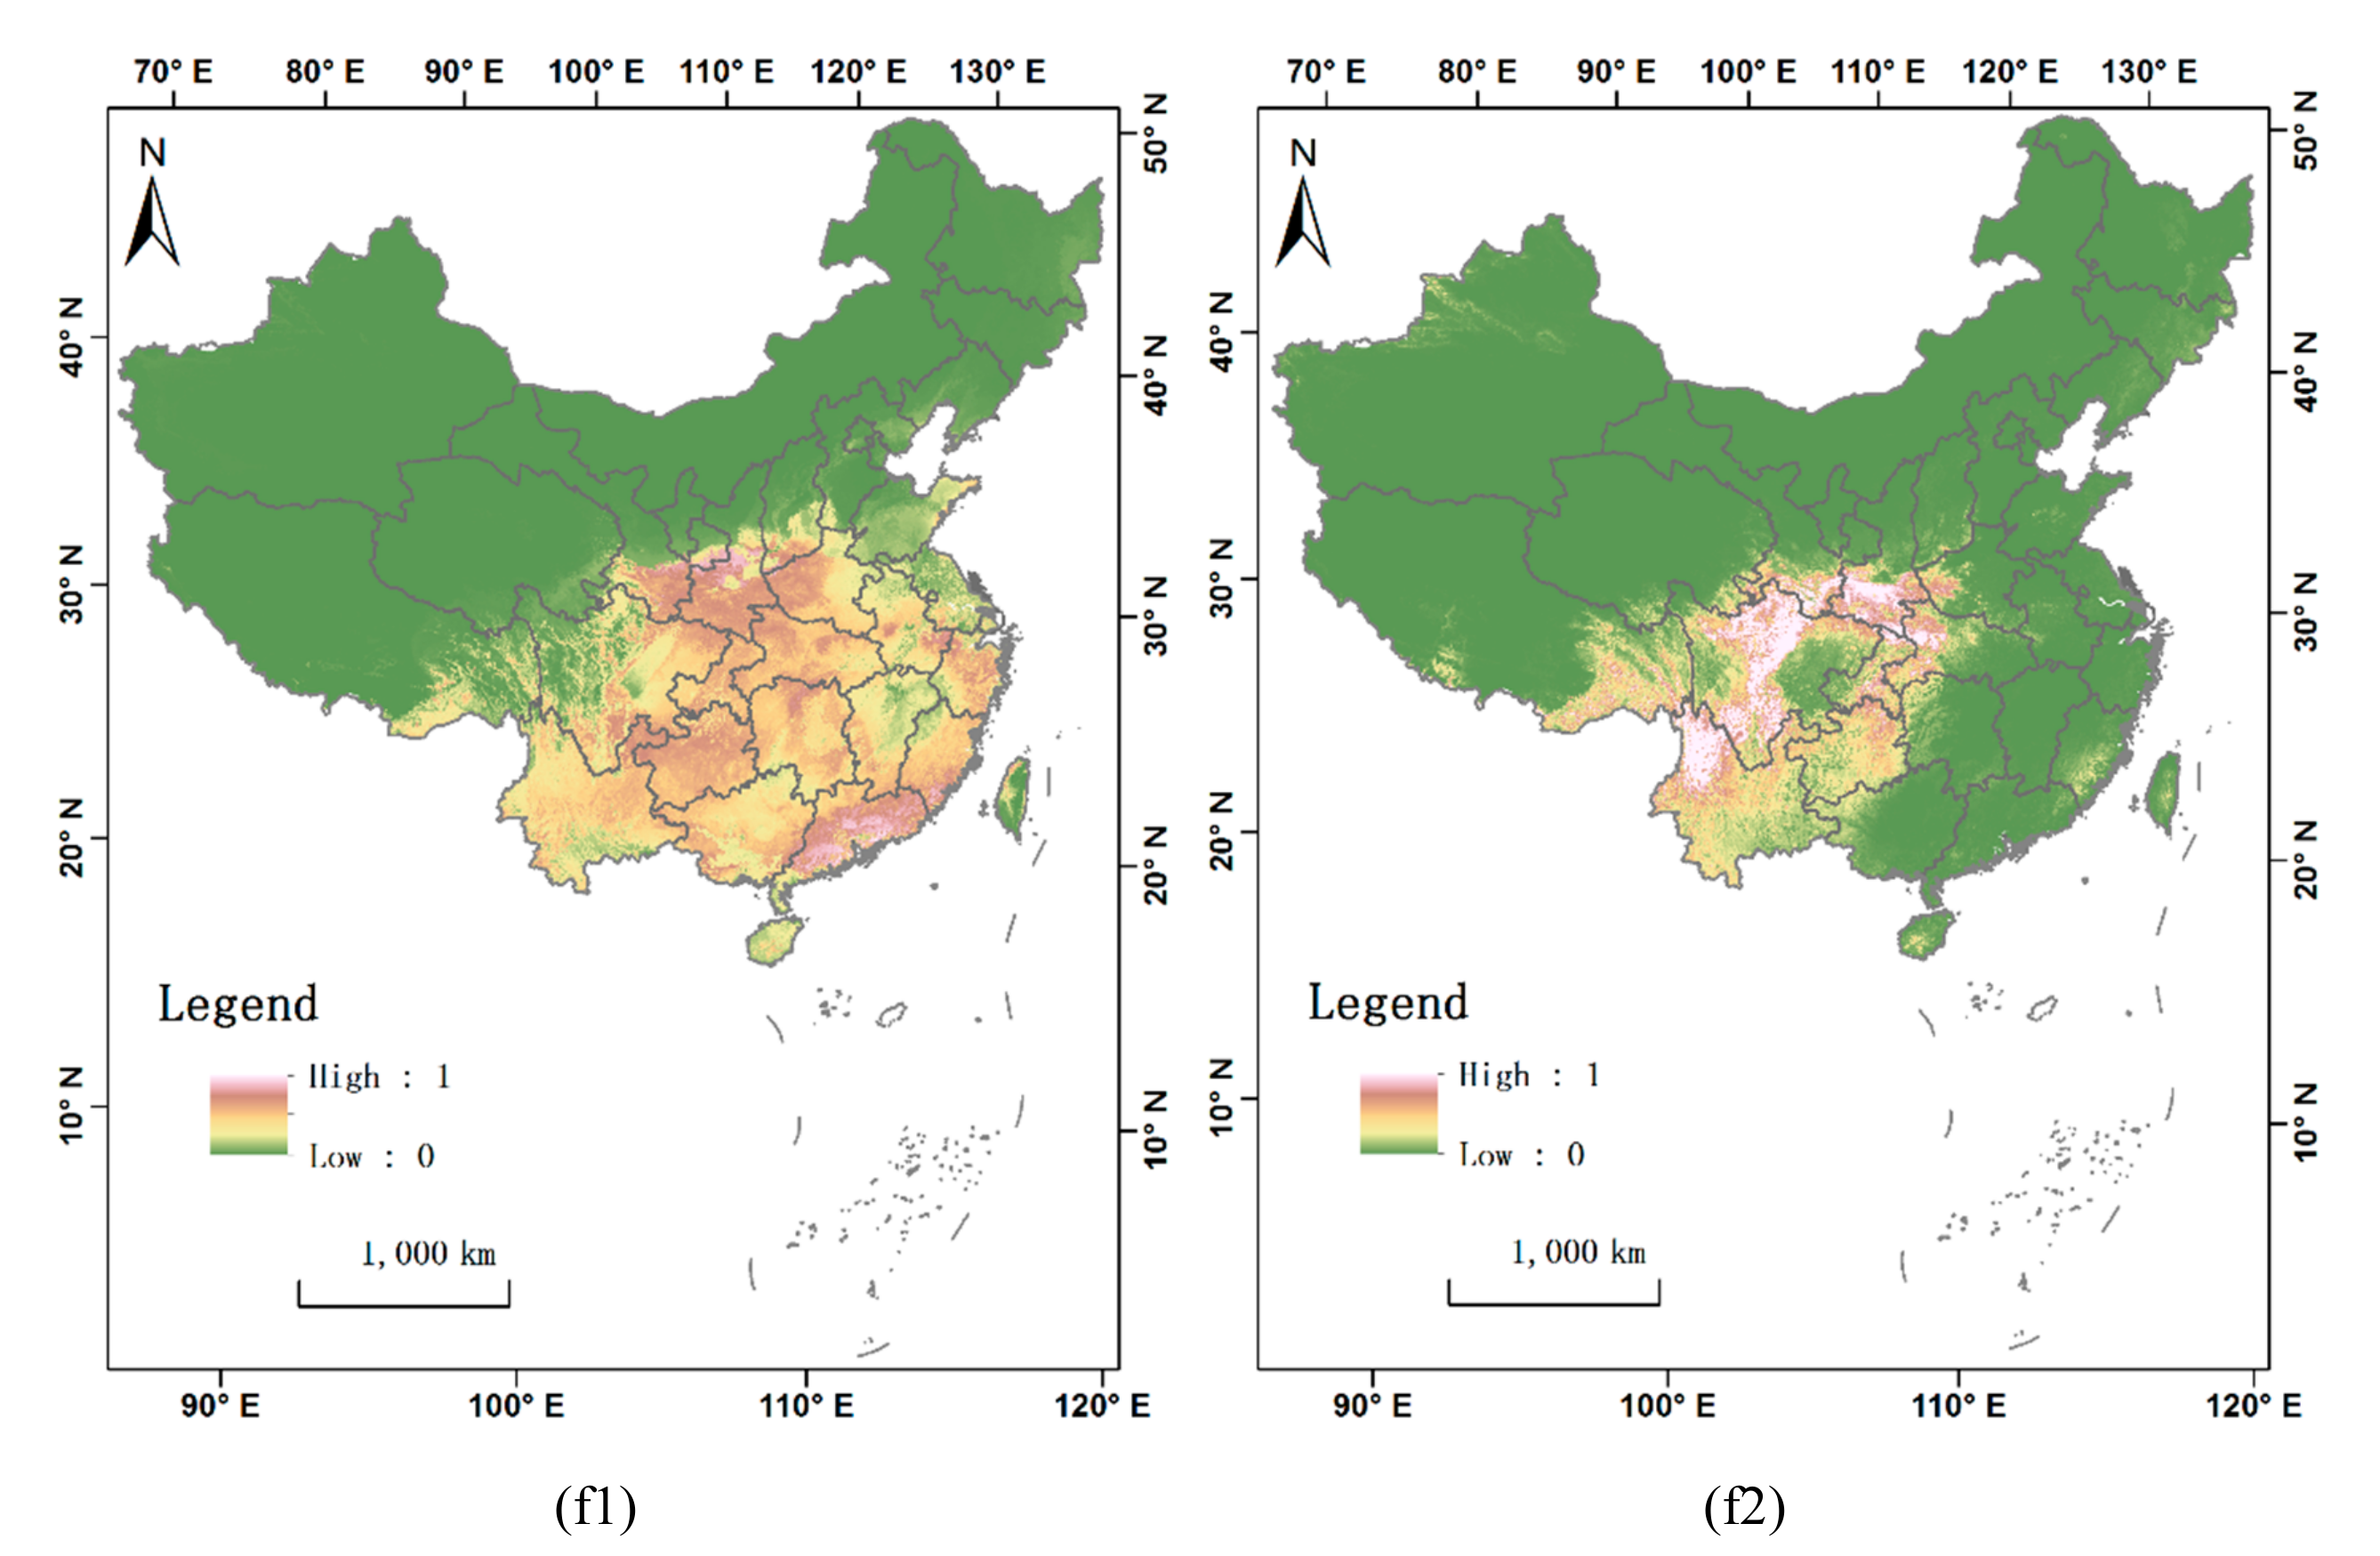
The historical and current habitats of the tiger, Asian elephant, Bactrian camel, musk deer, Chinese water deer, and snub-nosed monkey were estimated using the MaxEnt program (Figure 2). The program outputted probability values between 0 and 1. The cells with higher probability values (represented by red) are more likely to be historical/current habitats for the studied species, and the cells with lower probability values (represented by green) are unlikely to be habitats. The AUC values indicate good performance of MaxEnt modelling for both historical and current habitats of all the six taxa of mammals (Table 3).
Comparing the estimated historical and current habitats, the habitats of all six taxa of mammals have gone through great changes. The habitats of the tiger, Asian elephant, Bactrian camel, Chinese water deer, and snub-nosed monkey have visibly shrunk. Changes in the habitat of the musk deer are not obvious from a comparison of Figure 2(d1,d2).
It is important to note that the Maximum Entropy Model was used to estimate probable habitats in this study. There may be some overestimations of habitat ranges, e.g., the tiger and Asian elephant have not been reported to have been seen in Hainan Island or Taiwan Island (Figure 2(a2,b2)).

3.2. Changes in Habitat Ranges

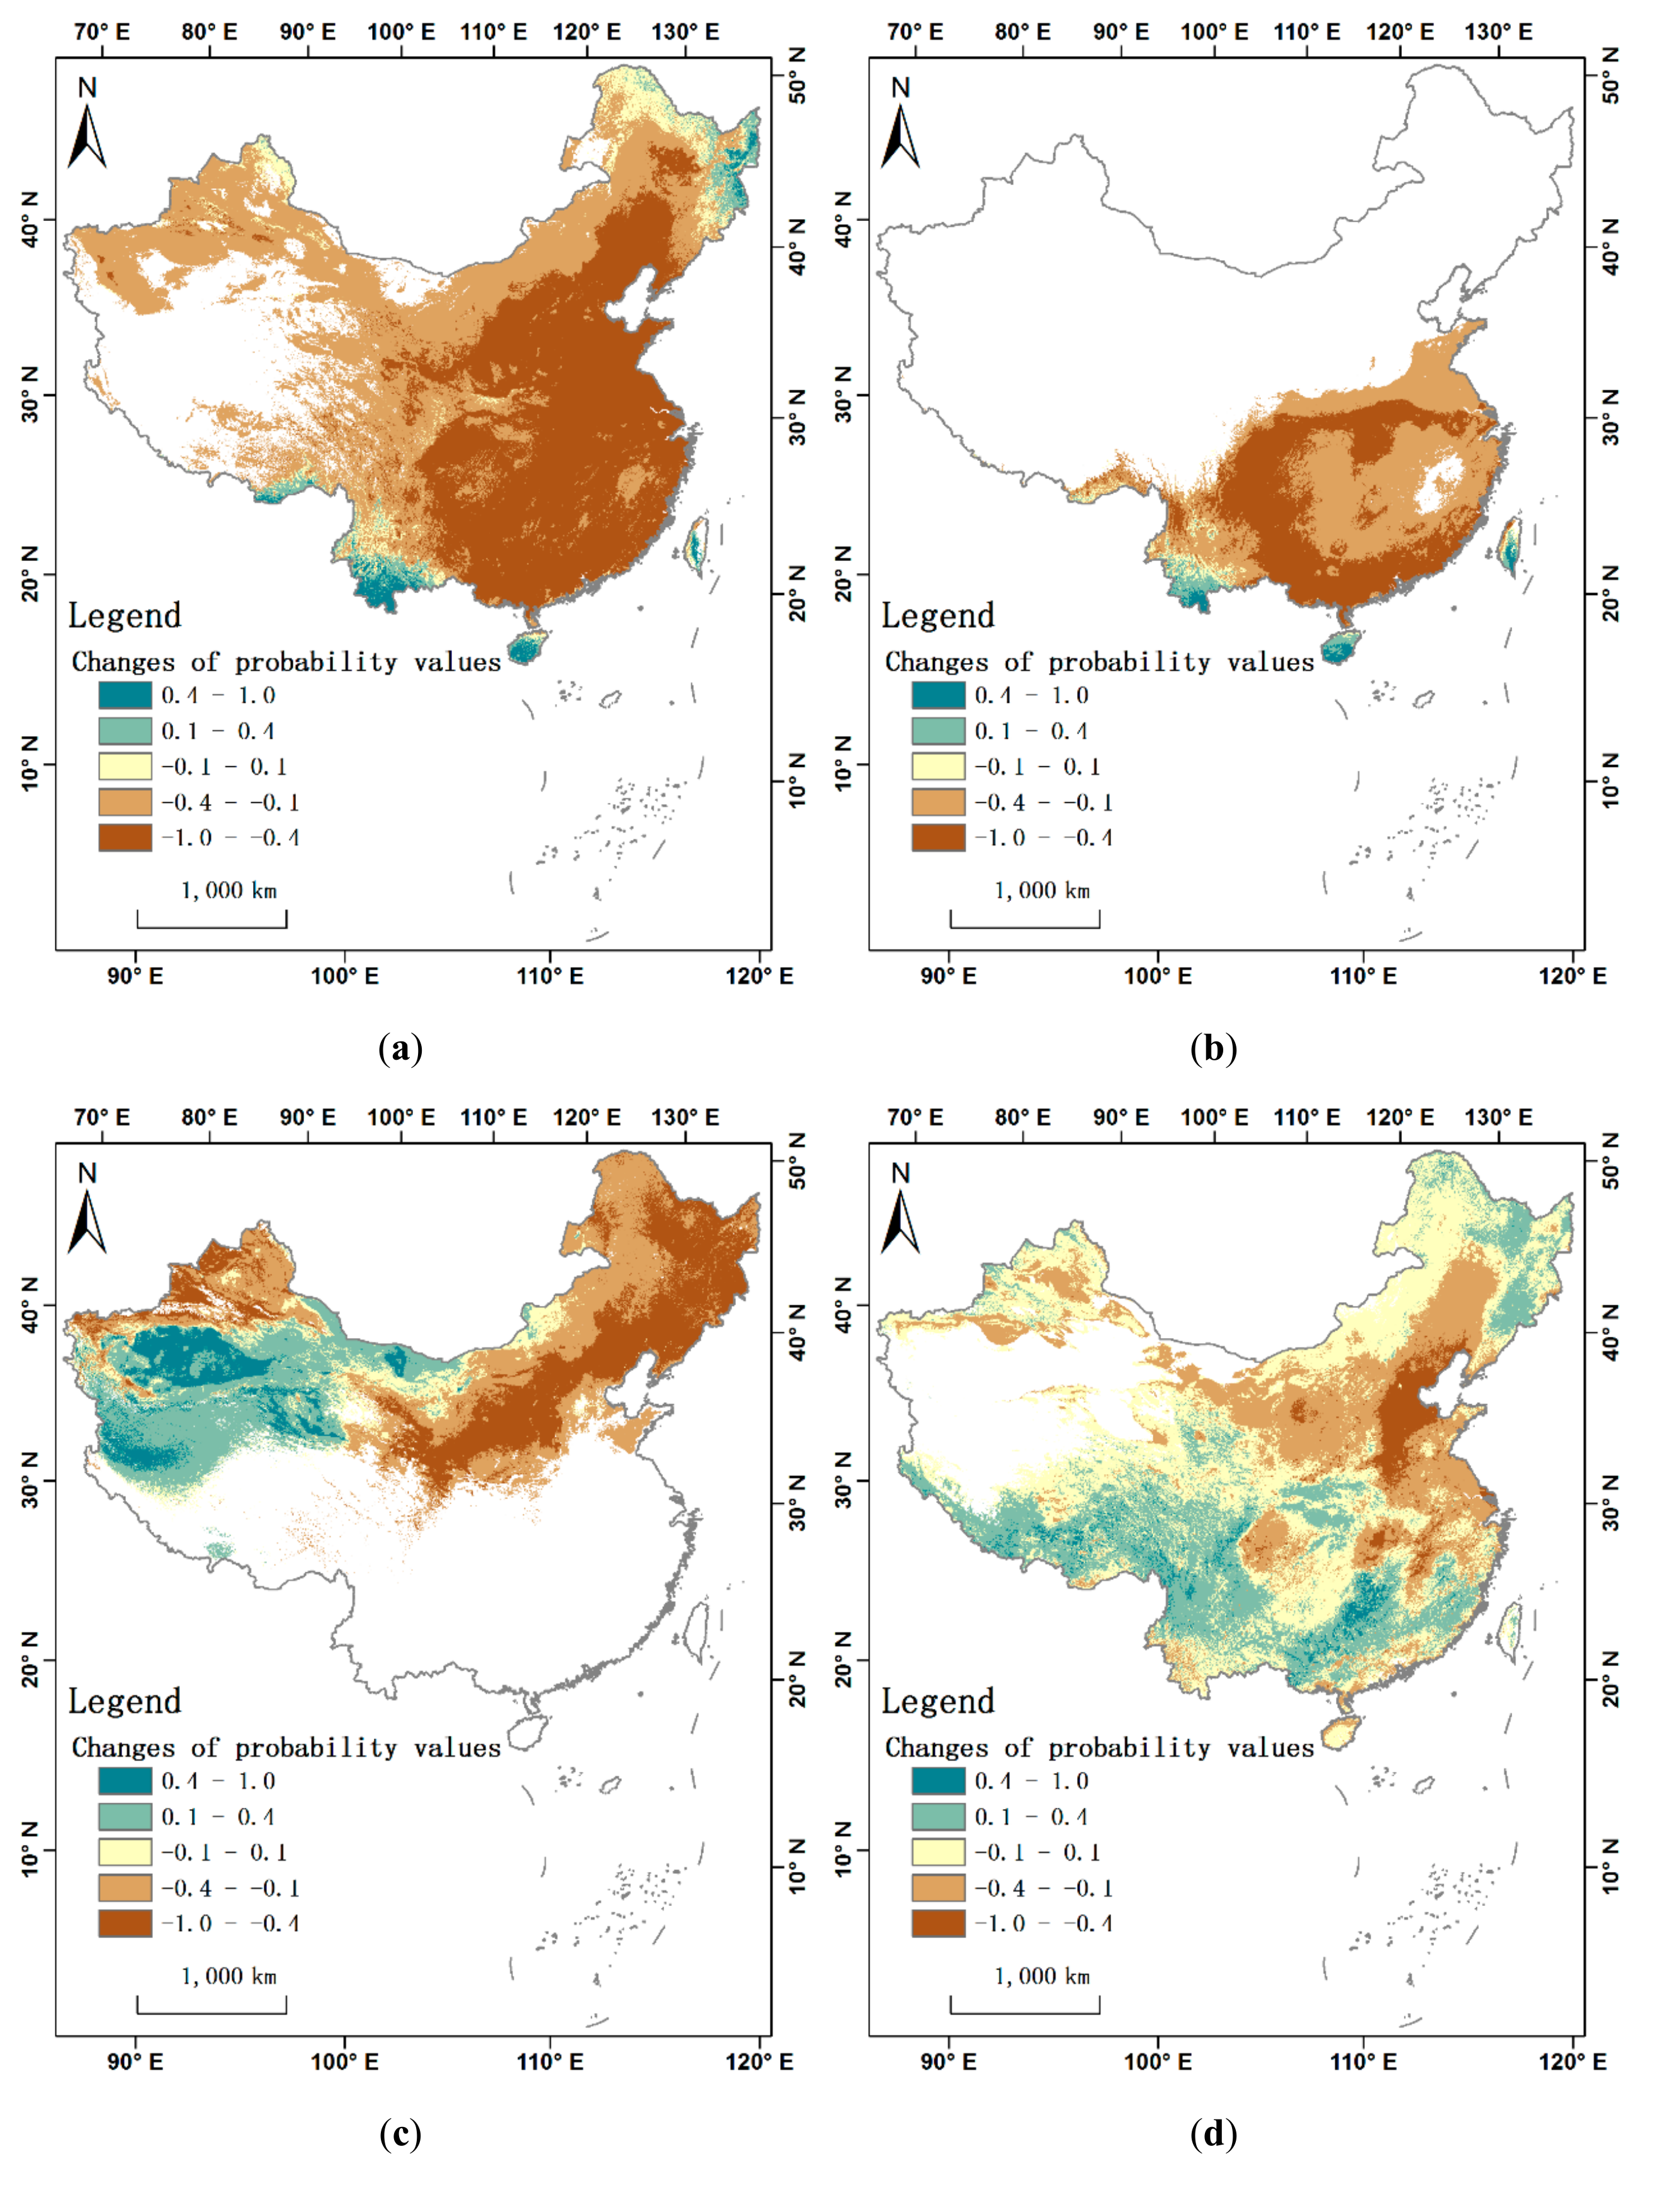
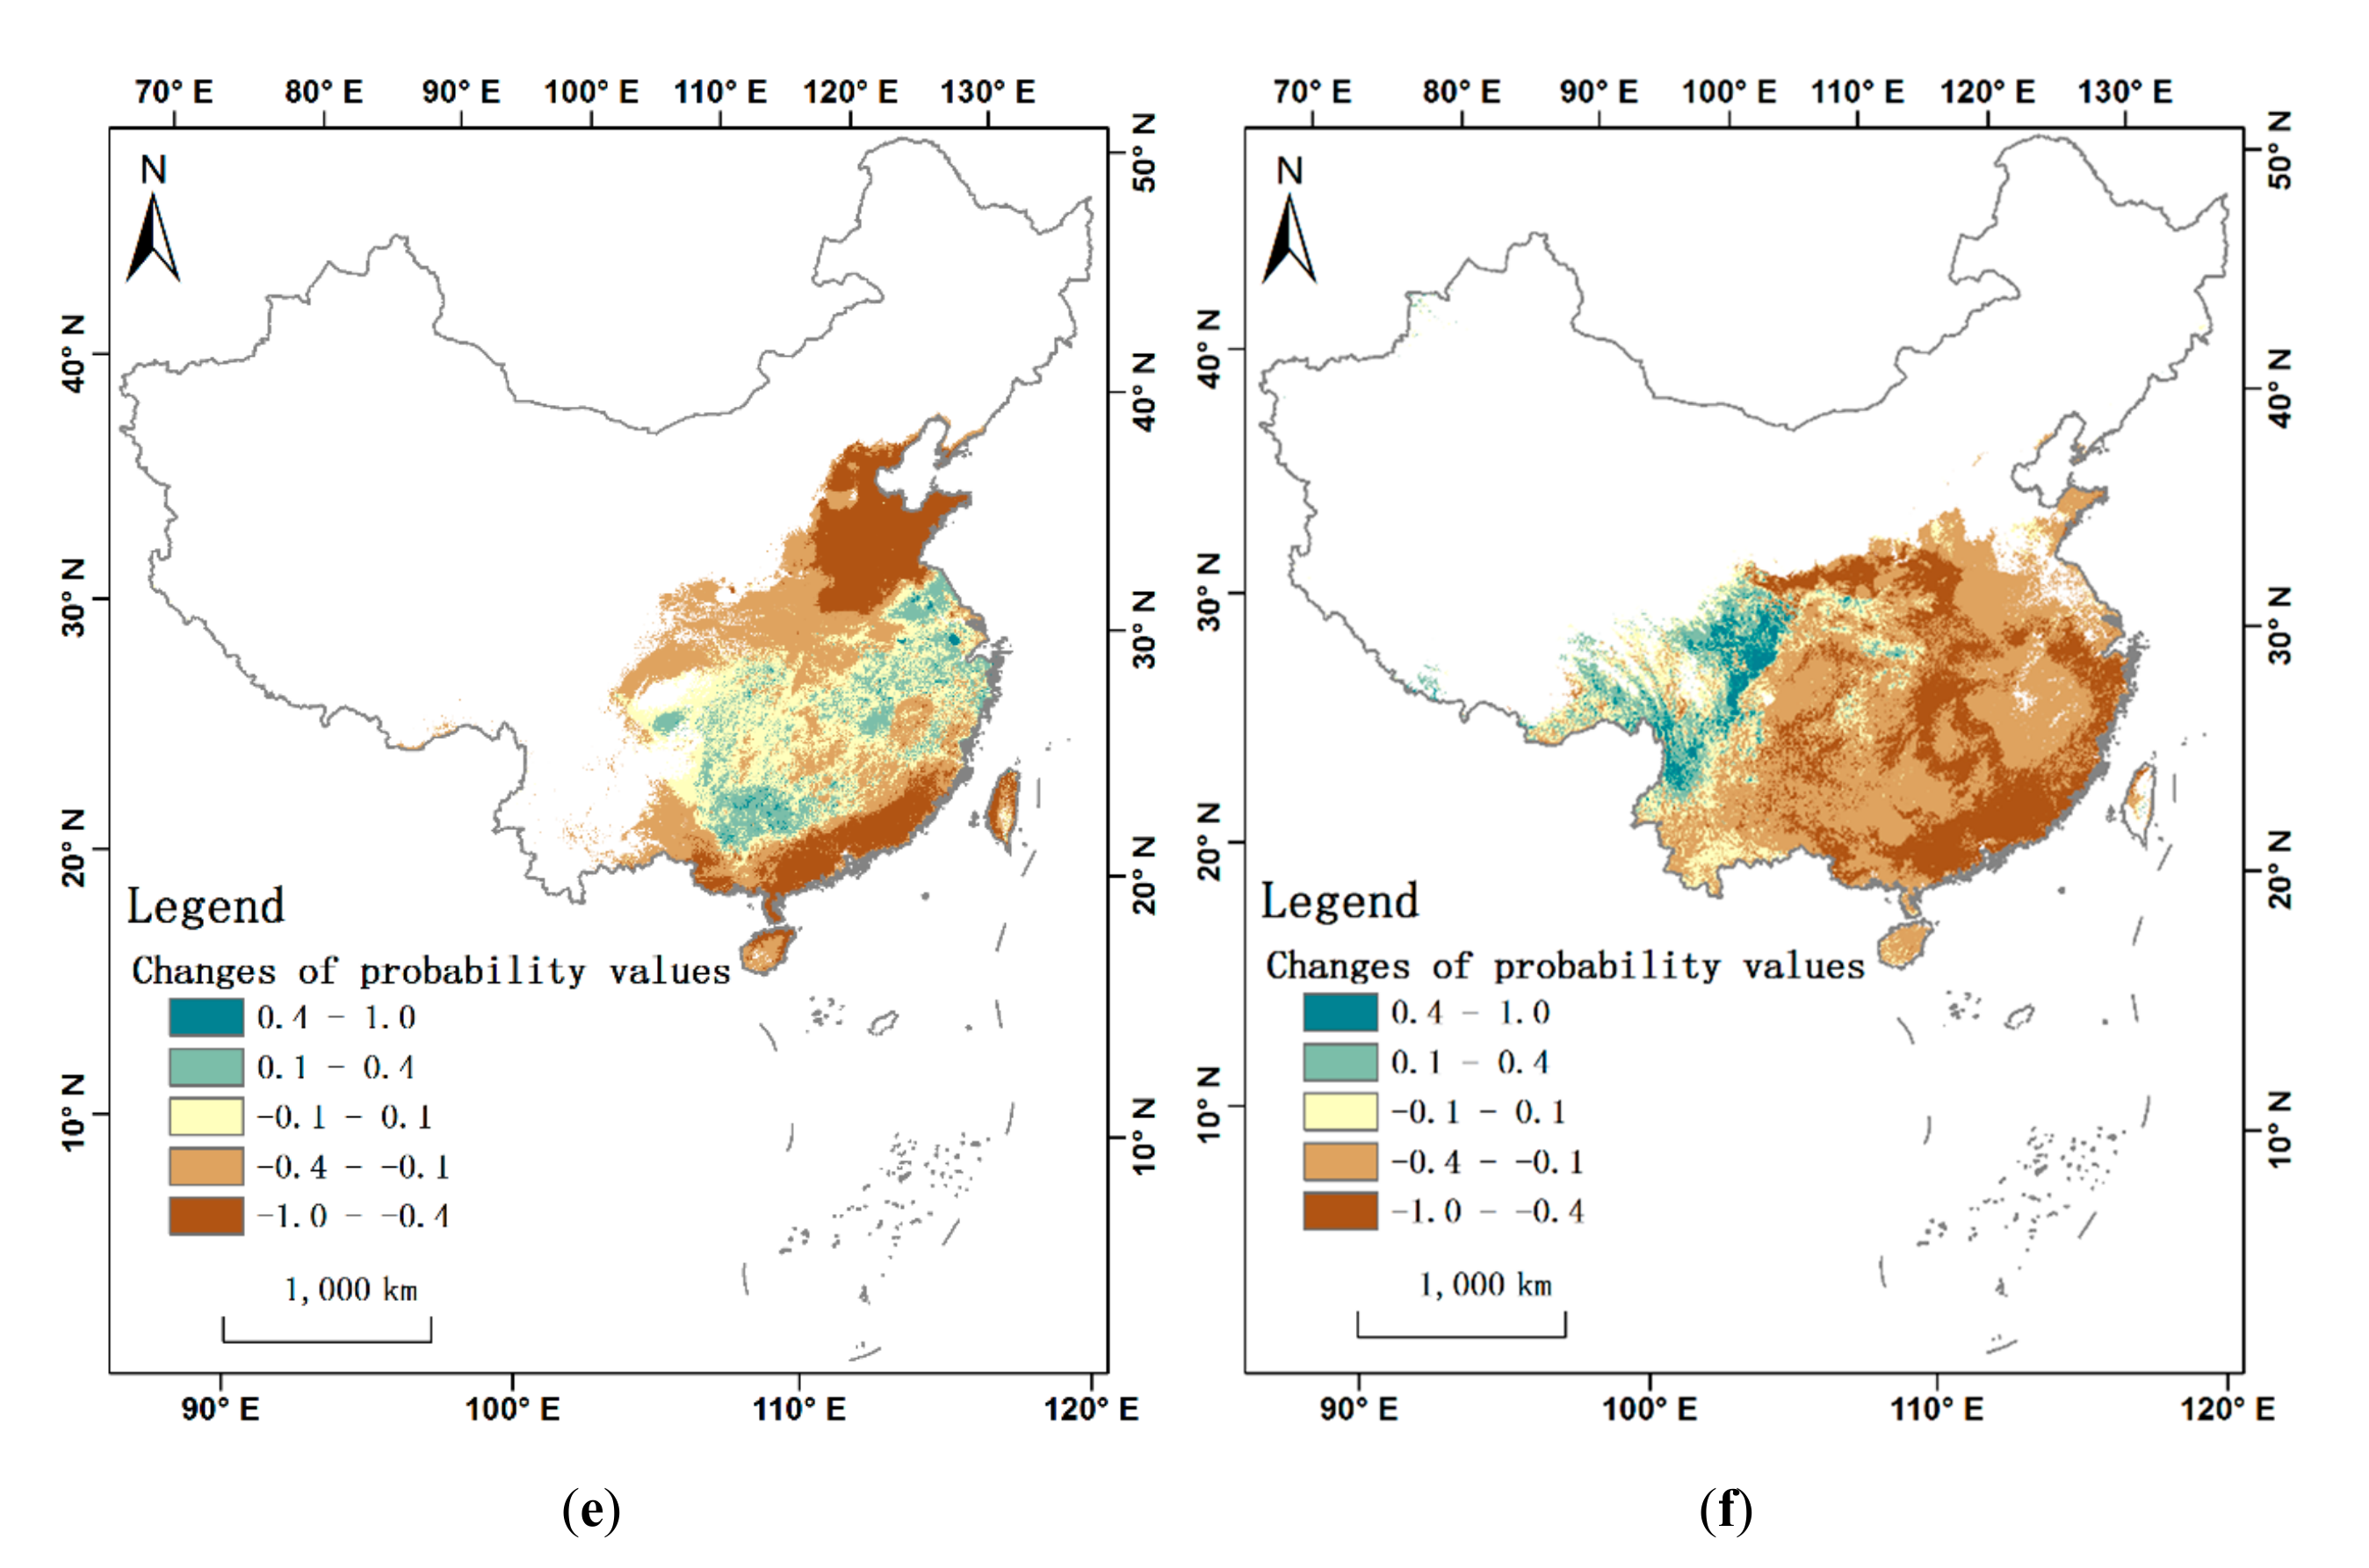
Figure 3 shows the changes between the current and historical habitats of the wild mammals. In the maps, the changes are represented by the differences between the probability values of current habitats and historical habitats, in which only the regions in which the mammal was once or is currently distributed were counted. The greater the difference, the more likely the area is a current habitat rather than a historical habitat. Positive values indicate habitats that have increased, while negative values indicate habitat losses. The probability values range between −1 and 1, their differences range between −1 and 1. The changes were divided into five levels: 0.4–1.0, 0.1–0.4, −0.1–0.1, −0.4–−0.1, −1.0–−0.4.
All six taxa of mammals have experienced habitat losses or movement to different degrees. For the tiger and Bactrian camel (Figure 3a,c), almost all of their historical habitats have been lost. The habitat of the tiger has moved to the north-east and south-west corners of China, and the habitat of the Bactrian camel has moved from the north-east to the north-west, the driest part of China. The Bactrian camel in particular, which originated from a region that is lush with vegetation, has adapted themselves to an arid environment and migrated to untouched areas. Most of the former habitats of the Asian elephant and snub-nosed monkey (Figure 3b,f) have shrunk, and their current habitats are limited to only one or several small parcels. The habitats of the Asian elephant are limited to the south-west corner, while those of the snub-nosed monkey are limited to small parts in the middle-west and south-west. The habitat ranges of the musk deer and Chinese water deer (Figure 3d,e) have not experienced greater changes than other mammals, but they have also shrunk considerably. Most of their habitat loss occurred in the North China Plain and the southern coast, which have the highest population density in China. The area proportions of each change levels are displayed using histograms, for both the six taxa of mammals and their averages (Figure 4).
As shown in Figure 4, all six taxa of mammals are facing further habitat losses, not increases. On average, 68.3% of what is or was habitat has been lost, while only 14.6% of habitat has increased or, alternatively, has become a destination for migrating species. The area of lost habitat of five taxa of mammals (except musk deer) is far larger than the area of their new habitats. For the tiger and Asian elephants in particular, almost the entire area of their habitats faces habitat losses (88.8% for the tiger, 93.1% for the Asian elephant). For the musk deer, only 30.7% of their habitat has decreased, 43.7% of their habitat has not changed much, and 25.6% of their habitat has increased. Compared to other the wild mammals involved in this study, the musk deer has most habitat preserved, owing to their strong ability to adapt to changes in their environment.

3.3. Human Activities Influence on Habitat Change

Three sets of environmental data were used in this study: climate data, topography data, and human activity data. Compared to the climate and topography, the anthropogenic impact on environment experienced tremendous changes through the historical period.
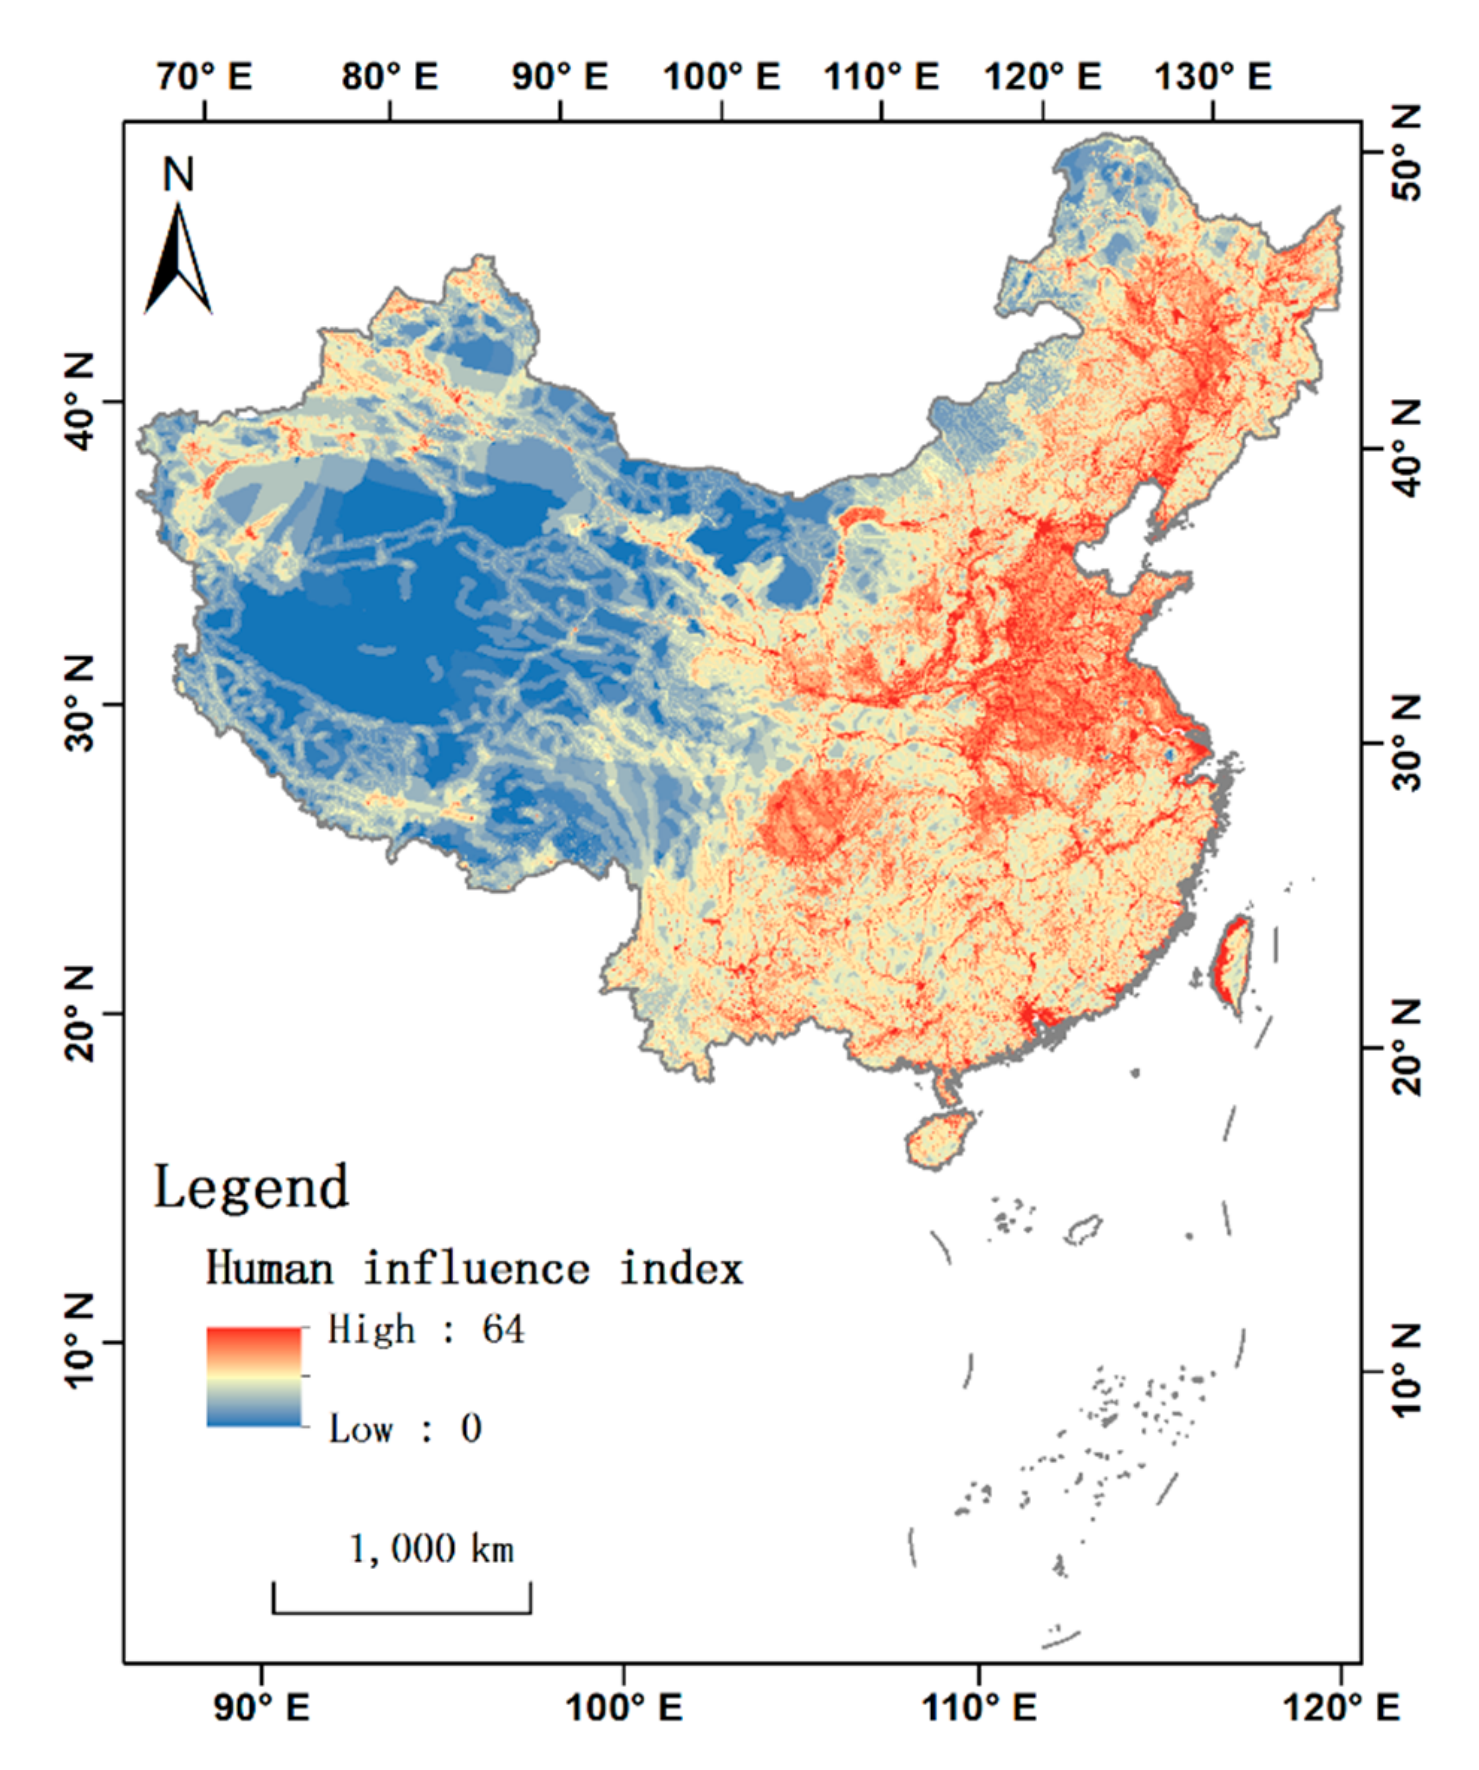
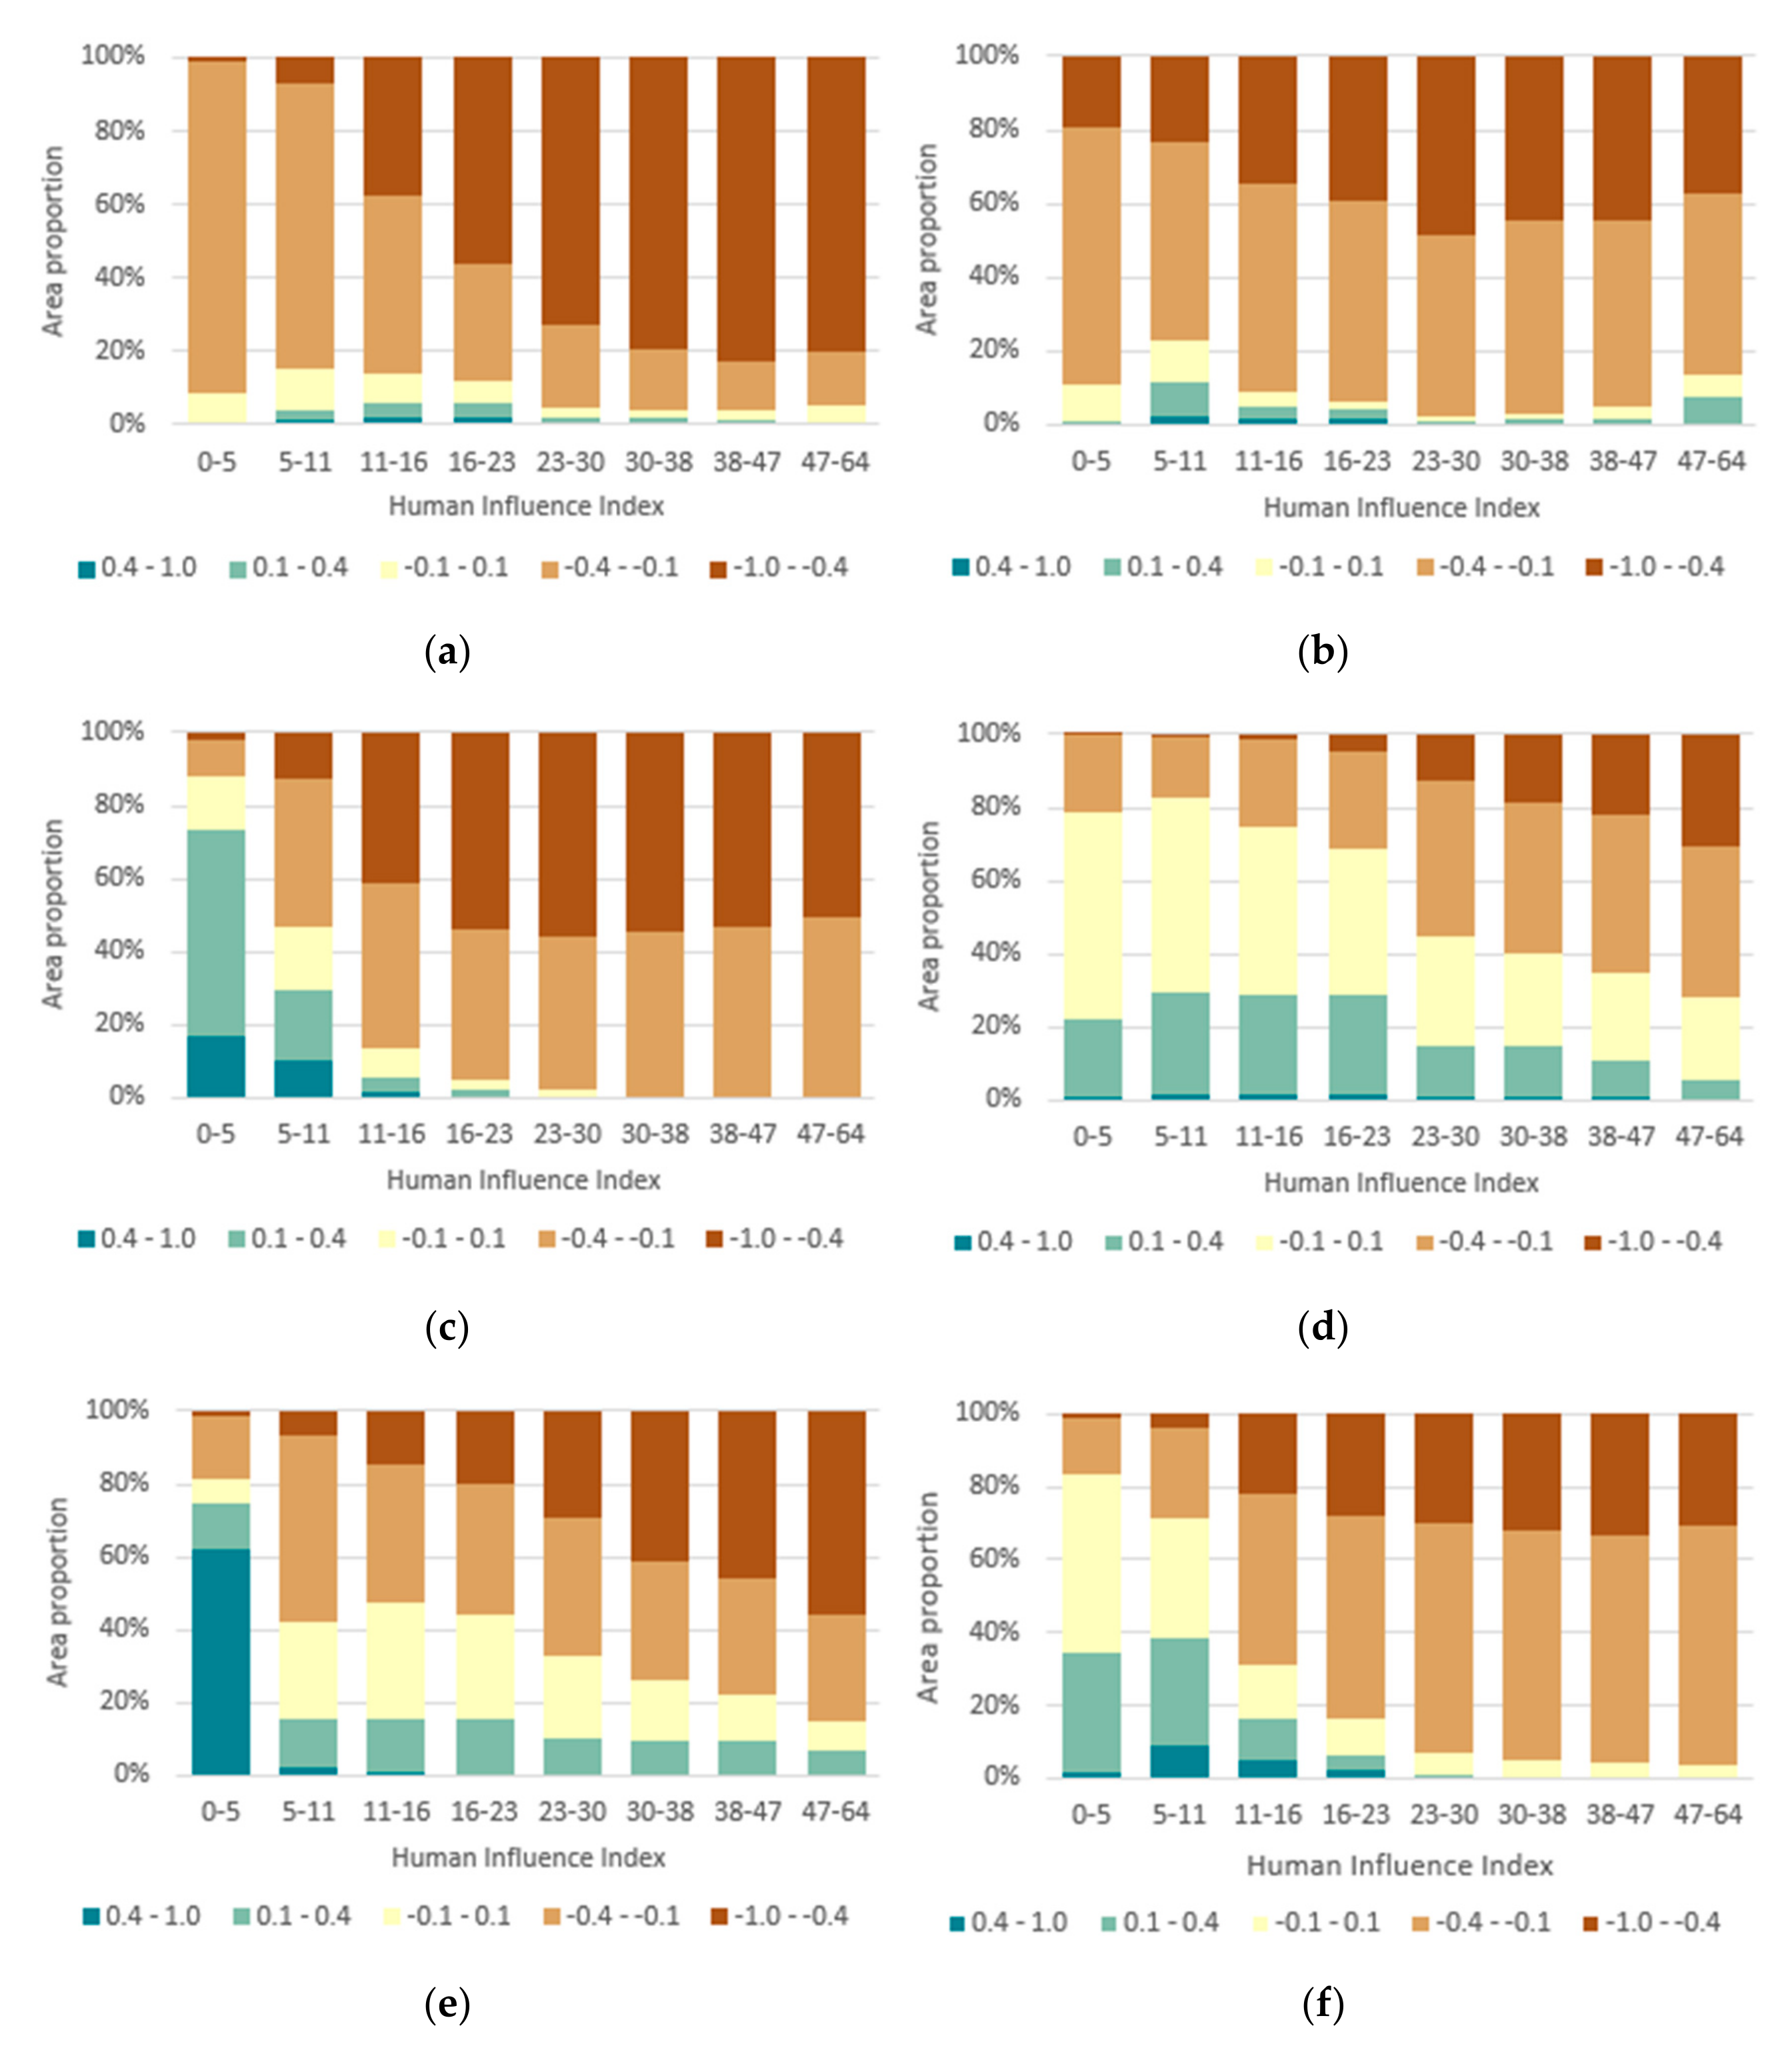
To reveal how human activities influence the habitats of wild mammals, the relationship between the changes in habitats and the HII for each mammal was investigated, respectively, using a spatial statistical analysis of Figure 3 and Figure 5. According to the Jenks Natural Breaks classification method, the HII was divided into eight levels: 0–5, 5–11, 11–16, 16–23, 23–30, 30–38, 38–47, and 47–64. This method grouped similar values and maximized the differences between levels. Figure 6 shows how different levels of habitat change—counted from where their habitat is or was—constitute each level of HII, for each of the six taxa of mammals.
As shown in Figure 6, although different mammals have different area proportions of habitat losses, the habitat losses in higher HII groups are generally higher than those in lower HII groups. In all six histograms, the proportions of increased habitat areas show a descending trend as the HII increases, while the proportions of decreased habitat area show a rising trend; this indicates that humans have had a negative influence on the habitats of wild mammals.
For the musk deer and Chinese water deer (Figure 6d,e), the proportion of habitat losses increased gradually as the HII increased. For the tiger, Asian elephant, Bactrian camel, and snub-nosed monkey (Figure 6a–c,f), in the lower half of the HII groups (HII between 0 and 23), their proportion of habitat losses increased as the HII increased. In the higher half of the HII groups (HII between 23 and 64), the constitution of habitat losses was almost unchanged. However, for the tiger, Asian elephant, Bactrian camel, and snub-nosed monkey, the higher half of the HII groups mainly consisted of habitat losses.
The various habitat changing pattern reflects the various sensitivity of each mammal to human activities. For the musk deer and Chinese water deer, their habitat losses increased across the full range of the HII groups. For the tiger, Asian elephant, Bactrian camel, and snub-nosed monkey, their habitats were mostly lost when the HII increased up to a certain value. In other words, compared to the habitats of the musk deer and Chinese water deer, the habitats of the other four taxa of mammals are mainly lost at lower HII values. These four taxa of mammals reached their maximum habitat loss at a lower HII value comparing to the musk deer and Chinese water deer. Therefore, these four taxa of mammals are more sensitive to human activities, according to the statistics shown in Figure 6.
This study investigated the feeding habits and natural habitats of the four taxa of wild mammals that are most sensitive to human activities, and they are all limited by habitat requirements that are strongly affected by human activities. The tiger is a long-ranging predator, and they typically have large home ranges. They live solitarily within their own territories, for which connective and continuous habitats are important for their hunting and reproduction. Landscape elements, including human settlements and roads, have been proven to be correlated with tiger habitat connectivity [31]. Moreover, as a predator, the tiger is thought to be a threat to livestock and to human beings and was hunted. The Asian elephant is a mega-sized species. An adult individual needs up to 300 kg of plant and 80–200 L of water per day, which makes abundant vegetation and source of water necessities for their habitat. Human activities narrow the available habitats for Asian elephants and intensify human–elephant conflict over food and water sources. The Bactrian camel is a migrant. Though they adapt many special characteristics that enable them to survive in extreme temperatures and arid climates, and can travel for extended time periods and long distances seeking water, their habitats are highly related to the availability of water. Human settlements and pasture near oases force Bactrian camels to inhabit only very remote areas [32]. In contrast, the snub-nosed monkey, unlike the tiger, Asian elephant, and Bactrian camel, is much smaller in size and thus has smaller dietary requirements. However, because of their dietary habits, they prefer to inhabit primary forest and secondary forest to grassland and cultivated land [21,33]. Human activities, especially forest cutting, limit the habitats of the snub-nosed monkey in pathless mountains, and directly leads to habitat isolation and fragmentation.
Compared to the four taxa of mammals that are more sensitive to human activities, the musk deer and Chinese water deer are medium-sized herbivores, which are adapted to various vertical and horizontal climates and food sources. Dues to these adaptions, the influence of human activities has offered them more choices of habitats.

4. Discussion

The Maximum Entropy Model is able to successfully estimate both historical and current habitat ranges based on historical and current mammal occurrence presences, represented by probabilities. Further analysis of habitat range changes, as well as their distribution and driving factors, could be conducted based on the estimated results.

4.1. Habitat Change Hot Zones

The changes in the habitat ranges are driven by various environmental factors. Future environmental changes are expected to further influence the habitat ranges of mammals. Research into habitat changes can offer a large-scale view of nature reserves, where suitable habitats are provided for wildlife.
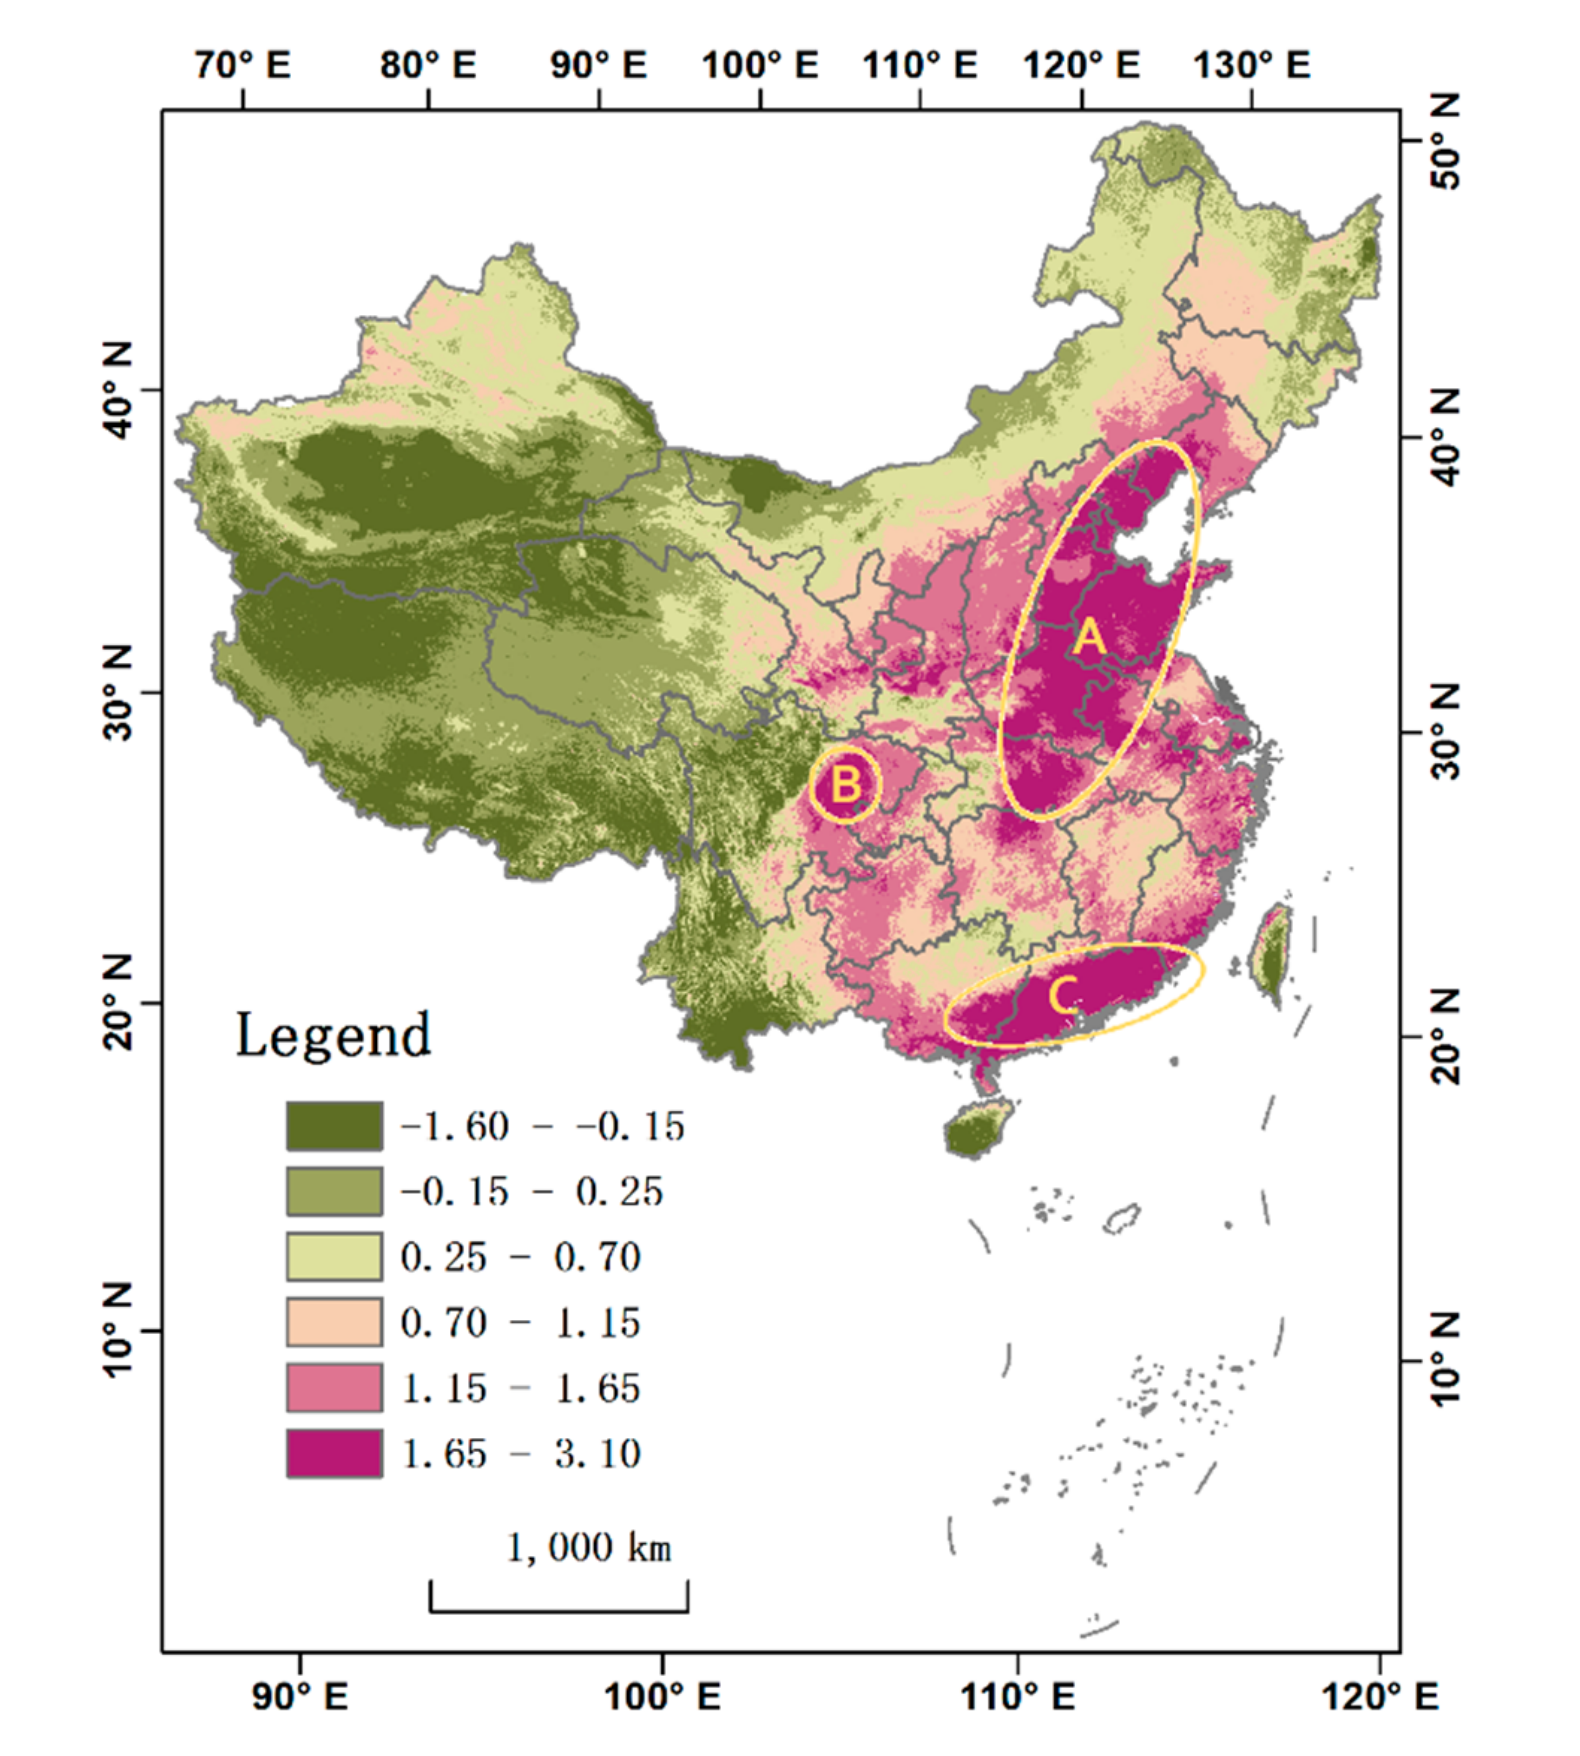
By overlaying the maps of the habitat range changes of the six taxa of mammals (Figure 3a–f), habitat change hot zones are shown on an overall map of habitat changes among the six taxa of mammals (Figure 7). Negative values indicate habitat increases, while positive values indicate habitat losses.
In Figure 7, three habitat loss hot zones are shown using yellow circles. The biggest habitat loss hot zone is located in the North China Plain (circle A), which also has the highest HII (Figure 5). The other two habitat loss hot zones, the Sichuan Basin (circle B) and the southern coast (circle C), are in similar situations. The distribution of habitat loss hot zones approximately coincides with the high-HII zones.
Habitat increase hot zones are mostly distributed in the north-east and south-east of China, as well as a part of the north of China, where nature reserves are clustered. The environment that the six taxa of mammals inhabit tends to be remote and untouched. Their habitats have been squeezed or moved by human activities. To prevent further habitat losses, the regions where habitats are increasing could be potential sites for establishing nature reserves and for reintroducing endangered species.

4.2. Research Assumptions and Limitations

The changes in habitat ranges can be explained by changing natural and anthropogenic impact on environment. In this study, it is assumed that the effects of natural changes are almost negligible compared with the effects of anthropogenic changes throughout history.
Human activities have been found to have obvious negative influences on mammal populations, according to the statistical analysis in the previous section. The historical occurrence data for the mammals were obtained from documents produced over a rather long period of history, most of which were produced during the last few hundreds of years. Due to limited access to data, the accuracy of population occurrence timeframe data is hard to determine, as is the accuracy of historical climate, topography, and human activity data. Given that climate and topography change is a slow, long-term process, while human activities have changed rapidly in recent decades, we used current climate and topography data to delineate the historical environment.
Furthermore, as mentioned previously, the Maximum Entropy Model enables historical habitats to be estimated relatively completely, using limited and uncertain historical occurrence data. However, at the same time, this model may also cause some degree of overestimation. Most areas that have been overestimated in this study are isolated, such as islands and mountains, which mammals are unable to migrate to due to physical barriers. Compared to historical habitat estimation, studies on current habitats have access to more complete datasets. Thus, the actual situation of habitat losses could be worse than our results suggest.
Additionally, also due to the limitations of historical mammal data, six representative taxa of rare mammals were chosen for this study. The mammals chosen varied from small to large-sized mammals, from carnivores to herbivores, and are all typical species that have been noticed to be suffering population decline. Their changes in habitat range can reflect a more general pattern in habitat changes to some extent. However, research on additional species would certainly make the results better represent the universal pattern.

5. Conclusions

In this study, we examined the changes in the historical and current habitats of six taxa of mammals. Based on the historical and current occurrences of these mammals, their habitats were estimated from three sets of environmental data (climate data, topography data, and human activities data), using the Maximum Entropy Model. Next, based on the habitat change maps of the six taxa of mammals, spatial statistical analysis was used to find out how the habitat of each taxa has changed through time, and how human activities influenced each taxon.
In order to delineate a more comprehensive historical animal distribution, work in this study was carried out from a habitat and environment perspective. Changes in habitats forms the core of this research, from which the relationship and conflict between human-made environments and biological environments are reflected.
Due to the limited availability of historical mammal occurrence data, a statistical mechanics model named the Maximum Entropy Model was introduced to historical zoogeography. Through use of this model, historical habitats can be quantitatively measured using probability values, enabling further spatial statistical analysis to be conducted. Based on the results, all the habitats of all six mammal taxa have reduced substantially, compared to their historical habitats. Of sites that currently are or once were habitats, 68.3% of habitats have been lost on average. The Asian elephant, which is facing the most serious habitat losses, has lost 93.1% of its habitats.
From our investigation of the relationships between the changes in habitats and the Human Influence Index for all six taxa of mammals, we concluded that all these mammals included in this study suffered habitat losses and that human activities played an obvious negative role in this. Of these mammals, the tiger, Asian elephant, Bactrian camel, and snub-nosed monkey are more sensitive to human activities, and have therefore reached their maximum habitat loss at a lower HII value; the musk deer and Chinese water deer are relatively less sensitive to human activities, and therefore their habitats mostly continued to decrease across the whole range of the HII.
Changes in the habitats of rare wild mammals through the historical period is not only a reflection of historical environments, but also, more importantly, is an indication for people as to how they should understand and manage conflicts with wildlife. The findings presented in this paper could offer support for wildlife conservation, such as for the establishment of nature reserves and for the selection of reintroduction sites.

Author Contributions

T.Q. conducted the research and drafted the paper. Y.C. collected the data in association with C.X.; C.X. participated in analysis and visualization of data; Z.L. co-supervised the research and had sustainable contributions to reviewing and editing the paper; J.W. supervised the research and offered the original ideas and research goals. All authors reviewed and revised the manuscript, and approved the published version of the manuscript.

Funding

This study was funded by the National Natural Science Foundation of China (41871294).

Conflicts of Interest

The authors declare no conflict of interest.

References

  1. Wen, H.; Wen, R. The Change of the Plant. and Animal in China during Different Historical Period.; Chongqing Publishing House: Chongqing, China, 2006. [Google Scholar]
  2. Wen, R. The Distributions and Changes of Rare Wild Animals in China; Shandong Science & Technology Press: Shandong, China, 2009. [Google Scholar]
  3. Crisci, J.V. The voice of historical biogeography. J. Biogeogr. 2001, 28, 157–168. [Google Scholar] [CrossRef]
  4. Santos-Reis, M.; da Luz Mathias, M. The historical and recent distribution and status of mammals in portugal. Hystrixthe Ital. J. Mammal. 1996, 8. [Google Scholar]
  5. Long, J.L. Introduced Birds of the World; Universe Press: New York, NY, USA, 1981. [Google Scholar]
  6. Long, J.L. Introduced Mammals of the World: Their History, Distribution and Influence; CSIRO: Campbell, ACT, Australia, 2003. [Google Scholar]
  7. Boshoff, A.; Landman, M.; Kerley, G. Filling the gaps on the maps: Historical distribution patterns of some larger mammals in part of southern africa. Trans. South. Afr. Philos. Soc. 2016, 71, 65. [Google Scholar] [CrossRef]
  8. Porras, L.P.; Vazquez, L.-B.; Aguilar, R.S.; Douterlungne, D.; Valenzuela-Galván, D. Influence of human activities on some medium and large-sized mammals’ richness and abundance in the lacandon rainforest. J. Nat. Conserv. 2016, 34, 75–81. [Google Scholar] [CrossRef] [Green Version]
  9. IUCN. The IUCN Red List of Threathened Species, Version 2019-3. Available online: Http://www.Iucnredlist.Org (accessed on 22 March 2020).
  10. Crisci, J.; Katinas, L.; Posadas, P.; Crisci, J.V. Historical Biogeography: An. Introduction; Harvard University Press: Cambridge, MA, USA, 2009. [Google Scholar]
  11. Costa, L.P. The historical bridge between the amazon and the atlantic forest of brazil: A study of molecular phylogeography with small mammals. J. Biogeogr. 2003, 30, 71–86. [Google Scholar] [CrossRef] [Green Version]
  12. Boshoff, A.F.; Kerley, G.I.H. Potential distributions of the medium- to large-sized mammals in the cape floristic region, based on historical accounts and habitat requirements. Zool. Afr. 2001, 36, 245–273. [Google Scholar] [CrossRef]
  13. Boshoff, A.F.; Kerley, G.I.H.; Cowling, R.M. A pragmatic approach to estimating the distributions and spatial requirements of the medium- to large-sized mammals in the cape floristic region, south africa. Divers. Distrib. 2001, 7, 29–43. [Google Scholar] [CrossRef] [Green Version]
  14. Cui, S.; Milnergulland, E.J.; Singh, N.J.; Chu, H.; Li, C.; Chen, J.; Jiang, Z. Historical range, extirpation and prospects for reintroduction of saigas in china. Sci. Rep. 2017, 7, 44200. [Google Scholar] [CrossRef]
  15. Turvey, S.T.; Crees, J.J.; Di Fonzo, M.M. Historical data as a baseline for conservation: Reconstructing long-term faunal extinction dynamics in late imperial–modern china. Proc. R. Soc. B Biol. Sci. 2015, 282, 20151299. [Google Scholar] [CrossRef]
  16. Turvey, S.T.; Crees, J.J.; Li, Z.; Bielby, J.; Yuan, J. Long-term archives reveal shifting extinction selectivity in china’s postglacial mammal fauna. Proc. R. Soc. B Biol. Sci. 2017, 284, 20171979. [Google Scholar] [CrossRef] [Green Version]
  17. Wan, X.; Zhang, Z. Climate warming and humans played different roles in triggering late quaternary extinctions in east and west eurasia. Proc. R. Soc. B Biol. Sci. 2017, 284, 20162438. [Google Scholar] [CrossRef] [PubMed]
  18. Zhao, X.; Ren, B.; Garber, P.A.; Li, X.; Li, M. Impacts of human activity and climate change on the distribution of snub-nosed monkeys in china during the past 2000 years. Divers. Distrib. 2018, 24, 92–102. [Google Scholar] [CrossRef] [Green Version]
  19. Nüchel, J.; Bøcher, P.K.; Xiao, W.; Zhu, A.-X.; Svenning, J.-C. Snub-nosed monkeys (Rhinopithecus): Potential distribution and its implication for conservation. Biodivers. Conserv. 2018, 27, 1517–1538. [Google Scholar] [CrossRef] [PubMed] [Green Version]
  20. Wan, X.; Jiang, G.; Yan, C.; He, F.; Wen, R.; Gu, J.; Li, X.; Ma, J.; Stenseth, N.C.; Zhang, Z. Historical records reveal the distinctive associations of human disturbance and extreme climate change with local extinction of mammals. Proc. Natl. Acad. Sci. USA 2019, 116, 19001–19008. [Google Scholar] [CrossRef] [PubMed] [Green Version]
  21. Li, Y. The effect of forest clear-cutting on habitat use in sichuan snub-nosed monkey (Rhinopithecus roxellana) in shennongjia nature reserve, China. Primates 2004, 45, 69–72. [Google Scholar] [CrossRef] [PubMed]
  22. Jaynes, E.T. Information theory and statistical mechanics I. Phys. Rev. 1957, 106, 620–630. [Google Scholar] [CrossRef]
  23. Jaynes, E.T. Probability theory: The logic of science. Math. Intell. 2005, 27, 83. [Google Scholar]
  24. Phillips, S.J.; Anderson, R.P.; Schapire, R.E. Maximum entropy modeling of species geographic distributions. Ecol. Model. 2006, 190, 231–259. [Google Scholar] [CrossRef] [Green Version]
  25. Phillips, S.; Dudik, M. Modeling of species distributions with maxent: New extensions and a comprehensive evaluation. Ecography 2010, 31, 161–175. [Google Scholar] [CrossRef]
  26. Wang, S.; Xie, Y. China Species Red List; Vertebrates Part 2; Higher Education Press: Beijing, China, 2009; Volume II. [Google Scholar]
  27. Jiang, Z.; Ma, Y.; Wu, Y.; Wang, Y.; Zhou, K.; Liu, S.; Feng, Z. China’s Mammal. Diversity and Geographic Distribution; Science Press: Beijing, China, 2015; p. 402. [Google Scholar]
  28. Fick, S.E.; Hijmans, R.J. Worldclim 2: New 1-km spatial resolution climate surfaces for global land areas. Int. J. Climatol. 2017, 37, 4302–4315. [Google Scholar] [CrossRef]
  29. Xi, C.-B.; Qian, T.-L.; Chi, Y.; Chen, J.; Wang, J.-C. Relationship between settlements and topographical factors: An example from sichuan province, china. J. Mt. Sci. 2018, 15, 2043–2054. [Google Scholar] [CrossRef]
  30. Wildlife Conservation Society—WCS; Center for International Earth Science Information Network—CIESIN—Columbia University. Last of the Wild Project, Version 2, 2005 (lwp-2): Global Human Influence Index (hii) Dataset (Geographic); NASA Socioeconomic Data and Applications Center (SEDAC): Palisades, NY, USA, 2005. [Google Scholar]
  31. Aditya, J.; Srinivas, V.; Samrat, M.; Advait, E.; Uma, R. Connectivity of tiger (Panthera tigris) populations in the human-influenced forest mosaic of central india. PLoS ONE 2013, 8, e77980. [Google Scholar]
  32. Kaczensky, P.; Adiya, Y.; Wehrden, H.; Mijiddorj, B.; Walzer, C.; G¨¹thline, D.; Enkhbilegb, D.; Reading, R.P. Space and habitat use by wild Bactrian camels in the transaltai gobi of southern mongolia. Biol. Conserv. 2014, 169, 311–318. [Google Scholar] [CrossRef] [PubMed] [Green Version]
  33. Xiang, Z.F.; Huo, S.; Xiao, W. Habitat selection of black-and-white snub-nosed monkeys (Rhinopithecus bieti) in tibet: Implications for species conservation. Am. J. Primatol. 2011, 73, 347–355. [Google Scholar] [CrossRef] [PubMed]
Figure 1. Presence occurrences of the six taxa of mammals, which are (a) the tiger (1135 historical and 18 current occurrences), (b) Asian elephant (287 historical and 8 current occurrences), (c) Bactrian camel (268 historical and 19 current occurrences), (d) musk deer (492 historical and 693 current occurrences), (e) Chinese water deer (371 historical and 166 current occurrences), and (f) snub-nosed monkey (289 historical and 83 current occurrences). Current presence occurrences are denoted by red points and historical presence occurrences are denoted by blue points.
Sustainability 12 02744 g001aSustainability 12 02744 g001b
Figure 2. Historical and current habitat estimation (illustrated by probability value ranging between 0 and 1 calculated using the Maximum Entropy Model), for the (a1) historical and (a2) current habitat of the tiger; the (b1) historical and (b2) current habitat of the Asian elephant; the (c1) historical and (c2) current habitat of the Bactrian camel; (d1) the historical and (d2) current habitat of the musk deer; the (e1) historical and (e2) current habitat of the Chinese water deer; and (f1) the historical and (f2) current habitat of the snub-nosed monkey.
Sustainability 12 02744 g002aSustainability 12 02744 g002bSustainability 12 02744 g002cSustainability 12 02744 g002d
Figure 3. Mapping habitat range changes by changes of probability values for the (a) tiger, (b) Asian elephant, (c) Bactrian camel, (d) musk deer, (e) Chinese water deer, and (f) snub-nosed monkey. The differences between the current and historical probability values range between −1 and 1. The negative values (illustrated in brown) indicate habitat losses and vice versa.
Sustainability 12 02744 g003aSustainability 12 02744 g003b
Figure 4. Area proportions for the change levels of the six taxa of mammals and their averages. The changes were divided into five levels: 0.4–1.0, 0.1–0.4, −0.1–0.1, −0.4–−0.1, −1.0–−0.4. Negative values indicate habitat losses and vice versa.
Sustainability 12 02744 g004
Figure 5. Human Influence Index (HII), Version 2, accessed via the Socioeconomic Data and Applications Center (SEDAC). The HII is an open dataset mapping anthropogenic impacts on the environment, created from 9 layers covering 3 aspects of human influence—human population pressure, human land use and infrastructure, and human access.
Sustainability 12 02744 g005
Figure 6. Changes in habitats at different levels of the Human Influence Index (HII) for the (a) tiger, (b) Asian elephant, (c) Bactrian camel, (d) musk deer, (e) Chinese water deer, and (f) snub-nosed monkey. The HII was divided into eight levels (0–5, 5–11, 11–16, 16–23, 23–30, 30–38, 38–47, and 47–64) according to the Jenks Natural Breaks method.
Sustainability 12 02744 g006
Figure 7. Habitat change hot zones. The habitat loss areas are illustrated in dark purple, and the three largest habitat loss hot zones are marked by yellow circles A, B, and C.
Sustainability 12 02744 g007
Table 1. Six taxa of rare wild mammals involved in this paper.
MammalsCategory in the China Key ListCategory in the IUCN Red List 1
TigerPanthera tigrisIEN
Asian elephantElephas maximusIEN
Bactrian CamelCamelus bactrianusICR
Family MoschidaeAnhui musk deerMoschus anhuiensisIEN
Forest musk dearM. berezovskiiEN
Alpine musk deerM. chrysogaster sifanicusEN
Black musk deerM. fuscusEN
Himalayan musk deerM. leucogasterEN
Siberian musk deerM. moschiferusVU
Chinese water deerHydropotes inermisIIVU
Genus RhinopithecusBlack snub-nosed monkeyRhinopithecus bietiIEN
Grey snub-nosed monkeyR. brelichi
Golden snub-nosed monkeyR. roxellana
1 Categories in the IUCN Red List: Extinct (EX), Extinct in the wild (EW), Critically Endangered (CR), Endangered (EN), Vulnerable (VU), Near Threatened (NT), Conservation Dependent (CD), Least Concern (LC), Data Deficient (DD), Not Evaluated (NE).
Table 2. Bioclimatic variables and their descriptions in dataset WorldClim, Version 2.
Variable CodeVariable Description
BIO1Annual Mean Temperature
BIO2Mean Diurnal Range (Mean of monthly (max temp–min temp))
BIO3Isothermality (BIO2/BIO7) (×100)
BIO4Temperature Seasonality (standard deviation × 100)
BIO5Max Temperature of Warmest Month
BIO6Min Temperature of Coldest Month
BIO7Temperature Annual Range (BIO5 − BIO6)
BIO8Mean Temperature of Wettest Quarter
BIO9Mean Temperature of Driest Quarter
BIO10Mean Temperature of Warmest Quarter
BIO11Mean Temperature of Coldest Quarter
BIO12Annual Precipitation
BIO13Precipitation of Wettest Month
BIO14Precipitation of Driest Month
BIO15Precipitation Seasonality (Coefficient of Variation)
BIO16Precipitation of Wettest Quarter
BIO17Precipitation of Driest Quarter
BIO18Precipitation of Warmest Quarter
BIO19Precipitation of Coldest Quarter
Table 3. Area under the Receiver Operating Characteristic Curve (AUC) values of historical and current habitat estimation using MaxEnt modelling for the six taxa of wild mammals.
AUC
Historical habitat modellingCurrent habitat modelling
Tiger0.7690.989
Asian elephant0.9380.995
Bactrian camel0.8900.955
Family Moschidae0.8350.838
Chinese water deer0.9330.969
Genus Rhinopithecus0.9260.981