Changes in the Historical and Current Habitat Ranges of Rare Wild Mammals in China: A Case Study of Six Taxa of Small- to Large-Sized Mammals


Abstract
:1. Introduction
2. Methods and Data
2.1. Rare Mammal Species
2.2. Estimation of Habitats
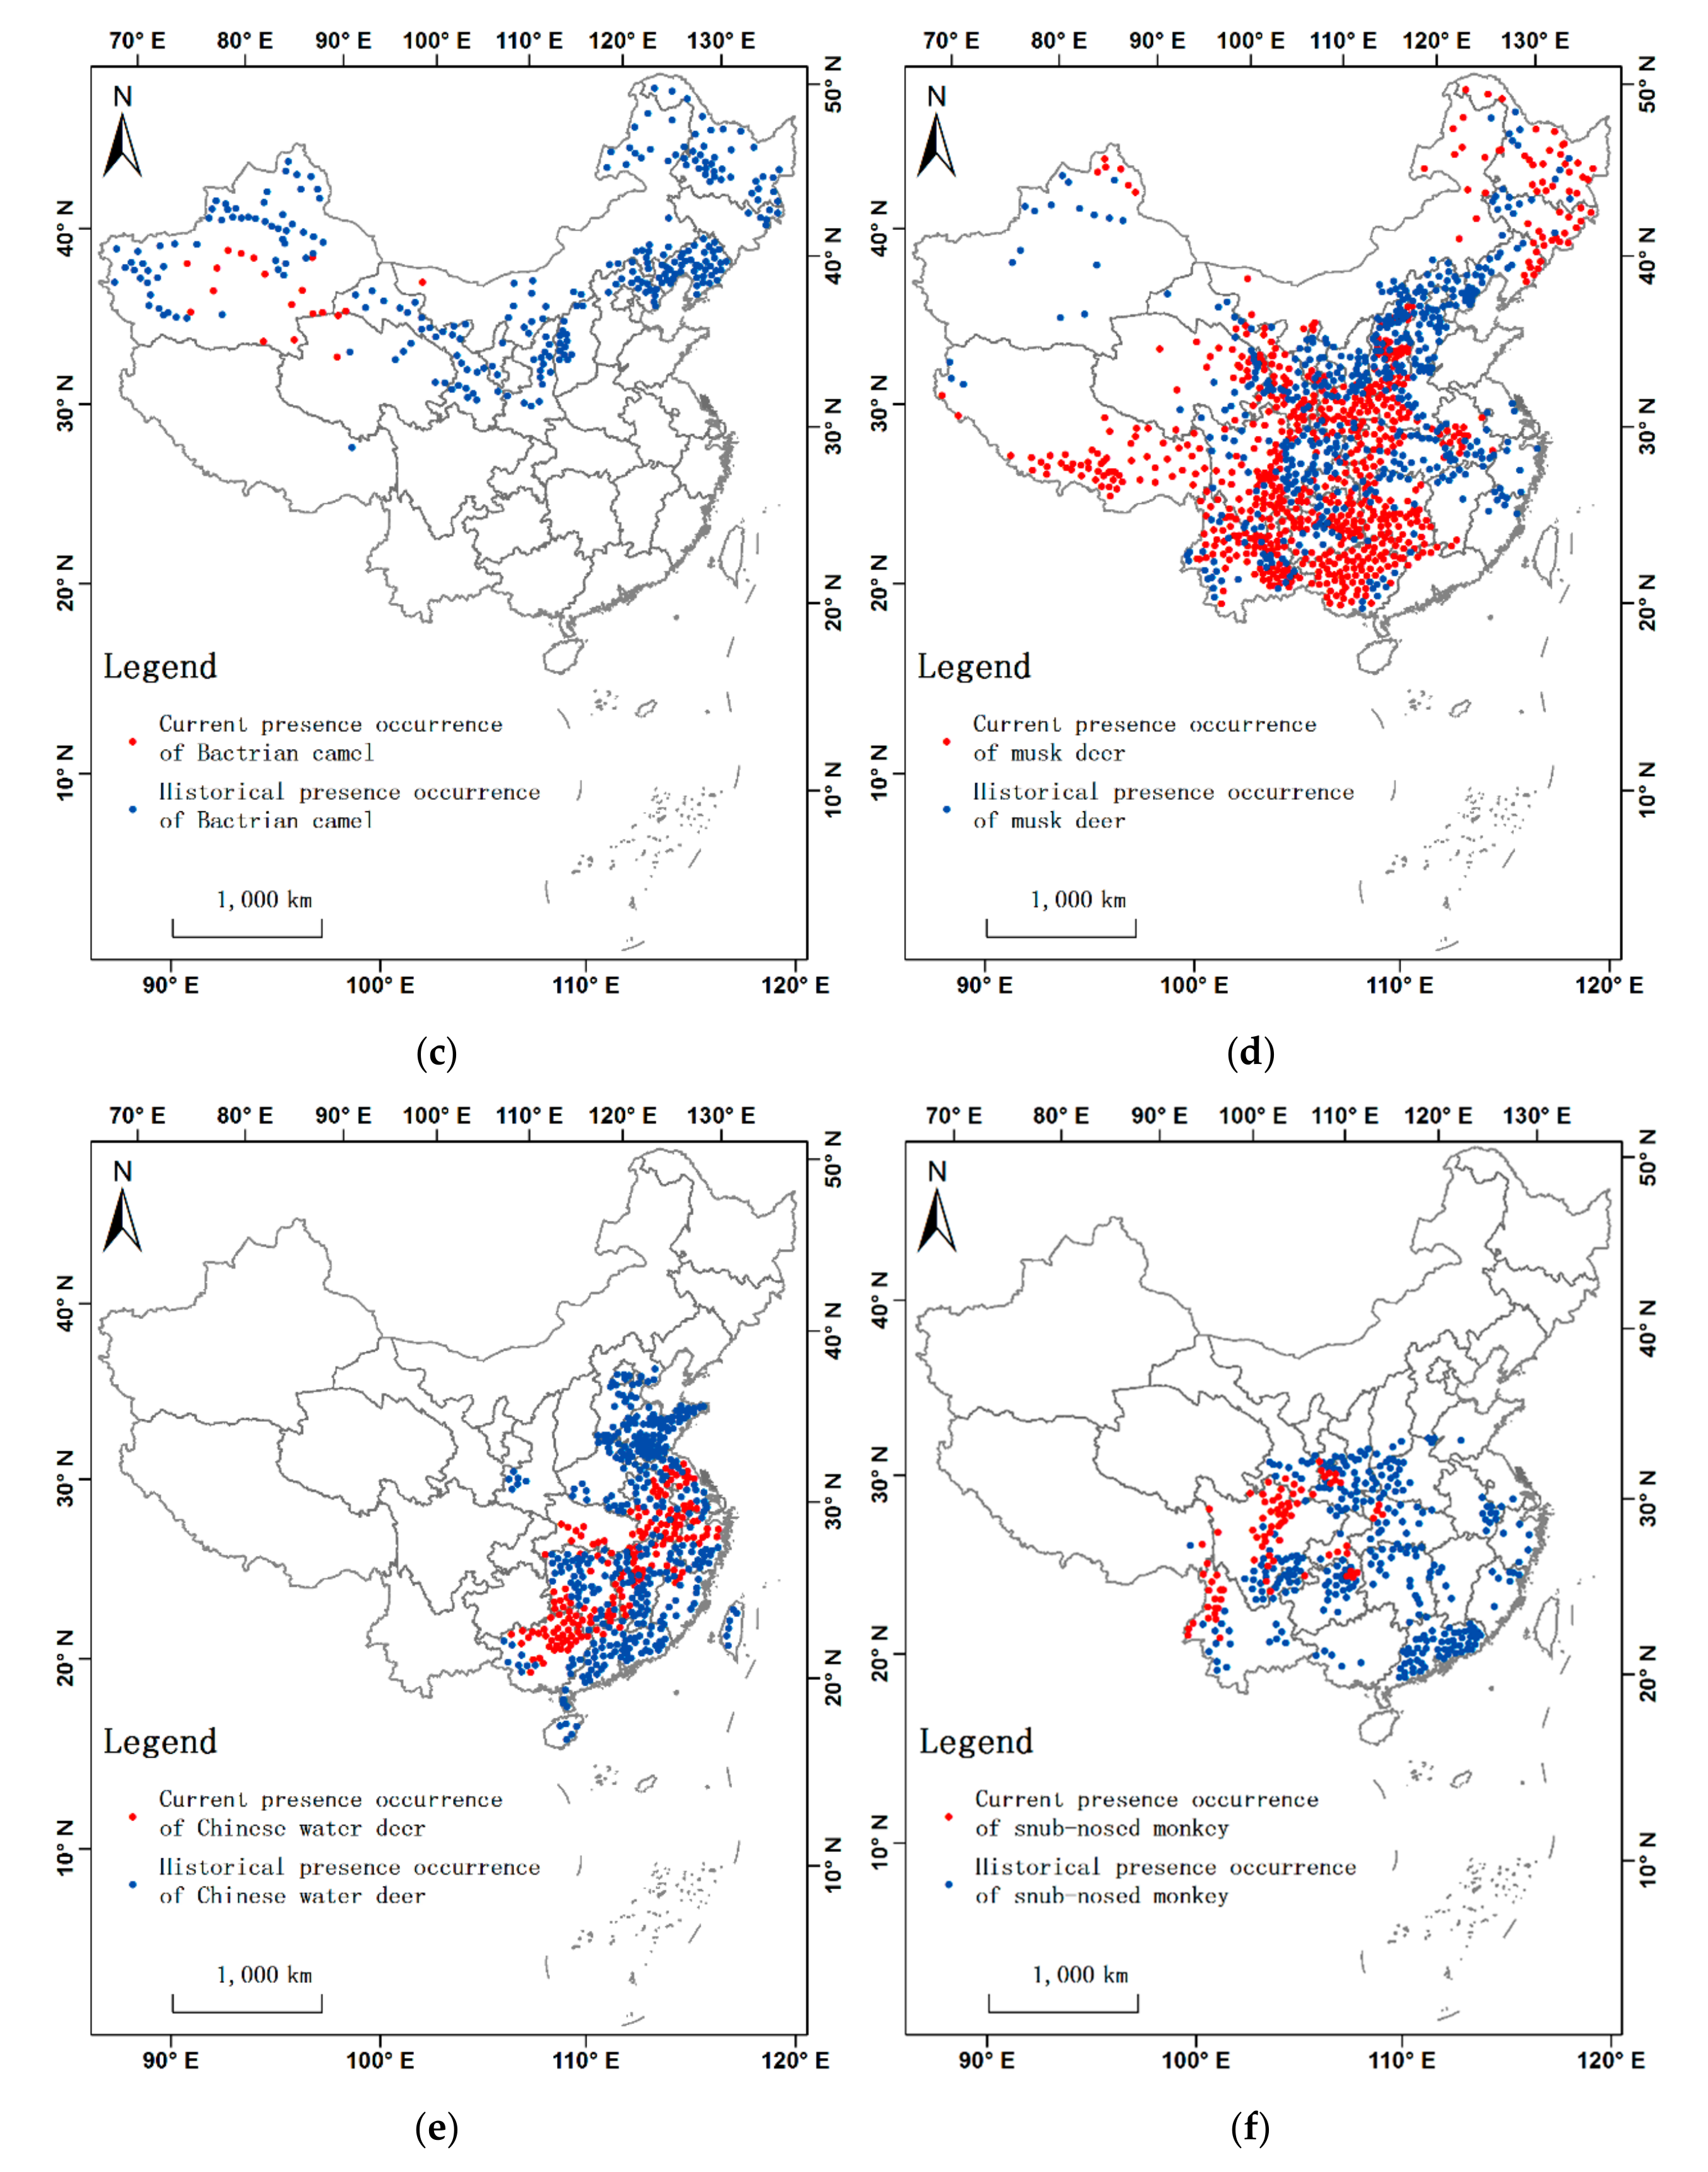
2.3. Presence Occurrence Data
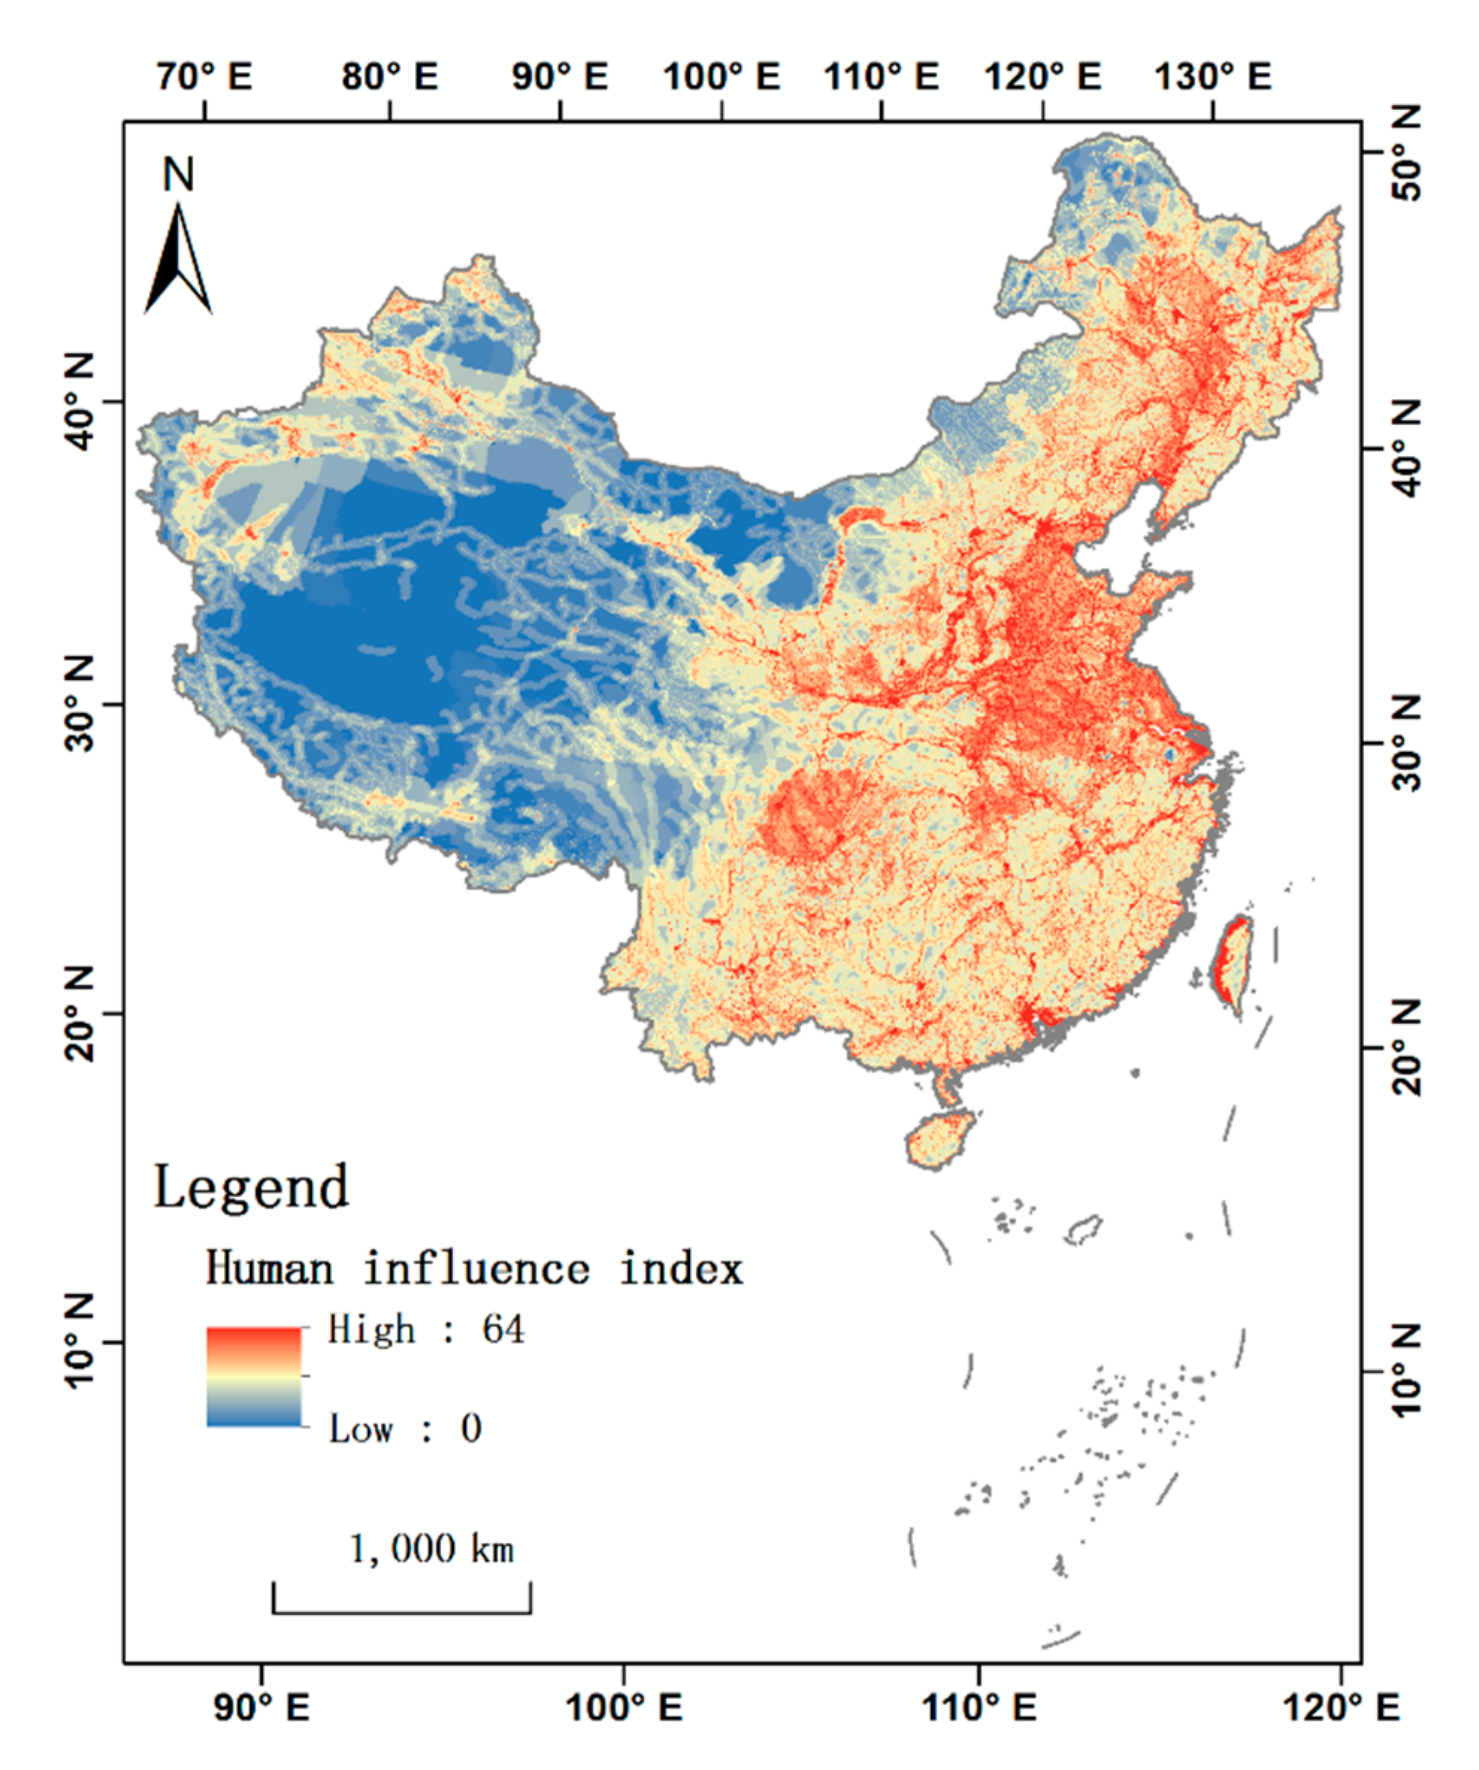
2.4. Environmental Factor Data
3. Results
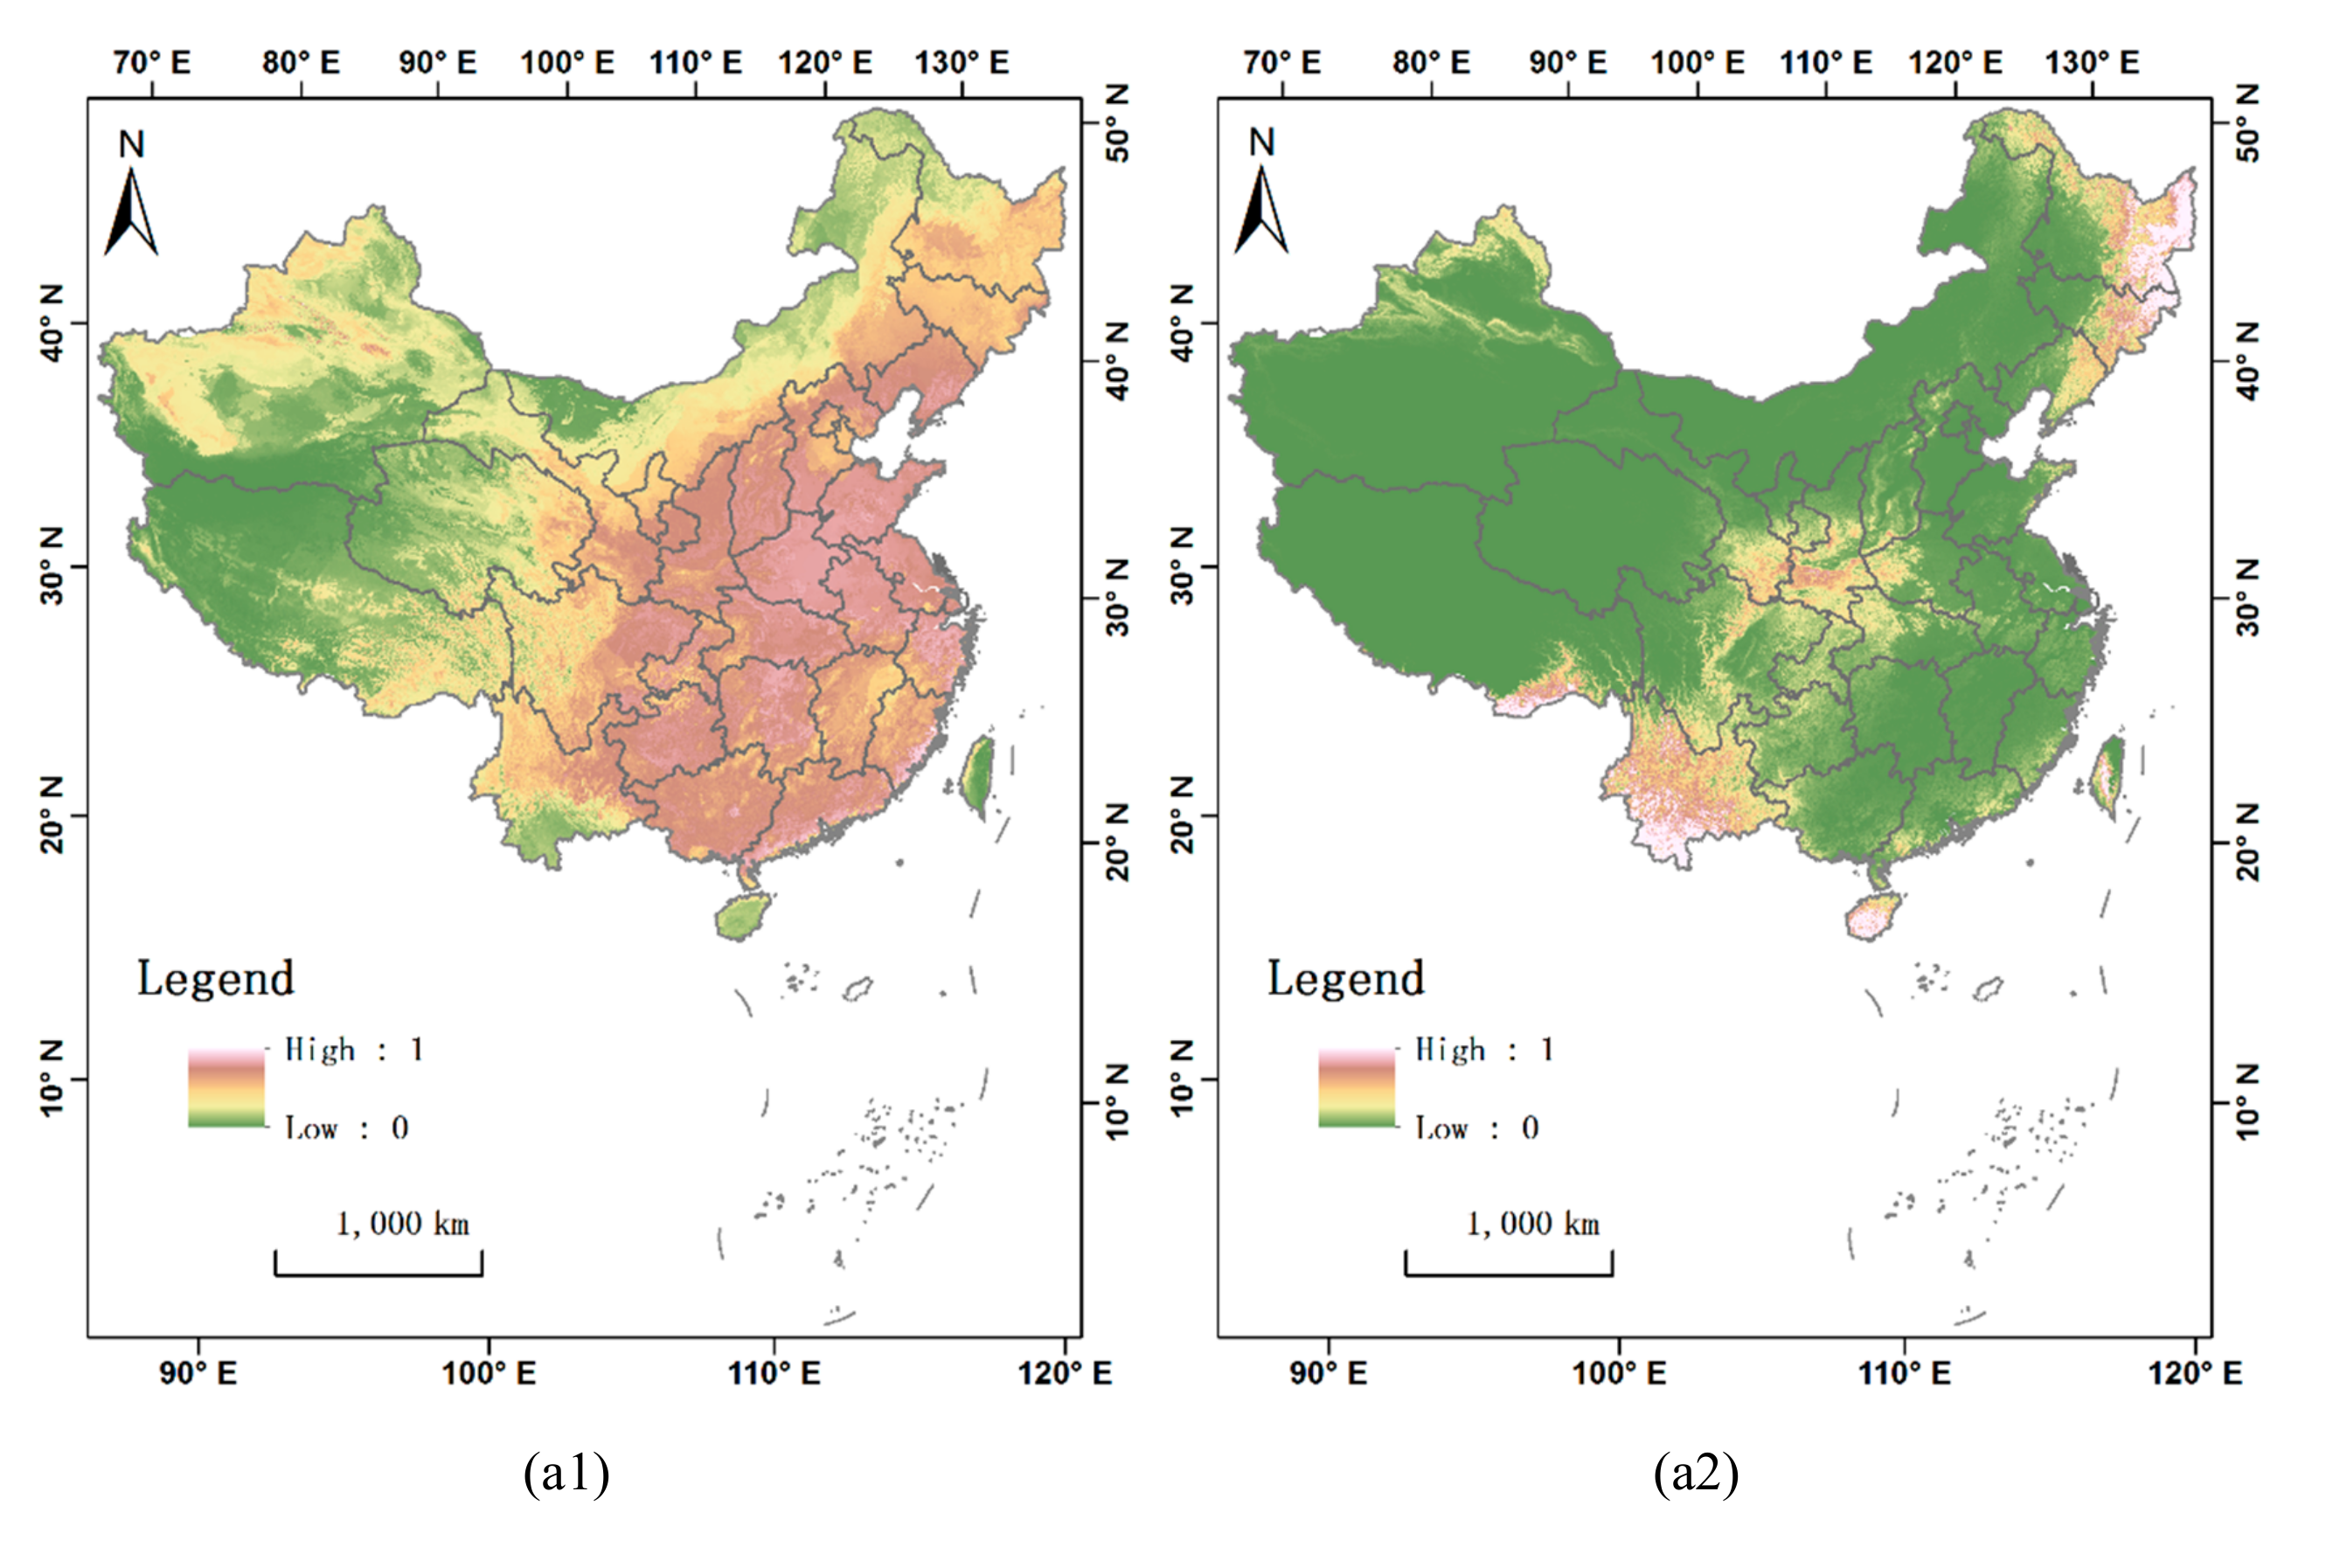
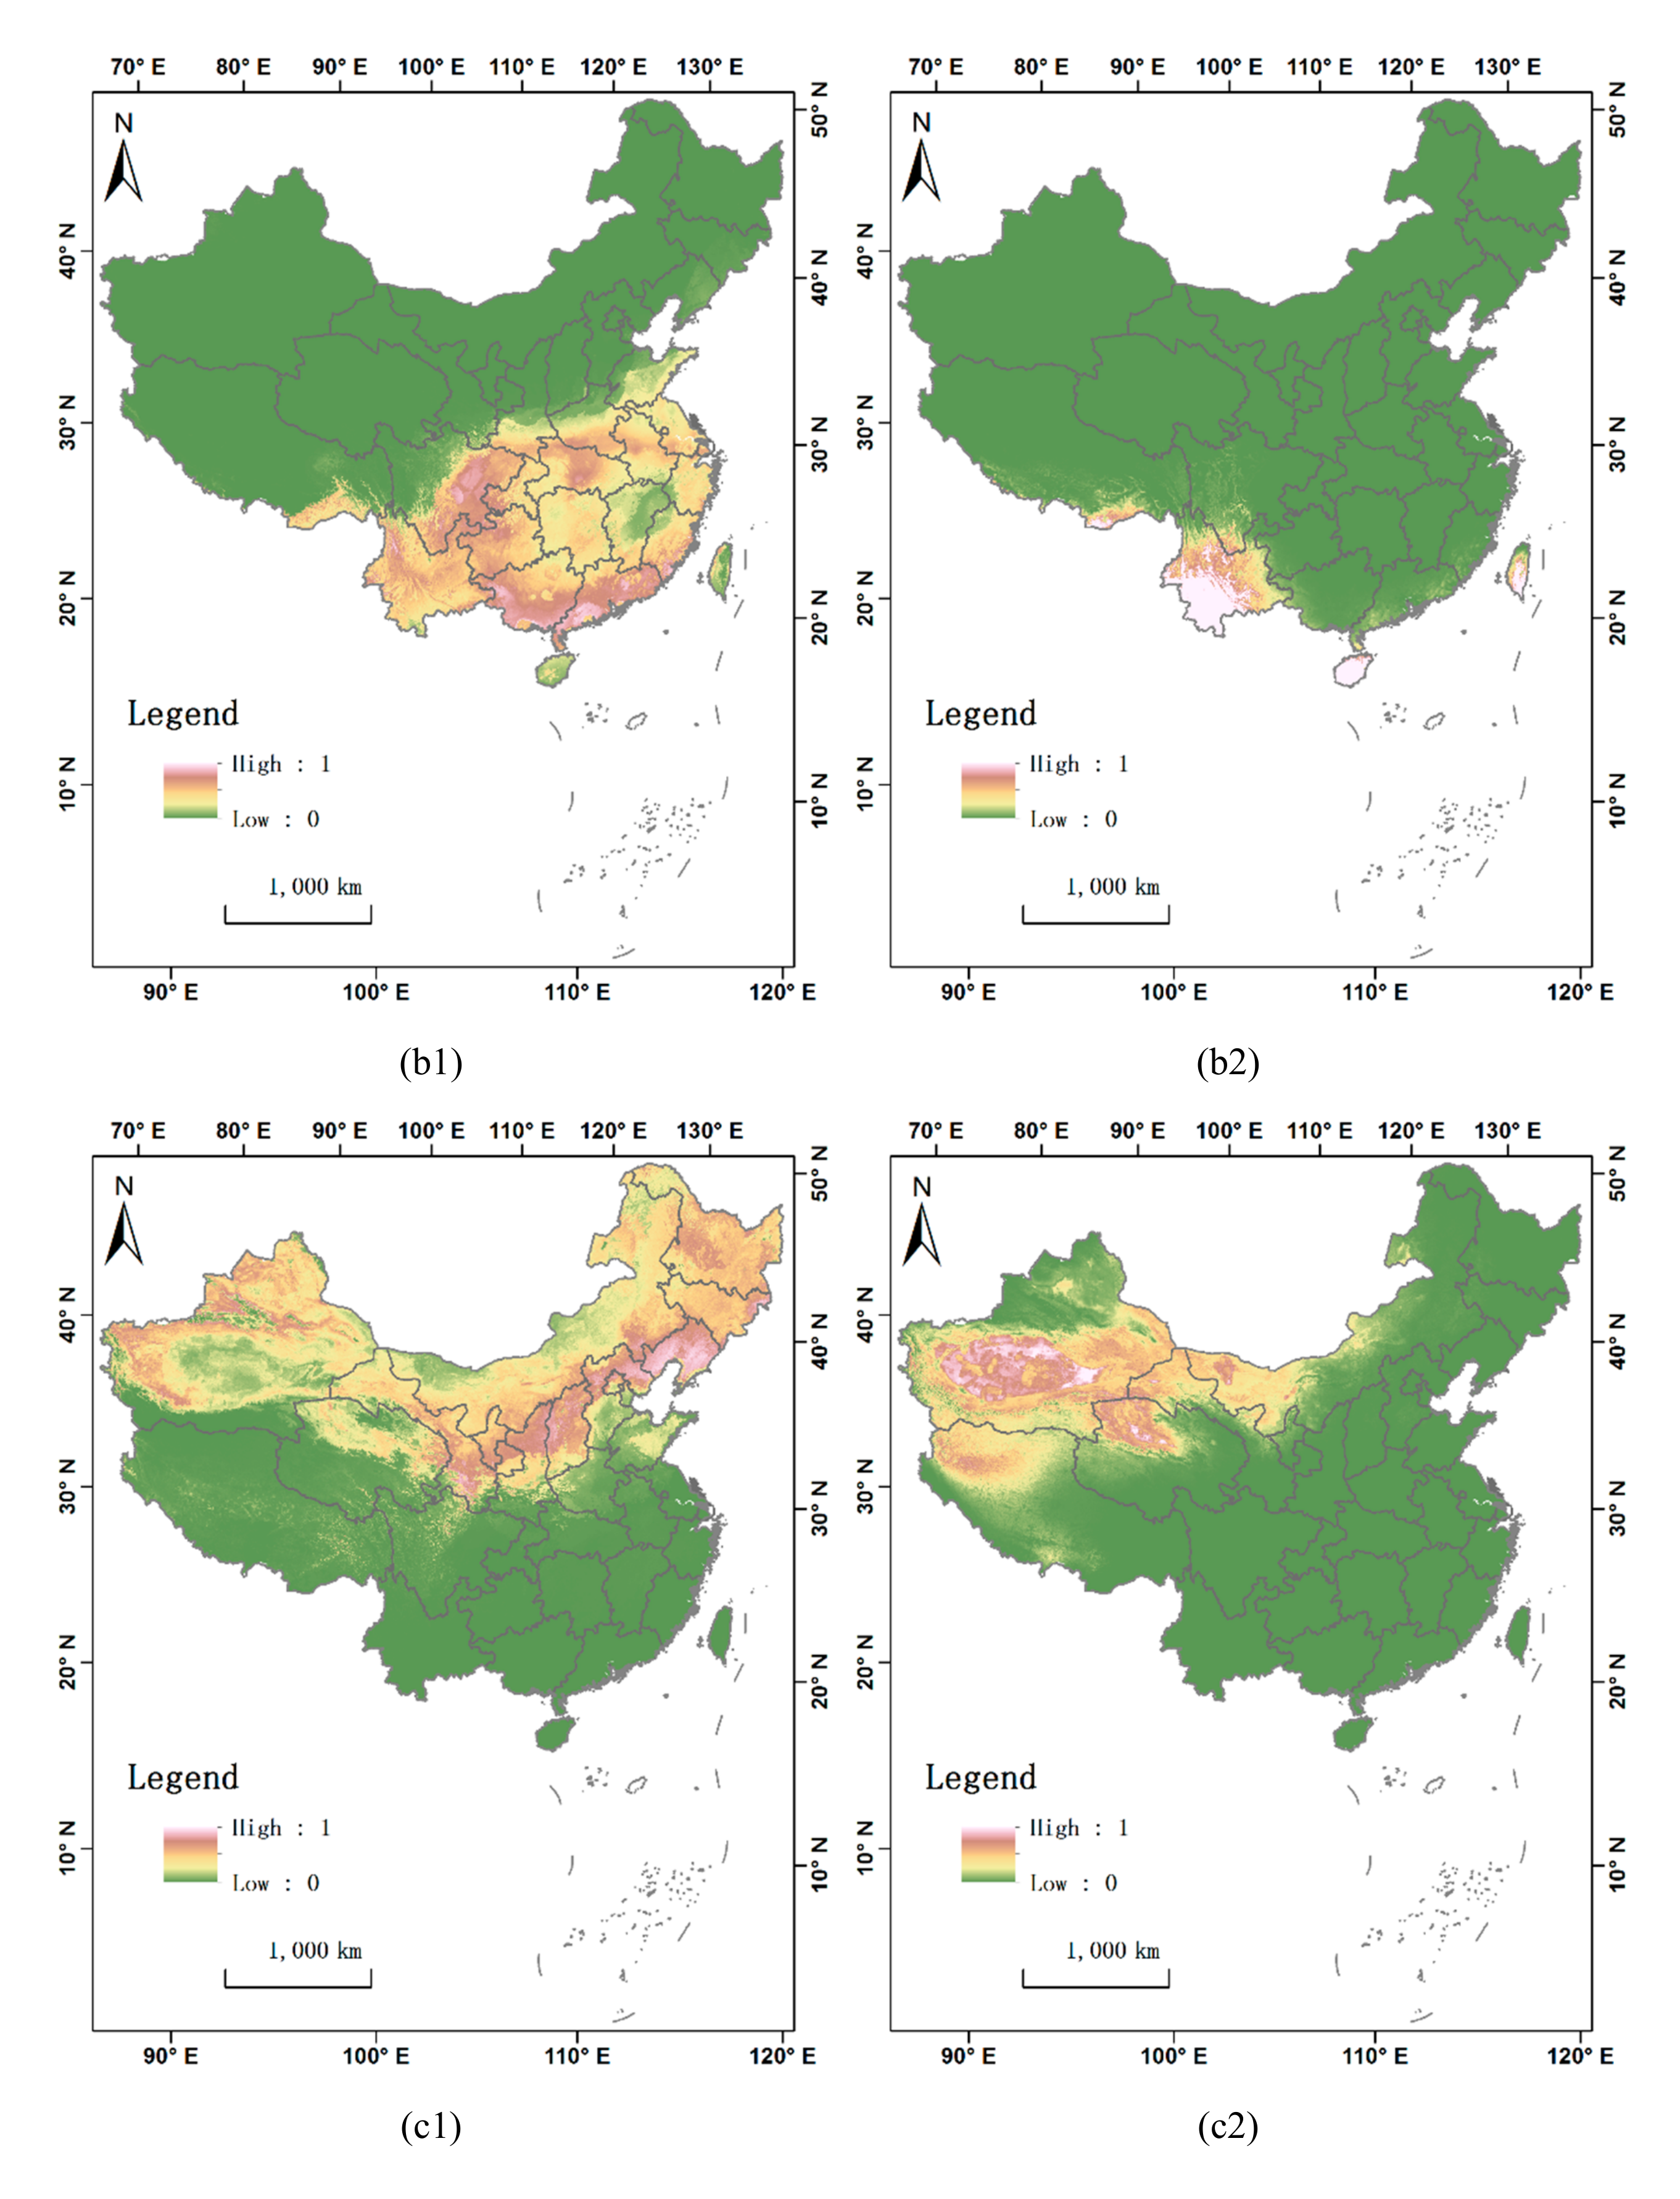
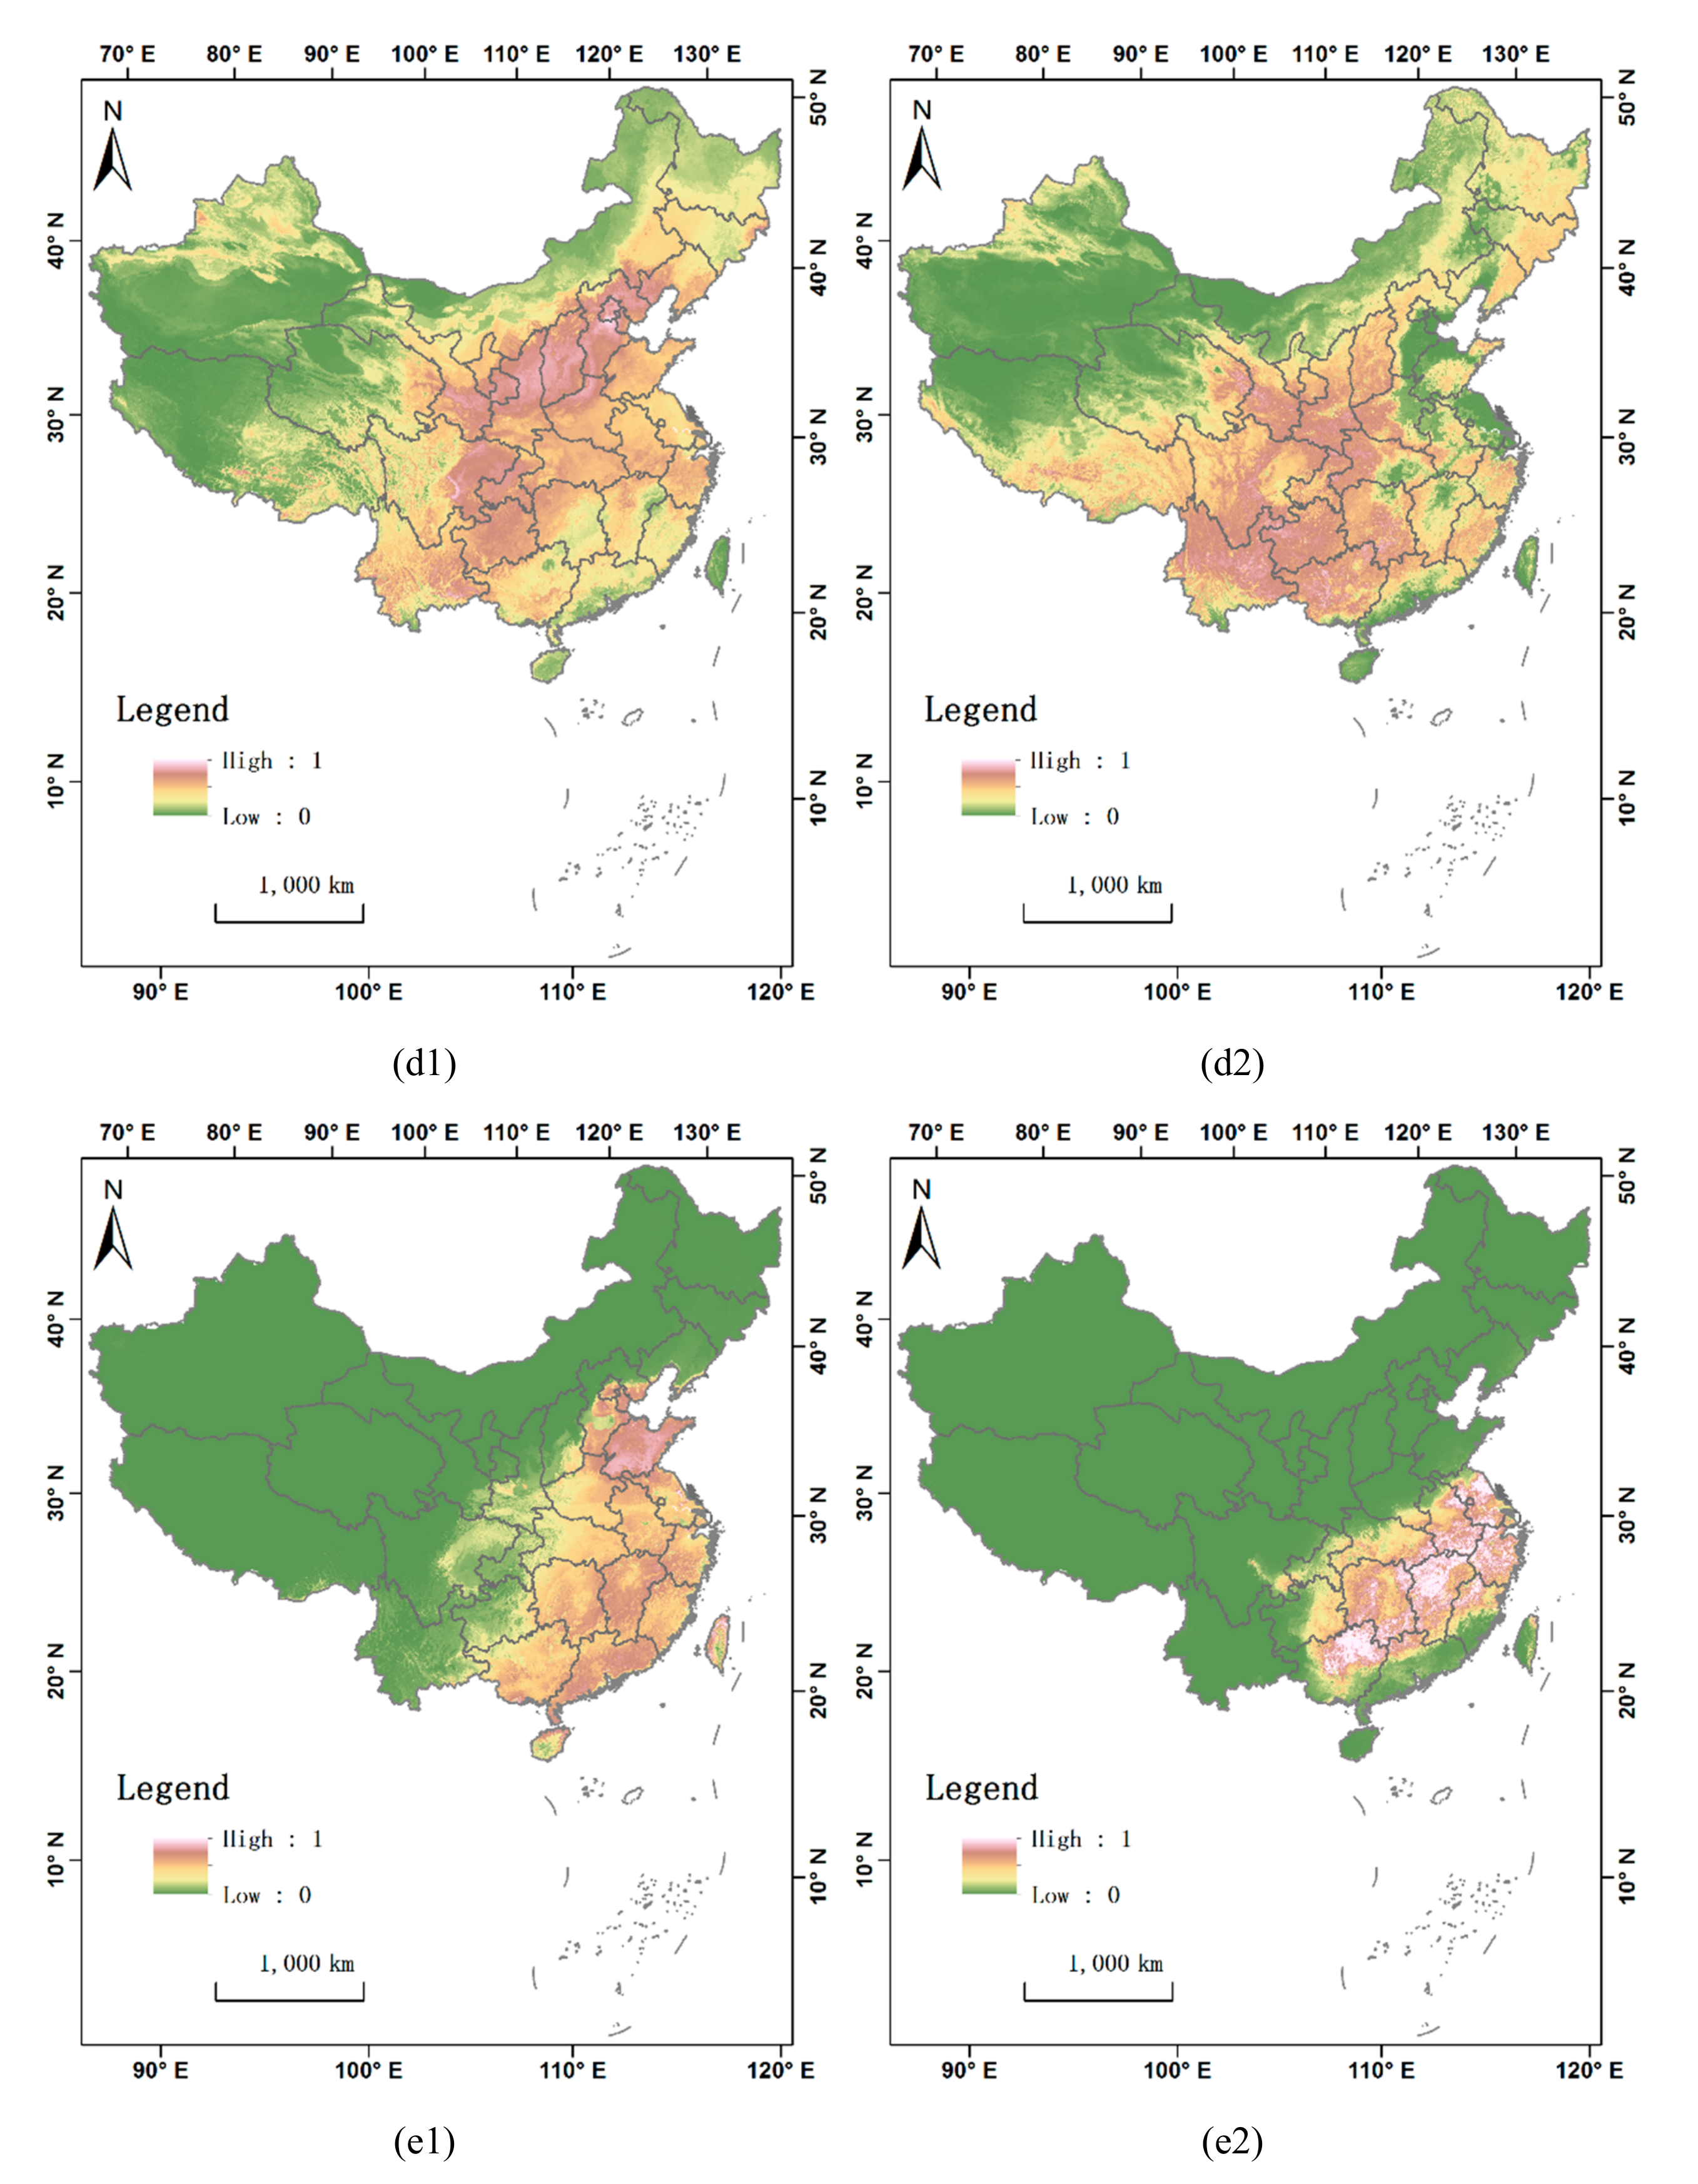
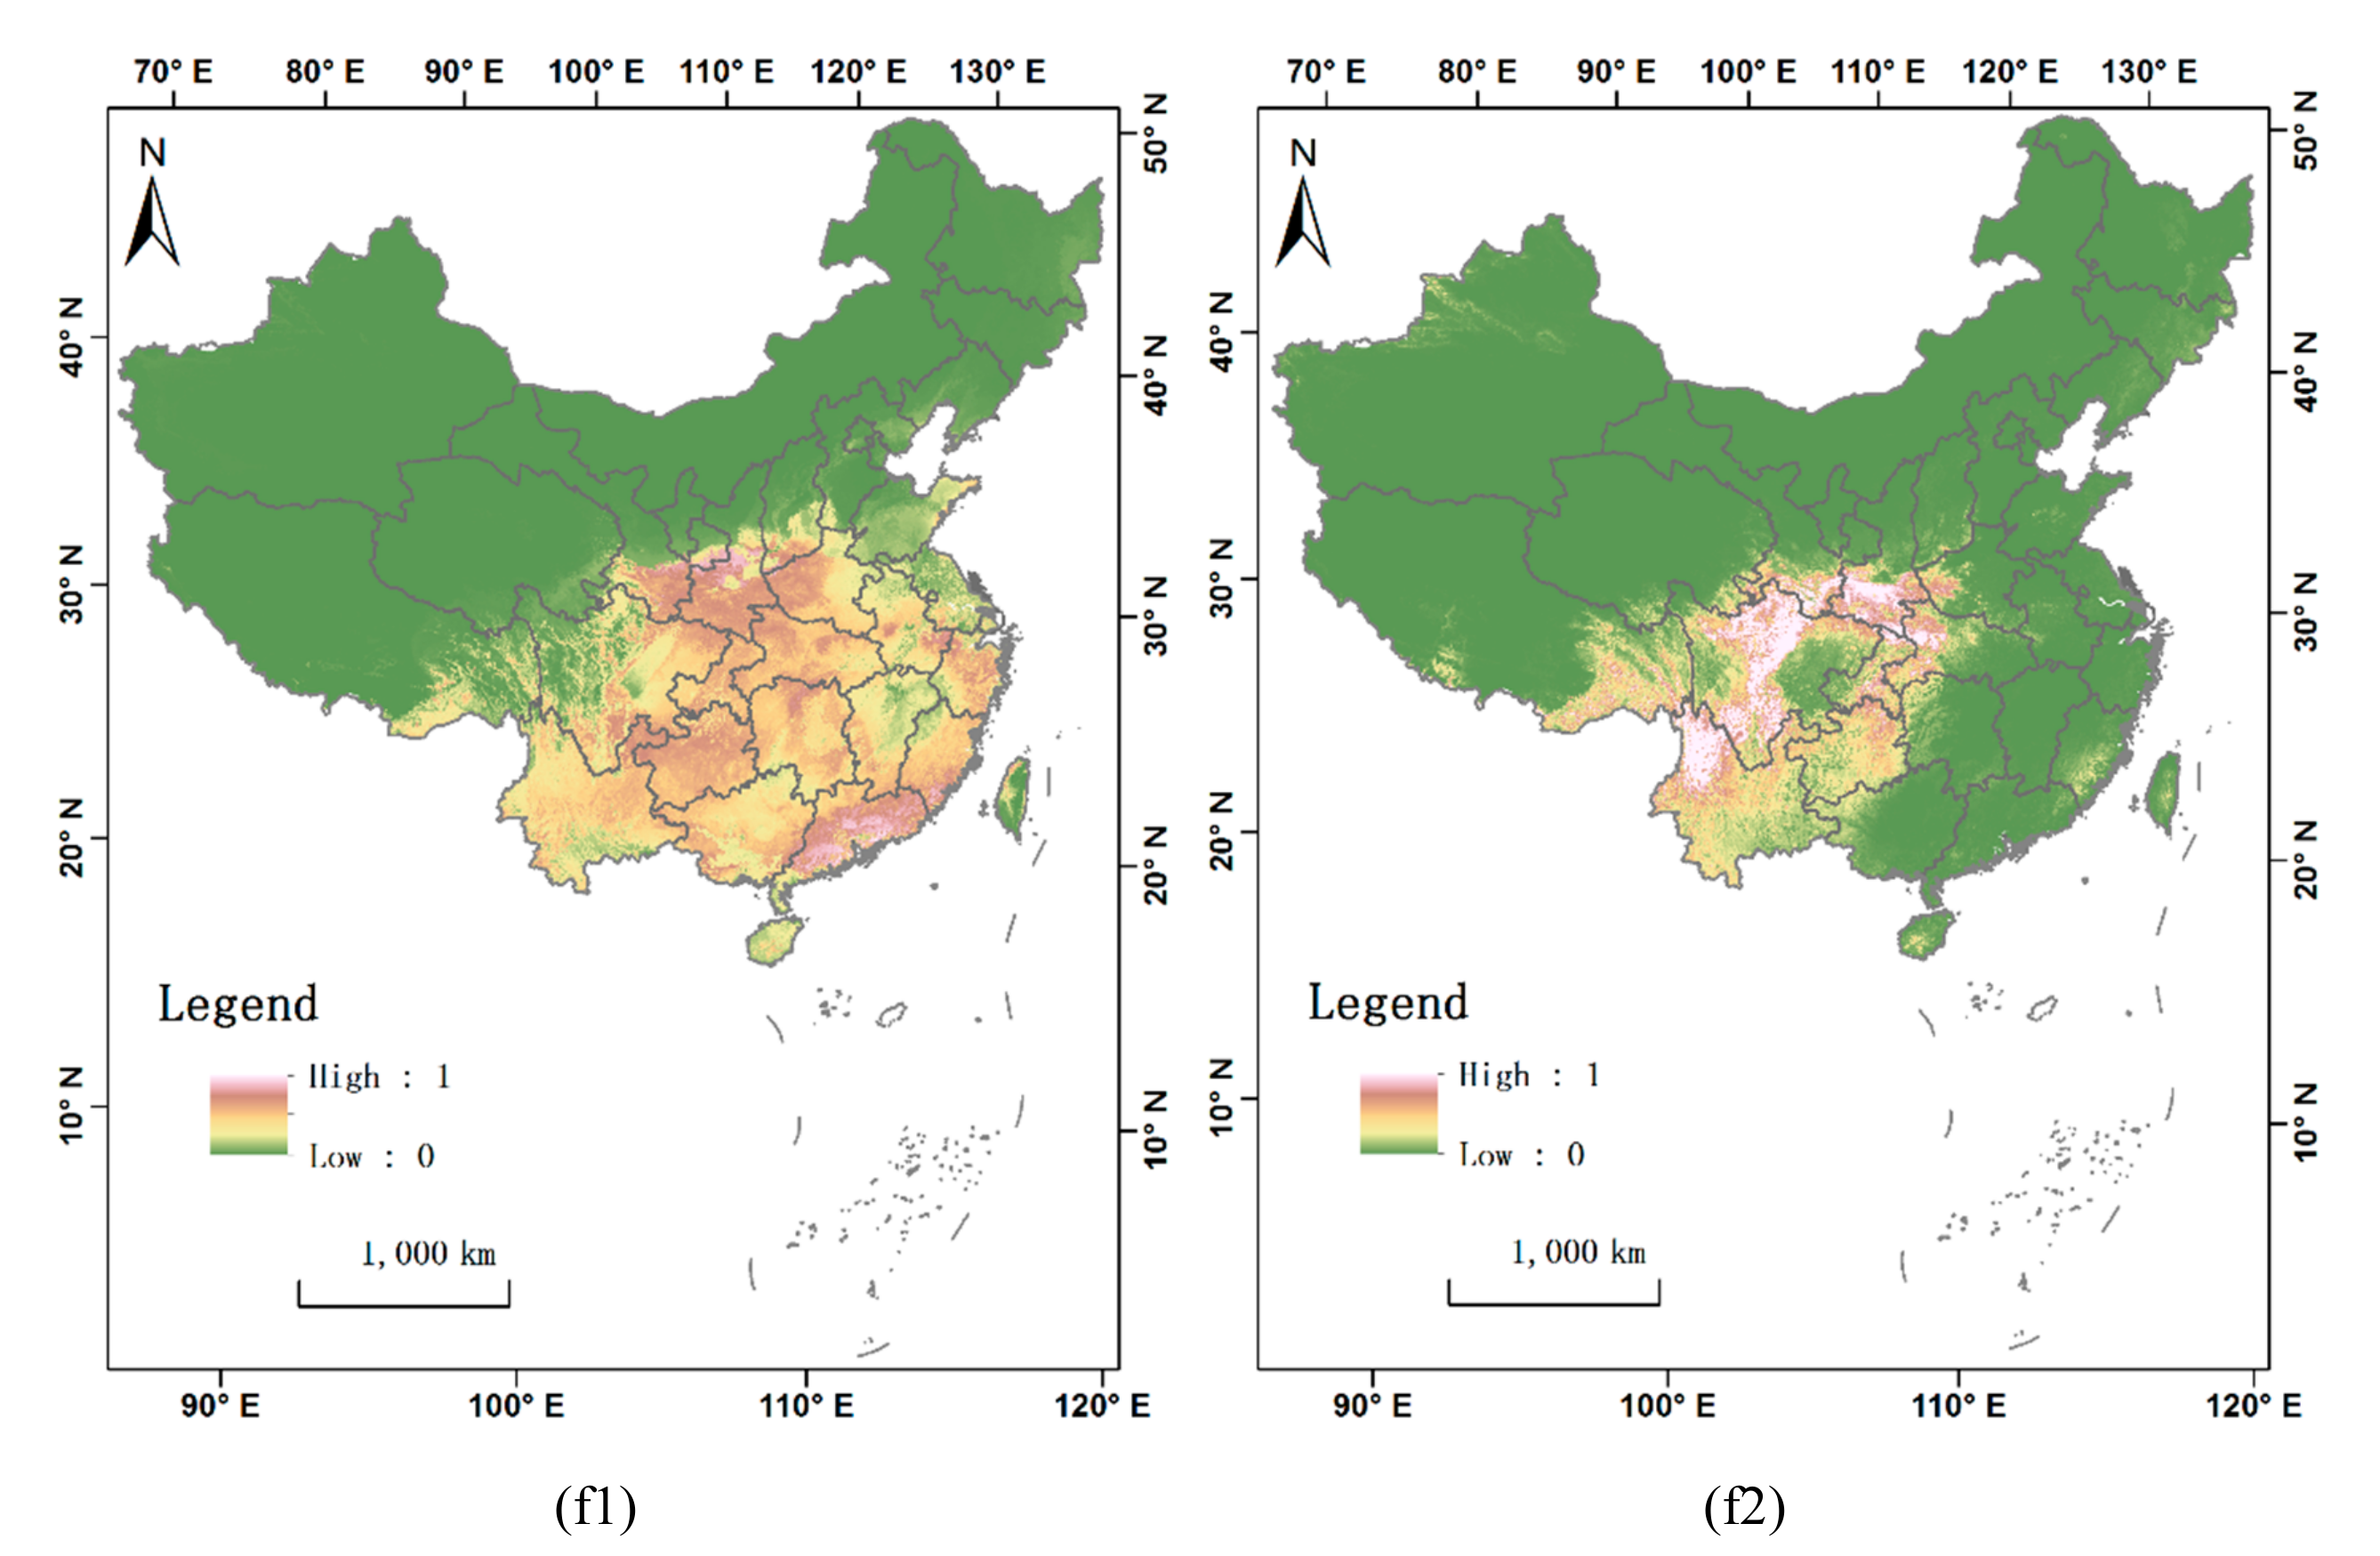
3.1. The Estimated Historical and Current Habitat Ranges
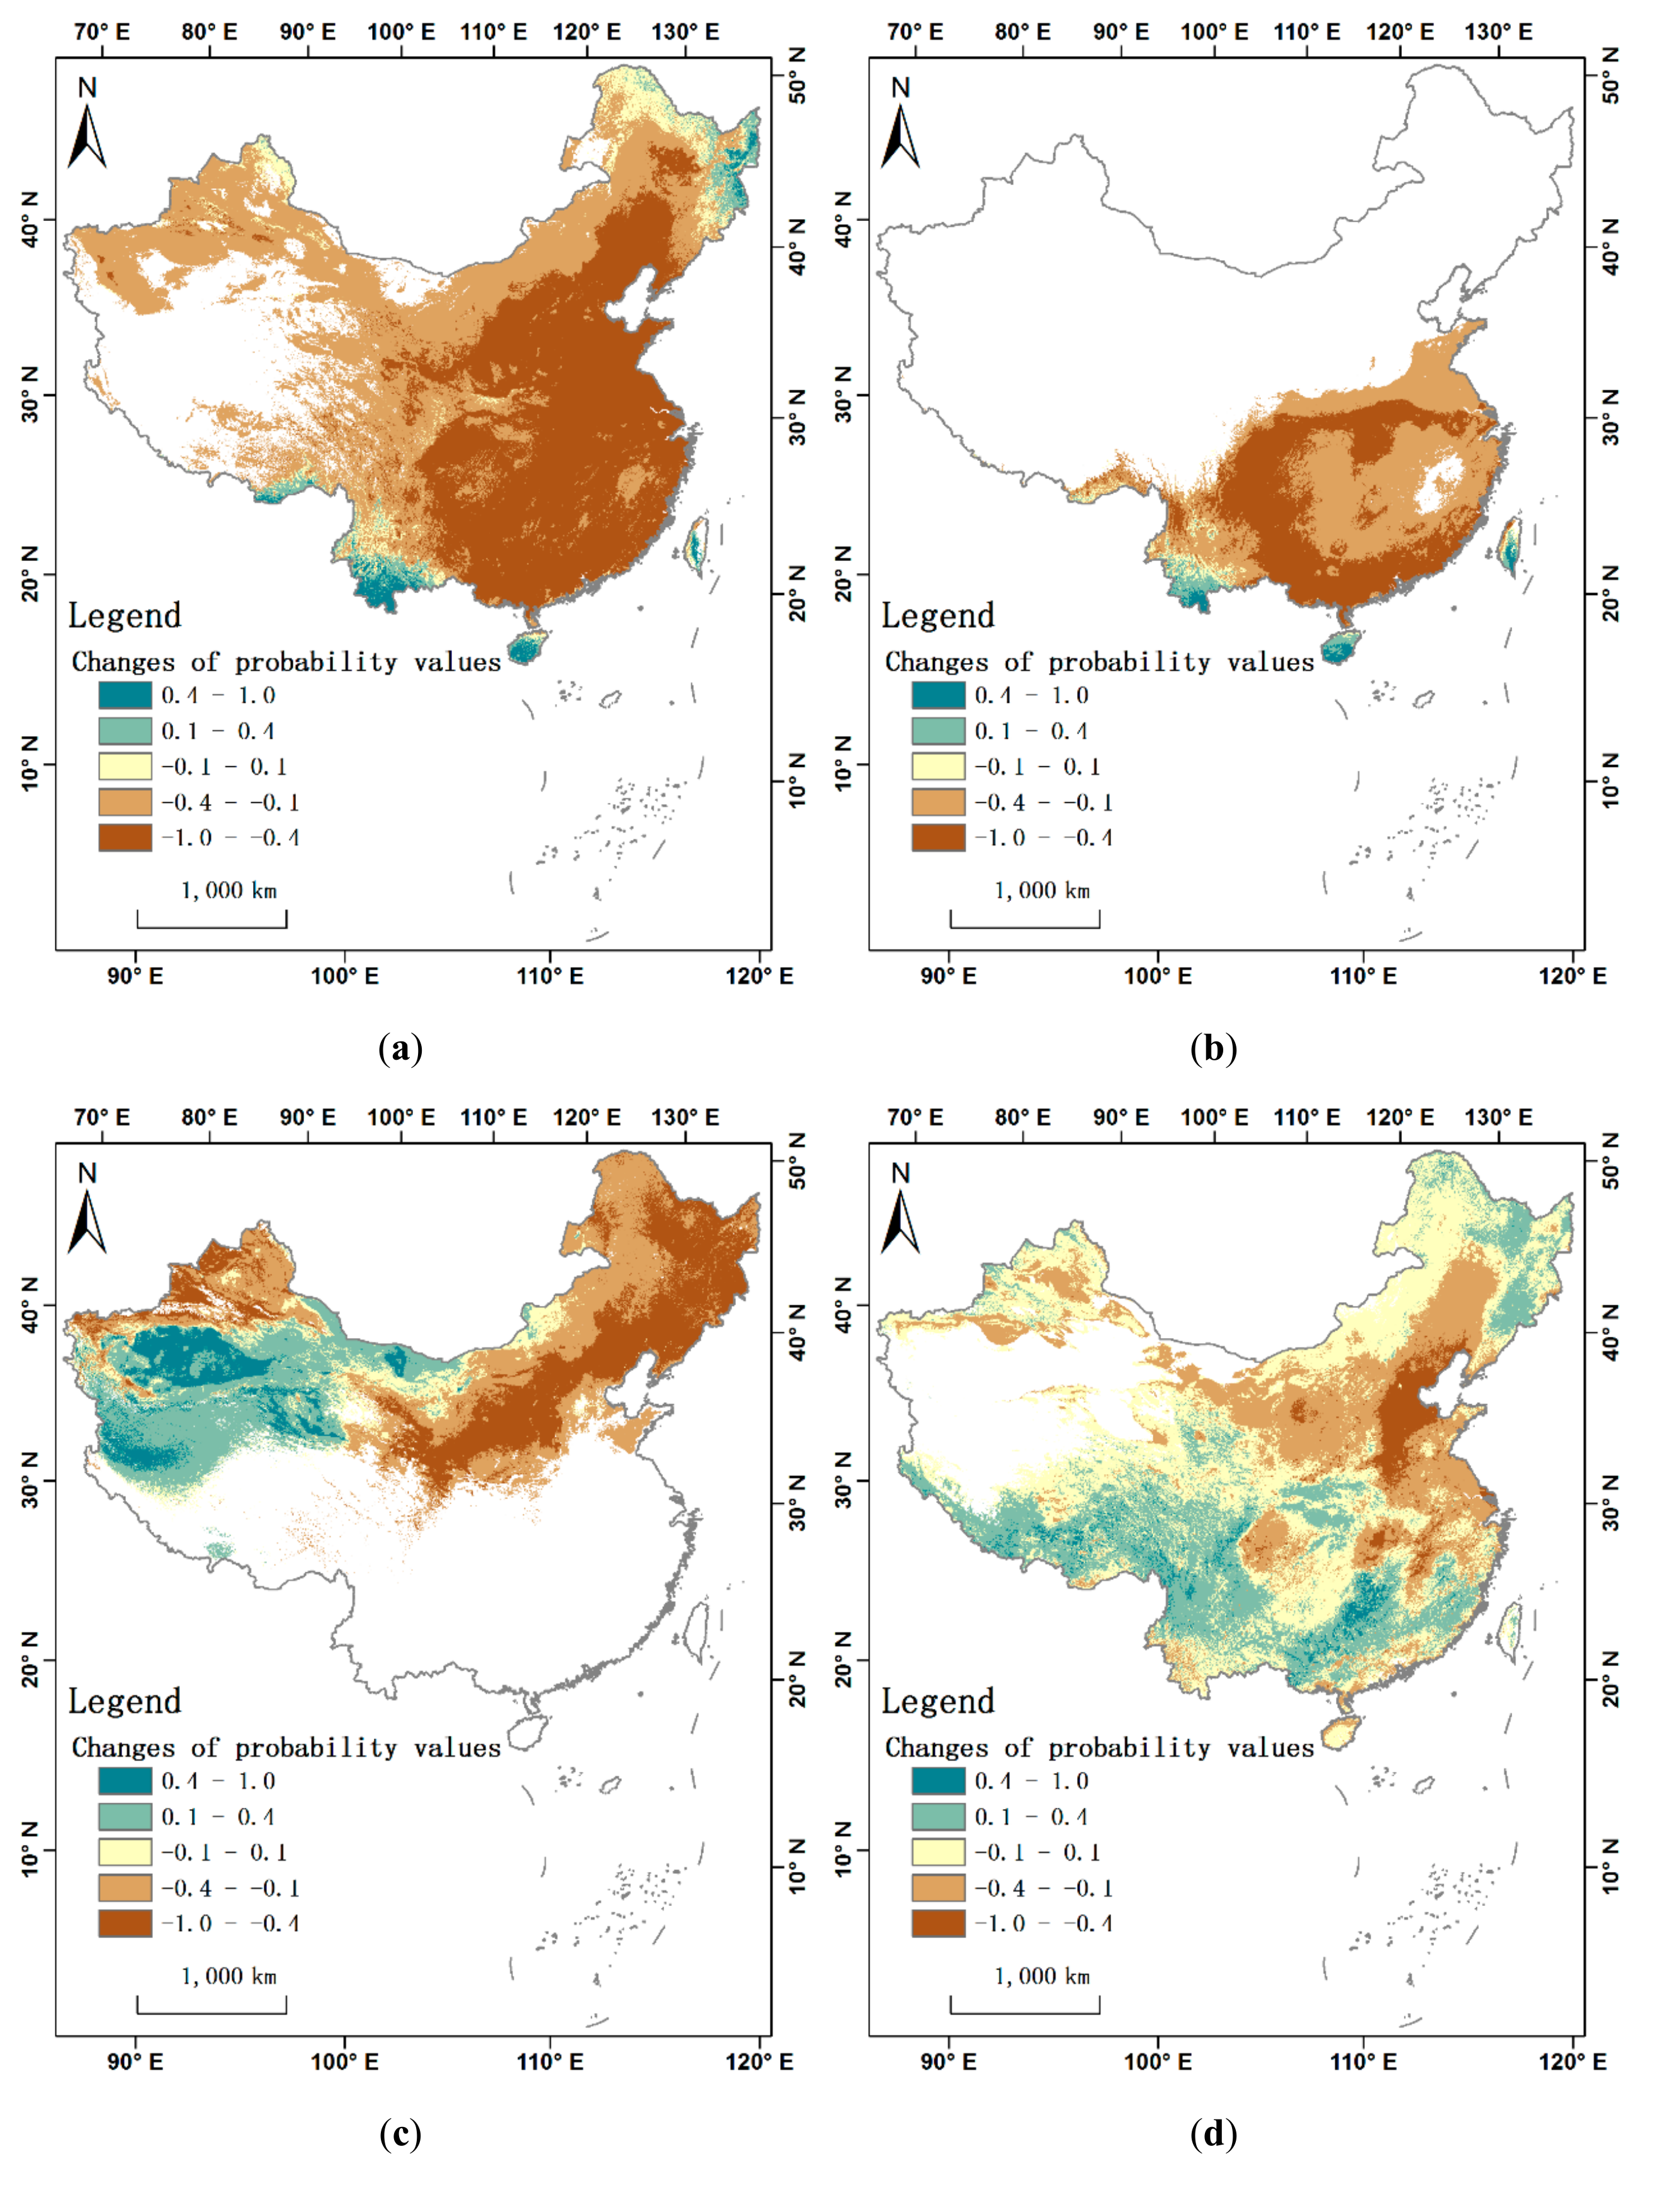
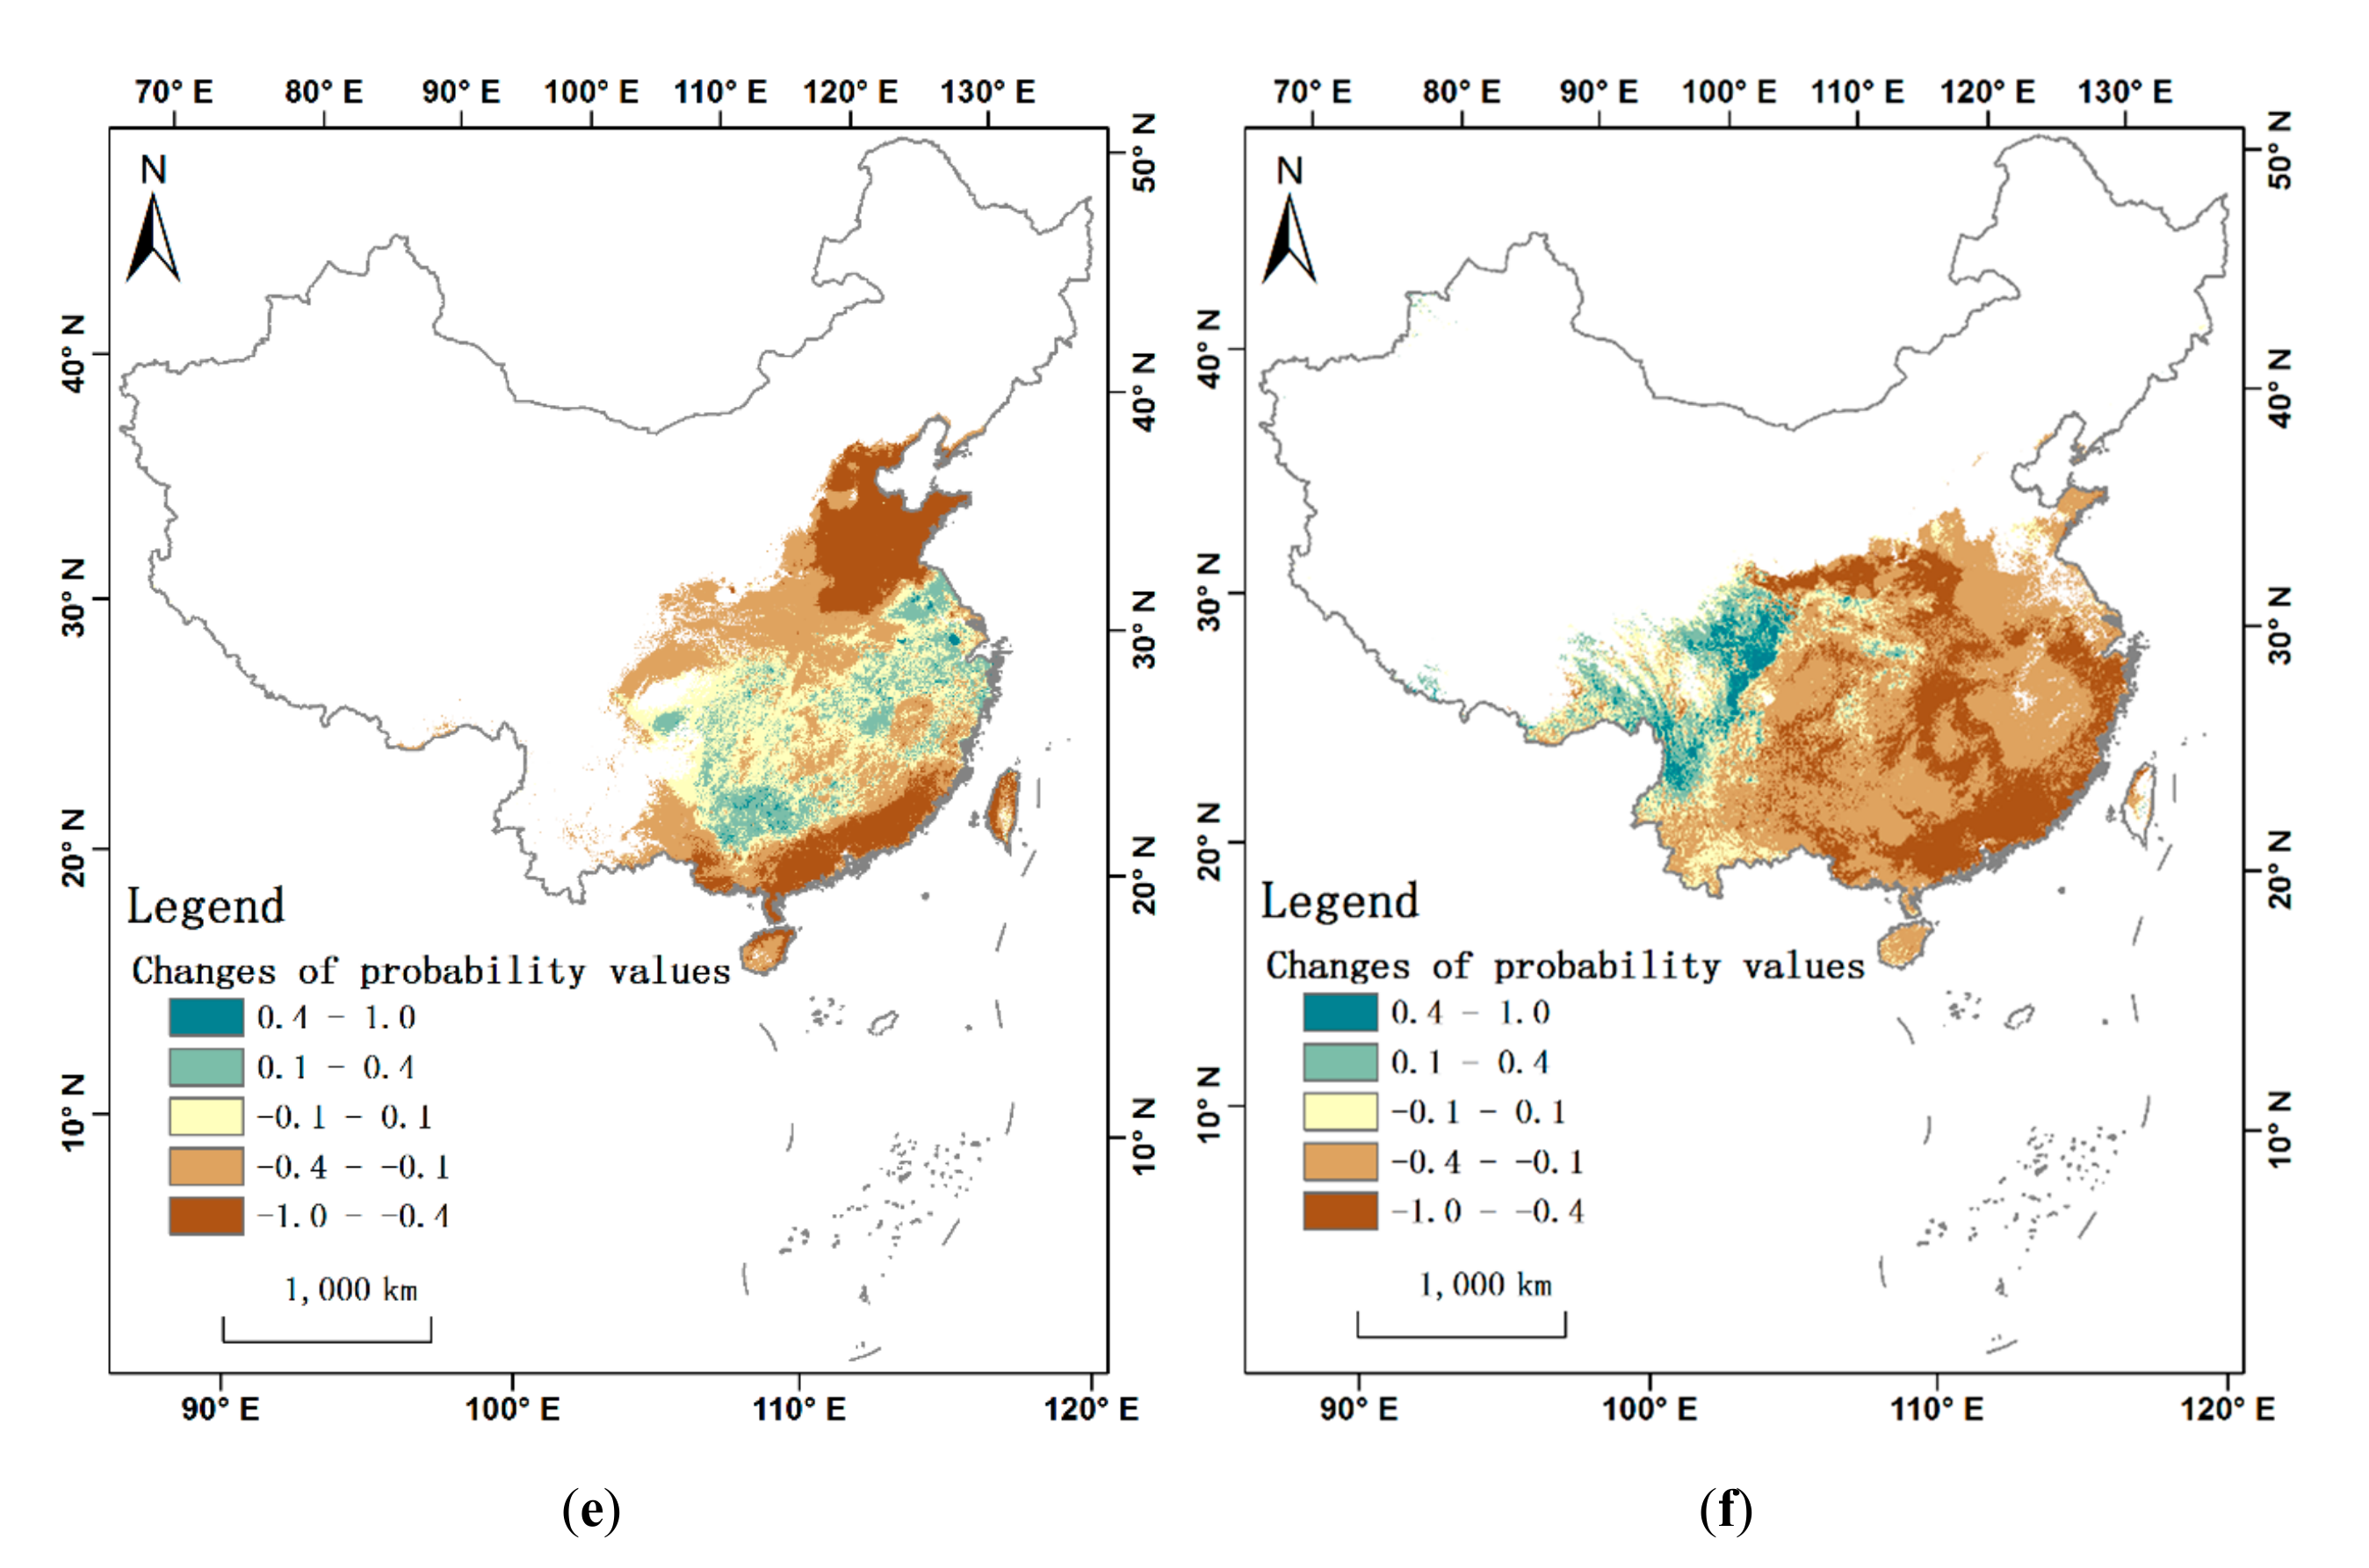
3.2. Changes in Habitat Ranges
3.3. Human Activities Influence on Habitat Change
4. Discussion
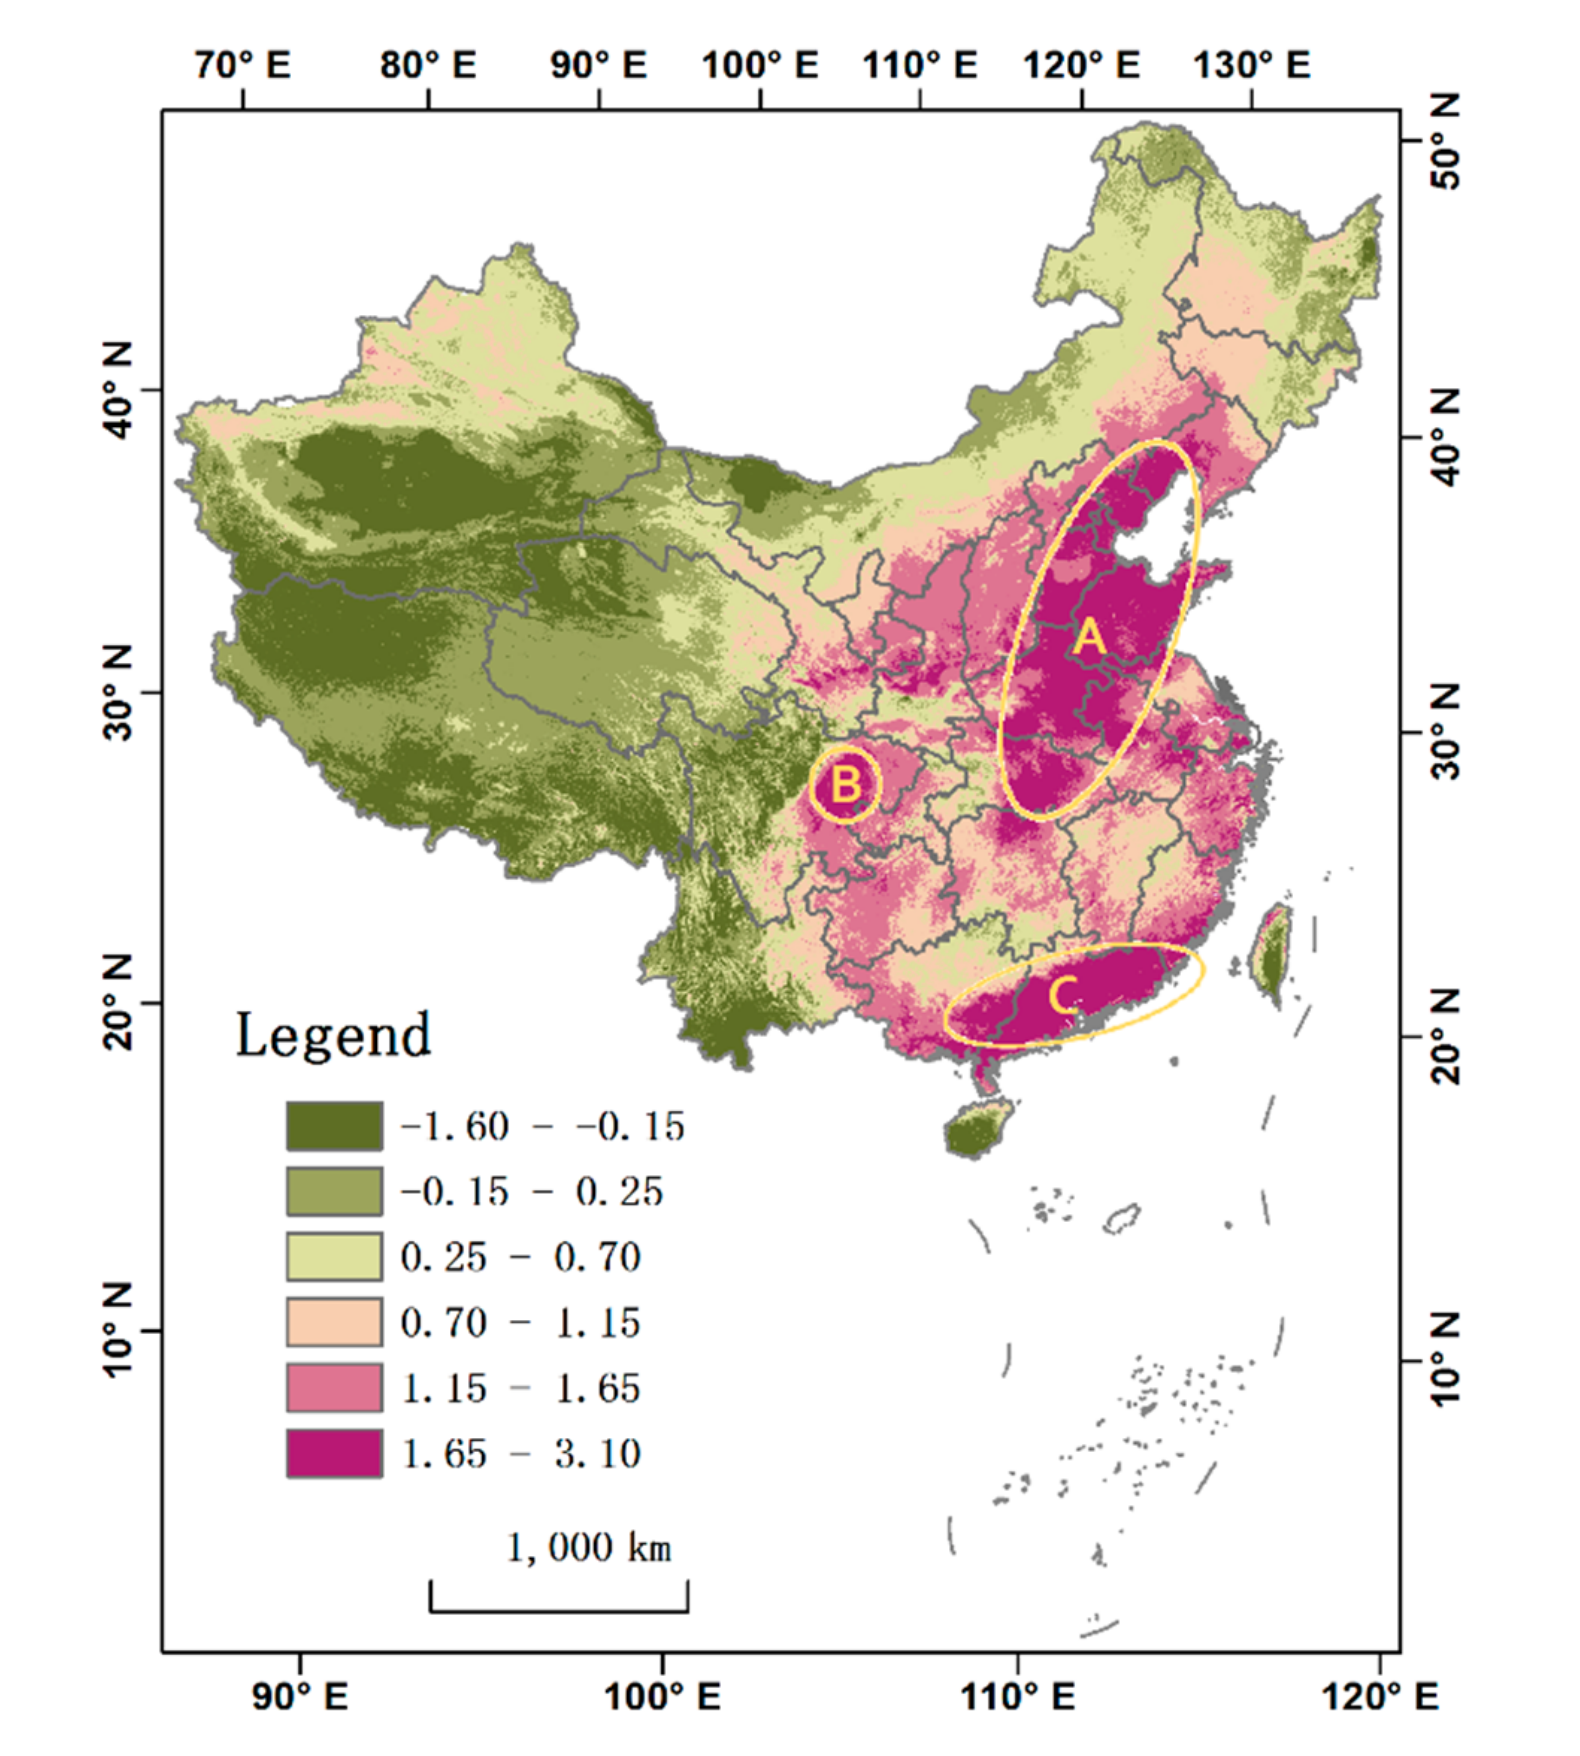
4.1. Habitat Change Hot Zones
4.2. Research Assumptions and Limitations
5. Conclusions
Author Contributions
Funding
Conflicts of Interest
References
- Wen, H.; Wen, R. The Change of the Plant. and Animal in China during Different Historical Period.; Chongqing Publishing House: Chongqing, China, 2006. [Google Scholar]
- Wen, R. The Distributions and Changes of Rare Wild Animals in China; Shandong Science & Technology Press: Shandong, China, 2009. [Google Scholar]
- Crisci, J.V. The voice of historical biogeography. J. Biogeogr. 2001, 28, 157–168. [Google Scholar] [CrossRef]
- Santos-Reis, M.; da Luz Mathias, M. The historical and recent distribution and status of mammals in portugal. Hystrixthe Ital. J. Mammal. 1996, 8. [Google Scholar]
- Long, J.L. Introduced Birds of the World; Universe Press: New York, NY, USA, 1981. [Google Scholar]
- Long, J.L. Introduced Mammals of the World: Their History, Distribution and Influence; CSIRO: Campbell, ACT, Australia, 2003. [Google Scholar]
- Boshoff, A.; Landman, M.; Kerley, G. Filling the gaps on the maps: Historical distribution patterns of some larger mammals in part of southern africa. Trans. South. Afr. Philos. Soc. 2016, 71, 65. [Google Scholar] [CrossRef]
- Porras, L.P.; Vazquez, L.-B.; Aguilar, R.S.; Douterlungne, D.; Valenzuela-Galván, D. Influence of human activities on some medium and large-sized mammals’ richness and abundance in the lacandon rainforest. J. Nat. Conserv. 2016, 34, 75–81. [Google Scholar] [CrossRef] [Green Version]
- IUCN. The IUCN Red List of Threathened Species, Version 2019-3. Available online: Http://www.Iucnredlist.Org (accessed on 22 March 2020).
- Crisci, J.; Katinas, L.; Posadas, P.; Crisci, J.V. Historical Biogeography: An. Introduction; Harvard University Press: Cambridge, MA, USA, 2009. [Google Scholar]
- Costa, L.P. The historical bridge between the amazon and the atlantic forest of brazil: A study of molecular phylogeography with small mammals. J. Biogeogr. 2003, 30, 71–86. [Google Scholar] [CrossRef] [Green Version]
- Boshoff, A.F.; Kerley, G.I.H. Potential distributions of the medium- to large-sized mammals in the cape floristic region, based on historical accounts and habitat requirements. Zool. Afr. 2001, 36, 245–273. [Google Scholar] [CrossRef]
- Boshoff, A.F.; Kerley, G.I.H.; Cowling, R.M. A pragmatic approach to estimating the distributions and spatial requirements of the medium- to large-sized mammals in the cape floristic region, south africa. Divers. Distrib. 2001, 7, 29–43. [Google Scholar] [CrossRef] [Green Version]
- Cui, S.; Milnergulland, E.J.; Singh, N.J.; Chu, H.; Li, C.; Chen, J.; Jiang, Z. Historical range, extirpation and prospects for reintroduction of saigas in china. Sci. Rep. 2017, 7, 44200. [Google Scholar] [CrossRef]
- Turvey, S.T.; Crees, J.J.; Di Fonzo, M.M. Historical data as a baseline for conservation: Reconstructing long-term faunal extinction dynamics in late imperial–modern china. Proc. R. Soc. B Biol. Sci. 2015, 282, 20151299. [Google Scholar] [CrossRef]
- Turvey, S.T.; Crees, J.J.; Li, Z.; Bielby, J.; Yuan, J. Long-term archives reveal shifting extinction selectivity in china’s postglacial mammal fauna. Proc. R. Soc. B Biol. Sci. 2017, 284, 20171979. [Google Scholar] [CrossRef] [Green Version]
- Wan, X.; Zhang, Z. Climate warming and humans played different roles in triggering late quaternary extinctions in east and west eurasia. Proc. R. Soc. B Biol. Sci. 2017, 284, 20162438. [Google Scholar] [CrossRef] [PubMed]
- Zhao, X.; Ren, B.; Garber, P.A.; Li, X.; Li, M. Impacts of human activity and climate change on the distribution of snub-nosed monkeys in china during the past 2000 years. Divers. Distrib. 2018, 24, 92–102. [Google Scholar] [CrossRef] [Green Version]
- Nüchel, J.; Bøcher, P.K.; Xiao, W.; Zhu, A.-X.; Svenning, J.-C. Snub-nosed monkeys (Rhinopithecus): Potential distribution and its implication for conservation. Biodivers. Conserv. 2018, 27, 1517–1538. [Google Scholar] [CrossRef] [PubMed] [Green Version]
- Wan, X.; Jiang, G.; Yan, C.; He, F.; Wen, R.; Gu, J.; Li, X.; Ma, J.; Stenseth, N.C.; Zhang, Z. Historical records reveal the distinctive associations of human disturbance and extreme climate change with local extinction of mammals. Proc. Natl. Acad. Sci. USA 2019, 116, 19001–19008. [Google Scholar] [CrossRef] [PubMed] [Green Version]
- Li, Y. The effect of forest clear-cutting on habitat use in sichuan snub-nosed monkey (Rhinopithecus roxellana) in shennongjia nature reserve, China. Primates 2004, 45, 69–72. [Google Scholar] [CrossRef] [PubMed]
- Jaynes, E.T. Information theory and statistical mechanics I. Phys. Rev. 1957, 106, 620–630. [Google Scholar] [CrossRef]
- Jaynes, E.T. Probability theory: The logic of science. Math. Intell. 2005, 27, 83. [Google Scholar]
- Phillips, S.J.; Anderson, R.P.; Schapire, R.E. Maximum entropy modeling of species geographic distributions. Ecol. Model. 2006, 190, 231–259. [Google Scholar] [CrossRef] [Green Version]
- Phillips, S.; Dudik, M. Modeling of species distributions with maxent: New extensions and a comprehensive evaluation. Ecography 2010, 31, 161–175. [Google Scholar] [CrossRef]
- Wang, S.; Xie, Y. China Species Red List; Vertebrates Part 2; Higher Education Press: Beijing, China, 2009; Volume II. [Google Scholar]
- Jiang, Z.; Ma, Y.; Wu, Y.; Wang, Y.; Zhou, K.; Liu, S.; Feng, Z. China’s Mammal. Diversity and Geographic Distribution; Science Press: Beijing, China, 2015; p. 402. [Google Scholar]
- Fick, S.E.; Hijmans, R.J. Worldclim 2: New 1-km spatial resolution climate surfaces for global land areas. Int. J. Climatol. 2017, 37, 4302–4315. [Google Scholar] [CrossRef]
- Xi, C.-B.; Qian, T.-L.; Chi, Y.; Chen, J.; Wang, J.-C. Relationship between settlements and topographical factors: An example from sichuan province, china. J. Mt. Sci. 2018, 15, 2043–2054. [Google Scholar] [CrossRef]
- Wildlife Conservation Society—WCS; Center for International Earth Science Information Network—CIESIN—Columbia University. Last of the Wild Project, Version 2, 2005 (lwp-2): Global Human Influence Index (hii) Dataset (Geographic); NASA Socioeconomic Data and Applications Center (SEDAC): Palisades, NY, USA, 2005. [Google Scholar]
- Aditya, J.; Srinivas, V.; Samrat, M.; Advait, E.; Uma, R. Connectivity of tiger (Panthera tigris) populations in the human-influenced forest mosaic of central india. PLoS ONE 2013, 8, e77980. [Google Scholar]
- Kaczensky, P.; Adiya, Y.; Wehrden, H.; Mijiddorj, B.; Walzer, C.; G¨¹thline, D.; Enkhbilegb, D.; Reading, R.P. Space and habitat use by wild Bactrian camels in the transaltai gobi of southern mongolia. Biol. Conserv. 2014, 169, 311–318. [Google Scholar] [CrossRef] [PubMed] [Green Version]
- Xiang, Z.F.; Huo, S.; Xiao, W. Habitat selection of black-and-white snub-nosed monkeys (Rhinopithecus bieti) in tibet: Implications for species conservation. Am. J. Primatol. 2011, 73, 347–355. [Google Scholar] [CrossRef] [PubMed]


| Mammals | Category in the China Key List | Category in the IUCN Red List 1 | ||
|---|---|---|---|---|
| Tiger | Panthera tigris | I | EN | |
| Asian elephant | Elephas maximus | I | EN | |
| Bactrian Camel | Camelus bactrianus | I | CR | |
| Family Moschidae | Anhui musk deer | Moschus anhuiensis | I | EN |
| Forest musk dear | M. berezovskii | EN | ||
| Alpine musk deer | M. chrysogaster sifanicus | EN | ||
| Black musk deer | M. fuscus | EN | ||
| Himalayan musk deer | M. leucogaster | EN | ||
| Siberian musk deer | M. moschiferus | VU | ||
| Chinese water deer | Hydropotes inermis | II | VU | |
| Genus Rhinopithecus | Black snub-nosed monkey | Rhinopithecus bieti | I | EN |
| Grey snub-nosed monkey | R. brelichi | |||
| Golden snub-nosed monkey | R. roxellana | |||
| Variable Code | Variable Description |
|---|---|
| BIO1 | Annual Mean Temperature |
| BIO2 | Mean Diurnal Range (Mean of monthly (max temp–min temp)) |
| BIO3 | Isothermality (BIO2/BIO7) (×100) |
| BIO4 | Temperature Seasonality (standard deviation × 100) |
| BIO5 | Max Temperature of Warmest Month |
| BIO6 | Min Temperature of Coldest Month |
| BIO7 | Temperature Annual Range (BIO5 − BIO6) |
| BIO8 | Mean Temperature of Wettest Quarter |
| BIO9 | Mean Temperature of Driest Quarter |
| BIO10 | Mean Temperature of Warmest Quarter |
| BIO11 | Mean Temperature of Coldest Quarter |
| BIO12 | Annual Precipitation |
| BIO13 | Precipitation of Wettest Month |
| BIO14 | Precipitation of Driest Month |
| BIO15 | Precipitation Seasonality (Coefficient of Variation) |
| BIO16 | Precipitation of Wettest Quarter |
| BIO17 | Precipitation of Driest Quarter |
| BIO18 | Precipitation of Warmest Quarter |
| BIO19 | Precipitation of Coldest Quarter |
| AUC | ||
|---|---|---|
| Historical habitat modelling | Current habitat modelling | |
| Tiger | 0.769 | 0.989 |
| Asian elephant | 0.938 | 0.995 |
| Bactrian camel | 0.890 | 0.955 |
| Family Moschidae | 0.835 | 0.838 |
| Chinese water deer | 0.933 | 0.969 |
| Genus Rhinopithecus | 0.926 | 0.981 |
© 2020 by the authors. Licensee MDPI, Basel, Switzerland. This article is an open access article distributed under the terms and conditions of the Creative Commons Attribution (CC BY) license (http://creativecommons.org/licenses/by/4.0/).
Share and Cite
Qian, T.; Chi, Y.; Xi, C.; Li, Z.; Wang, J. Changes in the Historical and Current Habitat Ranges of Rare Wild Mammals in China: A Case Study of Six Taxa of Small- to Large-Sized Mammals. Sustainability 2020, 12, 2744. https://doi.org/10.3390/su12072744
Qian T, Chi Y, Xi C, Li Z, Wang J. Changes in the Historical and Current Habitat Ranges of Rare Wild Mammals in China: A Case Study of Six Taxa of Small- to Large-Sized Mammals. Sustainability. 2020; 12(7):2744. https://doi.org/10.3390/su12072744
Chicago/Turabian StyleQian, Tianlu, Yao Chi, Changbai Xi, Zhongqiu Li, and Jiechen Wang. 2020. "Changes in the Historical and Current Habitat Ranges of Rare Wild Mammals in China: A Case Study of Six Taxa of Small- to Large-Sized Mammals" Sustainability 12, no. 7: 2744. https://doi.org/10.3390/su12072744
APA StyleQian, T., Chi, Y., Xi, C., Li, Z., & Wang, J. (2020). Changes in the Historical and Current Habitat Ranges of Rare Wild Mammals in China: A Case Study of Six Taxa of Small- to Large-Sized Mammals. Sustainability, 12(7), 2744. https://doi.org/10.3390/su12072744