Article

Identification of Influencing Factors for Sustainable Development: Evaluation and Management of Regional Innovation Performance in Heilongjiang, China

1
School of Economics and Management, Harbin Engineering University, Harbin 150001, China
2
School of Business Administration, Liaoning Technical University, Huludao 125105, China
*
Authors to whom correspondence should be addressed.
Sustainability 2020, 12(7), 2739; https://doi.org/10.3390/su12072739
Submission received: 28 January 2020 / Revised: 28 March 2020 / Accepted: 30 March 2020 / Published: 31 March 2020
(This article belongs to the Section Sustainable Engineering and Science)

Abstract

:
Although the innovation factor endowment of Heilongjiang province is relatively rich, many innovation resources cannot effectively promote the sustainable development of innovation-driven performance. The combined drift degree evaluation method and grey-DEMATEL model were used to study regional innovation performance in Heilongjiang province and the key factors influencing it. The results of this study show that the overall trend of regional innovation performance is slowly rising. Compared with other regions, the level of science and technology output is in the forefront, and the level of economic output and social effect is at the end. The innovation performance level of enterprises and research institutions is at the end position, showing a trend of slow rise and then slow decline. The innovation performance level of universities is in the middle position, showing a trend of rising first, then falling and then rising. The degree of marketization, the financial environment, the intellectual property system, the transformation of scientific and technological achievements and the level of human capital are the core factors that affect the regional innovation performance. The dominant position and leading role of regional enterprises and the cooperation between industry, university and research institutes should be strengthened through government policies.

1. Introduction

With the progress of science and technology, human beings are rapidly evolving from an industrial economic society to a knowledge economic society. Science and technology, as the source of the construction of an innovation-oriented country, has gradually become a new economic growth point and plays an increasingly important role in promoting the sustainable development of national and regional economy [1]. At the same time, energy shortage and environmental pollution make the traditional economic development model unsustainable. Innovation has gradually become a powerful booster of national and regional economic sustainable development. The implementation of the innovation project provides high-quality intellectual services and gradually becomes the decision-making guarantee for the sustainable development of regional economy [2].
At present, economic growth slowdown has become a global phenomenon, and China’s economic structural slowdown is increasingly prominent [3]. Demand-side to pull the role of the economy gradually weakened, and the reform of the supply-side is imperative. In 2015, China proposed supply-side structural reform, one of the main purposes of which is to adjust the economic structure through innovation-driven development strategy and promote the smooth implementation of Made in China 2025 strategy [4]. China’s regional economic development has not balanced for a long time, and the structural problems between regions and within regions are also very prominent. Traditional advantageous industries in some zones are no longer beautiful and emerging industries develop slowly. The driving force of export, investment and consumption has weakened, and the contradiction between supply and demand has become increasingly prominent [5]. These problems are often the reflection of regional innovation ability and regional innovation performance. The root cause is that regional innovation factors cannot be effectively transformed into real productivity, thus affecting regional innovation performance and regional sustainable development [6]. Therefore, effectively adjusting the allocation of regional innovation resources plays an important role in accelerating the formation of a regional economic system mainly supported by innovation, and promoting the sustainable development of regional economy.
Regional innovation system is an integral part of a national innovation system. Regional innovation performance is of great significance to regional economic sustainable development and national overall economic development [7]. Heilongjiang province, an old industrial base in northeast China, ranked 22nd in China in 2017 with a GDP of 1.590268 billion yuan, up 6.4% year-on-year to 41,916 yuan, lower than the national average. In 2018, the GDP reached 1,636,162 billion yuan, ranking 23rd in China, with a year-on-year growth rate of 4.7%, lower than the national average and better than expected [8]. The main reason lies in the lack of innovation drive in the case of the troika dynamic weakening. According to the evaluation report on China’s regional innovation capacity in 2018, the comprehensive innovation level index of Heilongjiang province dropped two places to 16th in the country. From the perspective of the scientific and technological innovation environment, Heilongjiang province has significantly improved its innovation environment, rising from 17th to 12th place [9]. In 2017, the full-time equivalent of R&D personnel in Heilongjiang province was 47,406 person-years, which was in the middle of the whole country. However, the full-time equivalent of researchers is 29,660 person-years, which is in the middle and upper reaches of the country and has certain advantages in quantity. The total number of the three kinds of patents authorized is 18,221, which is in the middle and lower reaches of the country.
With the rapid development of China’s economy, the number of large and medium-sized state-owned enterprises from the original advantages gradually become disadvantages. Heilongjiang province has gradually lost the original advantages. From 2007 to 2017, the contribution of industry to Heilongjiang’s economic growth remained above 50%. Among them, the proportion of the added value of energy industry in the proportion of industries above the scale is highest at 72.9% and the lowest at 53.8%, and the growth rate is highest at 13.1% and the lowest at 6.3% [8,10]. The growth potential of a number of industries has not yet been fully unleashed, and the vitality of economic growth is insufficient. In the last 10 years, the innovation vitality of Heilongjiang regional enterprises is insufficient, and the quality of innovation output is average. The number of high-tech enterprises is obviously low and needs attention and improvement. The theoretical innovation and quantity of innovation in universities need to be further strengthened. The number of government research institutes in Heilongjiang decreased a lot, while the number of enterprise research institutes increased a little. The total quantity presents the decreasing trend, and Heilongjiang province still has certain development potential [6,9,10].
There are many researches on regional innovation performance, but there is still a lack of analysis on the actual situation of Heilongjiang province. The setting of the existing index system is not reasonable, and the innovation performance of specific regions cannot be analyzed effectively. Most of the methods focus on the evaluation of static methods and lack of dynamic analysis methods for empirical research. Although scholars have found that there are many factors influencing regional innovation performance, there is a lack of systematic sorting and the study of influencing factors is scattered. Many innovation resources cannot be effectively converted into real productive forces, and their contribution to economic sustainable development is limited [11].
The purpose of this study includes the following three aspects. (1) Based on relevant studies, the regional innovation performance dynamic evaluation index system and regional innovation subject dynamic evaluation index system of Heilongjiang province are constructed based on the current status of regional innovation. (2) Based on the current status of regional innovation, the science and technology output, economic output and social effect of enterprises, universities and research institutions in Heilongjiang province are effectively analyzed. (3) Through comparative analysis, the key factors affecting the regional innovation performance in Heilongjiang province are selected. The theoretical purpose of this study is not only to expand the research perspective and method of regional innovation performance evaluation, but also to enrich the regional innovation system theory and provide important theoretical support for the construction of a regional innovation system. The practical purpose of this study is not only to provide reference for the development strategies of regional innovation subjects, but also to contribute a little to the new path of comprehensive sustainable development of Heilongjiang province.
The following structure of this paper is as follows. The regional innovation review is in Section 2. Section 3 shows the research method and index system. Empirical results are listed in Section 4. Section 5 presents on the discussion analysis. Section 6 summarizes the research conclusion and enlightenment of this paper, and points out the shortcomings of this paper.

2. Literature Review

2.1. Theoretical Research on Regional Innovation Performance

(1) Research on concepts related to regional innovation. Riddle pointed out that regional innovation ability refers to the potential of relevant subjects in innovation activities to use relevant resources to create new products in a specific region [12]. Tura et al. pointed out that regional innovation capacity is an ability to allocate economic, cultural and social resources effectively [13]. Li et al. believed that regional technology innovation capability is an important foundation for economic sustainable development [14]. Huang et al. believed that regional innovation ability refers to the regional ability to transform new knowledge into new products [15]. Jin et al. regarded innovation activities as mainly determined by independent R&D input [16]. Yang et al. believed that regional innovation performance is the output and benefits are brought by regional innovation activities [17]. Hu et al. believed that the performance of scientific and technological innovation reflects the allocation of scientific and technological R&D innovation resources in each region [18].
(2) Research on factors influencing regional innovation performance. Söderlund et al. believed that the improvement of regional financial service efficiency can help enterprises make better use of external information [19]. Barra believed that regional knowledge innovation is conducive to improving regional innovation capacity and promoting regional economic development [20]. Hauser et al. pointed out that the development of finance contributes to the technological innovation of middle and small-sized enterprises [21]. Li et al. studied the direct and indirect effects of research institution behavior on regional innovation performance [22]. Based on the innovation value chain theory, Wang et al. divided the regional innovation process into two sub-stages: innovation R&D and achievement transformation [23]. Xiao et al. studied the impact of scientific and technological human resource input on regional innovation performance when the coupling coordination degree of industry-university-research was taken as the threshold variable [24].
As for the research on regional innovation performance in Heilongjiang province, Tan et al. analyzed the distribution pattern and development process of innovation capacity of Heilongjiang province, and pointed out that the absolute difference of innovation capacity was very obvious [25]. Li believed that a sound market system can make Heilongjiang province take the lead in system construction [26]. Han et al. believed that the main driving force for the growth of innovative total factor productivity (TFP) in the three northeastern provinces is technological progress, and the driving force of TFP innovation in Liaoning and Heilongjiang provinces is mainly technological progress [27].

2.2. The Index System of Regional Innovation Performance Evaluation

Many scholars studied the index system of regional innovation performance evaluation [28,29,30,31,32,33]. Li et al. investigated regional innovation performance from two stages: intermediate output and final output [28]. Li et al. measured regional innovation performance from four aspects: innovation system strength, patent application authorization, new products and high-tech industry development [29]. Deng believed that the sales revenue of new products can better express the marketization ability of innovation output than the patent index [30].
As for the research on the evaluation index system of innovation performance in Heilongjiang province, Liang believed that the evaluation index system of regional innovation ability in Heilongjiang province includes innovation resource input ability, innovation subject allocation ability, innovation output ability and innovation environment support ability [31]. Wu et al. selected investment indicators, including the proportion of R&D personnel in an enterprise’s employees, as well as the fund guarantee for independent R&D. Output indicators are the proportion of new product sales revenue to main business revenue, and the ratio of the number of invention patents applied to the number of patents applied [32]. Hong combined the specific contents of the input and output projects of science and technology innovation in Heilongjiang province, and selected evaluation indexes for the input projects from two aspects: human input and financial input. For the output project, three evaluation indexes are selected from the two aspects of technical output and high-tech output, with a total of seven evaluation indexes [33].

2.3. The Evaluation Methods of Regional Innovation Performance

Many scholars studied the evaluation methods of regional innovation performance, such as data envelopment analysis (DEA) model, entropy weight method and coupling coordination degree model. Christoph et al. believed that the efficiency of achievement transformation and the efficiency of comprehensive innovation in each region are used to describe the regional innovation performance [34]. Corrado et al. studied the relationship between the innovation of intangible assets and economic growth in some EU countries, and found that the importance of knowledge capital in the economic growth of developed countries has become increasingly prominent [35]. Vitola et al. used the institutional potential index method to study the impact of technological innovation on economic development and found that a good innovation environment has a positive impact on regional development [36]. There are many evaluation methods, such as principal component analysis [37,38] and weighted comprehensive evaluation method [39,40]. Li et al. studied the comprehensive development capability of regional manufacturing industry by using the comprehensive evaluation model [41]. Zhao et al. studied the sustainable development ability of regional manufacturing industry by using analytic hierarchy process [42]. Li et al. evaluated the green competitiveness of regional manufacturing industry by using the projection pursuit model of genetic algorithm [43]. Yu et al. used the three-stage DEA model to evaluate the quality competitiveness of regional manufacturing industry [44]. Cao et al. used collinearity and coefficient of variation method to screen indicators for evaluation of provincial green innovation capacity, and used Delphi method and coefficient of variation method to calculate the weight of each indicator [45]. Feng used DEA-SBM method to measure the green innovation efficiency of industrial enterprises [46]. Li et al. used the combined weighting method based on the fuzzy analytic hierarchy process and the maximum deviation method to calculate the index weight [47].

3. Research Methods and Indicator System

3.1. Research Methods

3.1.1. Drift Degree Combination Evaluation Method

The evaluation methods of regional innovation mainly include subjective evaluation method and objective evaluation method. Subjective evaluation method mainly includes analytic hierarchy process, Delphi method, and fuzzy synthesis method. Objective evaluation methods mainly include parametric method and non-parametric method. The parameter method is represented by the random frontier method, but its disadvantage is that it needs to set the production function in advance. While the non-parameter method is represented by the data envelope method, its disadvantage is that it is very sensitive to outliers. China’s regional innovation ability report uses the expert prior scoring method to give weight. China innovation index research adopts the grade-by-grade equal-weight method for weight distribution. The European innovation scoreboard uses steps such as weighting to measure indicators. The Global Innovation Index (GII) is evaluated using methods such as multiple models.
Most methods in the literature are single evaluation methods [48]. In fact, the operating mechanism and application objects of different single evaluation methods are different. When different evaluation methods are applied to evaluate the same problem, there exists the problem of non-consistency of the evaluation results. Therefore, scholars put forward the idea of combined evaluation. At present, the research on combination evaluation mainly focuses on the combination of evaluation weights and the combination of evaluation conclusions. Compared with the method of combination weighting, the combination of evaluation conclusions is more direct and avoids the deviation caused by the result of weight combination. Therefore, this study draws on the multi-model evaluation method in the GII to ensure the reliability of the results without systematic bias. Based on the combination of subjective and objective evaluation models, the comprehensive dynamic evaluation method of regional innovation performance is adopted.
In this study, experts in regional innovation and related personnel in science and technology innovation management of government departments were consulted. This paper selected the objective evaluation methods of entropy weight method and maximum deviation method, and the subjective evaluation methods of TOPSIS method and grey relational degree method. On the basis of single evaluation, drift evaluation method is applied. Drift degree is the difference between the evaluation conclusion and the authenticity conclusion of each single evaluation method. Drift evaluation method is a combined evaluation method based on the evaluation conclusion of a single evaluation method. Based on the consistency of the evaluation conclusions of multiple single evaluation methods, the drift degree model measures the drift degree according to the rank correlation coefficient between the evaluation conclusion and the real value. The evaluation method with large drift degree is given a smaller weight, while the evaluation method with small drift degree is given a larger weight. This method effectively solves the problems such as the lack of consistency of the evaluation results and the difference between the evaluation conclusions and the objective reality.
(1) Establishment of the evaluation model. (a) Standardized processing of the original data of evaluation indicators. (b) Entropy weight method, TOPSIS method, deviation maximization method and grey relational degree method were used for single evaluation. (c) Spearman rank correlation coefficient is used to test the consistency of the evaluation results. If the consistency is strong, the combination evaluation method of drift degree is used for the combination evaluation. The evaluation model is shown in Figure 1.
The application of regional innovation performance evaluation should first determine the efficacy function. Let v i j represent the order parameter, and α i j and β i j are the upper and lower limits of the order parameters of the critical point. p i j represents the contribution of the variable v i j to the system, and p i j [ 0 , 1 ] . The efficacy coefficients are as follows [49]:
p i j = { ( v i j β i j ) / ( α i j β i j ) , Positive   effect ( α i j v i j ) / ( α i j β i j ) , Negative   effect
(2) Subjective and objective evaluation methods. The evaluation methods are shown in Appendix A.
(3) Combined drift evaluation method. Compatibility: The regional innovation performance evaluation is combined with the evaluation results of four single evaluation methods: Entropy weight method, maximum deviation method, TOPSIS method and grey relational degree method. The scientific rationality of the combined evaluation results depends on the rationality of the results of the four single evaluation methods mentioned above. The applicability of different single evaluation methods to different evaluation problems is different. A single evaluation method for a specific problem to be evaluated, if applicable, is called a compatible method, and constitutes a single evaluation method set for the problem [50]. Therefore, it is necessary to evaluate the compatibility test of the above four single evaluation methods. Combined evaluation results are reasonable and effective only when the selected single evaluation methods are compatible. The implementation process of the combined drift evaluation method is as follows.
① Construct evaluation method set M 0 . The regional innovation performance index system is selected and the evaluation objects are evaluated by using each single evaluation method.
② Determine the compatibility evaluation method set M 1 . Spearman rank correlation coefficient was used to test the compatibility of the evaluation results. The formula of Spearman rank correlation coefficient is as follows:
r i j = 1 6 s = 1 n d s 2 n ( n 2 1 )
where i = 1 , 2 , , r ; j = 1 , 2 , , r . d s is the grade difference between the combination evaluation methods in i and j .
③ The average value of each single evaluation method is used as the reference frame for drift measurement. The correlation coefficient r j ( t k ) of the evaluation value of each single evaluation method u i j ( t k ) and the reference frame u ¯ ( t k ) at time t k can be obtained. The drift degree of each single evaluation method used for combined evaluation is as follows:
p j ( t k ) = 1 r j ( t k ) , j = 1 , 2 , , b
④ On the basis of driftability measure, according to the evaluation method with large driftness, it is given a small weight; otherwise, it is the opposite principle. Then the weight of method j at time t k is as follows:
w j ( t k ) = min 1 j b [ p j ( t k ) ] + max 1 j b [ p j ( t k ) ] p j ( t k ) j = 1 b { min 1 j b [ p j ( t k ) ] + max 1 j b [ p j ( t k ) ] p j ( t k ) }
where j = 1 , 2 , , b ; k = 1 , 2 , , N .
⑤ Assuming the evaluation conclusion u i j ( t k ) of the method j of the object i to be evaluated at time t k , the combined evaluation result of drift degree is as follows:
P i ( t k ) = j = 1 b u i j ( t k ) w j ( t k ) , i = 1 , 2 , , m

3.1.2. Grey-DEMATEL Model

Grey system theory is the uncertain system of small samples and poor data with partial information known and partial information unknown. By generating and developing some known information and extracting valuable information, the theory can accurately describe and monitor the system’s operation behavior and evolution law. In the case of less sample data, the uncertainty of the system and the imperfection of sample data are overcome, and a relatively accurate prediction model is established [51]. Assuming that any random process is the grey quantity that varies within a certain range, the random process is called the grey process.
DEMATEL method, proposed by American scholar Battelle in 1971, is mainly based on graph theory and matrix to establish a structural model to analyze the causal relationship among complex factors [52]. Collecting information is the first step of system analysis. When collecting information, the scientific nature, rigor, and rationality of the collection method must be ensured. The collected information should try to include all the influencing factors.
(1) Key factor selection method based on Grey-DEMATEL model. Grey model and DEMATEL model are shown in Appendix B.
(2) Key factor selection process based on Grey-DEMATEL model.
Step 1: Establish the index system of influencing factors. Six experts in the field (2 heads of government departments, 2 executives of enterprises and 2 researchers from universities) are invited to compare the factor relations in the pairwise relation matrix, and then the evaluation and scoring are conducted to construct the initial matrix.
Step 2: Establish direct impact matrix based on grey theory.
① Establish the grey number matrix. The classification results of expert evaluation semantic variables are shown in Table 1, which are divided into five grades. According to this rule, the initial matrix is transformed into grey number matrix.
②The normalized results of upper and lower bounds of grey numbers are as follows:
{ _ X i j ~ k = ( _ X i j k min _ X i j k ) / Δ min max ¯ X i j ~ k = ( ¯ X i j k min ¯ X i j k ) / Δ min max Δ min max = max ¯ X i j k min _ X i j k
where _ X i j k and ¯ X i j k are the lower and upper bounds of expert evaluation, and Δ min max is the maximum and minimum difference.
③ The clear definition value of grey number matrix is as follows:
Y i j k = { _ X i j ~ k ( 1 _ X i j ~ k ) + ( ¯ X i j ~ k × ¯ X i j ~ k ) } 1 _ X i j ~ k + ¯ X i j ~ k
④ The direct impact matrix is constructed as follows:
Z i j k = min ¯ X i j k + Y i j k Δ min max
Step 3: Experts set weights. According to the degree of each expert’s mastery of the research field, experts assign different weights, which are fuzzy. The weighted semantic variables are shown in Table 2. The grey number weights of the six experts are shown in Table 3.
Step 4: The weight value of grey number is standardized and clarified, and the calculation formula of the final direct impact matrix is as follows:
{ Z i j = ω 1 Z i j 1 + ω 2 Z i j 2 + + ω p Z i j p , i = 1 p ω i = 1 Z = [ 0 Z 12 Z 1 j Z 21 0 Z 2 j Z i 1 Z i 2 0 ]
Step 5: The calculation formula of the standardized matrix is as follows:
S = 1 max 1 i n j = 1 n z i j , i , j = 1 , 2 , , n
N = S × Z
Step 6: The calculation formula of the comprehensive influence matrix is as follows:
T = N ( 1 N ) 1
Step 7: According to the comprehensive influence matrix, the calculation formulas of the centrality and causation of each factor are as follows:
{ P i = { R i + C j | i = j } E i = { R i C j | i = j } R i = j = 1 n t i j , C j = i = 1 n t i j , i N + , j N +
Step 8: According to the numerical results of degree of centrality and degree of causation, the cartesian coordinate system is constructed and the influencing factors are marked in the coordinate system.
(3) The framework of key factor selection process based on Grey-DEMATEL model.
Based on the above analysis and Steps, DEMATEL method is a systematic factor classification method used to study the correlation and importance of factors. The method can effectively determine the relationship between criteria or elements, as well as the degree of interaction between factors. However, DEMATEL method does not take into account the weight between evaluation indicators and the evaluation fuzziness. In this paper, interval grey number method is introduced to construct Grey-DEMATEL model which is practical and more flexible. The main advantage of the Grey-DEMATEL model is to construct a flexible decision model and make the decision result closer to the reality by using grey interval number. The framework of key factor selection process based on Grey-DEMATEL model is shown in Figure 2.
Figure 2 presents the processes used in the key factor selection process based on Grey-DEMATEL model. The main steps for the model to be implemented are as follows. (a) Four index systems of influencing factors are established based on expert group in the field. (b) The evaluation and scoring are conducted to construct the initial matrix. (c) The initial matrix is transformed into grey number matrix. (d) The upper and lower bounds of grey numbers are normalized. (e) The clear definition value of grey number matrix is obtained. (f) The direct impact matrix is constructed. (g) The weighted semantic variables are given by experts. (h) The weight value of grey number is standardized and clarified. (i) The matrix of the weight value is standardized. (j) The comprehensive influence matrix is obtained. (k) The centrality and causation of each factor are obtained. (l) The cartesian coordinate system is constructed and the influencing factors are marked.

3.2. Construction of Index System

An important theoretical basis for evaluating innovation performance is innovation value chain theory. Hansen and Birkinshaw (2007) argued that the innovation value chain is a stream of activity that transforms ideas from generation to commodity, which contributes to the improvement of innovation performance [53]. The theory of regional innovation system also holds that the innovation unit realizes the innovation function through the interaction of the innovation structure itself and its environment, and influences the regional society, economy and ecology. The innovation performance can be divided into the ability of each innovation subject to make use of scientific and technological innovation resources for R&D. The ability to commercialize and market new products, processes or technologies and the benefits to the entire region. In this study, experts in regional innovation and related personnel in science and technology innovation management of government departments were consulted to measure regional innovation performance from three aspects: Science and technology output, economic output and social effect.

3.2.1. Dynamic Evaluation Index System of Regional Overall Innovation Performance

The research on regional innovation should grasp the motivation and characteristics of regional innovation comprehensively from the perspective of the innovation performance of micro-subject [54]. Based on the functional considerations of regional innovation subjects, regional innovation subjects mainly include enterprises, universities, research institutions and intermediary institutions. Although the intermediary institutions are the auxiliary institutions of regional innovation resource connection and allocation, they are not enough to play the main role of leading the regional innovation development. In China, innovation subjects not only refer to enterprises, as universities and research institutions are still important recipients of innovation resources and producers of innovation achievements [55]. Therefore, this study defines the subject of regional innovation as enterprises, universities and research institutions. The following is the construction of the regional overall innovation performance dynamic evaluation index system and three innovation subjects.
Aiming at the dynamic evaluation index system of regional overall innovation performance, this study evaluates science and technology output, economic output and social effect. Science and technology output includes indicators such as patents, papers and trademarks. Economic output includes product sales, technology transfer and other related indicators. Social effect includes economic, social and environmental effects brought by innovation. The dynamic evaluation index system constructed is shown in Table 4.

3.2.2. Dynamic Evaluation Index System of Regional Enterprise Innovation Performance

Enterprise innovation is an important part of regional innovation, which involves not only the R&D of invention, utility and appearance patented technology, but also the commercialization and industrialization of technological achievements and the economic and social impact [56]. There are many factors influencing the innovation performance of enterprises with complicated structure. Only by constructing the enterprise innovation performance evaluation index system from multiple perspectives and levels can the regional enterprise innovation performance be fully reflected. The science and technology output of regional enterprises reflects the input and output of patents and trademarks of regional enterprises through the innovation of human resources, financial resources and material resources. The economic output of regional enterprise innovation reflects the direct income brought by regional enterprise innovation. The social effect of regional enterprise innovation reflects the positive influence of regional enterprise innovation on regional economy, society and environment. The dynamic evaluation index system constructed is shown in Table 5.

3.2.3. Dynamic Evaluation Index System of Regional Universities’ Innovation Performance

Universities are the subject of regional knowledge innovation, whose innovation activities are mainly basic research and applied research [57]. It is the source of regional innovation, the subject of research and the subject of talent training. Generally, the innovation achievements are not directly converted into economic profits, and are mainly reflected in the form of patents and papers. The science and technology output of regional universities reflects the input and output of patents, scientific and technological papers, and works of regional universities through the innovation of manpower, financial resources and material resources. The economic output of regional universities’ innovation reflects the direct income brought by regional universities’ innovation. The social effect of regional universities’ innovation reflects the positive influence of regional universities’ innovation on regional talent training and improvement of scientific and technological levels. The dynamic evaluation index system constructed is shown in Table 6.

3.2.4. Dynamic Evaluation Index System of Regional Research Institutions’ Innovation Performance

Research institutions play an important role as creators of core technologies and disseminators of technical knowledge in regional innovation systems. Compared with the innovation function of enterprises, regional research institutions focus more on basic research, experimental development, design and tests, and other original innovation functions in the regional innovation system [58]. Generally, the regional research institution adopts three development modes: Independent innovation based on its own technological resources, imitation innovation based on technology introduction and joint participation of various parties. Similar to the role of universities, regional research institutions tend to focus on basic technical research, and are now gradually promoting the model of basic research, applied research, experimental development, trial production and sales of scientific discovery. Regional research institutions are the subject of regional knowledge innovation. Most of their innovative achievements are not directly converted into economic profits, but mainly in the form of patents and scientific papers. The dynamic evaluation index system is shown in Table 7.

4. Empirical Results

4.1. Data Source

In order to comprehensively analyze the regional innovation performance in Heilongjiang province, the regional innovation performance in Heilongjiang province is dynamically evaluated from the following two aspects: Regional innovation performance and each innovation subject in Heilongjiang province. Research data from 2010–2018 “China Statistical Yearbook of Science and Technology, China’s Environmental Statistical Yearbook, China Energy Statistical Yearbook and China Statistical Yearbook, Heilongjiang Statistical Yearbook, Heilongjiang Science and Technology Statistical Manual, China Regional Innovation Capacity Report, China Regional Innovation Index Report, 2018 National Large and Medium Sized Cities Update for the Prevention and Control of Environmental Pollution by Solid Waste and the Regional Environment Bulletin Data Documents and Materials”.
This study draws on relevant scholars’ research results and consults relevant experts’ suggestions. In this study, 16 regions in China, namely six growth triangles, were selected as the research objects. Growth triangle refers to the economic region of the inter-provincial domain cooperation, covering southeast China’s coastal, central, western and northeastern regions, which mainly includes the Beijing-Tianjin-Hebei metropolitan zone (Beijing, Tianjin and Hebei), the Yangtze River Delta economic zone, (Shanghai, Jiangsu and Zhejiang), the triangle economic zone (Hubei, Hunan and Jiangxi), the Pearl River Delta economic zone (due to Hong Kong and Macau University innovation system differences with China, here, we only include Guangdong province), west triangle economic zone (Sichuan, Chongqing and Shaanxi), and the northeast economic zone (Heilongjiang, Jilin and Liaoning), totaling six districts, including 16 provinces and municipalities directly under the central government. The six growth triangles are concentrated in enterprises, universities and research institutions (especially industrial enterprises and key universities above the scale). These zones are home to the country’s important scientific, educational and intellectual resources, with a large number of inputs and outputs in scientific research. As the relevant data on innovation of Jiangxi provincial research institutions cannot be obtained, the innovation performance of Jiangxi provincial research institutions has not been evaluated.
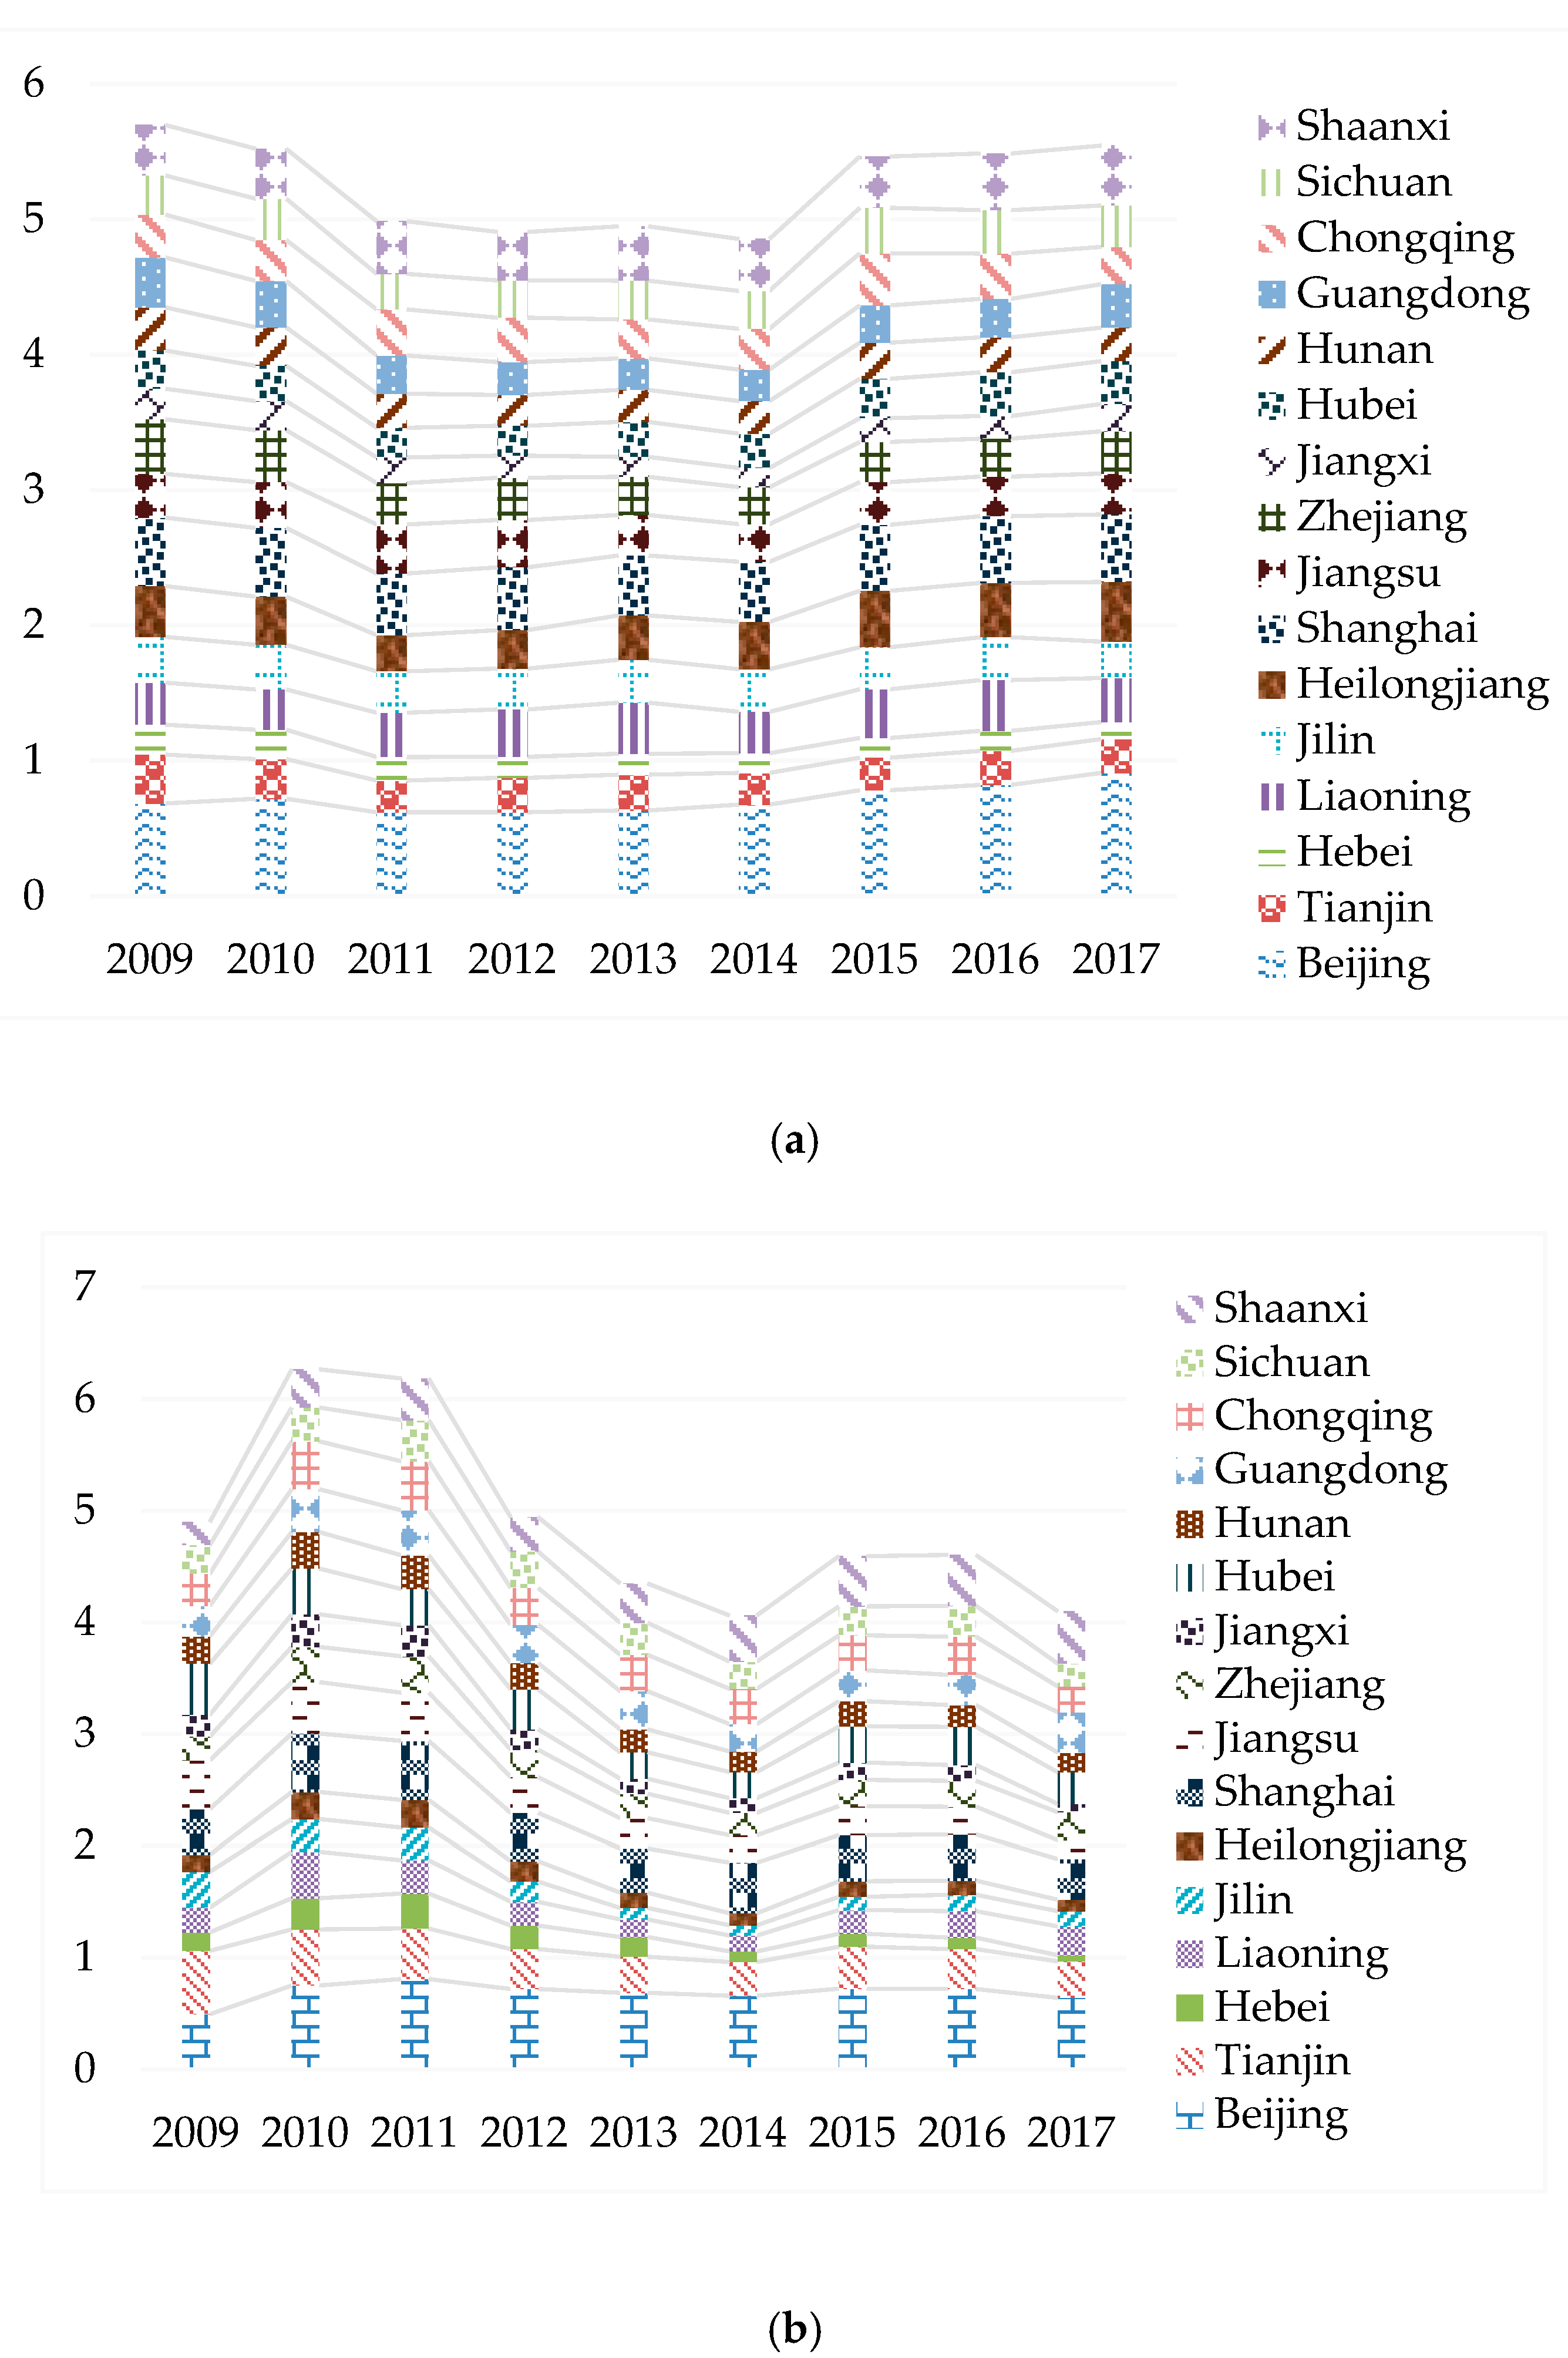
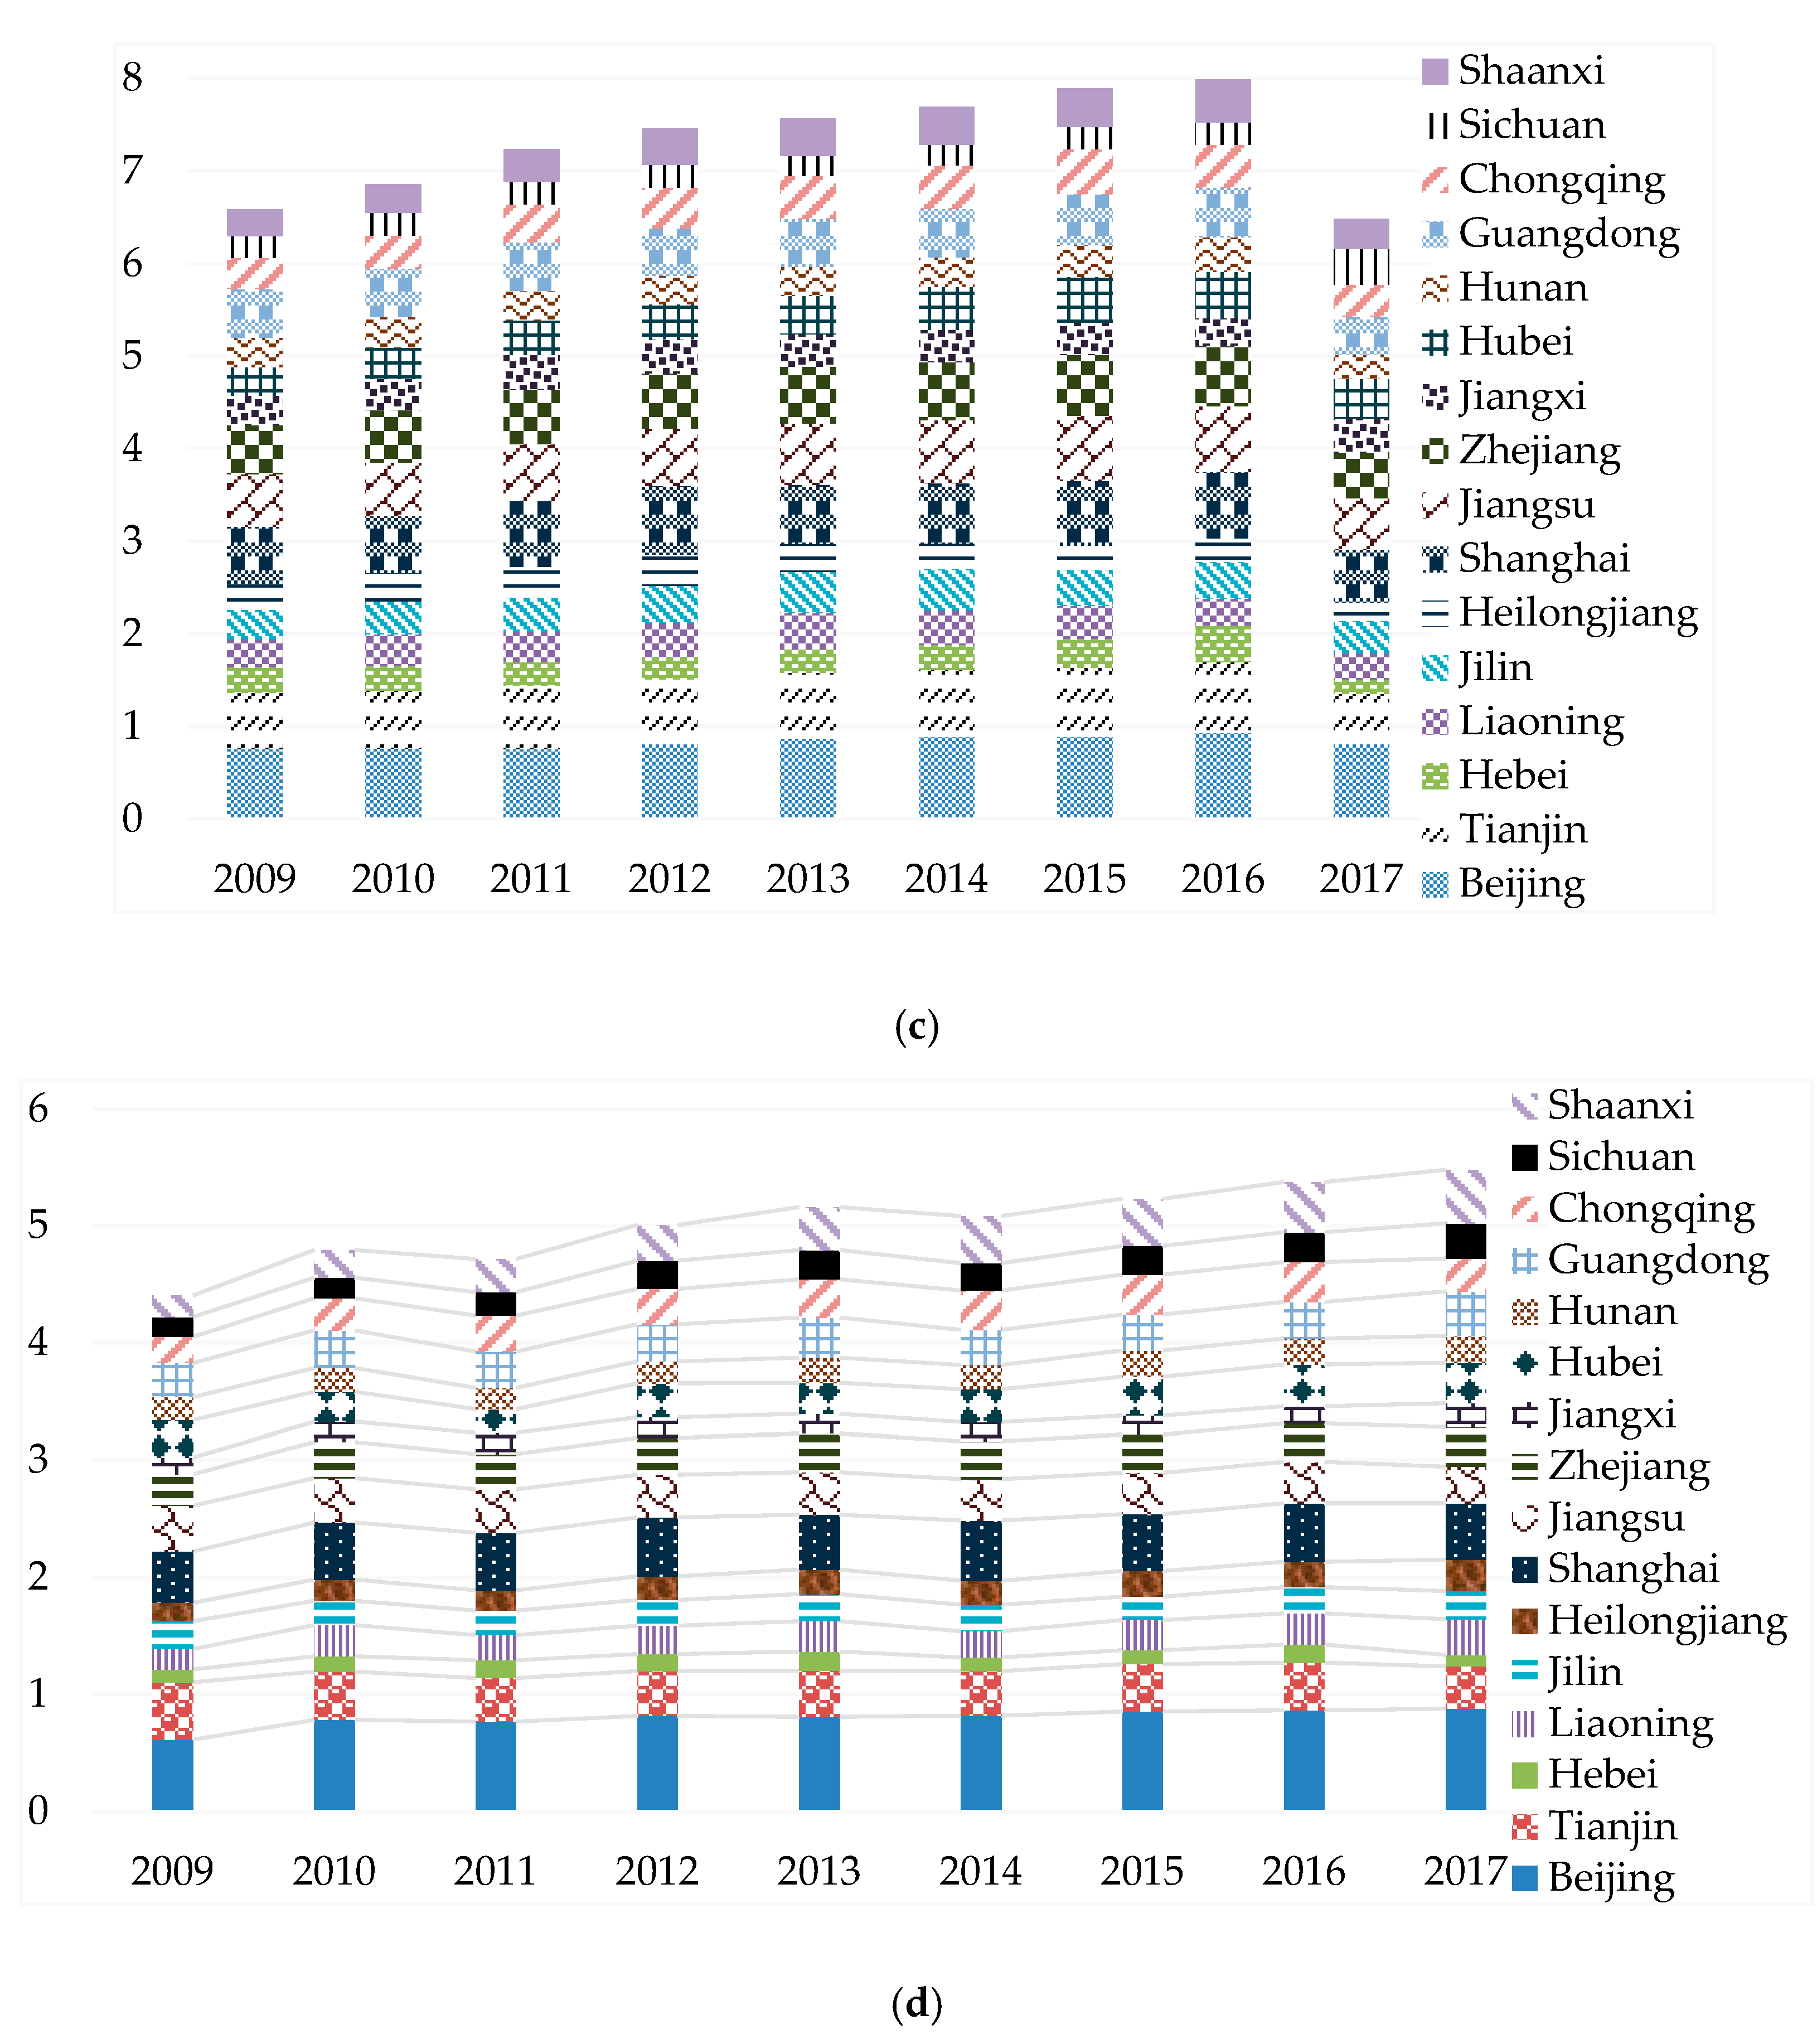
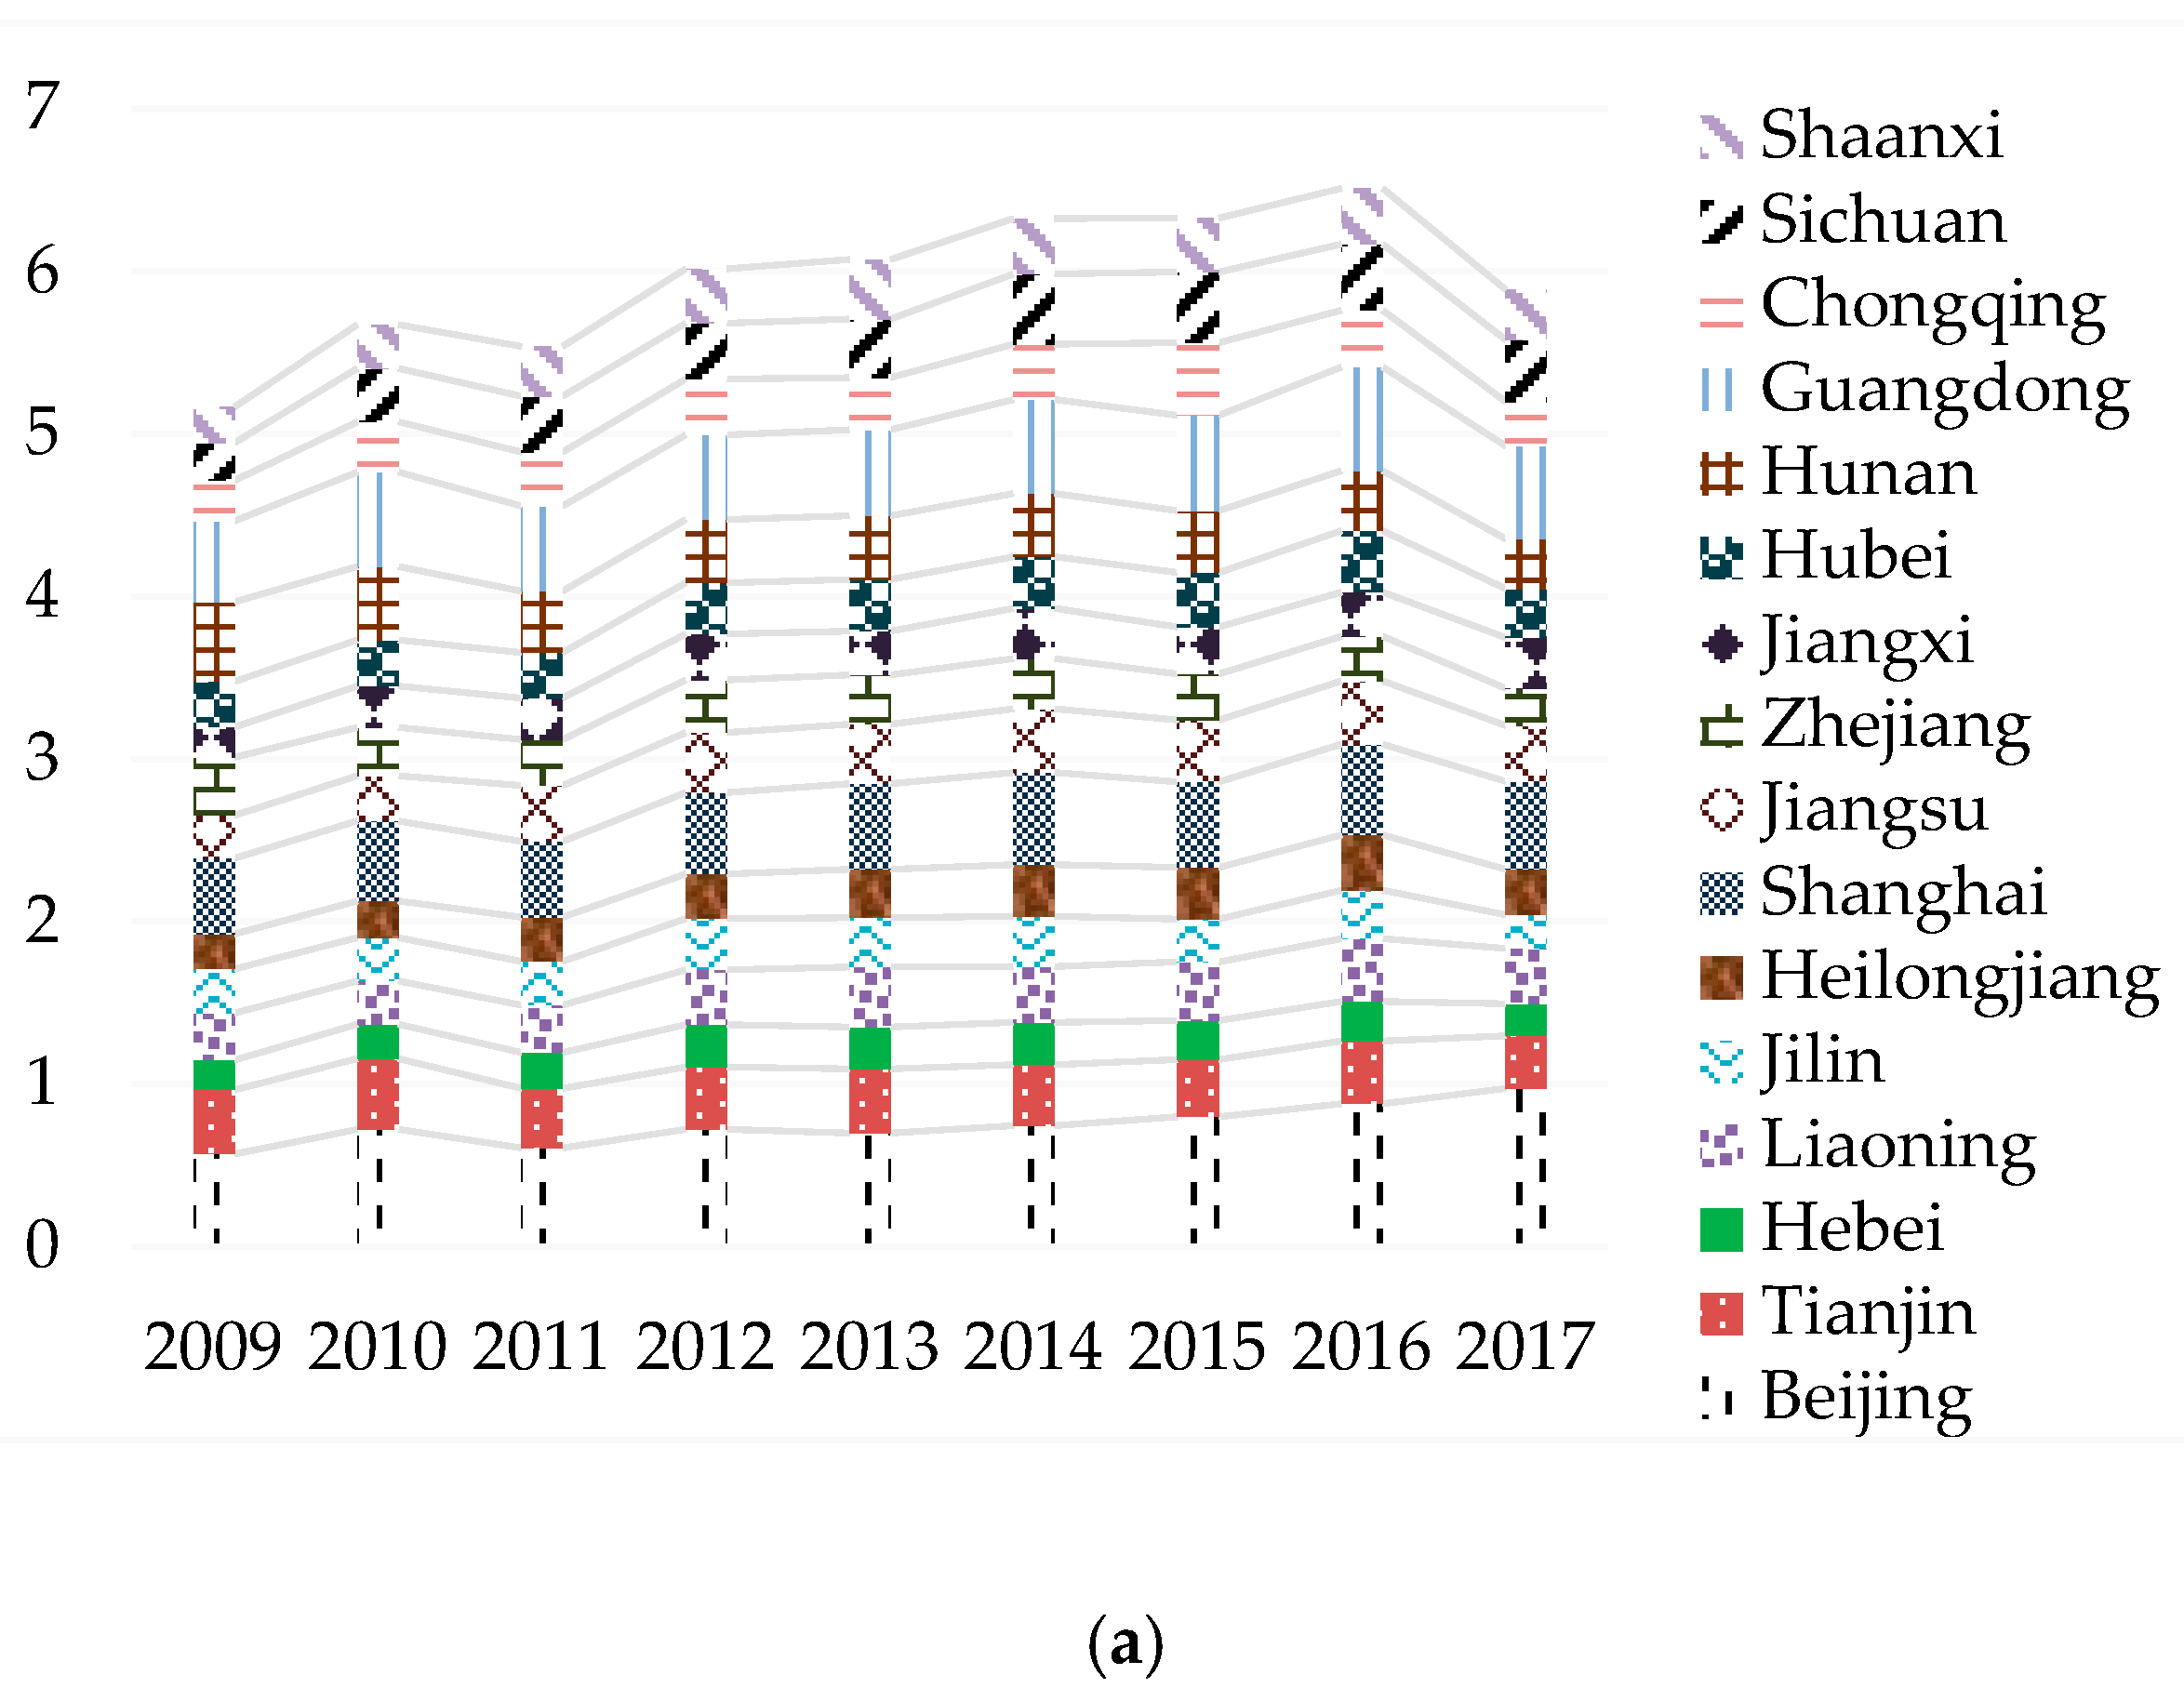
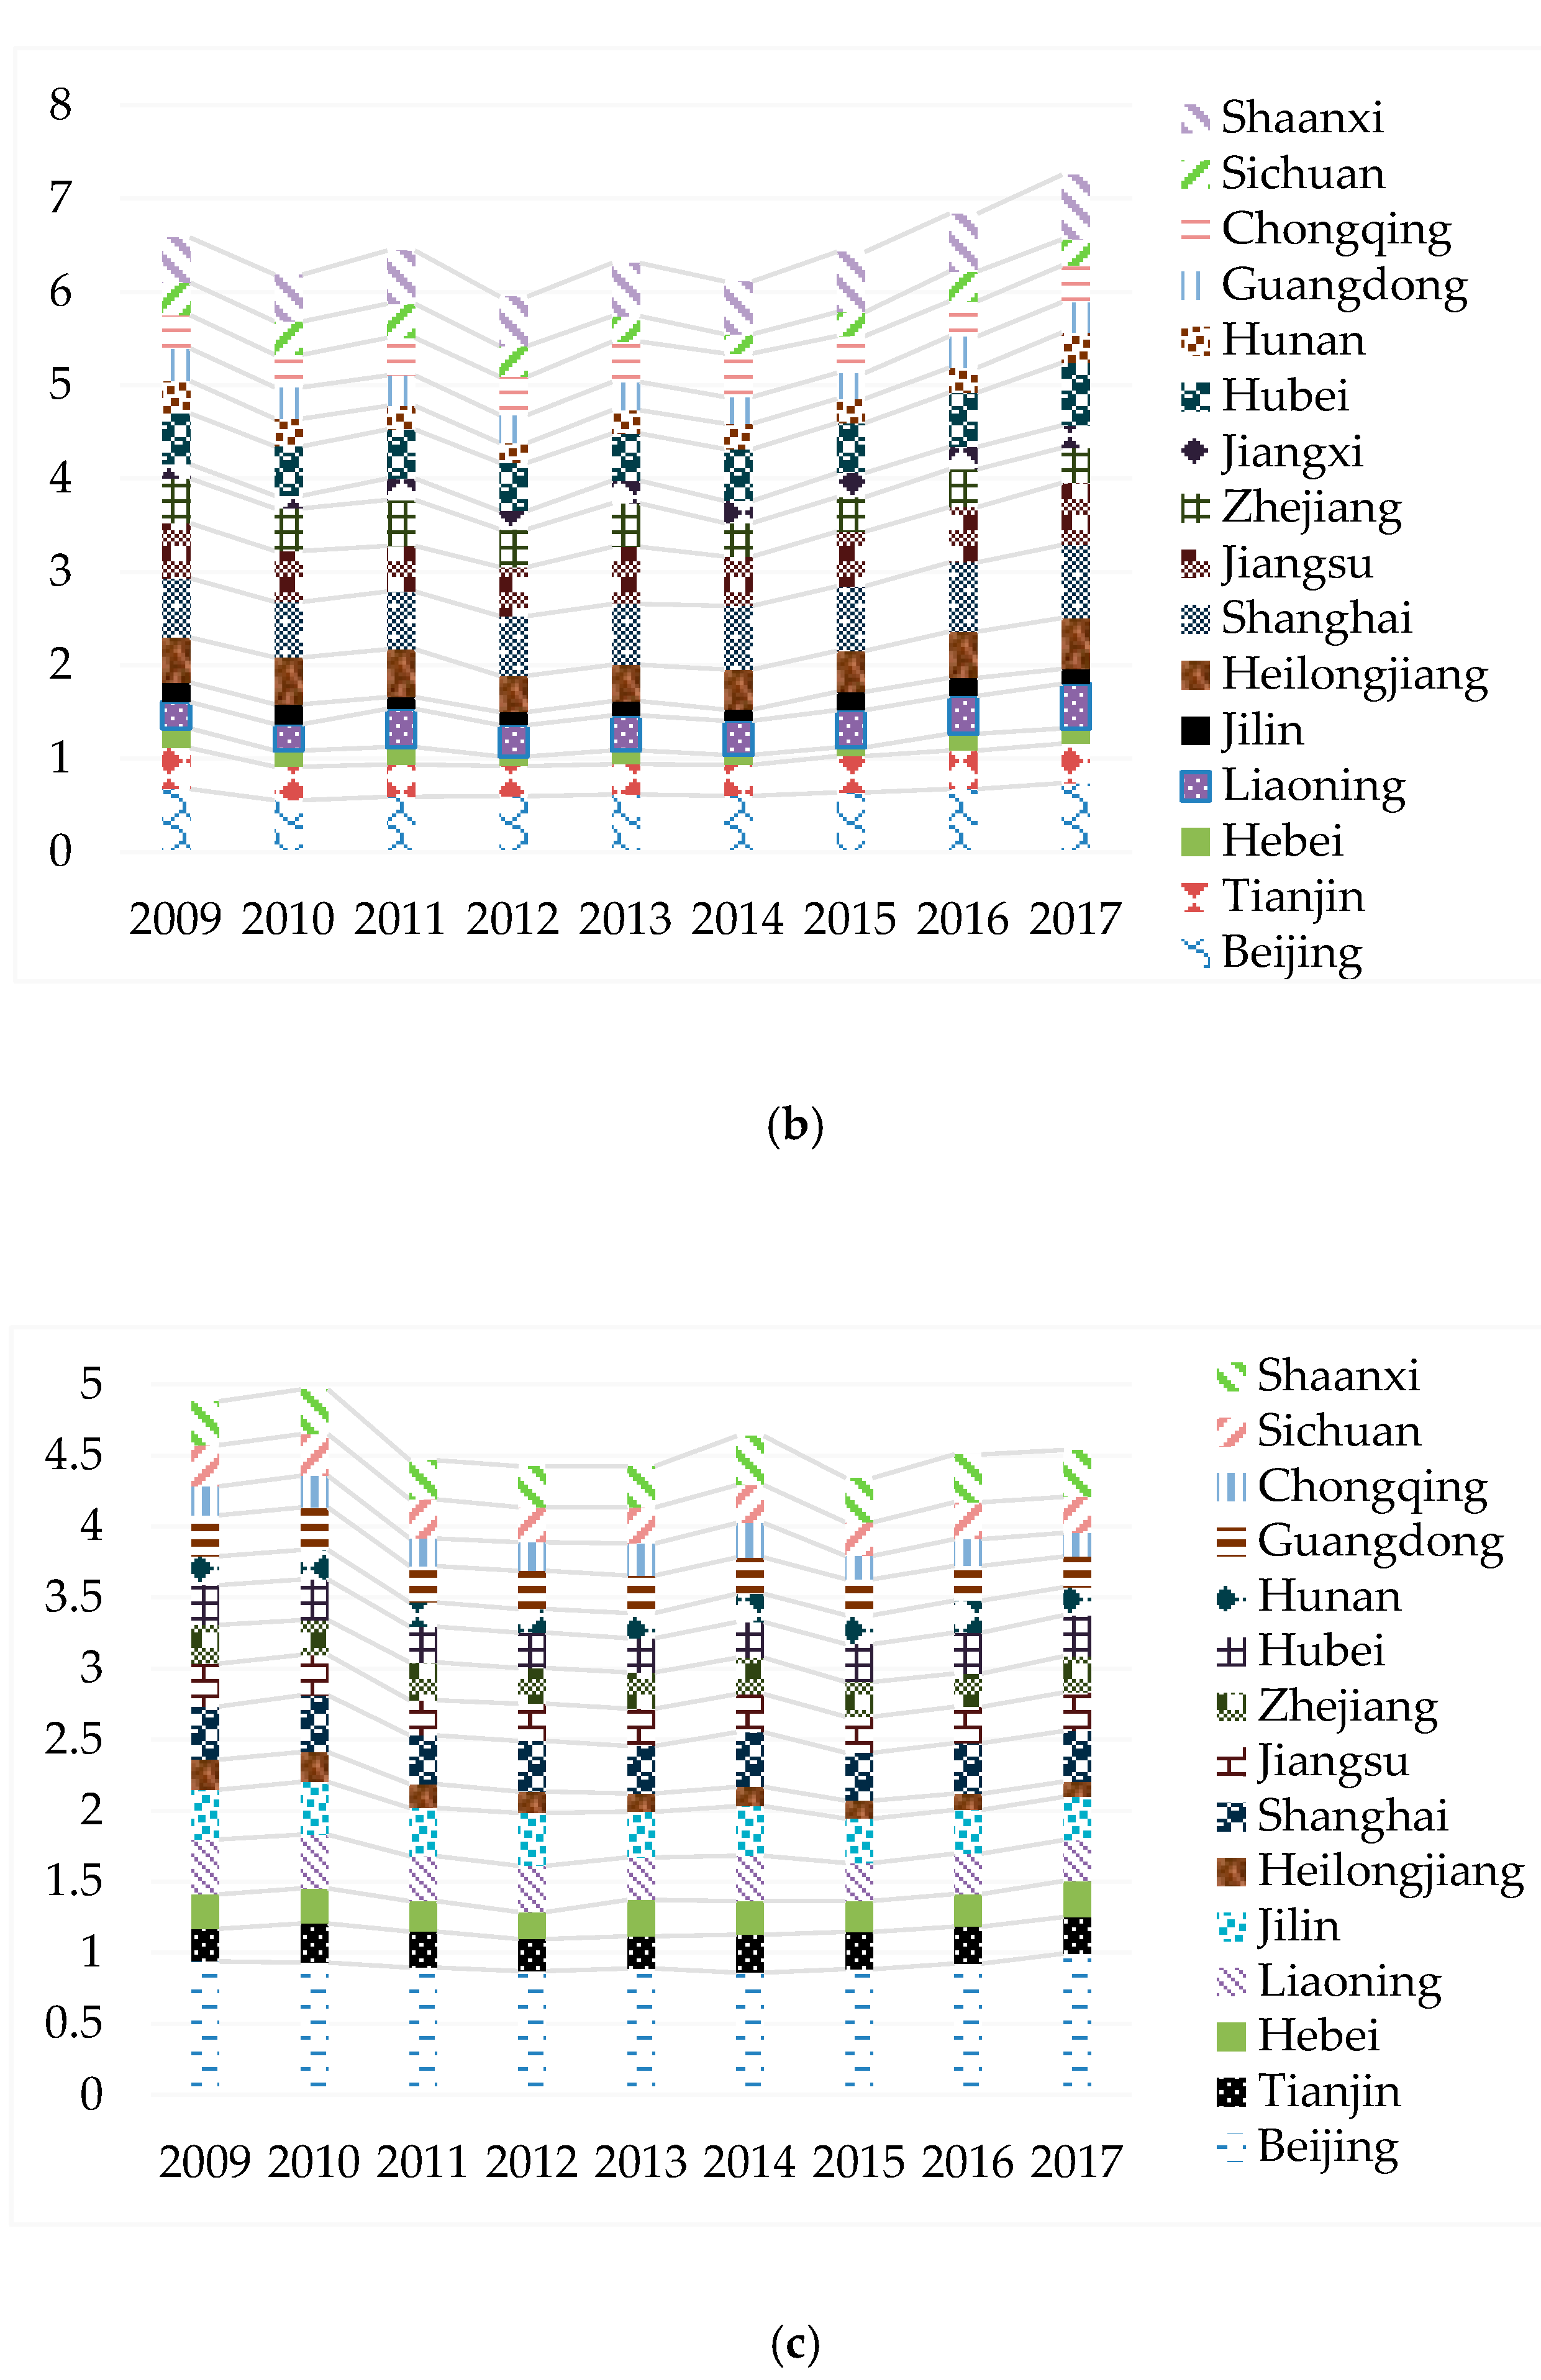
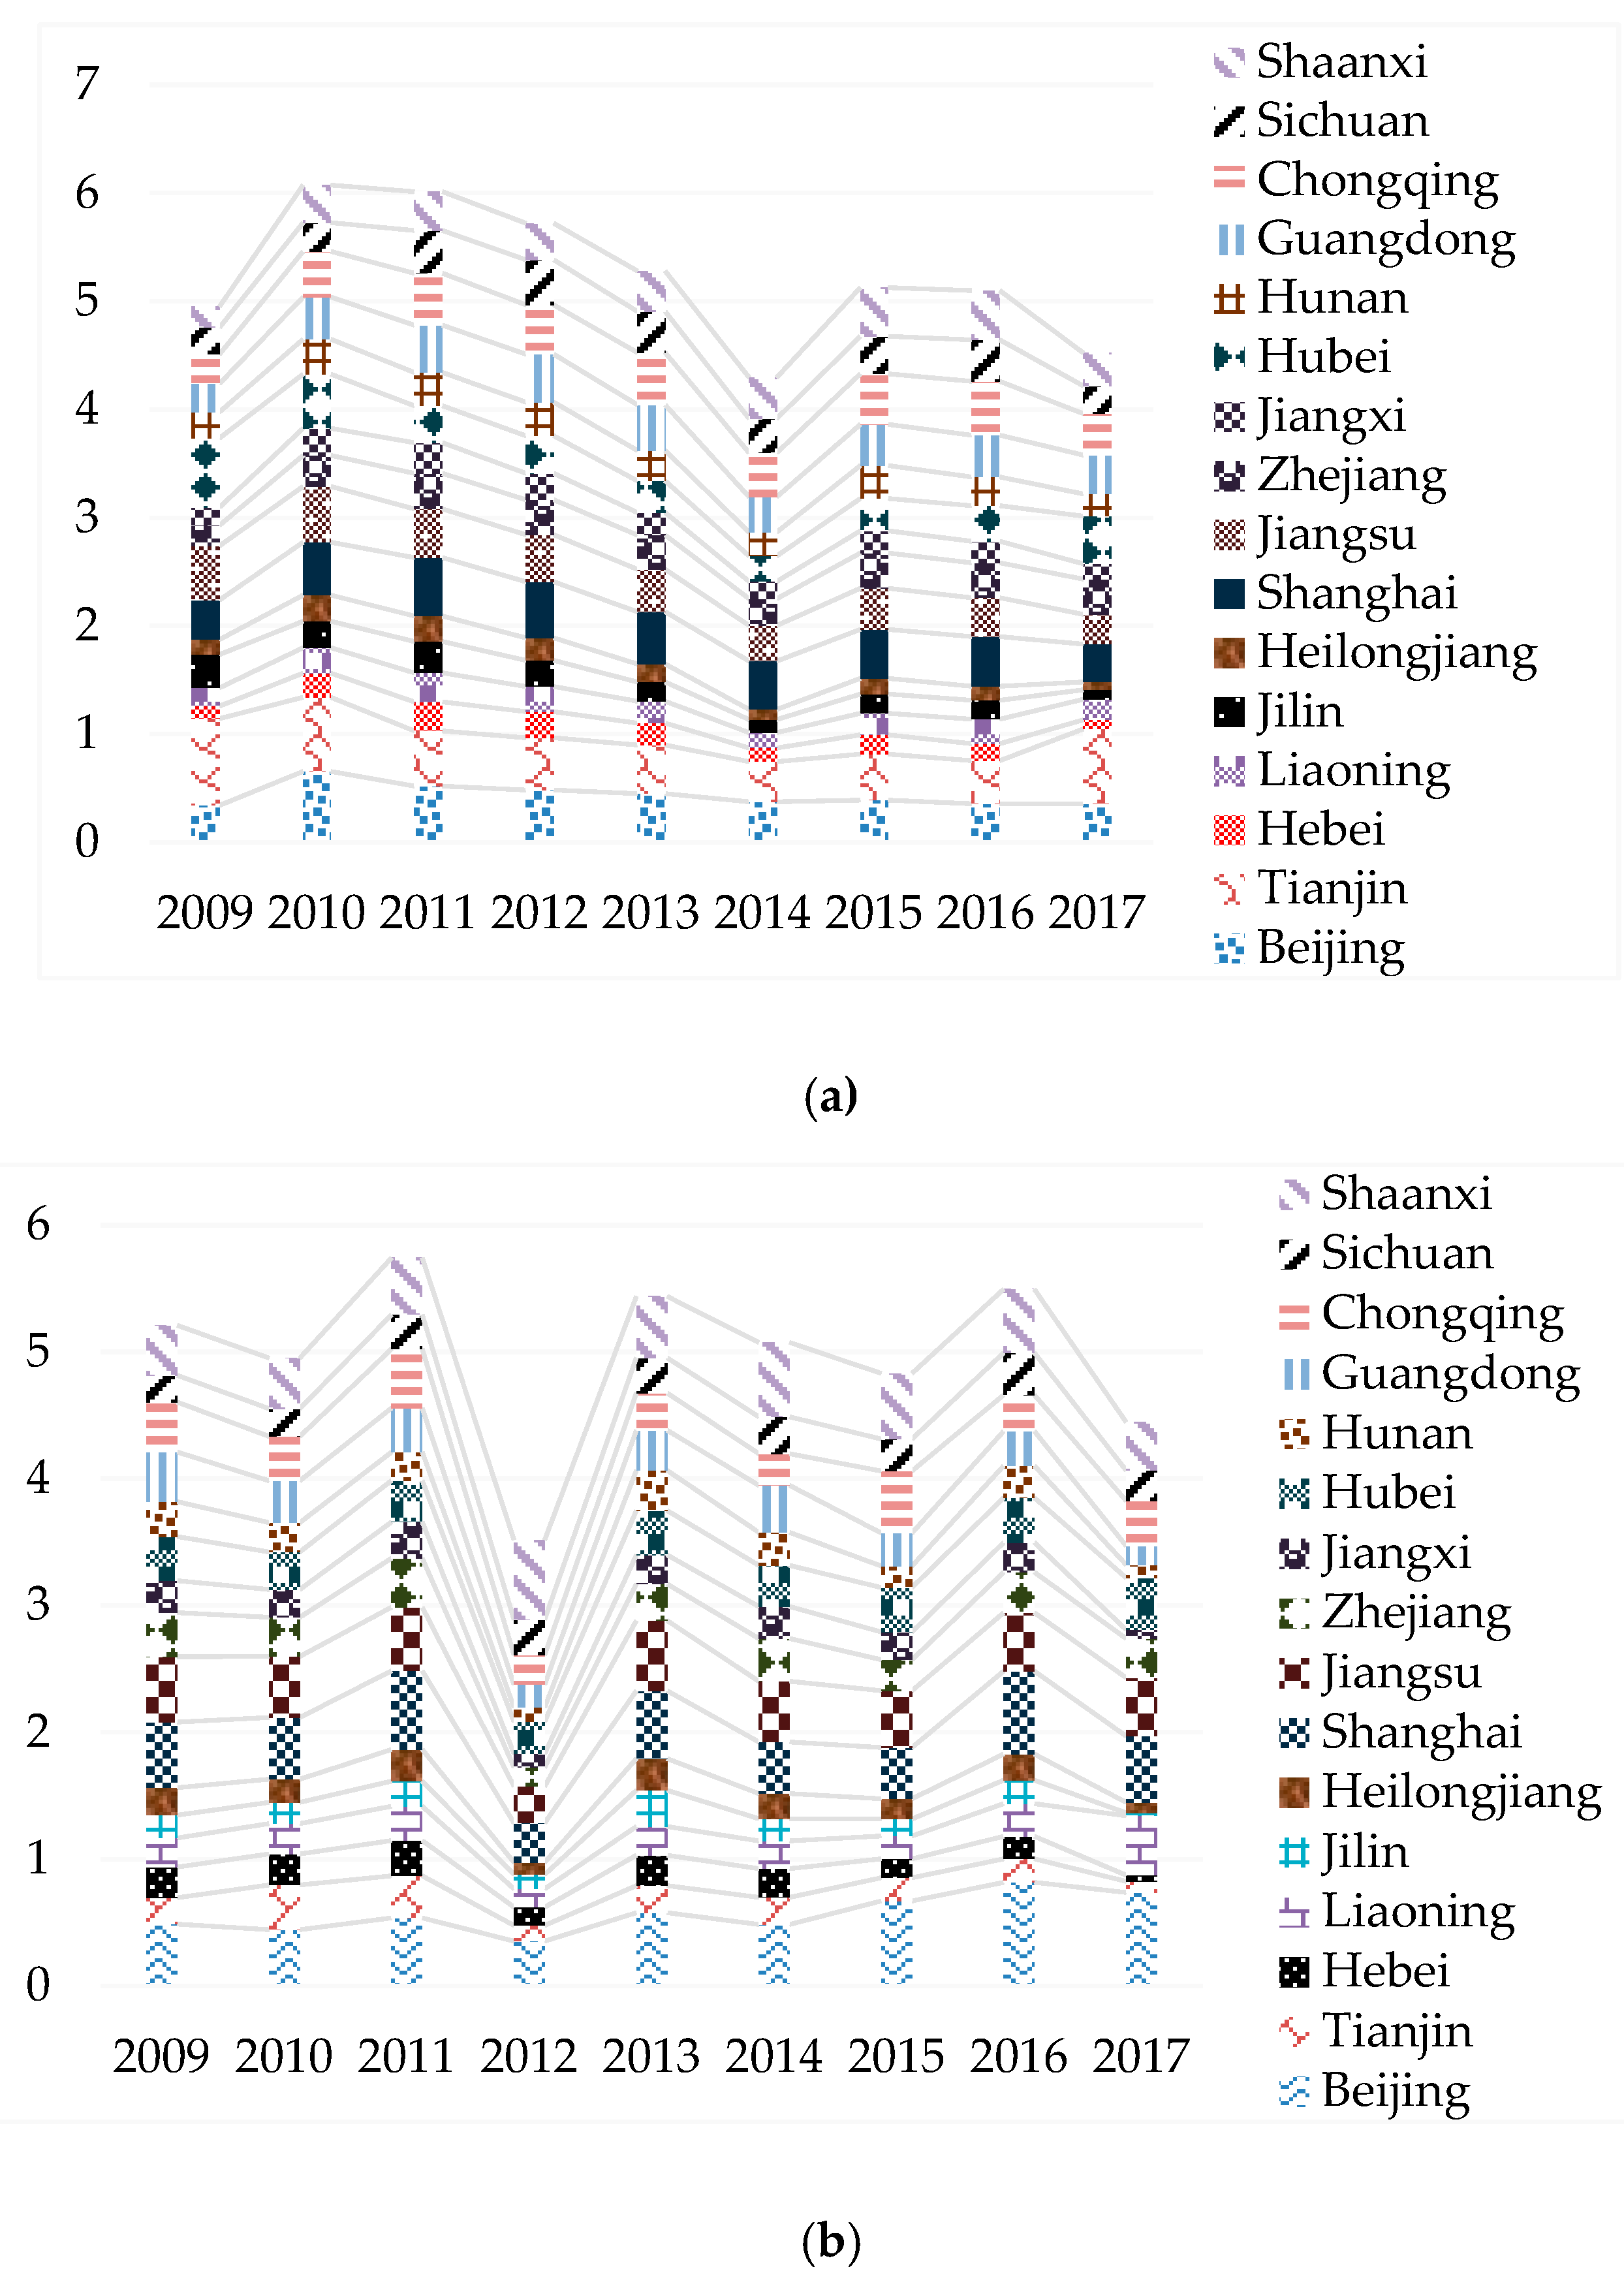
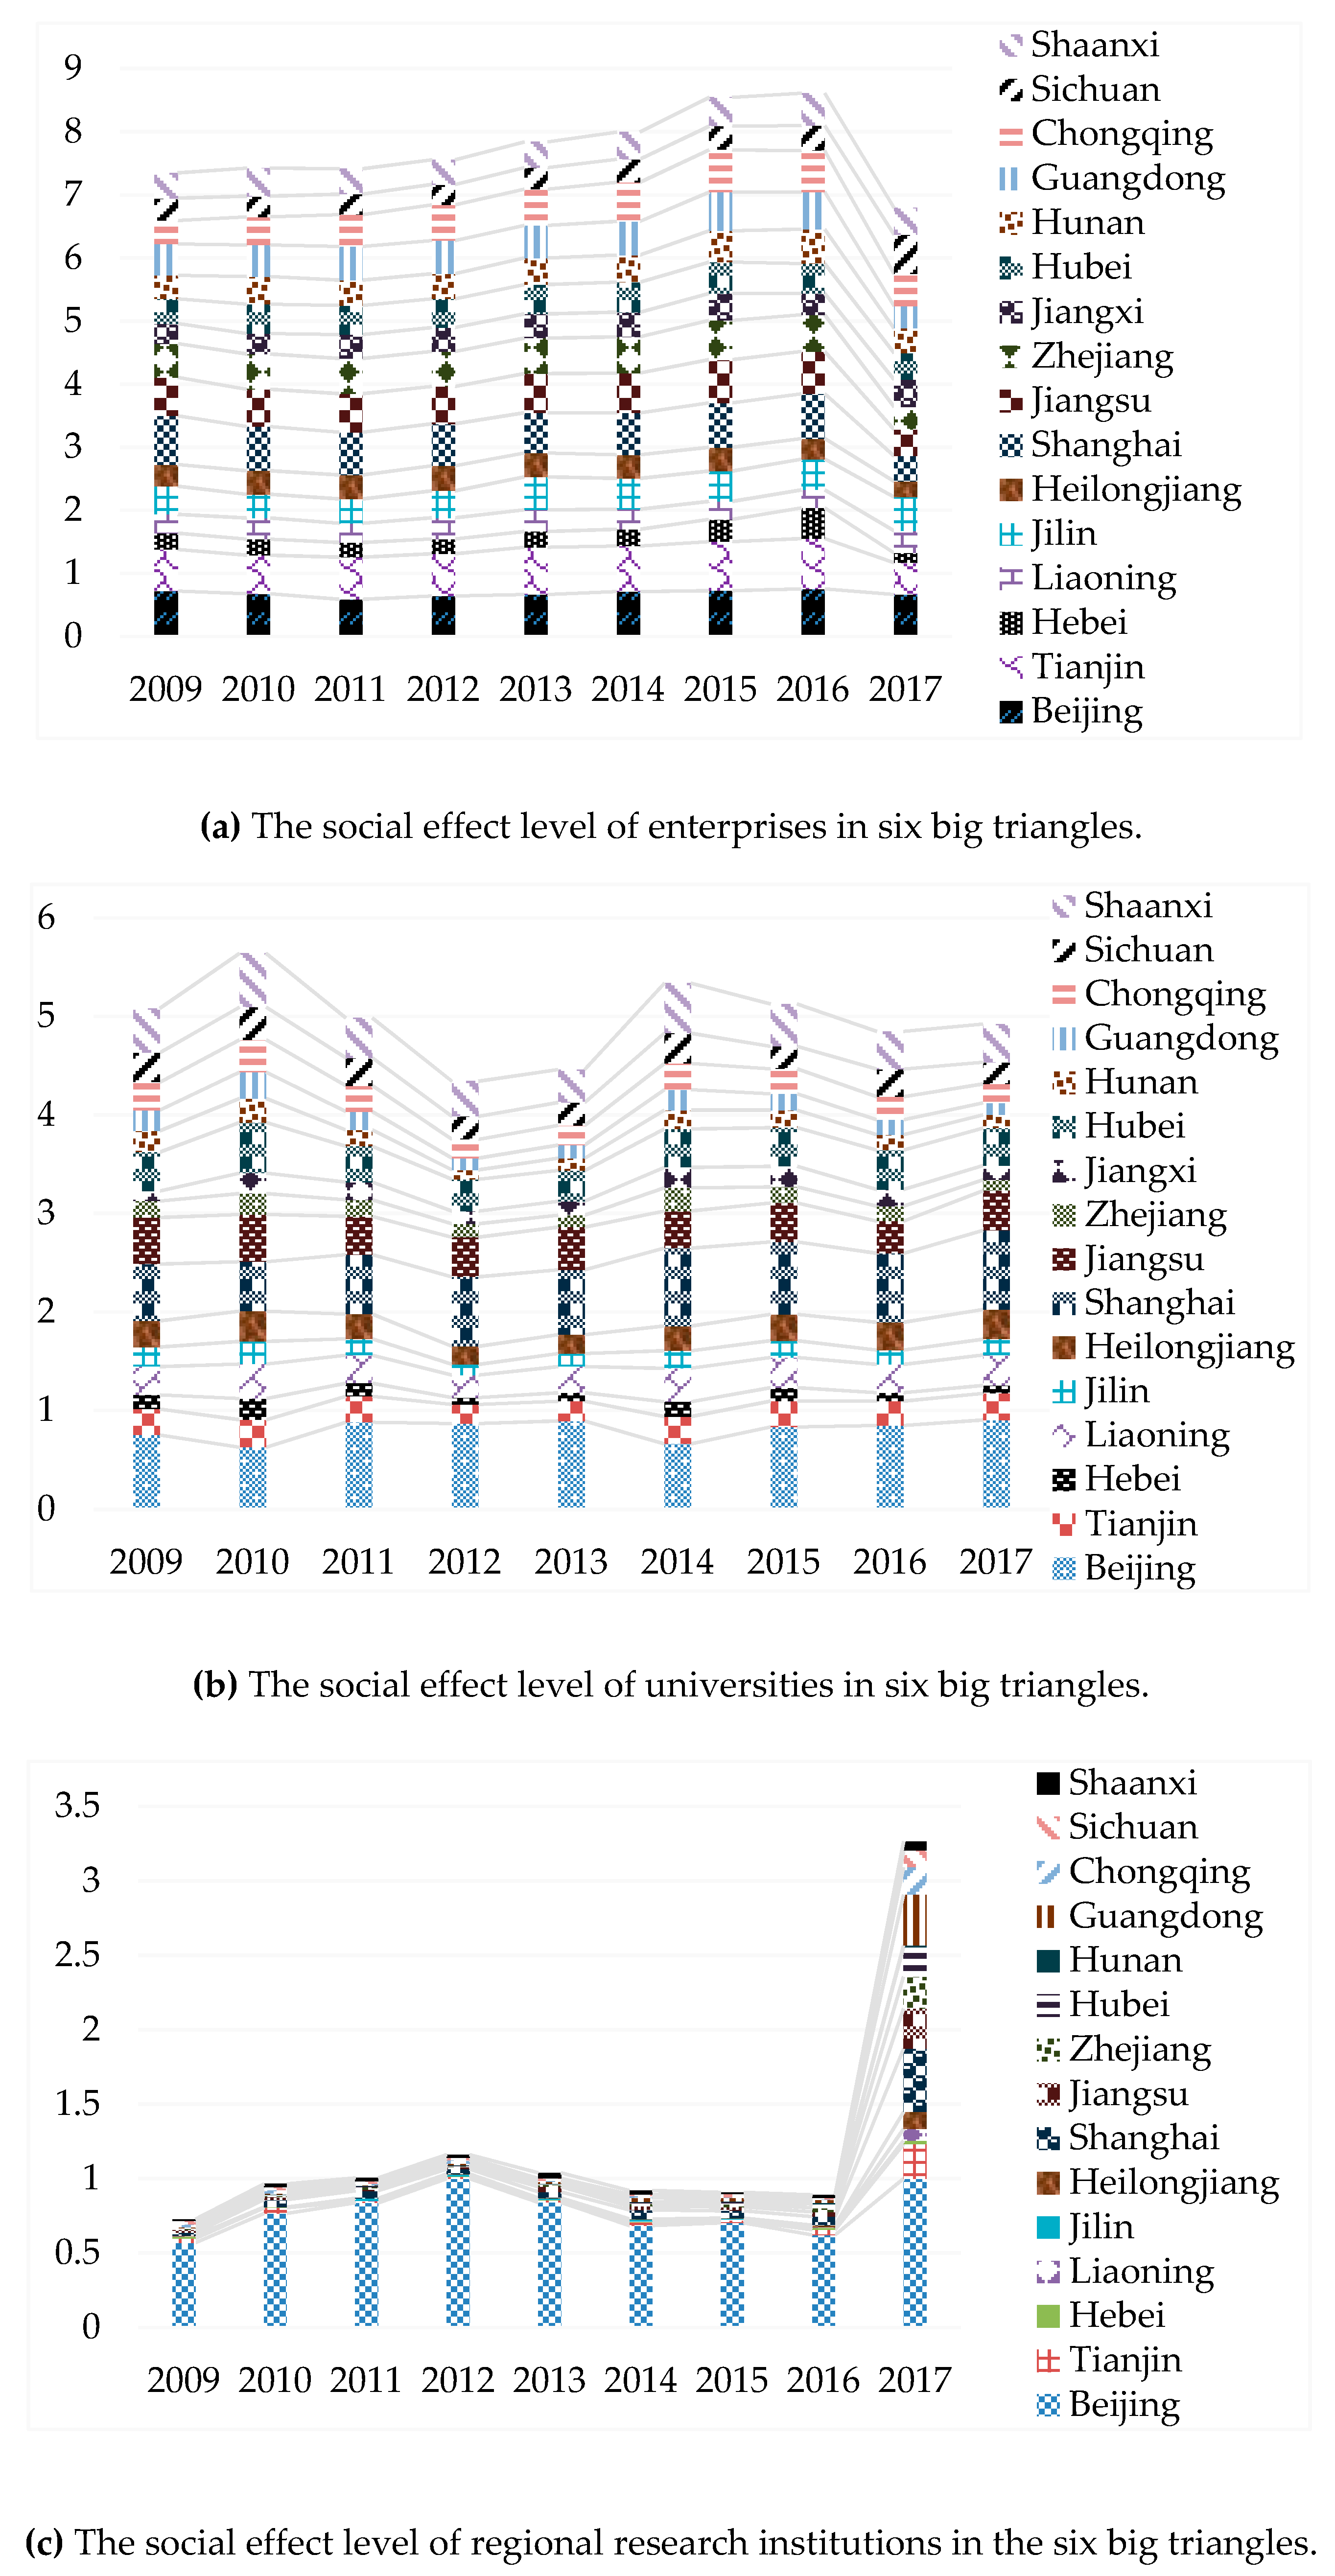
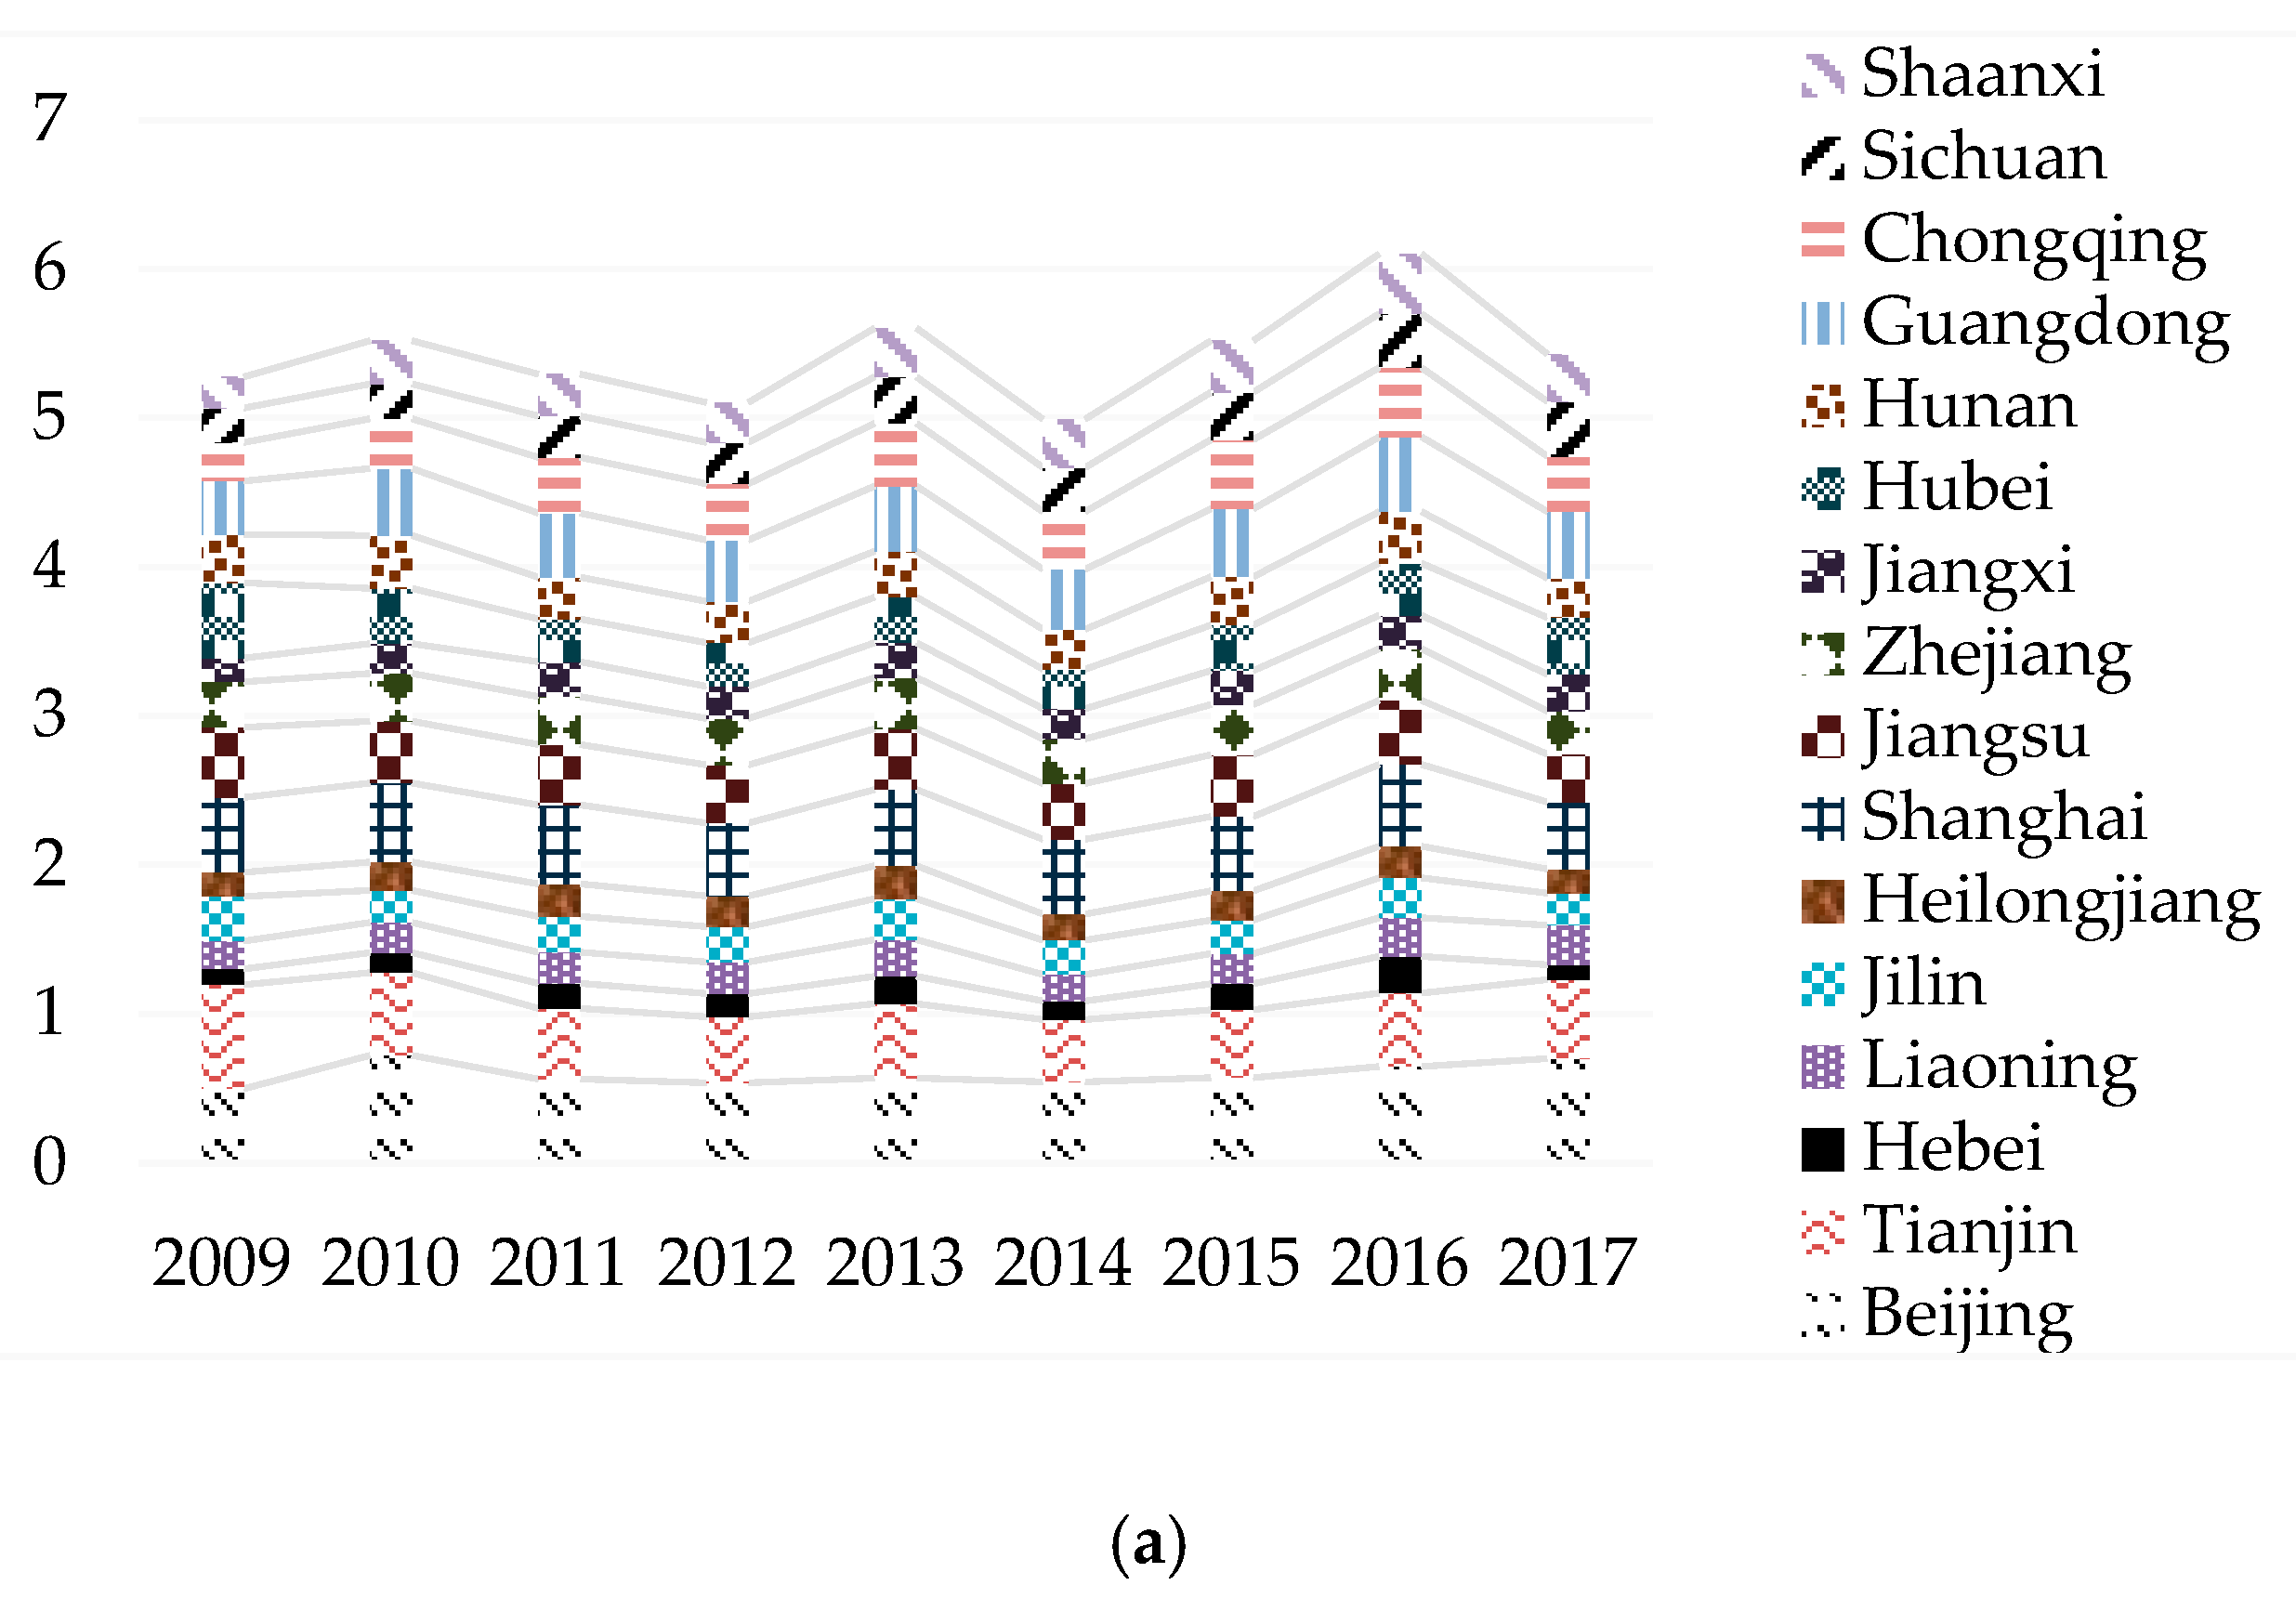
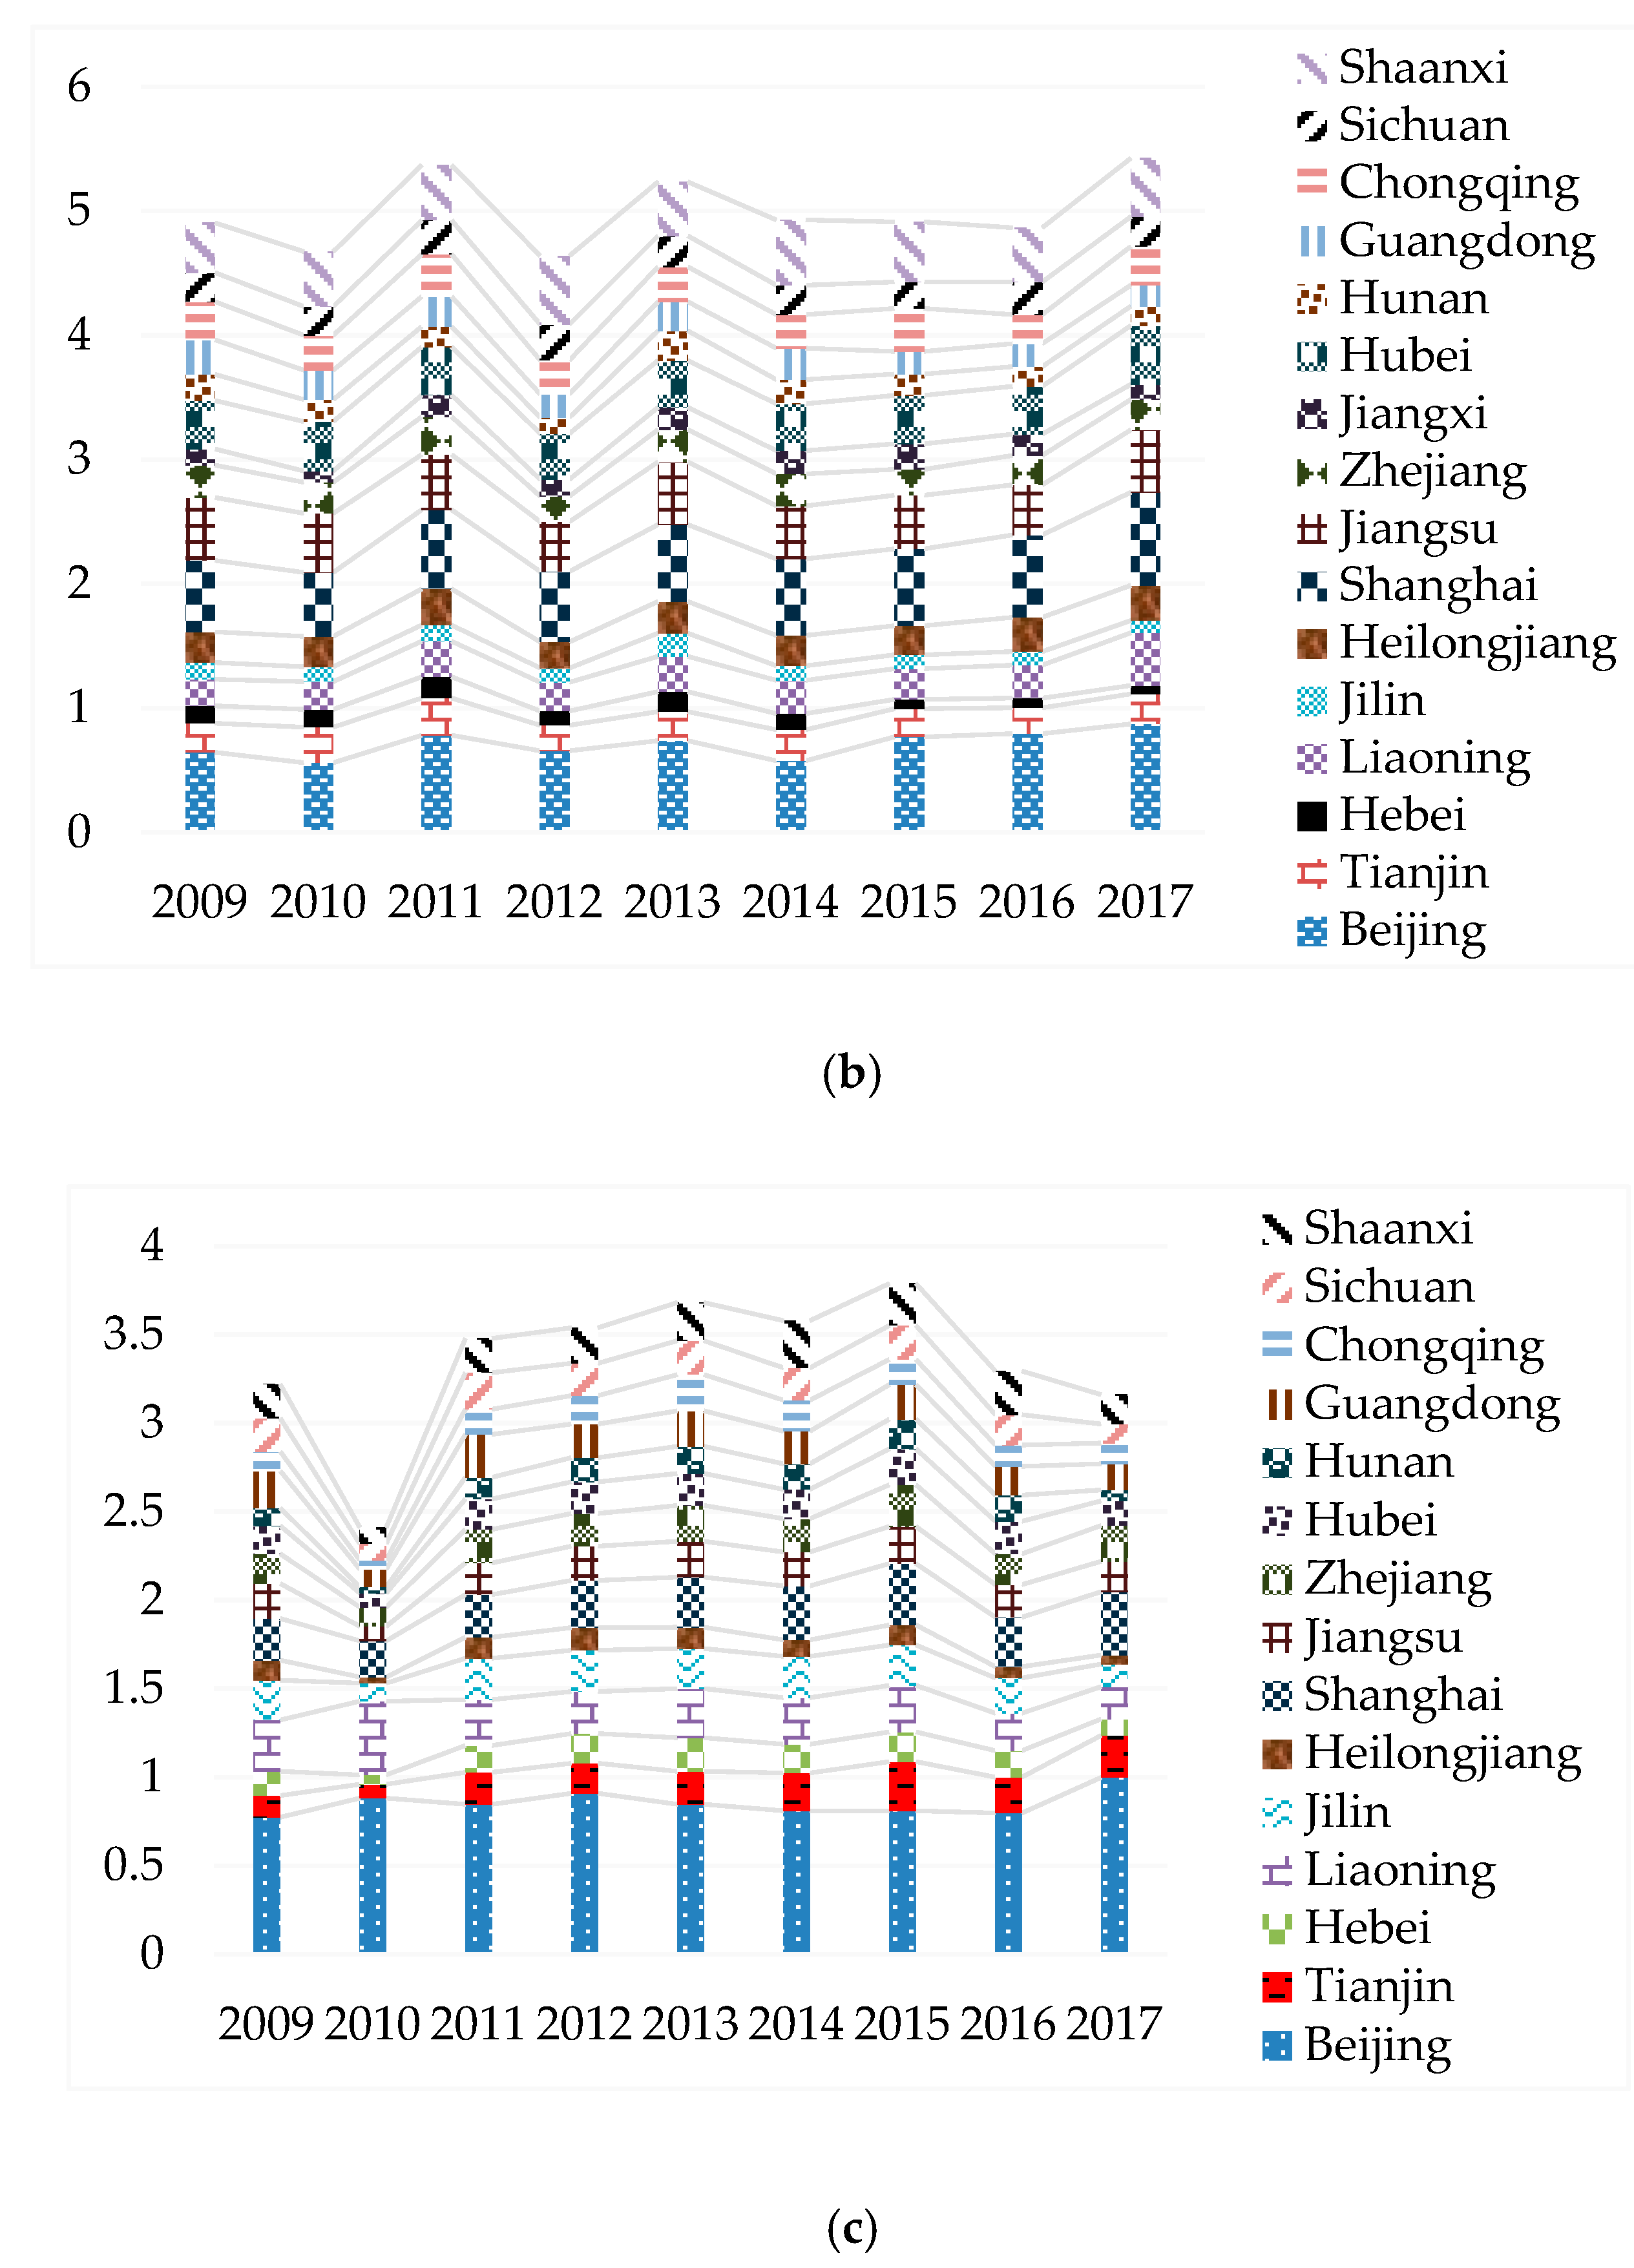
In this study, the combined evaluation method of drift degree based on entropy weight method, maximum deviation method, TOPSIS method and grey relational degree method was used to evaluate the innovation performance in Heilongjiang province as a whole and each innovation subject from 2009 to 2017. The evaluation results are shown in Appendix C. In order to compare and analyze the innovation performance in Heilongjiang province and each subject, this paper evaluates the science and technology output, economic output, social effect and innovation performance of the six major triangle regions and each innovation subject, and draws Figure 3, Figure 4, Figure 5, Figure 6 and Figure 7 for visual display.

4.2. Dynamic Evaluation of Regional Overall Innovation Performance

Figure 3 shows regional overall science and technology output, regional economic output and regional social effect.
As shown in Figure 3a, from a static perspective, Heilongjiang ranked 3 among 16 provinces in the six big triangles in 2017. The level of science and technology output was 0.4421, about 0.1 lower than that of Shanghai, and slightly higher than that of Shaanxi province, about four times that of Hebei province. Dynamically, from 2009 to 2017, Heilongjiang province first dropped and then rose in the ranking of 16 provinces in the six big triangles. The overall level of science and technology output showed an upward trend, reaching a peak of 0.4421 in 2017, higher than other regions except Beijing and Shanghai.
As shown in Figure 3b, from a static perspective, Heilongjiang province ranked 14th among 16 provinces in the six big triangles in 2017. The level of economic output was 0.1035, much lower than that of Beijing, Shanghai and Guangdong. Heilongjiang is about one-sixth the level of Beijing’s economic output, only slightly higher than Jiangxi and Hebei, and at the end of the range. Dynamically, from 2009 to 2017, Heilongjiang province showed a slow rise in the ranking of 16 provinces in the six big triangles. However, the trend is not obvious. Heilongjiang province hovered between 14th and 16th, and the overall level of economic output presented a slow downward trend with a relatively low decline rate.
As shown in Figure 3c, from a static perspective, Heilongjiang province ranked 15th among the 16 provinces in the six big triangles in 2017. The social effect level of Heilongjiang province is lower than that of other regions, about 1/4 of the economic effect level of Beijing, which is at the end of the social effect level. Dynamically, from 2009 to 2017, Heilongjiang province’s ranking among the 16 provinces in the six big triangles showed a declining trend, with a relatively large decline. The overall level of social effect increased first and then decreased, reaching a peak of 0.3403 in 2012. In 2017, the level of social effect decreased to 0.2039, with a relatively significant decline.
As shown in Figure 3d, from a static perspective, Heilongjiang ranked 12th among 16 provinces in the six big triangles in 2017. The innovation performance level was 0.2692, higher than that of Hebei, Jilin, Jiangxi and Hunan, and about 1/3 of that of Beijing, ranking in the middle and lower level. Dynamically, from 2009 to 2017, Heilongjiang province fluctuated between 12 and 15 in the ranking of 16 provinces in the big six triangles. The overall trend shows a slow fluctuation rising trend, but the trend is not obvious. The highest level of innovation performance in 2017 was 0.2692.

4.3. Dynamic Evaluation of Innovation Performance of Regional Innovation Subjects

4.3.1. Dynamic Evaluation of Science and Technology Output Level

Figure 4 shows science and technology output of each innovation subject.
As shown in Figure 4a, from a static point of view, in 2017, the science and technology output of enterprises in Heilongjiang province ranked 12th among the 16 provinces in the six big triangles. The level of science and technology output was 0.2800, higher than that of Hebei, Jilin, Zhejiang and Chongqing, and about 1/3 of that of Beijing. Dynamically, from 2009 to 2017, Heilongjiang province rose from 15th to 12th among the 16 provinces in the big six triangles, showing a slow development trend. The level of science and technology output showed a slow upward trend, and the upward trend was obvious compared with other provinces.
As shown in Figure 4b, from a static point of view, the subject of universities in Heilongjiang province ranked 6th among 16 provinces in the six big triangles in 2017. The science and technology output level of universities is 0.5440, which is higher than that of Tianjin, Hebei, Liaoning, Zhejiang, Jiangxi, Hunan, Guangdong, Chongqing and Sichuan, and about 3/4 of that of Beijing and Shanghai. Dynamically, from 2009 to 2017, Heilongjiang province showed a slight fluctuation in the ranking of 16 provinces in the big six triangles. The overall ranking showed a slow upward trend, while the level of science and technology output showed a rapid upward trend, which was not changed much compared with other regions.
As shown in Figure 4c, from a static point of view, the subject of research institutions in Heilongjiang province was ranked 15th among the 16 provinces in the six big triangles in 2017. The level of science and technology output of research institutions is 0.1069, about 1/10 of that of Beijing and at the end of the range. Dynamically, from 2009 to 2017, Heilongjiang province was ranked in the top 15 of 16 provinces in the big six triangles, that is, the bottom position. The overall level of science and technology output showed a downward trend, which was more obvious compared with other regions.

4.3.2. Dynamic Evaluation of Economic Output Level

Figure 5 shows economic output of each innovation subject.
As shown in Figure 5a, from a static point of view, Heilongjiang province ranked 16th among 16 provinces in the six big triangles in 2017. The economic output level is 0.0720, which is about 1/7 of the economic output level of Tianjin and at the end of the economic output level. Dynamically, from 2009 to 2017, Heilongjiang province ranked 16th among the 16 provinces in the six big triangles. The level of economic output showed a trend of fluctuation and decline, and the decline was more obvious than that in most zones.
As shown in Figure 5b, from a static point of view, the subject of universities in Heilongjiang province ranked 13th among 16 provinces in the six big triangles in 2017. The economic output level of universities is 0.0842, higher than that of Hebei, Jilin and Jiangxi, and about 1/7 of the economic output level of Beijing, which was at the end of the economic output level. Dynamically, from 2009 to 2017, Heilongjiang province ranked 12-16 among the 16 provinces in the six big triangles. The overall ranking showed a slow upward trend, but the trend was not obvious. The overall level of economic output showed a fluctuating trend. Compared with other regions, the degree of fluctuation is relatively large, with significant differences.
As shown in Figure 5c, from a static point of view, the subject of research institutions in Heilongjiang province was ranked 10th among the 16 provinces in the six big triangles in 2017. The economic output level of research institutions is 0.0264, which was about 1/20 of Beijing’s economic output level and at the end of the economic output level. Dynamically, from 2009 to 2017, Heilongjiang province showed a slow rise in the ranking of 16 provinces in the six big triangles. The overall level of economic output showed a slow upward trend. Compared with other regions, the upward trend was slow and less volatile.

4.3.3. Dynamic Evaluation of Social Effect Level

Figure 6 shows social effect of each innovation subject.
As shown in Figure 6a, from a static perspective, Heilongjiang province ranked 15th among the 16 provinces in the six big triangles in 2017. The level of social effect was 0.2501, which was only slightly higher than that of Hebei province, and about 1/3 of that of Beijing, which was at the end of the social effect level. Dynamically, from 2009 to 2017, Heilongjiang province showed a slow decline and fluctuation in the ranking of 16 provinces in the six big triangles. The overall social effect level presented a slow decline trend. Compared with other regions, the decline was larger.
As shown in Figure 6b, from a static point of view, the subject of universities in Heilongjiang province ranked 7th among 16 provinces in the six big triangles in 2017. The social effect level of the subject of universities was 0.3016, which was about 1/3 of the innovation performance level of Beijing, and was in the middle position of the social effect level. Dynamically, from 2009 to 2017, Heilongjiang province rose from 10th to 7th among the 16 provinces in the six big triangles. The level of social effect fluctuates. Compared with other regions, the degree of fluctuation was small and there was room for improvement.
As shown in Figure 6c, from a static point of view, the subject of research institutions in Heilongjiang province was ranked 9th among the 16 provinces in the six big triangles in 2017. The social effect level of research institutions was 0.1145, which was about 1/10 of the social effect level of Beijing, and was in the middle of the social effect level. Dynamically, from 2009 to 2017, Heilongjiang province rose from 15th to 9th among the 16 provinces in the six big triangles. The overall social effect level presented a slow rising trend. Compared with other regions, the upward trend was slow and the degree of fluctuation was slow.

4.3.4. Dynamic Evaluation of Innovation Performance Level of Each Subject

Figure 7 shows innovation performance of each innovation subject.
As shown in Figure 7a, from a static perspective, Heilongjiang province ranked 15th among 16 provinces in the six big triangles in 2017. The innovation performance level was 0.1612, which was only slightly higher than that of Hebei province and about 1/4 of that of Beijing, which was at the end of the innovation performance level. Dynamically, Heilongjiang province showed 15 or 16 fluctuations in the ranking of 16 provinces in the six big triangles from 2009 to 2017. The overall trend of innovation performance was fluctuating. The innovation performance level showed a trend of slow rise and then slow decline, and the highest innovation performance level in 2013 was 0.2230.
As shown in Figure 7b, from a static point of view, the subject of universities in Heilongjiang province ranked the 8th among 16 provinces in the six big triangles in 2017. The innovation performance level of universities was 0.2847, which was about 1/4 of that of Beijing. Dynamically, Heilongjiang province fluctuated in the rankings of 16 provinces in the six big triangles from 2009 to 2017. The overall ranking showed a slow upward trend, but the trend was not obvious. The innovation performance level showed a trend of rising first, then falling and then rising. The highest level of innovation performance in 2011 was 0.2896, which was similar to that of 2017.
As shown in Figure 7c, from a static point of view, the research institutions in Heilongjiang province ranked 15th among the 16 provinces in the six big triangles in 2017. The innovation performance level of the research institutions subject was 0.0511, about 1/10 of the innovation performance level of Beijing, and it was at the end of the innovation performance level. Dynamically, Heilongjiang province ranked 15th out of 16 provinces in the six big triangles from 2009 to 2017, which was the end position. The overall innovation performance level showed an upward trend and then a downward trend, and the highest innovation performance level in 2012 was 0.1290.

4.4. Key Factors Influencing Regional Innovation Performance

This study selected key factors of regional innovation performance in Heilongjiang province. On the basis of using objective data to evaluate the innovation performance of each innovation subject, this study used subjective data to select the key factors influencing the regional innovation performance and the innovation performance of each innovation subject.

4.4.1. Key Factors of Regional Overall Innovation Performance

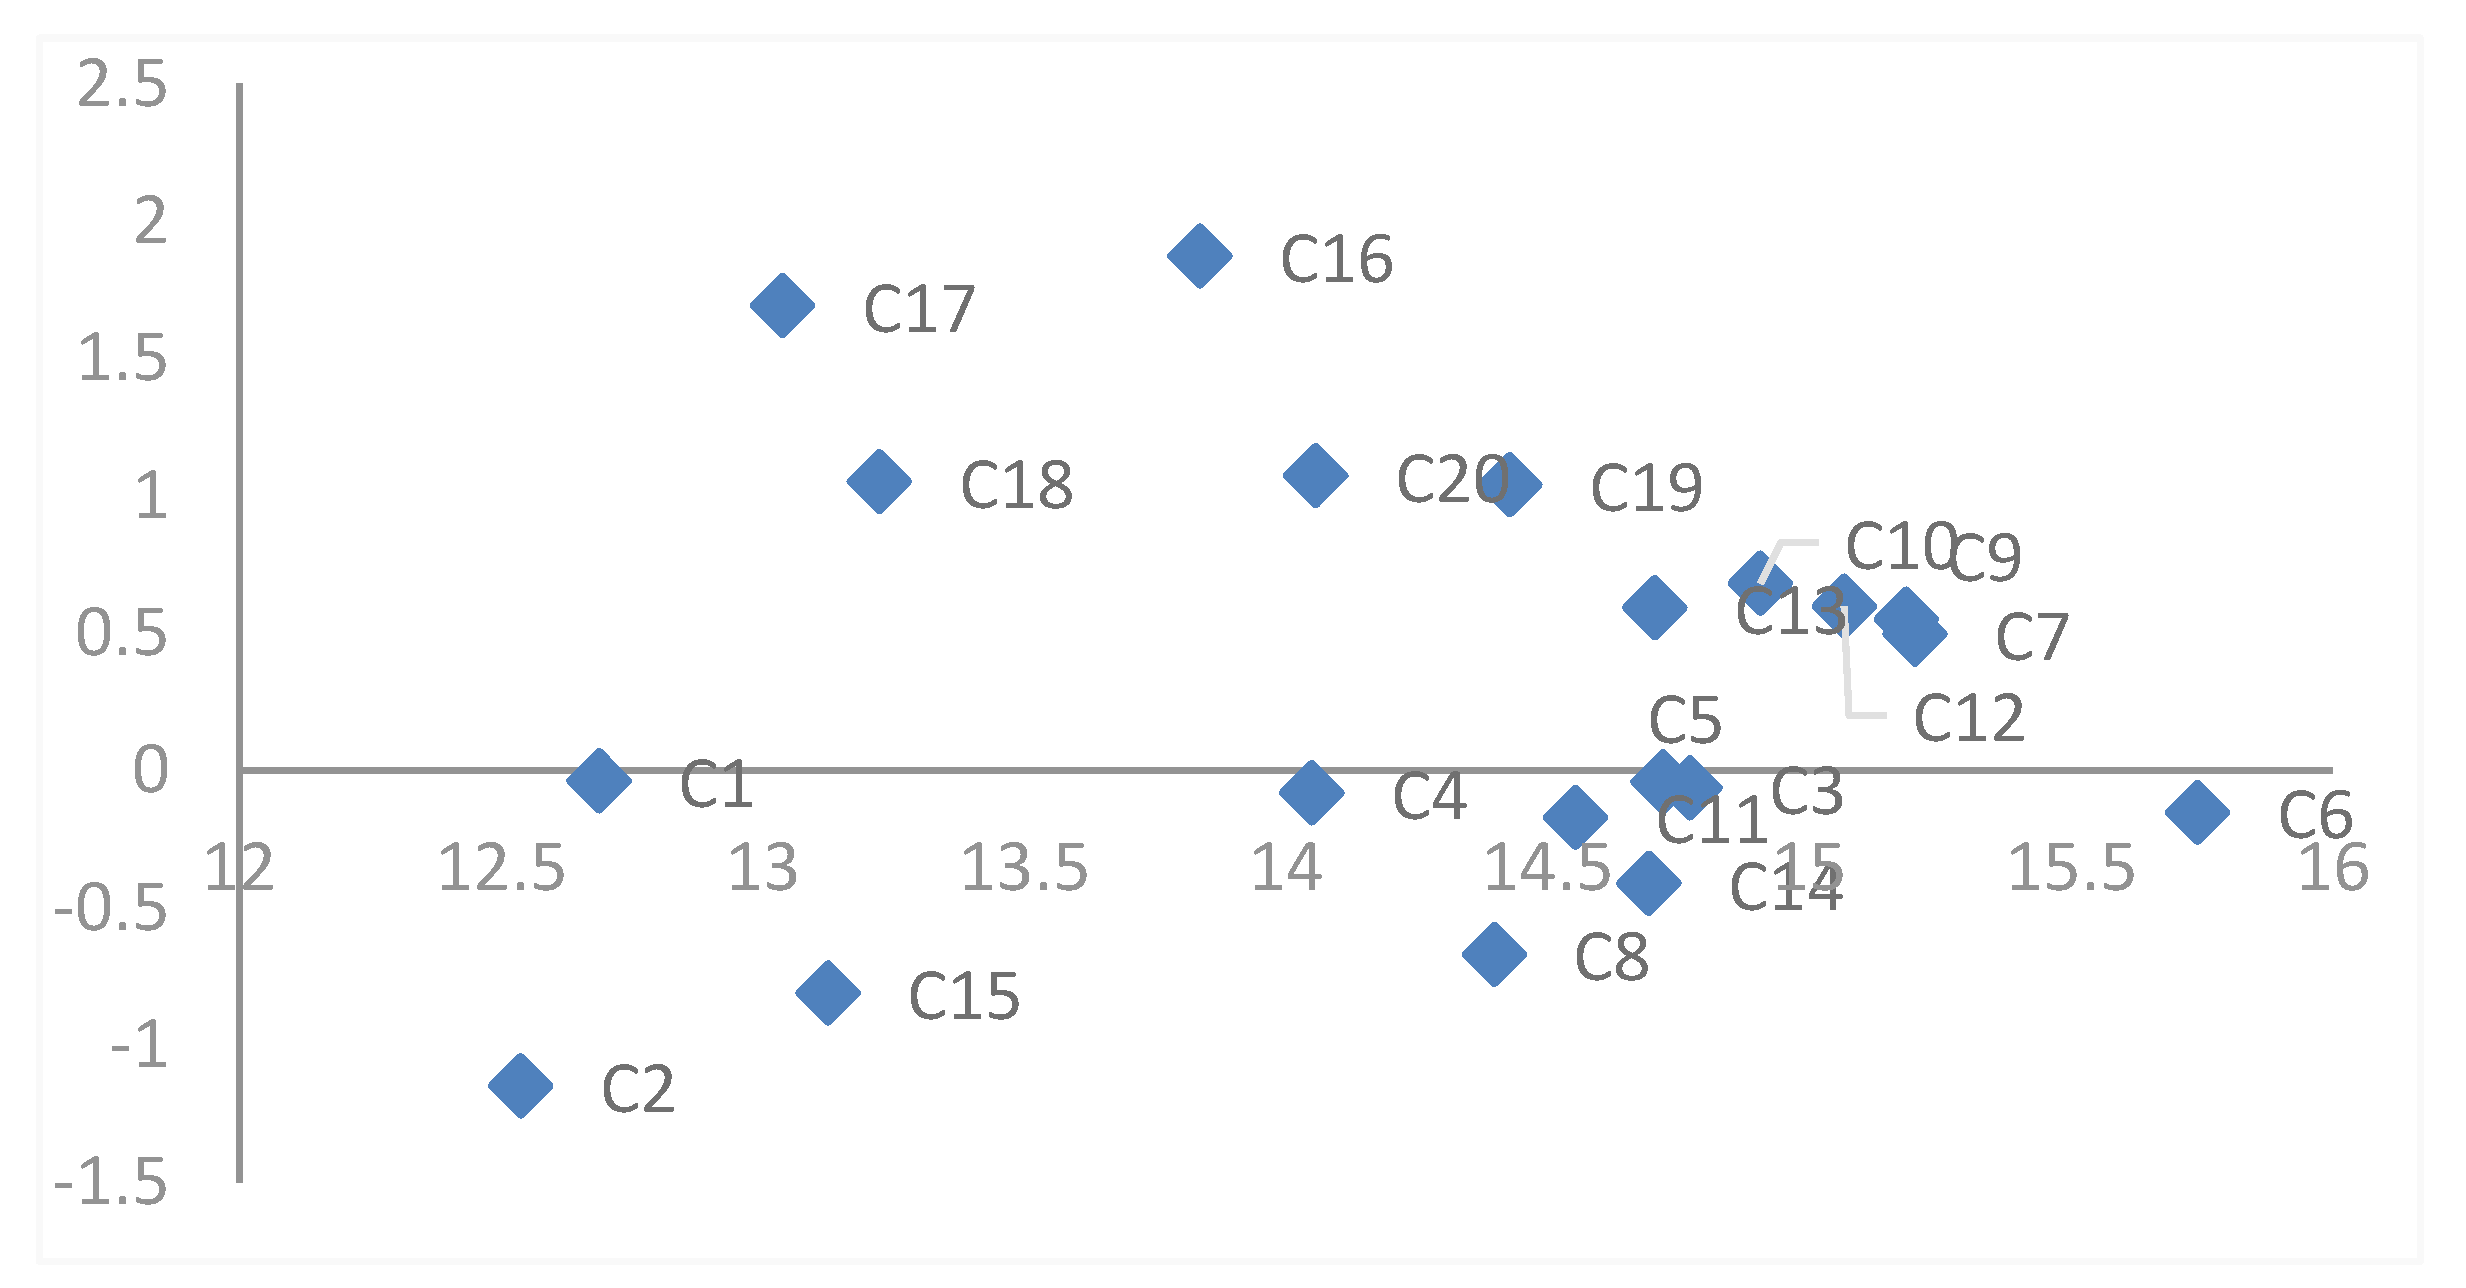
This study selects the existing regional innovation performance evaluation system and the factors outside the system. The comprehensive influence was calculated according to steps 1 to 7, as shown in Table 8. According to step 8, the cause-center distribution diagram was constructed, as shown in Figure 8.
Table 8 and Figure 8 show the key factors influencing regional overall innovation performance. The reason factor is the core factor that affects the regional innovation performance. The factor value represents the influence degree of other factors. The reasons are listed as follows: C16 > C17 > C20 > C18 > C19 > C10 > C12 > C13 > C9 > C7. The result factor is the direct factor that affects the regional innovation performance and is greatly influenced by other factors. The ranking of the results is C1 > C5 > C3 > C4 > C6 > C11 > C14 > C8 > C15 > C2. The degree of centrality represents the relationship between this factor and other factors. The larger the value, the greater the influence of this factor on the decision. The order of centrality is C6 > C7 > C9 > C12 > C10 > C3 > C5 > C13 > C14 > C11 > C19 > C8 > C20 > C4 > C16 > C18 > C15 > C17 > C1 > C2.

4.4.2. Key Factors of Enterprise Innovation Performance

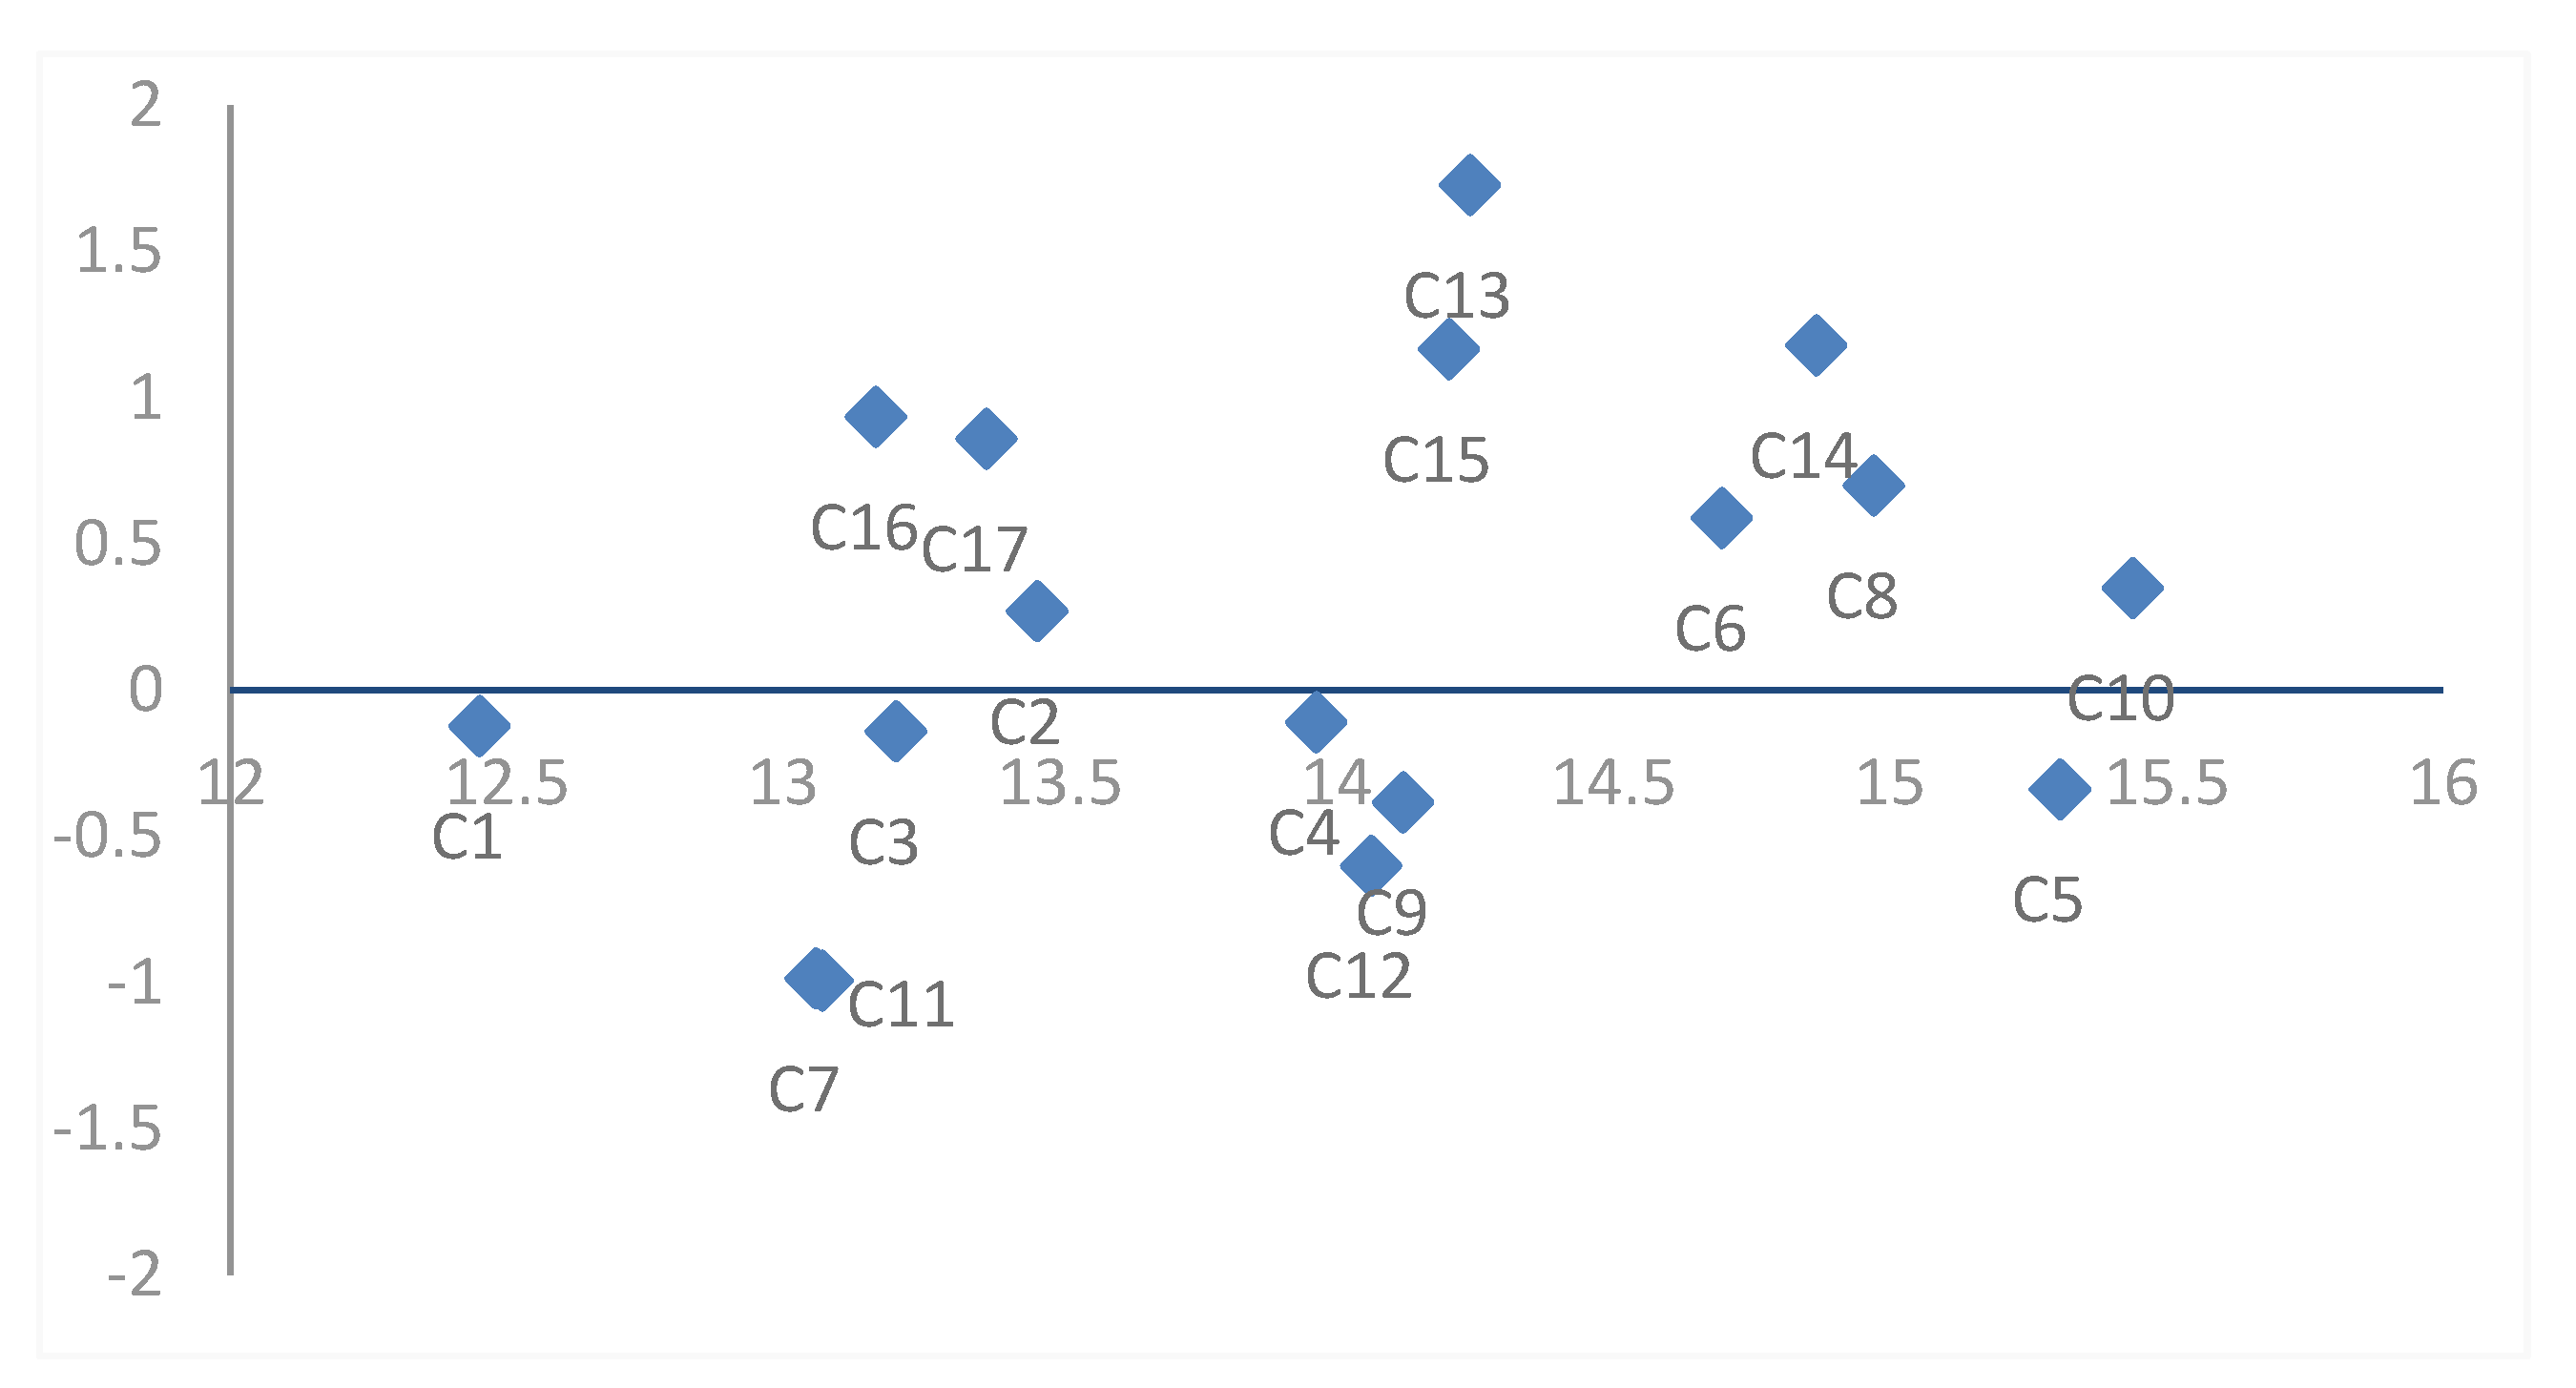
This study selects the existing regional enterprise innovation performance evaluation system and the factors outside the system. The comprehensive influence was calculated according to steps 1 to 7, as shown in Table 9. According to step 8, the cause-center distribution diagram was constructed, as shown in Figure 9.
Table 9 and Figure 9 show the key factors for enterprise innovation performance. The reason factor is the core factor that affects the innovation performance of regional enterprises, and the factor value represents the influence degree of other factors. The ranking of causes is C13 > C14 > C15 > C16 > C17 > C8 > C6 > C10 > C2. The result factor is the direct factor that affects the innovation performance of the subject of the regional enterprises. The ranking of the results is C4 > C1 > C3 > C5 > C9 > C12 > C7 > C11. The degree of centrality represents the relationship between this factor and other factors. The larger the value, the greater the influence of this factor on the decision. The order of degree of centrality is C10 > C5 > C8 > C14 > C6 > C13 > C15 > C9 > C12 > C4 > C2 > C17 > C3 > C16 > C11 > C7 > C1.

4.4.3. Key Factors of University Innovation Performance

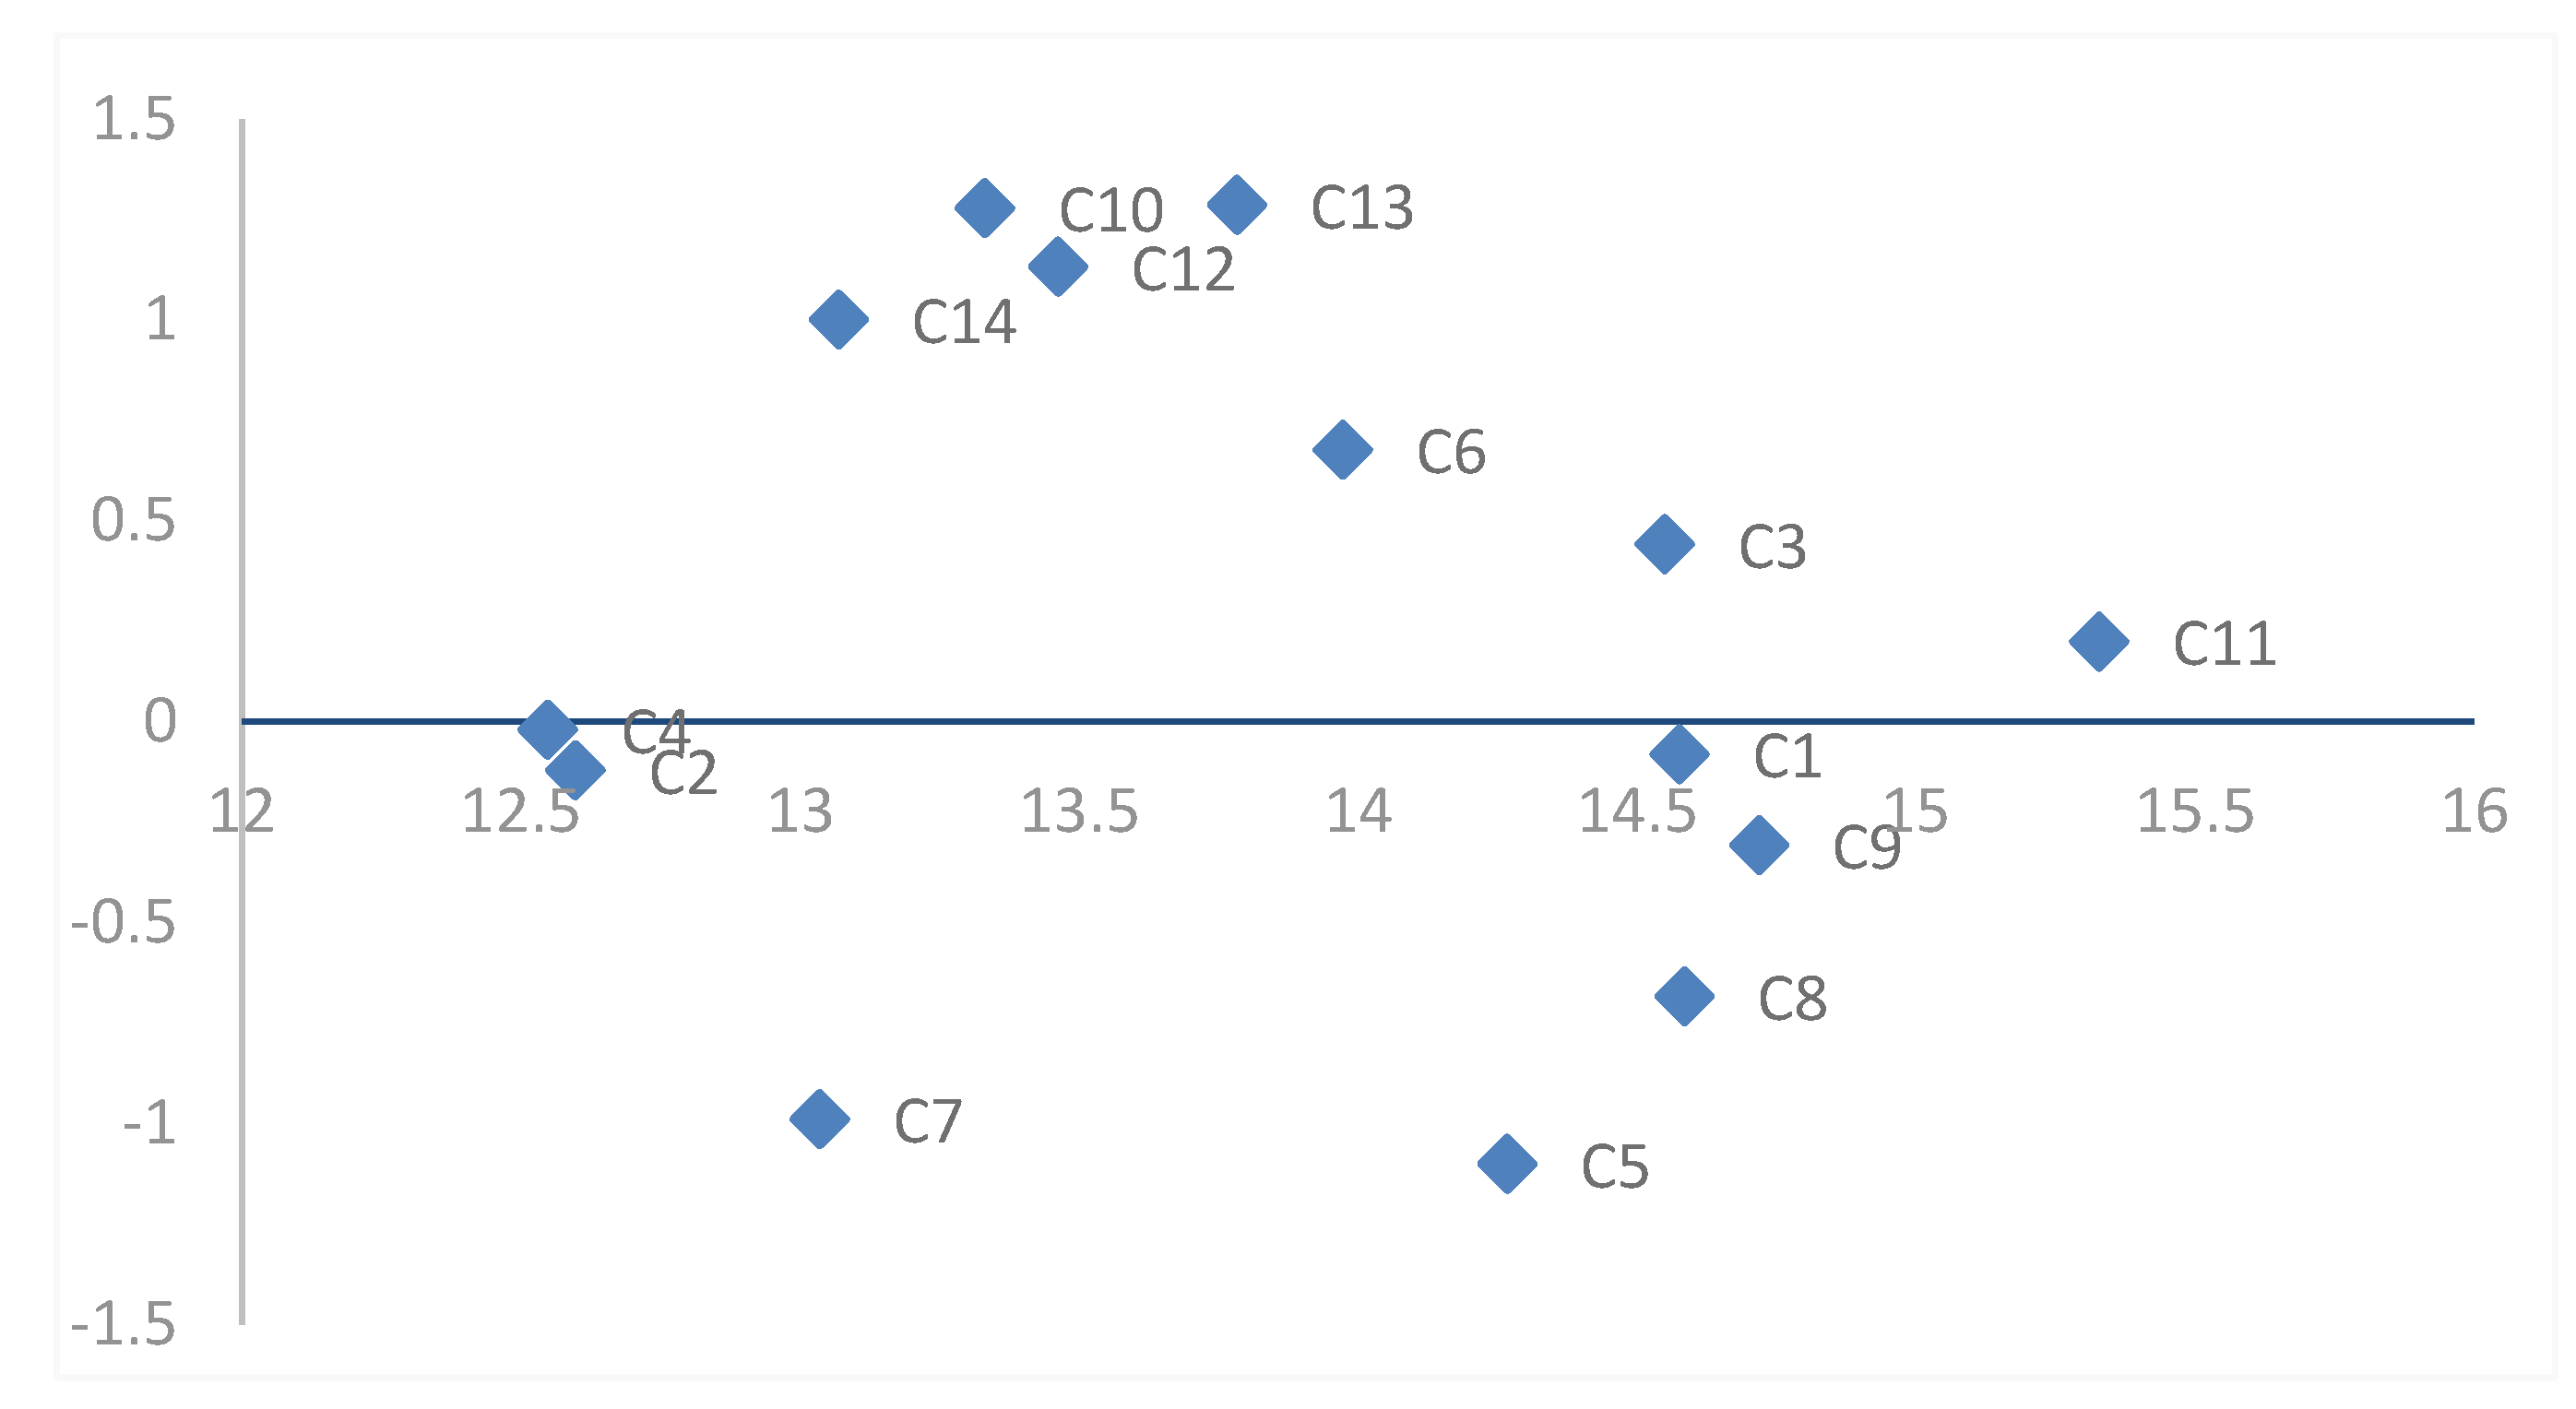
This study selects the existing regional universities innovation performance evaluation system and the factors outside the system. The comprehensive influence was calculated according to steps 1 to 7, as shown in Table 10. According to step 8, the distribution diagram of cause-center degree was constructed, as shown in Figure 10.
Table 10 and Figure 10 show the key factors for the universities’ innovation performance. The reason factor is the core factor that affects the innovation performance of regional universities. The factor value represents the influence degree of other factors. The ranking of causes is C13 > C10 > C12 > C14 > C6 > C3 > C11. The result factor is the direct factor that affects the innovation performance of the subject in regional universities, and is greatly influenced by other factors. The ranking of the results is C4 > C1 > C2 > C9 > C8 > C7 > C5. The degree of centrality represents the relationship between this factor and other factors. The larger the value, the greater the influence of this factor on the decision. The order of centrality is C11 > C9 > C8 > C1 > C3 > C5 > C6 > C13 > C12 > C10 > C14 > C7 > C2 > C4.

4.4.4. Key Factors of Research Institutions’ Innovation Performance

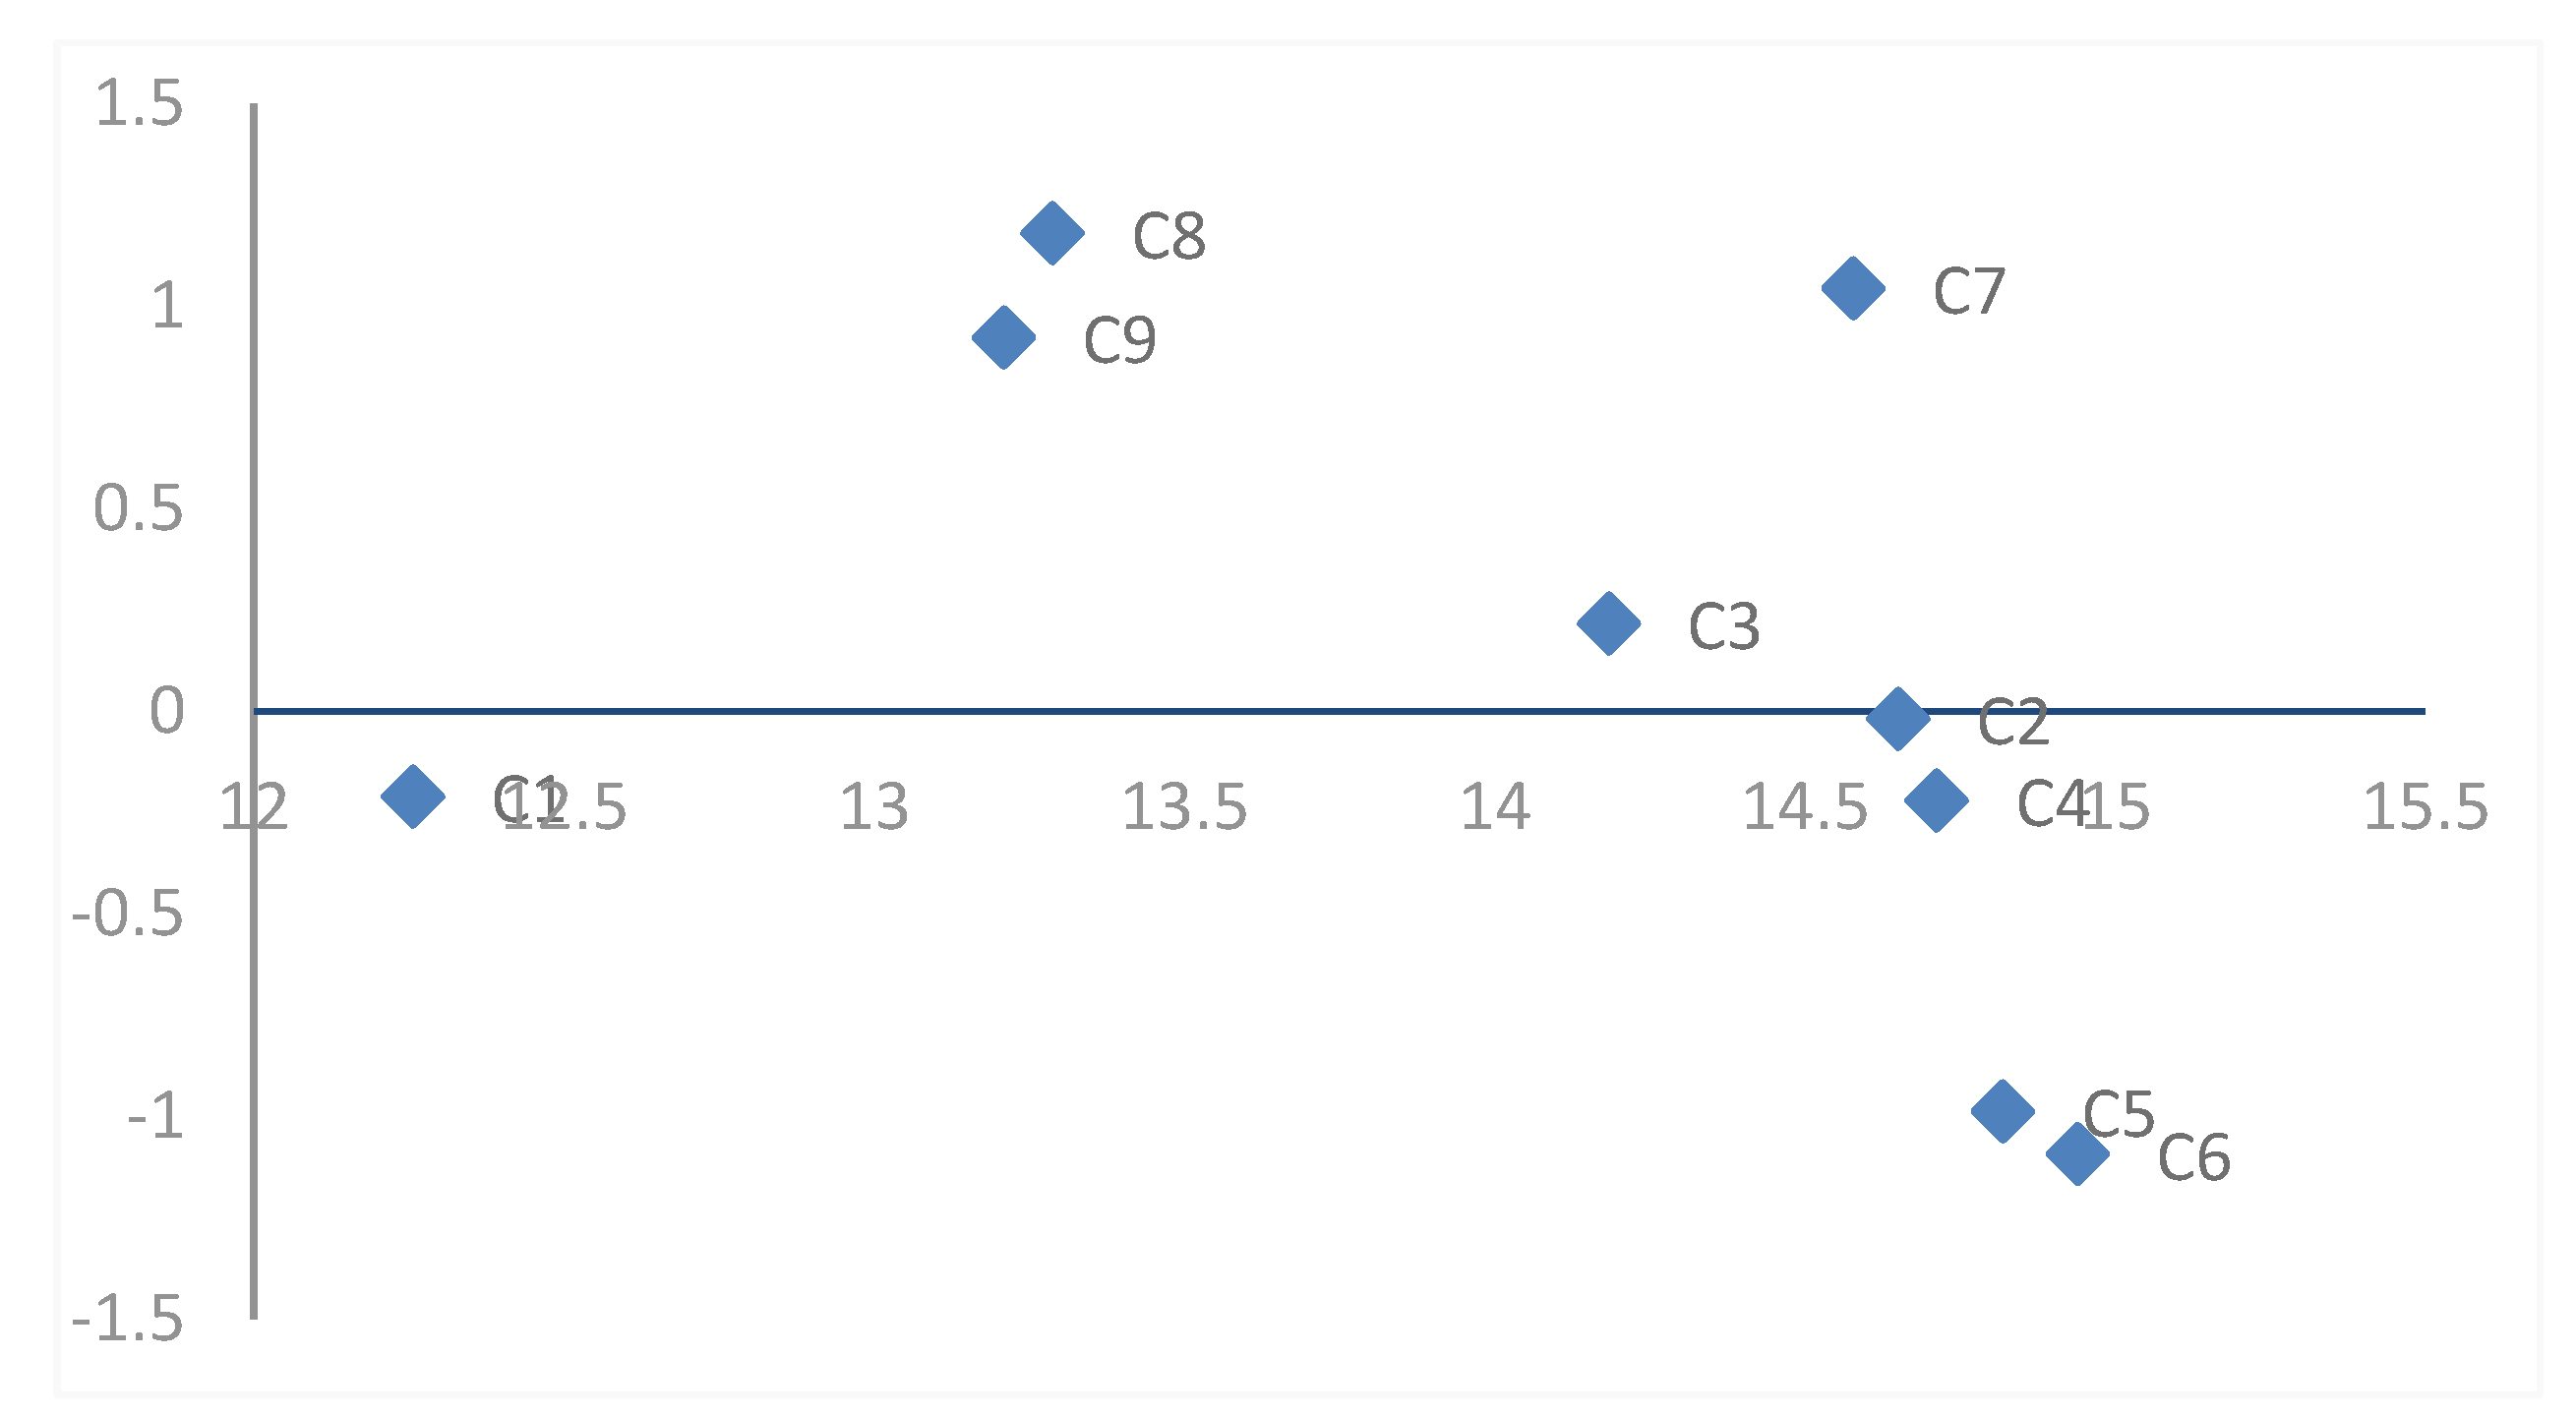
This study selects the existing regional research institutions’ innovation performance evaluation system and the factors outside the system. According to steps 1 to 7, the comprehensive influence was calculated, as shown in Table 11. According to step 8, the cause-center distribution diagram was constructed, as shown in Figure 11.
Table 11 and Figure 11 show the key factors for the research institutions’ innovation performance. The reason factor is the core factor that affects the subject innovation performance of regional research institutions. The factor value represents the influence degree of other factors. The reasons are ranked C8 > C7 > C9 > C3. The result factor is the direct factor that affects the innovation performance of the subject of the regional research institutions. The ranking of the results is C2 > C1 > C4 > C5 > C6. The degree of centrality represents the relationship between this factor and other factors. The larger the value, the greater the influence of this factor on the decision. The order of center degree is C6 > C5 > C4 > C2 > C7 > C3 > C8 > C9 > C1.

5. Discussion

5.1. Comparative Analysis of Regional Overall Innovation Performance

The science and technology output level in northeast China is relatively high, showing a weak trend and a rising trend in the ranking. Heilongjiang province is in the leading position in northeast China, and its science and technology output level and ranking were on the rise. Compared with other regions, Heilongjiang’s science and technology output was in the forefront. Both the level of science and technology output and the ranking were on the rise, higher than other regions except Beijing and Shanghai. The economic output in northeast China is relatively low, showing a steady decline and ranking at the bottom. Heilongjiang province ranks ranked the 3rd in northeast China, and its economic output level and ranking were in steady decline. Compared with other regions, Heilongjiang’s level of economic output was at the bottom, only slightly higher than that of Jiangxi and Hebei. The level of economic output was slowly declining and the ranking was slowly rising, but the trend was not obvious. The social effect in northeast China is relatively low, showing a steady decline and ranking at the bottom. Heilongjiang province ranked the 3rd in northeast China, and the whole province was at the bottom of the ranking. The level of social effect first rose and then declined. Compared with other regions, the social effect level of Heilongjiang province was in the terminal position, and the overall social effect level showed a trend of first rising and then declining, with a relatively obvious decline.
In general, the innovation performance level of northeast China was 0.2710, slightly higher than that of the Middle Triangle region (0.2589) and lower than that of other regions, showing a trend of slow growth. Heilongjiang province ranked second in northeast China, and its innovation performance level and ranking were rising steadily. Compared with other regions, the innovation performance level of Heilongjiang province was in the middle and lower level, only slightly higher than that of Hebei, Jilin, Jiangxi and Hunan. The overall trend showed a slow fluctuation rising trend, but the trend was not obvious, and the ranking was in a fluctuation trend.

5.2. Comparative Analysis of Innovation Performance of Regional Innovation Subjects

5.2.1. Comparative Analysis of Science and Technology Output of Each Innovation Subject

The science and technology output level of enterprises in northeast China was lower than that of other regions, showing a slow rising trend and a slow development trend. The science and technology output level of the subject of enterprises was in the middle of the overall level, and the overall science and technology output level presented a slow rising trend. Compared with other regions, the level of science and technology output of Heilongjiang province was at the middle and end of the level of science and technology output.
The science and technology output level of universities in northeast China was certain advantages. Compared with other regions, the upward trend was more obvious. Heilongjiang province ranked first in northeast China, and its overall level was in an advantageous position. The overall level of science and technology output showed a rapid rising trend. Compared with other regions, it had obvious advantages in science and technology output. Compared with other regions, it was in an advantageous position at the level of science and technology output. The overall ranking showed a slow upward trend, and the level of science and technology output showed a rapid upward trend.
The science and technology output level of research institutions in northeast China was relatively low, slightly higher than that in the Pearl River Delta region, but lower than that in other regions. The overall trend showed a slow downward trend of fluctuation. Compared with other regions, the downward trend was obvious. Heilongjiang province ranked the third among the northeast regions, and the overall level of science and technology output showed a declining trend. Compared with other regions, the downward trend was obvious. Compared with other regions, the subject of research institutions in Heilongjiang province was at the end of the science and technology output level. The overall level of science and technology output showed a downward trend, which was more obvious compared with other regions.

5.2.2. Comparative Analysis of Economic Output of Each Innovation Subject

The economic output level of enterprises in northeast China was relatively low, far lower than that of other regions. Compared with other regions, the change range was larger, showing a slow downward trend. The economic output level of enterprises in Heilongjiang province was at the end position, and the ranking was basically at the end position. The overall trend showed a downward fluctuation, and the decline was more obvious. Compared with other regions, the level of economic output showed a downward trend of fluctuation. Contrary to the change in most zones, the decline was more obvious.
The economic output level of universities in northeast China was slightly higher than that of the Pearl River Delta, and lower than that of the Beijing-Tianjin-Hebei region, the Yangtze River Delta, the Western Triangle and the Middle Triangle. The economic output level of universities in Heilongjiang province was at the middle and lower level, and the overall economic output level showed a fluctuating trend. Compared with other regions, the fluctuation was more obvious and had certain development potential. Compared with other regions, the main economy of universities was in the terminal position, showing 12-16 fluctuations. The overall ranking showed a slow upward trend, but the trend was not obvious. Compared with other regions, there were significant differences. The degree of fluctuation was relatively large.
The economic output level of research institutions in northeast China was 0.0781, which was higher than that of the Middle Triangle, the Pearl River Delta and the Western Triangle. Compared with other regions, the fluctuation range was small. The overall level of Heilongjiang province was in the terminal position, and the overall level of economic output presented a slow rising trend. However, compared with other regions, the upward trend was not obvious. Compared with other regions, the subject of research institutions in Heilongjiang province was at the end of the economic output level, showing a slow rise in the ranking. The overall level showed a slow upward trend. Compared with other regions, the degree of volatility was small and the upward trend was slow.

5.2.3. Comparative Analysis of Social Effect of Each Innovation Subject

The social effect level of the subject of enterprises in northeast China was lower than that in other regions, showing a fluctuation trend of 0.20-0.25, and the development trend was slow. The social effect level of the subject of enterprises was in the terminal position, and the overall social effect level presented a slow decline trend. Compared with other regions, the downward trend was more obvious and the decline range was larger. The ranking of Heilongjiang province showed a slow decline and fluctuation, and the overall social effect level showed a slow decline. Compared with other regions, the decline was larger.
The social effect level of universities in northeast China was 0.1662, lower than that in the Middle Triangle, the Pearl River Delta, the Beijing-Tianjin-Hebei region, the Yangtze River Delta and the Western Triangle, showing a slow decline. Compared with other regions, the level of social effect was decreasing significantly. The overall level of Heilongjiang province was in a medium dominant position, and the overall level of social effect showed a fluctuating trend. Compared with other regions, the fluctuation range was larger. Heilongjiang province was in the middle position of social effect level, rising from 10th to 7th in the ranking, and the level of social effect showed a fluctuating trend. Compared with other regions, the degree of volatility is small.
The social effect level of research institutions in northeast China was relatively low. The overall level of social effect showed a slow fluctuation trend. Compared with other regions, the fluctuation trend was not obvious, and had increased significantly in the past three years. Heilongjiang province’s overall level was in an advantageous position, ranking from the third to the first place. The overall social effect level presented a slow rising trend. Compared with other regions, the upward trend was obvious. The social effect level of research institutions in Heilongjiang province was in the middle position, rising from 15th to 9th in the ranking. The overall social effect level presented a slow rising trend. The upward trend had been slow compared with other regions.

5.2.4. Comparative Analysis of Innovation Performance of Each Innovation Subject

The innovation performance level of enterprises in northeast China was lower than that in other regions, with a fluctuation trend of 0.20–0.25 and a slow development trend. The innovation performance level of enterprises was at the end position, and the ranking was basically at the end position. The overall level showed a slow rise and then a downward trend, basically changing between 0.15 and 0.23. Compared with other regions, the innovation performance level of Heilongjiang province was at the end position, only slightly higher than Hebei province. The overall trend was that of a slow rise followed by a slow decline.
The innovation performance level of universities in northeast China was 0.2687, higher than that in the Middle Triangle and the Pearl River Delta, showing an upward trend and then a downward trend. Heilongjiang province ranked the second in the northeast region, and the overall level was in the middle position. The overall level of innovation performance showed a trend of decline and then a slow rise, which had a certain development potential. Compared with other regions, the innovation performance level of Heilongjiang province was in the middle position of the innovation performance level. The overall ranking showed a slow upward trend.
The innovation performance level of research institutions in northeast China was relatively low, which was slightly higher than that in the Middle Triangle region and lower than that in other regions. Heilongjiang province ranked third in the northeast region and was at the end of the scale. The overall innovation performance level showed a trend of rising first and then declining. Compared with other regions, the innovation performance of research institutions in Heilongjiang province was at the end of the scale. The overall innovation performance level showed an upward trend and then a downward trend, with a maximum decrease of about 0.08 levels.

5.3. Selection of Key Factors Influencing Innovation Performance

5.3.1. Selection of Key Factors Influencing Regional Overall Innovation Performance

(1) Cause factor analysis. The market environment changes the business performance of enterprises, and then acts on the flow degree and concentration direction of regional innovation activities. Both the initial innovation input and the subsequent innovation achievements into the actual production process need a lot of capital support. The improvement and convenience of the financial environment affect the acquisition of funds and the operation cost of innovative production activities. The intellectual property protection system affect the transaction cost of innovation activities, the ownership of innovative products, and thus affect the allocation status and efficiency of various resources, especially intellectual resources. This is conducive to transforming the innovation output into actual products and improving the actual productivity of the region. However, at the same time, it should also be noted that the higher level of intellectual property protection may also inhibit the diffusion and dissemination of knowledge to a greater extent. The key is to generate real economic value from the resulting patented products. This includes trading in technology markets that produce direct economic benefits, as well as turning patented products into commodities that generate economies of scale by satisfying consumer needs and spreading them widely. As a special factor of production, human capital can directly affect the actual productivity level of a region by participating in the production process. Human capital not only promotes technology transfer and diffusion from original country to imitation country, but also improves the probability of technology potential being transformed into innovation output.
(2) Result factor analysis. The result factors include the number of invention patent authorizations per 10,000 R&D personnel, the proportion of the number of invention patent applications in the number of patent applications, the number of scientific and technological papers included in the main foreign retrieval tools per 10,000 R&D personnel, and the ownership of trademarks per hundred enterprises. The number of patent authorizations is an important form of intermediate output of innovation activities, and the gold content of invention patents is the highest among the three kinds of patents. In addition to patents, scientific and technological papers are important achievements produced by regional universities and research institutes, and trademarks are also important achievements produced by regional enterprises.
(3) Center analysis. The top four factors, which are the proportion of new product sales revenue in main business revenue, the proportion of technology market turnover in regional GDP, the turnover of technological achievements per 10,000 R&D personnel, and the per capita GDP of the region, are the four factors with the greatest influence in regional innovation performance.

5.3.2. Selection of Key Factors Influencing Enterprise Innovation Performance

(1) Cause factor analysis. Enterprises are the subject of the market, the micro-foundation of the economy, and the actual carrier of innovation activities and economic output. Enterprises, research institutions and universities are the main implementers of R&D activities. Among them, enterprises prefer some applied research that can be quickly converted into productivity. Therefore, the investment of enterprises in R&D activities is an important backbone of a regional innovation system. The internal system of enterprises plays a guiding and managing role in the innovation activities of enterprises. Moreover, it directly affects the cycle and scale of innovation output into actual products. The institutional arrangement within enterprises, the investment in scientific research, and the interactive connection between enterprises all have a significant impact on the regional innovation performance. Different types of organizations have different goals, structures, and operating mechanisms, so their efficiency in engaging in innovative activities is varied. Creative talents have knowledge effect, knowledge reproducibility, no depletion, and diffusion. Its value condenses in the product, and affects the later innovation investment and the economic production. Therefore, it changes the regional innovation performance.
(2) Result factor analysis. The result factors include the number of valid invention patents owned per 10,000 R&D personnel, the proportion of invention patent applications to patent applications, and the ownership of trademarks per 100 enterprises. The number of patent authorizations is an important form of intermediate output of innovation activities. The gold content of invention patents is the highest among the three kinds of patents. In addition to patents, trademarks are an important achievement produced by regional enterprises.
(3) Center analysis. The proportion of new product sales revenue in the main business revenue, the number of new product development projects per hundred enterprises, and the labor productivity of high-tech industries ranked in the top three, are the three factors with the greatest influence on the innovation performance of regional enterprises.

5.3.3. Selection of Key Factors Influencing Universities’ Innovation Performance

(1) Cause factor analysis. The factors include the number of scientists and engineers working full-time in R&D, the number of senior titles in teaching and research personnel, and the total internal expenditure in the expenditure of science and technology funds. Based on the process of knowledge innovation in universities, it can be seen that the human resources with knowledge innovation ability in universities are generally knowledgeable professors and experienced scientists and engineers. Therefore, the human input that affects the innovation performance of regional universities are mainly the scientists with teaching and scientific research tasks, and the teaching and scientific research personnel with senior titles. University expenditure on science and technology includes the expenses of researchers, business expenses and the purchase of fixed assets. In the process of knowledge innovation, universities should fully reflect the innovation performance of regional universities. These factors have important influence on the innovation performance of regional universities.
(2) Result factor analysis. The result factors include the number of scientific and technological papers per 10,000 R&D personnel, the number of scientific and technological works published per 10,000 R&D personnel, and the proportion of the number of invention patent applications in the number of patent applications. Scientific and technological papers are one of the most direct and important results of regional university innovation. In addition, patents are also an important outcome of innovation. The number of patents granted is an important form of intermediate output of innovation activities, and invention patents have the highest gold content among the three types of patents.
(3) Center analysis. The number of R&D achievements’ application and technology service projects of each university ranked in the top three items, the science and technology progress award of each department of the state council of each university, and the number of graduate students cultivated by each 10,000 R&D personnel are the four most influential factors in the subject innovation performance of regional universities.

5.3.4. Selection of Key Factors Influencing Research Institutions’ Innovation Performance

(1) Cause factor analysis. The factors include the total number of personnel engaged in R&D activities, scientific research instruments and equipment above 100,000 yuan, and the number of national or departmental recognized qualifications and institutions. Compared with the innovation function of enterprises, research institutions focus more on basic research and experimental development functions in the system. Generally, it adopts three development modes: Independent innovation, imitation innovation and joint participation of various parties. Talents engaged in R&D activities have reproducibility, non-dissipation and diffusion of knowledge, thus changing the innovation performance of regional research institutions. Due to research institutions having to carry out basic research or applied basic research innovation activities, the equipment requirements are very high. The quality and use of laboratory equipment affect the experimental results, the practice of creative ideas, and the innovation performance of research institutions. While doing basic research, research institutions fully consider the transformation of basic research results. If there is national or departmental recognition, it can effectively improve their reputation. It has an important impact on obtaining the benefits of scientific and technological innovation.
(2) Result factor analysis. The result factors include the number of scientific and technological papers per 10,000 R&D personnel, the number of scientific and technological works published per 10,000 R&D personnel, and the proportion of the number of invention patent applications in the number of patent applications. Scientific and technological papers are one of the most direct and important results produced by regional research institutions. In addition, patents are also an important outcome of innovation. The number of patents granted is an important form of intermediate output of innovation activities, and invention patents have the highest gold content among the three types of patents.
(3) Center analysis. The order of center degree is C6 > C5 > C4 > C2 > C7 > C3 > C8 > C9 > C1. The transfer of patent ownership and license income per 10,000 R&D personnel ranked in the top two items, and the number of national or industry standards formed by each research institute are the two factors with the greatest influence on the innovation performance of regional research institutions.

6. Conclusions and Future Prospects

The coordinated development of regional innovation in Heilongjiang province plays an important role in stimulating the regional innovation and entrepreneurship vitality. This can not only accelerate the formation of a regional economic system with innovation as the main guide and support, but also play an important role in promoting the healthy and sustainable development of Heilongjiang’s regional economy. Although, at present, Heilongjiang province is rich in innovation factor endowment and has great potential for innovation-driven development, many innovation resources cannot be effectively converted into real productive forces and their contribution to economic development is limited. The allocation of regional innovation resources in Heilongjiang province should be adjusted scientifically and effectively to alleviate the shortage of regional innovation-driven development.
In this study, the combined evaluation method of drift degree based on entropy weight method, maximum deviation method, TOPSIS method and grey relational degree method was used to carry out the dynamic evaluation of regional innovation performance in Heilongjiang province. The grey-DEMATEL model was further applied to select the key factors influencing the regional innovation performance in Heilongjiang province. The purpose of this study is to summarize the innovation experience of each innovation subject and select the key factors that influence the regional innovation performance in Heilongjiang province. On this basis, this study puts forward countermeasures to improve regional innovation performance in Heilongjiang province based on regional economic development. The results of this study are as follows.
(1) In the last 10 years, the innovation vitality of enterprises was insufficient, and the quality of innovation output was average in Heilongjiang province. The number of high-tech enterprises was obviously low. The theoretical innovation and quantity of innovation in universities should be further strengthened. The number of government research institutes in Heilongjiang decreased a lot, while the number of enterprise research institutes increased a little. The total quantity presented the decreasing trend, while Heilongjiang province still had certain development potential.
(2) The innovation performance level of Heilongjiang province ranked second in northeast China, and its innovation performance level and ranking rose steadily. Compared with other regions, the innovation performance level of Heilongjiang province was in the middle and lower level, which was only slightly higher than that of Hebei, Jilin, Jiangxi and Hunan. However, the trend was not obvious, and the ranking was in a fluctuating trend.
(3) The innovation performance level of enterprises in Heilongjiang province was at the end, which was only slightly higher than that in Hebei province. The overall trend showed a slow rise first and then a slow decline. The innovation performance level of universities in Heilongjiang province was in the middle position, showing the trend of first rising, then falling and then rising. The overall ranking showed a slow upward trend. The innovation performance level of research institutions in Heilongjiang province was in the terminal position. The overall innovation performance level showed a trend of first rising and then declining, with the largest decline of about 0.08 level.
(4) At present, the degree of marketization, financial environment, intellectual property system, transformation of scientific and technological achievements and human capital level are the core factors influencing the regional innovation performance in Heilongjiang province. R&D investment, human resources investment, enterprise management system and enterprise organization structure are the core factors that affect the innovation performance of enterprises in Heilongjiang province. The number of scientists and engineers in universities, the number of senior titles in teaching and research personnel, and the total internal expenditure in science and technology expenditure are the core factors that affect the innovation performance of universities in Heilongjiang province. The total number of personnel engaged in research activities, the number of R&D instruments and equipment above 100,000 yuan, the qualification recognized by the state or departments and the number of institutions are the core factors that affect the innovation performance of regional research institutions in Heilongjiang province.
This study lays a theoretical foundation for the formulation and implementation of the regional innovation-driven development strategy of Heilongjiang province, and provides practical guidance for the regional supply-side structural reform and the promotion of regional economic development in Heilongjiang province. In order to promote the regional sustainable innovation, this study puts forward the following suggestions. (1) Regional enterprises in Heilongjiang province should fully rely on universities and research institutes to establish strategic alliances of industry, university and research institutes within the region. When regional enterprises carry out innovation activities, they should pay attention to the guiding role of the market and seek inspiration for innovation from the market. At the same time, the monographs, papers, intellectual property and other innovative achievements in Heilongjiang province are transformed into products to meet people’s needs. (2) The government should strengthen the cooperation between industry, university and research institutes in Heilongjiang province. The government should also fundamentally promote the comprehensive cooperation between universities and enterprises in Heilongjiang province and realize the industrialization of scientific and technological achievements. (3) Research institutes in Heilongjiang province should issue corresponding incentive policies. These policies should improve the enthusiasm and initiative of scientific and technological personnel so as to produce more high-level scientific and technological achievements. In particular, the authorization of patents can improve the conversion rate of scientific and technological achievements.
Although these important results were obtained in this study, there are some shortcomings, which are also an important direction for future research. First, the development proposal has very good applicability to promote the regional development of Heilongjiang province, and further study is needed for different regions. Second, the evaluation index system in this study can be used as the basic index system for the innovation performance evaluation of regions and various innovation subjects. Future study can be further expanded and improved for different regions.
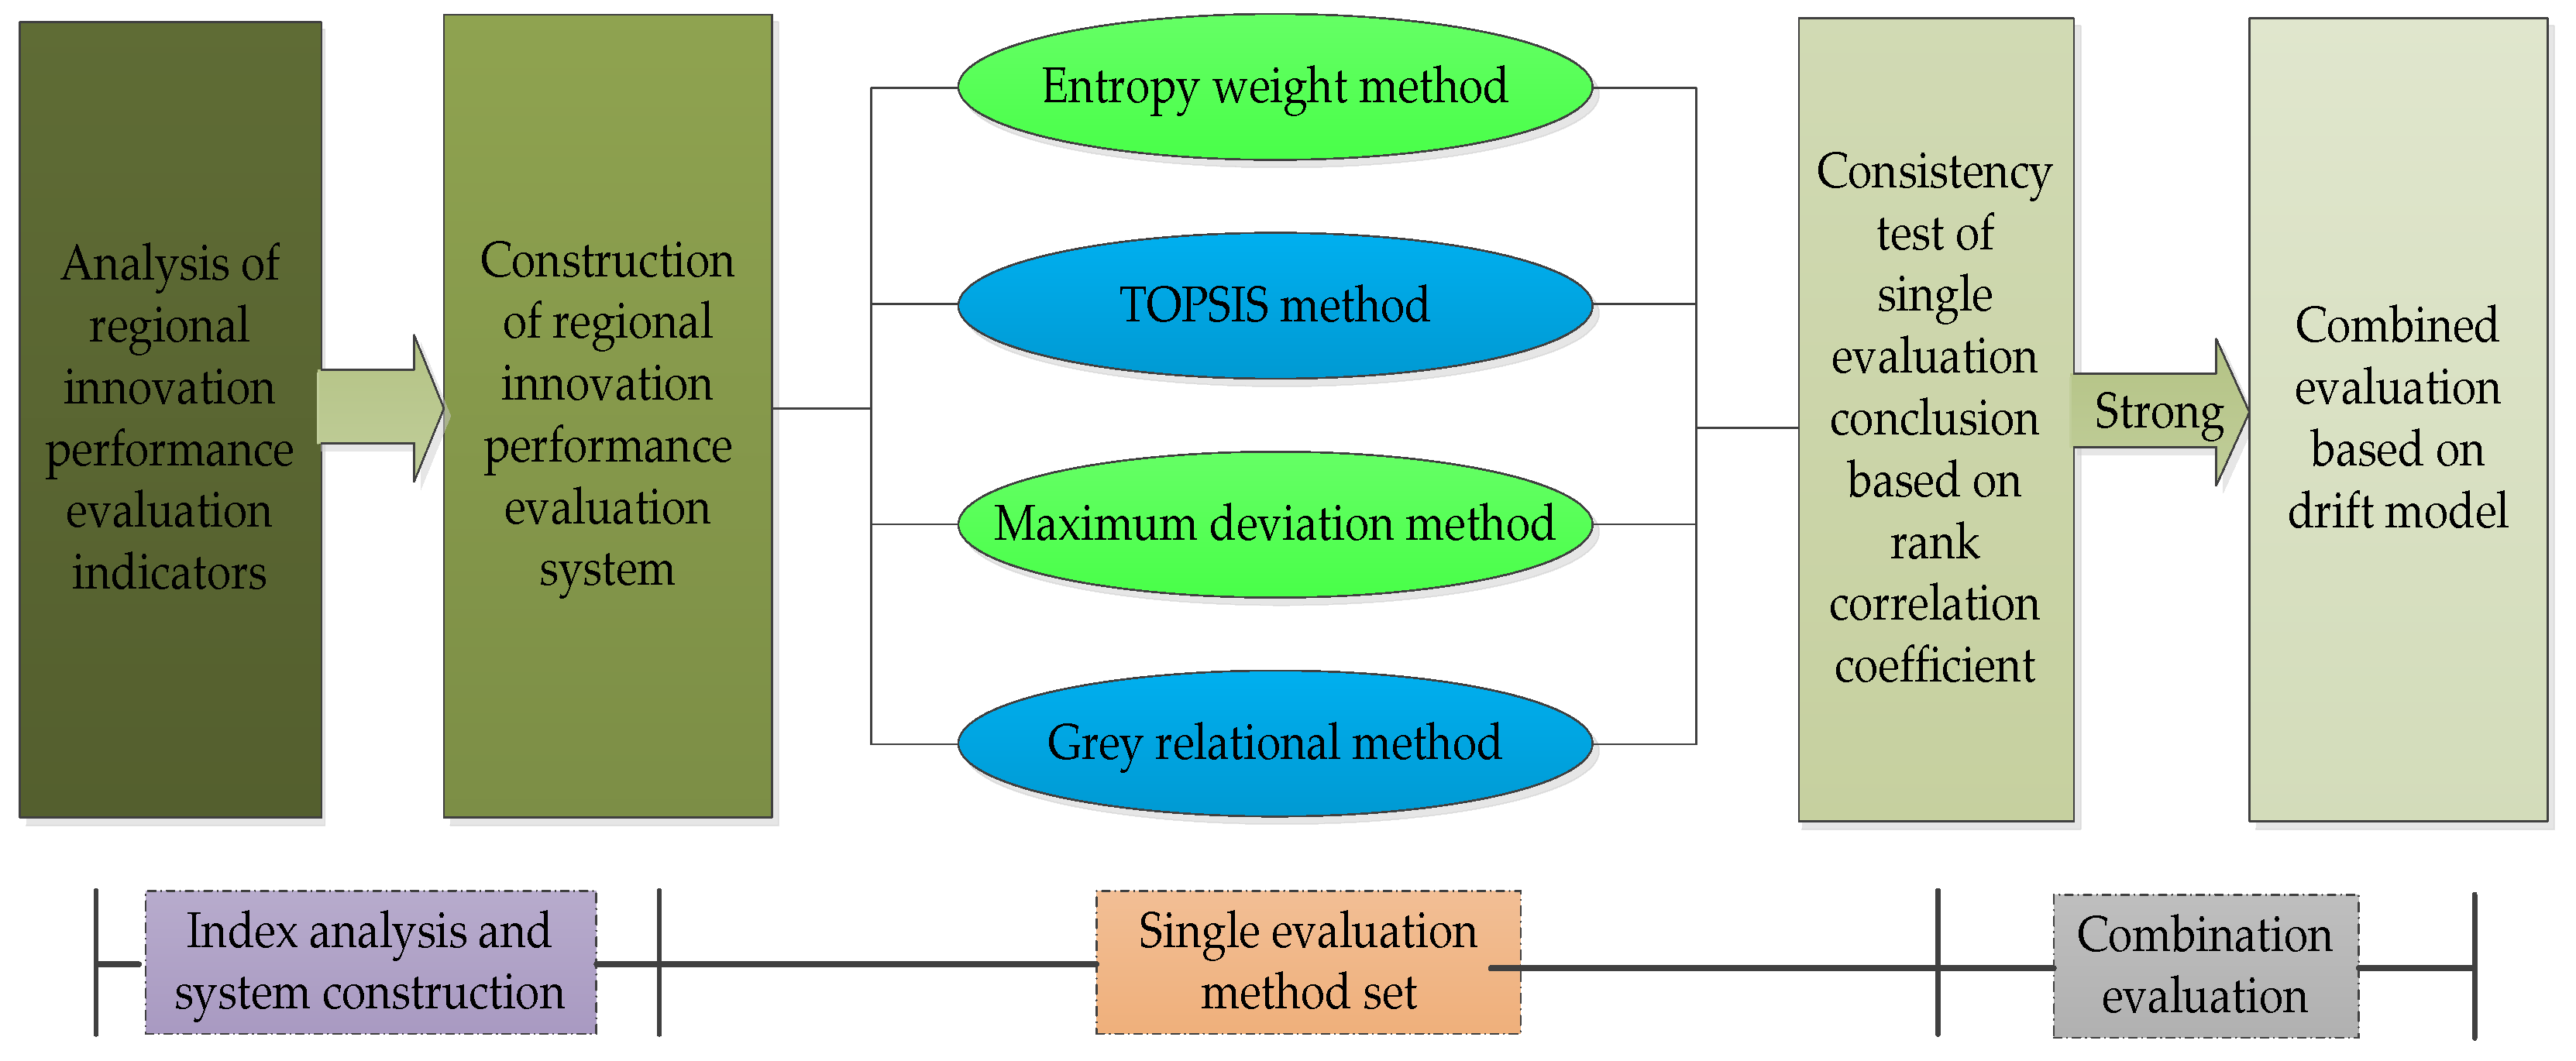
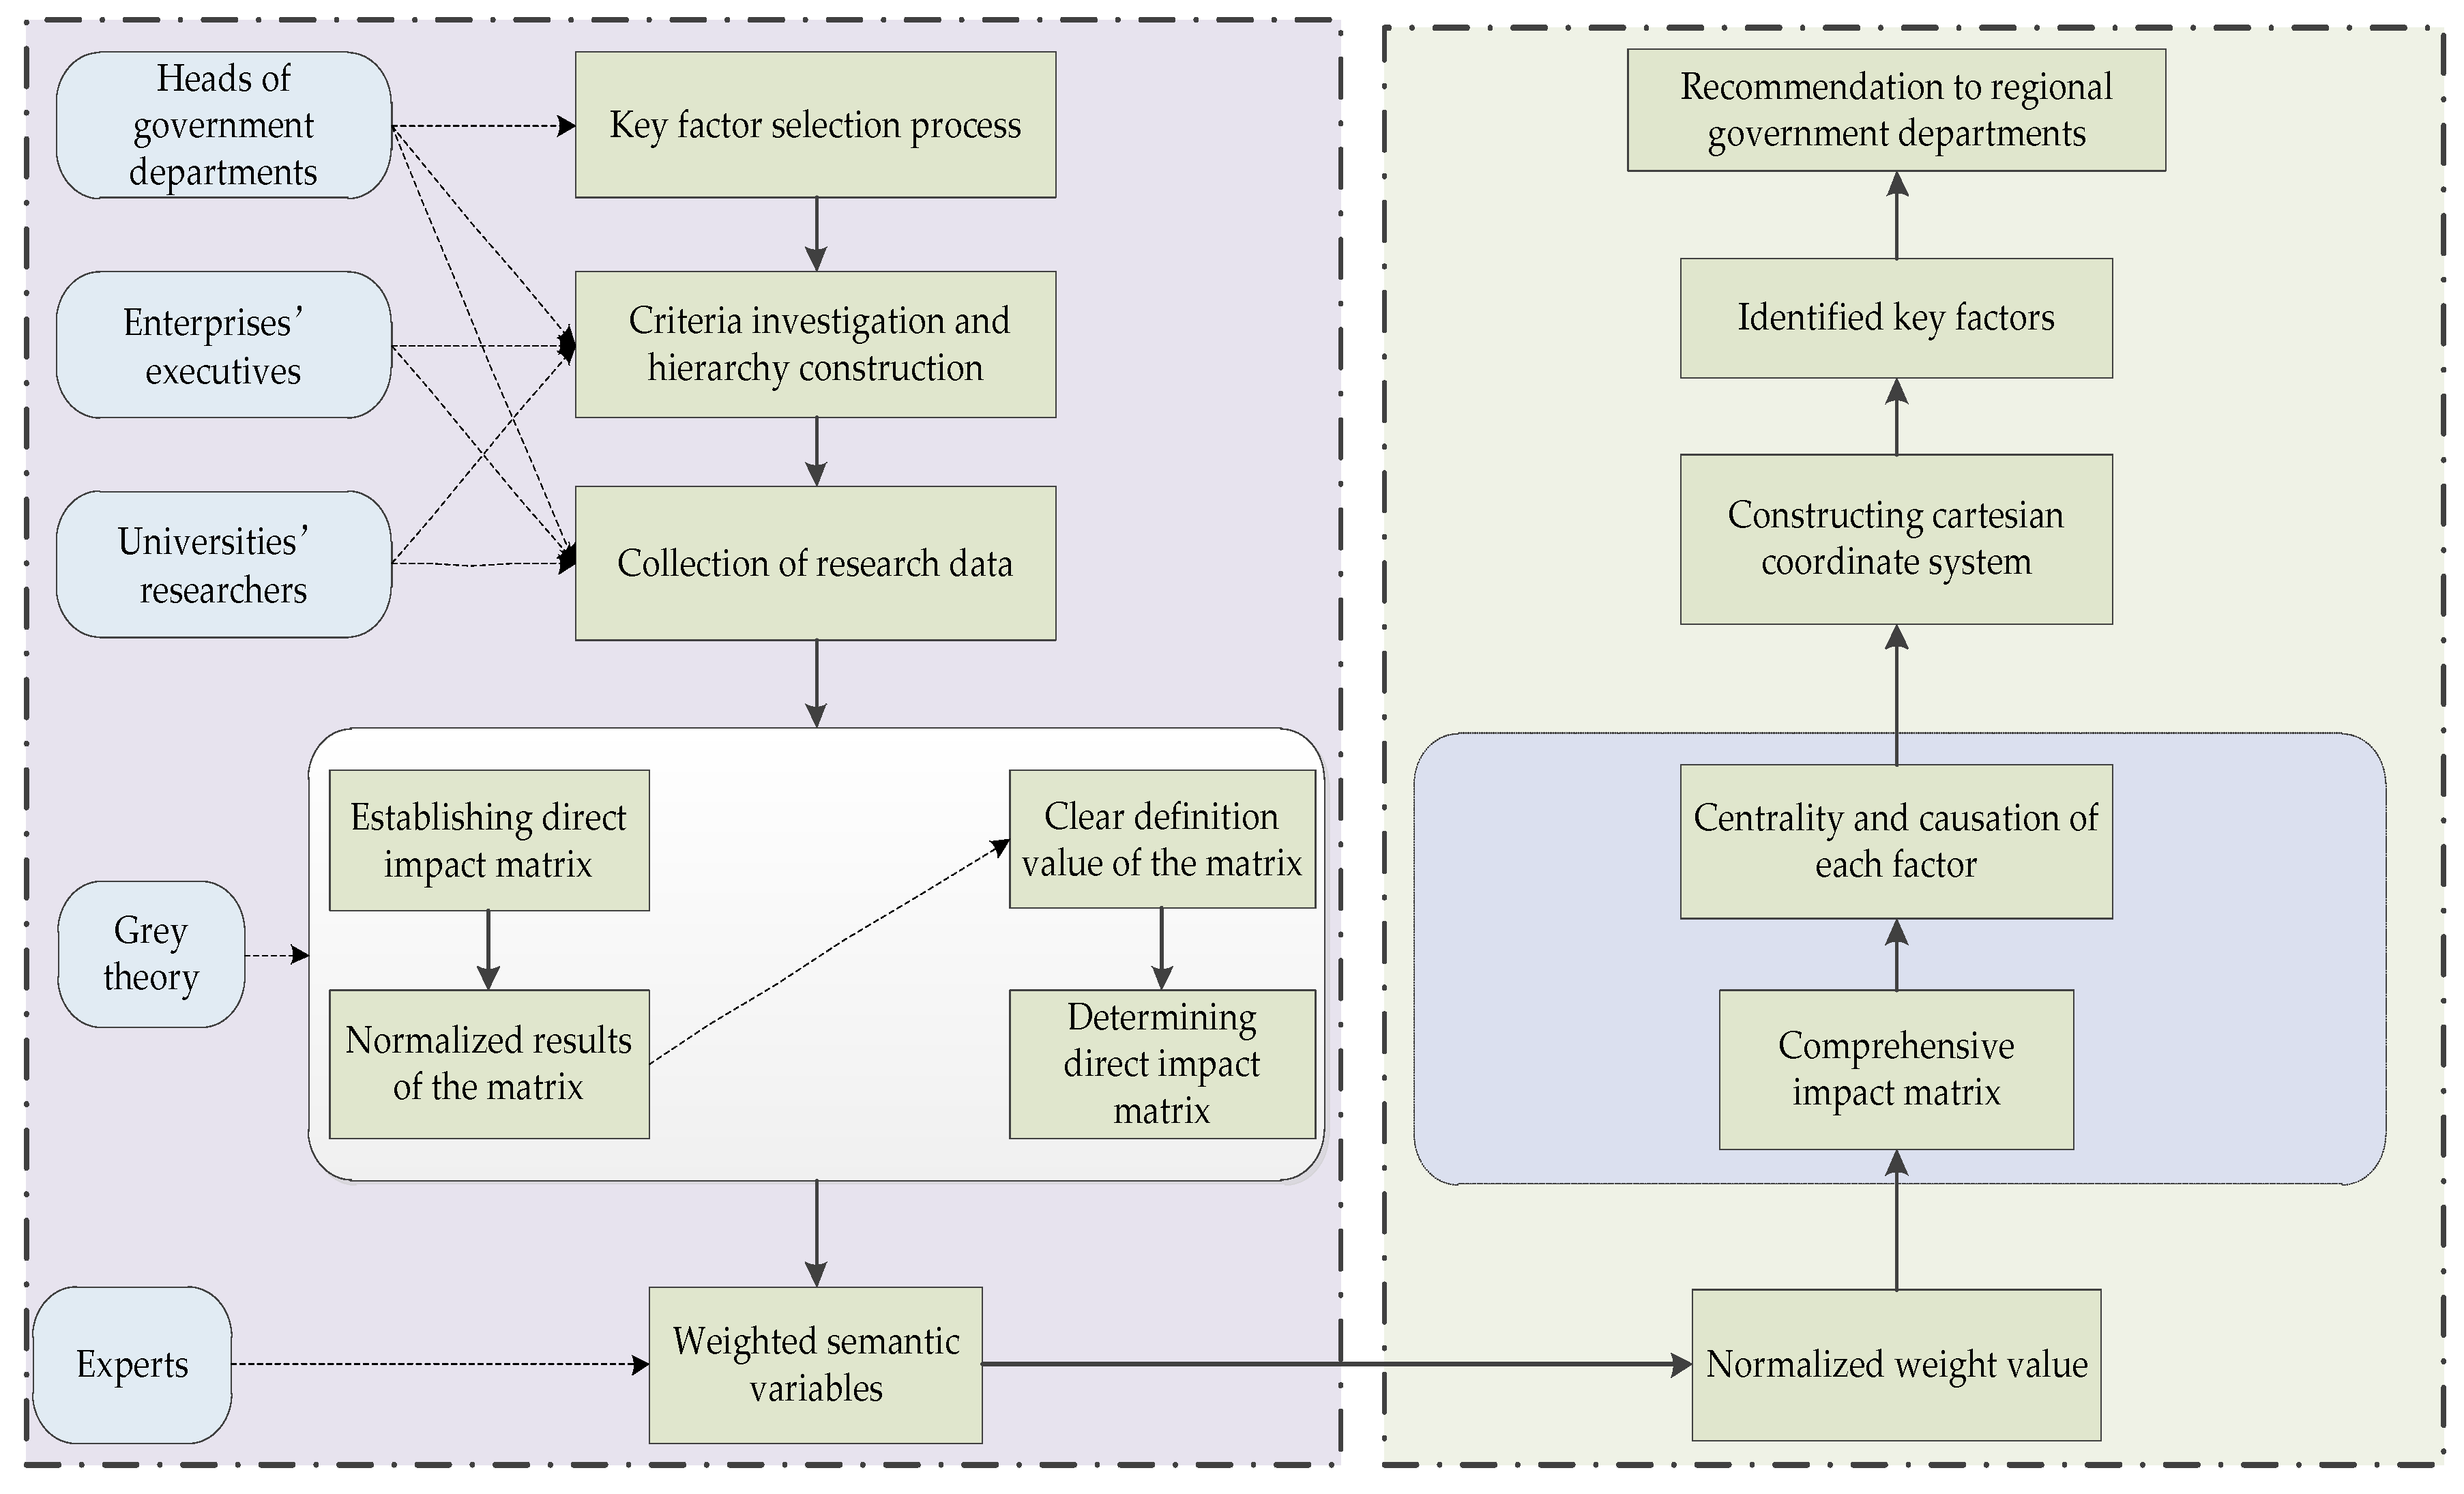
Author Contributions

Writing—original draft preparation, W.X. and B.L.; writing—review and editing, S.Y. All authors have read and agreed to the published version of the manuscript.

Funding

This research was funded by Key Projects of The National Social Science Fund of China (19FGLA001), the National Natural Science Foundation of China (71601087) and the Humanities and Social Sciences Planning Projects of Ministry of Education (15YJC630088).

Conflicts of Interest

The authors declare no conflict of interest.

Appendix A

Appendix A.1. Subjective and Objective Evaluation Methods

Appendix A.1.1. Entropy Weight Method

Entropy weight method is an objective method to determine the weight. The specific steps of entropy weight method are as follows.
① Setting f i j as the specific gravity of the index, the calculation formula is as follows:
f i j = x i j i = 1 n x i j
where x i j is the original value of the index j of the object i ; i = 1 , 2 , , n ; j = 1 , 2 , , m .
② Let h j be the entropy value of the evaluation index in item j , and the calculation formula based on the entropy value is as follows:
h j = 1 ln n i = 1 n f i j ln ( f i j )
To make ln f i j meaningful, it is generally assumed that if f i j = 0 , f i j ln f i j = 0 .
③ Let w j be the weight of the index j , and the calculation formula is as follows:
w j = 1 h j m j = 1 m h j , ( j = 1 , 2 , , n )
④ Let P i be the comprehensive score of each evaluation object, and the calculation formula is as follows:
P i = j = 1 m w j p i j

Appendix A.1.2. TOPSIS Method

The core of TOPSIS method is to determine the positive ideal solution and negative ideal solution of each index. The steps of TOPSIS are as follows.
① Construct the weighted decision matrix. Set the regional set participating in regional innovation performance evaluation as M . The included index set is S , then the value of M i to index S j is denoted as p i j . The weighted decision matrix R = ( r i j ) m × n is obtained by multiplying the index weight w j with the dimensionless matrix, where r i j = w × p i j .
② Calculate the positive and negative ideal solutions. Based on the above weighted decision matrix, the positive and negative ideal solutions are calculated as follows:
Y j + = max 1 i m { r i j + } , Y j = min 1 i m { r i j }
where j = 1 , 2 , , n . The positive ideal solution of the evaluation scheme Y + = ( Y 1 + , Y 2 + , , Y m + ) and the negative ideal solution Y - = (   Y 1 , Y 2 , , Y m ) can be obtained.
③ Calculate the Euclidean distance between the evaluation object and the ideal solution. Let d i + be the Euclidean distance between region i and the positive ideal solution, and d i be the Euclidean distance between region i and the negative ideal solution. The calculation formula is as follows:
d i + = ( Y 1 + Y 1 i ) 2 + + ( Y m + Y m i ) 2 , d i = ( Y 1 1 Y 1 i ) 2 + + ( Y m Y m i ) 2
④ The relative closeness degree is calculated and evaluated. The relative closeness is C i = d i / ( d i + + d i ) . The larger the value of C i , the closer the innovation performance is to the positive ideal solution and the higher the innovation performance is.

Appendix A.1.3. Deviation Maximization Method

Deviation maximization is a method to determine the weight by using the proportion of the deviation. The objective determination of the weights can reflect the dispersion of the indexes and avoid the uncertainty of subjective weighting.
① Let v i j ( i = 1 , 2 , , n ; j = 1 , 2 , , m ) represent the value of the index j of the evaluation object i after normalization. Let w j be the weight of the index j , w j 0 . For index j , E i j ( w ) represents the total deviation between object i and all other object index values. Then the calculation formula is as follows:
E i j ( w ) = j = 1 m | v i j w j v i k w j |
② Let E j ( w ) represent index j , and the total deviation between all objects and other objects is as follows:
E j ( w ) = i = 1 n E i j ( w ) = i = 1 n k = 1 n | v i i j v i k | w j
③ Under the condition of maximum total deviation, the objective function of the weighted vector w is as follows:
m a x E ( w ) = j = 1 m i = 1 n k = 1 n | v i j v i k | w j s . t . { w j 0 j = 1 m w j 2 = 1
④ The Lagrange function is applied to the optimization model and its partial derivative is obtained. The normalized weight vector is obtained as follows:
w j = i = 1 n k = 1 n | v i j v i k | j = 1 m i = 1 n k = 1 n | v i j v i k |
⑤ Let V i be the comprehensive score of each evaluation object, and the calculation formula is as follows:
V i = j = 1 m w j v i j

Appendix A.1.4. Grey Relational Degree Method

The grey system refers to the system where part of the information is clear and part of the information is unknown. The implementation steps of the grey relational degree is mainly divided into the following steps.
①There are n objects, and each object has m single evaluation method. The evaluation result data of the single evaluation method is x 1 , x 2 , , x m , where i = 1 , 2 , , m . Let x 0 be the ideal evaluation result, then the correlation coefficient between x 0 and x i about the k element is as follows:
ξ i ( k ) = Δ min + ρ Δ max Δ i ( k ) + ρ Δ max ,   i = 1 , 2 , , n ; k = 1 , 2 , , m
where Δ min = min i { min k [ | x 0 ( k ) x i ( k ) | ] } and Δ max = max i { max k [ | x 0 ( k ) x i ( k ) | ] } . ρ is the resolution coefficient, which is 0.5.
② The correlation between zone i and ideal evaluation results is as follows:
γ i = k = 1 m w k ξ i ( k )

Appendix B

Appendix B.1. Key Factor Selection Method Based on Grey-DEMATEL Model

Appendix B.1.1. Grey Model

The basic conceptual knowledge of the model is as follows.
① Given the original sequence x ( 0 ) is as follows:
x ( 0 ) = { x ( 0 ) ( 1 ) , x ( 0 ) ( 2 ) , , x ( 0 ) ( n ) }
② After the cumulative generation operation, the following results can be expressed as follows:
x ( 1 ) = { x ( 1 ) ( 1 ) , x ( 1 ) ( 2 ) , , x ( 1 ) ( n ) }
③ The differential equation of the operational sequence x ( 1 ) ( k ) can be expressed as follows:
d x ( 1 ) ( k ) d k + a x ( 1 ) ( k ) = b
④ The grey prediction model is established as follows:
d x d k + a x ( 1 ) = b
In the formula, the parameters a and b are obtained as follows by the least squares method.
( a b ) = ( B T B ) 1 B T y N
B = [ 1 2 ( x ( 1 ) ( 1 ) + x ( 1 ) ( 2 ) ) 1 1 2 ( x ( 1 ) ( 2 ) + x ( 1 ) ( 3 ) ) 1 1 2 ( x ( 1 ) ( n 1 ) + x ( 1 ) ( n ) ) 1 ]
y N = ( X ( 0 ) ( 2 ) , X ( 0 ) ( 3 ) , , X ( 0 ) ( n ) ) T
Taking a and b back to the differential equation and get x ^ ( 1 ) as follows:
x ^ ( 1 ) ( k + 1 ) = ( x ( 0 ) b a ) e a k + b a
⑤ The above equation refers to the model after an accumulative generation operation, so the reduction method is as follows:
x ^ ( 0 ) ( k ) = x ^ ( 1 ) ( k ) x ^ ( 1 ) ( k 1 )

Appendix B.1.2. DEMATEL Model

The basic conceptual knowledge of the model is as follows.
① According to the collected information, the n elements contained in the system are denoted as N 1 , N 2 , , N n .
② Prejudge whether the collected information elements affect each other. If there is influence, the strength of the relationship is further judged. Experts give scores according to different degrees of influence, so as to determine the direct impact matrix formed by the degree of mutual influence. The degree of mutual influence among the influencing factors can be divided into 6 grades, and the natural numbers 0–5 represent the degree of influence. 0–5 represents no influence, very low influence, low influence, high influence, very high influence, and momentous influence.
③ According to the expert interview results, the direct impact matrix is obtained as follows:
N = [ 0 N 12 N 1 i N 1 j N 1 n N 21 0 N 2 i N 2 j N 2 n N i 1 N i 2 0 N i j N i n N j 1 N j 2 N j i 0 N j n 0 N n 1 N n 2 N n i N n j 0 ]
where n represents the number of influencing factors. N i j represents the influence degree of factor N i on N j after the expert opinion is sorted out, and N n n is set to 0.
④ The direct impact matrix is normalized to obtain the normalized direct impact matrix. The formula is as follows:
N = max { j = 1 n N i j }
b i j = N i j N i
B = ( b i j )
⑤ On the basis of the normalized direct impact matrix, the above equation is used to obtain the comprehensive influence matrix T . The formula is as follows:
T = B + B 2 + B 3 + + B n = ( t i j ) n n
When it is relatively large, the above equation is adopted for approximate calculation. The formula is as follows:
T = B ( I B ) 1
where I is the identity matrix.
⑥ Calculate the influence degree and extent of influence between elements. The influence degree among influencing factors is represented by element t i j ( i , j = 1 , 2 , , n ) in T . t i j represents the influence degree of influencing factors N i relative to N j . The sum of all elements of T is used to obtain the influence degree, which is expressed by f i . The meaning represented is the influence degree of the represented influencing factor N i on other influencing factors. The influence degree is obtained by summing up the column elements in the comprehensive influence matrix T , expressed in terms of g j , which means the extent to which the influencing factor N j is affected by other influencing factors. The calculation formulas are shown as follows:
f i = j = 1 n t i j
g j = i = 1 n t i j
⑦ Calculate the centrality and causation of each element. The degree of centrality H i is obtained. The degree of centrality represents the position of the influencing factor in the system and the magnitude of its effect. The larger the degree of centrality, the more obvious the influence of the influencing factor is in the system, which can be considered as the main factor. The causal degree E j is obtained by subtracting the influence degrees f i and g j of the influencing factors. A causal degree greater than 0 indicates that other factors are susceptible to this factor. A causal degree less than 0 indicates that other factors are likely to influence this factor. The formulas are shown as follows:
H i = f i + g j
E i = f i g j
⑧ The influence correlation diagram is drawn, with H i as the horizontal axis, E j as the vertical axis, and ( H i , E j ) as the coordinate.

Appendix C

Table A1. Evaluation results of regional innovation performance in six major triangle regions from 2009 to 2017.
2009 Year
Science and technology outputRankingEconomic outputRankingSocial effectRankingInnovation performanceRanking
Beijing0.684010.492420.758010.61341
Tianjin0.360470.568210.606330.49202
Hebei0.2228160.1656150.2769150.107916
Liaoning0.3105120.2218110.2981120.175012
Jilin0.337980.320460.320190.23928
Heilongjiang0.375540.1523160.2829140.155114
Shanghai0.504320.405550.618420.43983
Jiangsu0.323290.437540.563340.38944
Zhejiang0.403230.2127120.531750.27087
Jiangxi0.2268150.1944140.3155100.140015
Hubei0.2828140.459730.3097110.31915
Hunan0.3183100.2442100.320680.195010
Guangdong0.369260.274580.522860.29156
Chongqing0.3158110.287270.337770.22509
Sichuan0.2898130.255790.2347160.168713
Shaanxi0.372450.2052130.2902130.182911
2010 Year
Science and technology outputRankingEconomic outputRankingSocial effectRankingInnovation performanceRanking
Beijing0.720810.750010.764010.78361
Tianjin0.2911120.503330.625220.41043
Hebei0.2168150.2786150.2624150.132216
Liaoning0.2986110.415360.345490.26758
Jilin0.329480.2895140.352580.206011
Heilongjiang0.355450.2439160.3091130.182313
Shanghai0.507120.522320.615130.48732
Jiangsu0.340170.462340.580340.37854
Zhejiang0.383030.3145110.561850.30906
Jiangxi0.2153160.2926130.3407100.171515
Hubei0.2611140.411070.3334110.25459
Hunan0.2834130.3247100.3318120.202812
Guangdong0.343360.385080.526460.32135
Chongqing0.2998100.428350.354170.27377
Sichuan0.306290.3041120.2480160.176714
Shaanxi0.369040.341290.3046140.235210
2011 Year
Science and technology outputRankingEconomic outputRankingSocial effectRankingInnovation performanceRanking
Beijing0.621010.807710.757210.76821
Tianjin0.2329130.452730.682930.37323
Hebei0.1738160.3147110.2542150.152216
Liaoning0.328660.2973130.3324130.21389
Jilin0.305670.2888140.3648100.208510
Heilongjiang0.2670100.2466160.3348120.175315
Shanghai0.455620.528720.710120.48942
Jiangsu0.362640.433550.613640.37274
Zhejiang0.304380.324690.589250.29997
Jiangxi0.1901150.2806150.377180.179914
Hubei0.2185140.3223100.371790.202011
Hunan0.2515120.3029120.3197140.182113
Guangdong0.282390.404460.521360.30905
Chongqing0.339650.438340.410070.30806
Sichuan0.2631110.369480.2399160.199812
Shaanxi0.388530.372270.3556110.28198
2012 Year
Science and technology outputRankingEconomic outputRankingSocial effectRankingInnovation performanceRanking
Beijing0.619810.718910.809810.81731
Tianjin0.2536110.358230.701530.38323
Hebei0.1569160.2101130.2451150.144916
Liaoning0.348840.2139120.3629120.241810
Jilin0.301580.1817160.400580.221212
Heilongjiang0.284490.1819150.3403130.202113
Shanghai0.465120.427820.740720.50142
Jiangsu0.348250.321680.617840.36444
Zhejiang0.312870.2458100.596150.31655
Jiangxi0.1636150.1835140.3653110.174215
Hubei0.2199140.357640.3811100.28719
Hunan0.2277130.2339110.3103140.188514
Guangdong0.2430120.346350.507060.31606
Chongqing0.327260.327760.443270.30358
Sichuan0.2768100.326070.2447160.239411
Shaanxi0.358530.308490.391290.30517
2013 Year
Science and technology outputRankingEconomic outputRankingSocial effectRankingInnovation performanceRanking
Beijing0.632710.685410.872810.80881
Tianjin0.2643110.322960.705920.39233
Hebei0.1546150.1769120.2568150.166716
Liaoning0.378040.1588130.3881110.257410
Jilin0.315660.1025160.447080.231812
Heilongjiang0.328350.1345150.3005140.211114
Shanghai0.442620.396520.641640.46892
Jiangsu0.300270.267480.657630.36255
Zhejiang0.2821100.2188100.615550.32837
Jiangxi0.1468160.1357140.3529120.167015
Hubei0.2576120.236590.415290.26419
Hunan0.2380130.2048110.3093130.214113
Guangdong0.2308140.341740.517960.34286
Chongqing0.289880.326950.463470.32818
Sichuan0.284690.287570.2212160.248611
Shaanxi0.402730.350530.4018100.36724
2014 Year
Science and technology outputRankingEconomic outputRankingSocial effectRankingInnovation performanceRanking
Beijing0.676210.657810.890210.81861
Tianjin0.2339130.303250.723620.38144
Hebei0.1452150.0950150.2688150.116216
Liaoning0.306360.1416120.3744110.225212
Jilin0.315950.0929160.442090.226111
Heilongjiang0.349440.1086140.2789140.204814
Shanghai0.444220.451220.652040.51392
Jiangsu0.277990.242880.677830.35305
Zhejiang0.2734100.1996100.624650.32387
Jiangxi0.1409160.1319130.3507120.161415
Hubei0.2534110.235390.463180.27959
Hunan0.2407120.1823110.3195130.206613
Guangdong0.2316140.244370.526960.30088
Chongqing0.301970.317040.471470.33726
Sichuan0.280480.245760.2200160.231910
Shaanxi0.383630.411630.4095100.40423
2015 Year
Science and technology outputRankingEconomic outputRankingSocial effectRankingInnovation performanceRanking
Beijing0.782010.721910.885910.85501
Tianjin0.2417140.377340.746220.40353
Hebei0.1446160.1142160.3133140.119316
Liaoning0.360160.2139120.3562110.257110
Jilin0.309890.1188150.3917100.200514
Heilongjiang0.418130.1393140.2626150.220413
Shanghai0.487320.407930.695640.48482
Jiangsu0.315880.261190.705230.35435
Zhejiang0.2961100.2330100.657250.32318
Jiangxi0.1766150.1549130.3519120.162115
Hubei0.2902110.325050.492770.33117
Hunan0.2673130.2268110.3444130.223612
Guangdong0.2752120.274470.545560.30829
Chongqing0.384240.313360.488380.34126
Sichuan0.335870.261480.2410160.244311
Shaanxi0.378850.451120.414090.40334
2016 Year
Science and technology outputRankingEconomic outputRankingSocial effectRankingInnovation performanceRanking
Beijing0.821110.720210.933010.86381
Tianjin0.2532140.356240.759320.40874
Hebei0.1469160.1019160.4026100.154415
Liaoning0.376150.2382100.2884140.265310
Jilin0.315090.1466130.3942110.224412
Heilongjiang0.402640.1263150.2563150.216814
Shanghai0.492520.410130.714530.49992
Jiangsu0.2915100.247990.712740.35436
Zhejiang0.2815120.2316110.652950.32528
Jiangxi0.1657150.1429140.2994130.146916
Hubei0.324470.342850.500470.35715
Hunan0.2586130.1954120.3728120.221113
Guangdong0.2822110.270680.533260.31239
Chongqing0.334160.341960.466480.34147
Sichuan0.322980.276670.2398160.252911
Shaanxi0.418030.455220.462490.42993
2017 Year
Science and technology outputRankingEconomic outputRankingSocial effectRankingInnovation performanceRanking
Beijing0.910010.640910.807110.87911
Tianjin0.2498130.324750.541840.36105
Hebei0.1260160.0563160.1589160.098816
Liaoning0.324750.256870.2821130.30429
Jilin0.2689120.1382130.3487110.239813
Heilongjiang0.442130.1035140.2039150.269212
Shanghai0.497820.361640.569420.48272
Jiangsu0.3030100.1660120.553430.31138
Zhejiang0.310780.250880.492750.33557
Jiangxi0.2030150.0728150.369790.202815
Hubei0.315670.284360.427160.34516
Hunan0.2477140.1774110.2622140.228714
Guangdong0.321360.363630.403470.38144
Chongqing0.2759110.228790.3498100.282311
Sichuan0.306490.2043100.389880.301110
Shaanxi0.441140.467320.3203120.45603
Table A2. Evaluation results of innovation performance of regional innovation subjects in six major triangle regions from 2009 to 2017.
2009 Year
Enterprise subjects
Science and technology outputRankingEconomic outputRankingSocial effectRankingInnovation performanceRanking
Beijing0.569710.340150.719920.50053
Tianjin0.396650.804710.659530.69871
Hebei0.1819160.1138160.2570160.106116
Liaoning0.290270.1679130.2994150.184913
Jilin0.272590.308360.446070.30079
Heilongjiang0.2124140.1399150.3442130.163214
Shanghai0.468640.365940.771210.49964
Jiangsu0.2611100.500030.610140.47165
Zhejiang0.359060.1885120.534950.30538
Jiangxi0.1862150.1678140.3172140.158815
Hubei0.280680.639820.393190.50612
Hunan0.487030.2423100.3713110.32227
Guangdong0.497920.261880.497160.36076
Chongqing0.2505110.272070.3735100.256810
Sichuan0.2304120.246090.3539120.230511
Shaanxi0.2210130.1923110.399480.208912
University subjects
Science and technology outputRankingEconomic outputRankingSocial effectRankingInnovation performanceRanking
Beijing0.675110.486530.750810.64591
Tianjin0.438580.2105150.2633100.233910
Hebei0.2110150.2413110.1440150.141014
Liaoning0.2813130.2282120.287970.212112
Jilin0.2113140.1816160.1981130.134415
Heilongjiang0.481860.2156130.266290.24739
Shanghai0.636020.516410.576720.57542
Jiangsu0.588830.516220.471430.50603
Zhejiang0.478770.348280.1676140.25918
Jiangxi0.1541160.2504100.1013160.130516
Hubei0.543040.349370.395650.38945
Hunan0.3491110.274590.2167110.210813
Guangdong0.3473120.390660.2092120.27817
Chongqing0.355190.394340.284480.30746
Sichuan0.3502100.2110140.299660.232011
Shaanxi0.482950.393850.449440.40174
Research institution subjects
Science and technology outputRankingEconomic outputRankingSocial effectRankingInnovation performanceRanking
Beijing0.939810.459610.569310.77551
Tianjin0.2304120.0009100.028620.122912
Hebei0.2416110.0001130.013370.136711
Liaoning0.387520.213620.0037110.28872
Jilin0.349140.003180.0005150.22584
Heilongjiang0.2120130.0000150.0009140.112013
Shanghai0.373930.025450.021230.23583
Jiangsu0.301860.001390.019950.19706
Zhejiang0.2732100.004070.0056100.16819
Hubei0.280490.007460.0036120.159310
Hunan0.2026150.0000140.0011130.100015
Guangdong0.287680.098230.006690.20995
Chongqing0.2048140.0006120.019560.109214
Sichuan0.289670.046040.020840.18808
Shaanxi0.308050.0006110.012280.19067
2010 Year
Enterprise subjects
Science and technology outputRankingEconomic outputRankingSocial effectRankingInnovation performanceRanking
Beijing0.723110.655920.677020.72571
Tianjin0.435150.685810.611330.55322
Hebei0.2111160.2219160.2544160.134416
Liaoning0.2670120.2354150.3354130.203213
Jilin0.2643130.2433130.3750110.214212
Heilongjiang0.2256150.2419140.3740120.189815
Shanghai0.494730.490550.698810.53203
Jiangsu0.2768100.513530.591840.41335
Zhejiang0.298180.2891100.559950.32179
Jiangxi0.2529140.2498120.3239150.200014
Hubei0.284790.501140.465370.36906
Hunan0.452240.323590.4389100.35747
Guangdong0.580220.389370.499360.44774
Chongqing0.309070.420060.446480.33288
Sichuan0.328860.2673110.3276140.234211
Shaanxi0.2677110.345580.443990.289010
University subjects
Science and technology outputRankingEconomic outputRankingSocial effectRankingInnovation performanceRanking
Beijing0.556720.445230.627110.56171
Tianjin0.358380.351450.2794100.28606
Hebei0.1742150.2441100.2148140.142814
Liaoning0.2806130.2400110.350660.223812
Jilin0.2133140.1668160.2298130.121015
Heilongjiang0.503950.1826150.306390.24379
Shanghai0.595110.486510.502140.51402
Jiangsu0.543930.482920.479850.47613
Zhejiang0.458370.307780.2120150.24978
Jiangxi0.1353160.2182140.2082160.090916
Hubei0.529140.297290.514030.39635
Hunan0.2973120.2318120.2423120.177513
Guangdong0.3361110.328970.2684110.236210
Chongqing0.3487100.350860.328480.28137
Sichuan0.355690.2193130.330670.230411
Shaanxi0.502760.397540.547320.44214
Research institution subjects
Science and technology outputRankingEconomic outputRankingSocial effectRankingInnovation performanceRanking
Beijing0.931911.000010.766510.88231
Tianjin0.2744100.012190.037330.079511
Hebei0.2472110.0034110.0042110.053212
Liaoning0.379630.836420.0004140.41452
Jilin0.370440.0003140.0007130.10375
Heilongjiang0.2104140.0004130.0000150.033615
Shanghai0.398520.223530.049620.20443
Jiangsu0.284990.020180.017970.08249
Zhejiang0.2447120.151240.0064100.10744
Hubei0.285980.037570.007890.080910
Hunan0.2089150.0030120.0019120.034514
Guangdong0.298060.064950.008780.10066
Chongqing0.2239130.0084100.022540.050213
Sichuan0.291470.051460.018560.09437
Shaanxi0.316550.0001150.022050.09008
2011 Year
Enterprise subjects
Science and technology outputRankingEconomic outputRankingSocial effectRankingInnovation performanceRanking
Beijing0.608510.518320.588940.56411
Tianjin0.367050.509830.667120.47643
Hebei0.2197160.2702140.2344160.167916
Liaoning0.2901100.2682150.3034150.208815
Jilin0.2710130.2898120.3856110.239412
Heilongjiang0.2703140.2365160.3808120.218914
Shanghai0.466430.537710.677410.52952
Jiangsu0.343660.449950.611230.40605
Zhejiang0.2837110.3306100.558750.32137
Jiangxi0.2554150.2839130.3772130.231113
Hubei0.2799120.341390.461780.28668
Hunan0.378040.3063110.403090.28229
Guangdong0.522920.438660.533260.43104
Chongqing0.332680.480640.503670.37236
Sichuan0.343670.395270.3252140.277911
Shaanxi0.305990.358180.4019100.280210
University subjects
Science and technology outputRankingEconomic outputRankingSocial effectRankingInnovation performanceRanking
Beijing0.590920.535420.879810.78271
Tianjin0.3482110.332980.263690.29968
Hebei0.1863150.2773110.1334160.172214
Liaoning0.410180.2707120.283860.284810
Jilin0.1245160.1980160.1670140.130316
Heilongjiang0.512450.2519140.2505100.28969
Shanghai0.620310.618710.603620.63862
Jiangsu0.488970.503230.389040.44443
Zhejiang0.490260.385260.1679130.30457
Jiangxi0.2306140.2862100.1799120.173713
Hubei0.524840.326590.363250.38595
Hunan0.2549130.2252150.1660150.164715
Guangdong0.3244120.345770.1856110.240612
Chongqing0.401990.468040.263880.34246
Sichuan0.3661100.2688130.283470.271611
Shaanxi0.571230.447850.404630.44334
Research institution subjects
Science and technology outputRankingEconomic outputRankingSocial effectRankingInnovation performanceRanking
Beijing0.897110.414610.837510.84901
Tianjin0.2526100.0002140.010280.17979
Hebei0.2153120.007480.0015140.151012
Liaoning0.315540.149630.0027130.26032
Jilin0.340230.0014120.014160.23245
Heilongjiang0.1684150.0000150.0010150.119215
Shanghai0.341420.035450.051220.24084
Jiangsu0.2488110.007390.009290.179010
Zhejiang0.264970.0054100.014450.18888
Hubei0.253190.017760.0069100.171511
Hunan0.1694140.0003130.0033110.122314
Guangdong0.256480.16632.00000.0030120.24333
Chongqing0.1944130.0030110.011870.141813
Sichuan0.274760.056240.015640.20776
Shaanxi0.275950.016470.021930.19217
2012 Year
Enterprise subjects
Science and technology outputRankingEconomic outputRankingSocial effectRankingInnovation performanceRanking
Beijing0.722210.483320.641630.54071
Tianjin0.382850.481530.670310.44263
Hebei0.2611160.2416130.2333160.157016
Liaoning0.337890.2348150.3356140.211314
Jilin0.3138130.2413140.427890.237012
Heilongjiang0.2756150.2062160.3970110.204815
Shanghai0.501230.519010.665120.49052
Jiangsu0.369260.436760.592240.38865
Zhejiang0.3220110.3209100.554660.31127
Jiangxi0.2840140.2462120.3793130.216213
Hubei0.3144120.346180.454480.29118
Hunan0.388340.3106110.3991100.27899
Guangdong0.521320.444750.524370.41254
Chongqing0.343580.455340.568350.37486
Sichuan0.344270.415970.3224150.278610
Shaanxi0.3334100.337490.3900120.268411
University subjects
Science and technology outputRankingEconomic outputRankingSocial effectRankingInnovation performanceRanking
Beijing0.598420.353120.868210.65821
Tianjin0.3227110.1233120.193680.204910
Hebei0.1031160.1465100.0700160.114815
Liaoning0.336390.1419110.227870.23118
Jilin0.1396150.1137140.1087140.114716
Heilongjiang0.389780.0968160.1839100.21039
Shanghai0.640210.309330.705020.56562
Jiangsu0.525140.289840.402330.40204
Zhejiang0.406470.149790.1364110.204611
Jiangxi0.1955140.1066150.1282120.135013
Hubei0.514450.253060.323450.36815
Hunan0.2124130.1148130.0950150.130814
Guangdong0.3015120.178880.1195130.187012
Chongqing0.407360.234470.190390.27207
Sichuan0.3320100.278350.232760.28856
Shaanxi0.526630.627210.357440.55233
Research institution subjects
Science and technology outputRankingEconomic outputRankingSocial effectRankingInnovation performanceRanking
Beijing0.873610.436611.000010.91101
Tianjin0.2248110.0003130.012870.168511
Hebei0.1903130.055340.0011150.168112
Liaoning0.324940.080830.0024140.23713
Jilin0.370620.0000150.011580.23324
Heilongjiang0.1521150.0001140.0027130.129015
Shanghai0.355930.116220.032820.26522
Jiangsu0.262570.029450.013360.19326
Zhejiang0.249990.026560.008590.18558
Hubei0.250280.009780.0030120.178410
Hunan0.1654140.0009120.0036110.136614
Guangdong0.268460.004490.0084100.18977
Chongqing0.2023120.0018110.022530.161313
Sichuan0.2468100.019570.016350.18179
Shaanxi0.289450.0028100.022140.20045
2013 Year
Enterprise subjects
Science and technology outputRankingEconomic outputRankingSocial effectRankingInnovation performanceRanking
Beijing0.698810.450440.666120.57021
Tianjin0.394340.450530.746910.49943
Hebei0.2581160.2017140.2519160.184416
Liaoning0.370360.2028130.3423140.245313
Jilin0.3031130.1775150.522570.274612
Heilongjiang0.2964140.1637160.3783130.223015
Shanghai0.526430.485810.637330.50912
Jiangsu0.366370.389960.621340.41046
Zhejiang0.3034120.317190.563060.34127
Jiangxi0.2712150.2092120.3836120.234114
Hubei0.3172110.2917100.465290.306011
Hunan0.390650.2813110.4205100.307910
Guangdong0.530920.422850.516980.43814
Chongqing0.3181100.483220.574850.42025
Sichuan0.362490.378770.3400150.31069
Shaanxi0.364480.374580.4080110.32908
University subjects
Science and technology outputRankingEconomic outputRankingSocial effectRankingInnovation performanceRanking
Beijing0.615020.578810.893510.74011
Tianjin0.3259100.2118160.201080.232313
Hebei0.1460160.2408130.0850160.162816
Liaoning0.376190.2274150.266460.28276
Jilin0.1553150.2842100.1324130.186014
Heilongjiang0.388280.2500120.1913100.25539
Shanghai0.651510.534830.659120.61802
Jiangsu0.613230.553220.433230.50473
Zhejiang0.464760.289990.1209150.25898
Jiangxi0.2421140.2293140.1416110.181115
Hubei0.506450.348750.311750.37475
Hunan0.2504130.317860.1251140.240211
Guangdong0.3036110.317270.1325120.233712
Chongqing0.432370.292480.200090.27987
Sichuan0.2710120.2784110.232270.251510
Shaanxi0.568740.485140.334740.43234
Research institution subjects
Science and technology outputRankingEconomic outputRankingSocial effectRankingInnovation performanceRanking
Beijing0.890510.411210.840210.84841
Tianjin0.2270120.035760.014670.186012
Hebei0.254690.0024120.0010150.189611
Liaoning0.301440.214820.0023130.27733
Jilin0.320730.017790.008790.22594
Heilongjiang0.1277150.0001150.0035110.121115
Shanghai0.335520.187230.040220.28272
Jiangsu0.262170.0038110.034240.20188
Zhejiang0.255580.048050.015650.20257
Hubei0.2393110.0159100.0030120.181713
Hunan0.1787140.0020130.0016140.152614
Guangdong0.263460.018280.014860.20099
Chongqing0.2263130.086940.0076100.20466
Sichuan0.2521100.0018140.014180.190810
Shaanxi0.291850.024570.037830.21615
2014 Year
Enterprise subjects
Science and technology outputRankingEconomic outputRankingSocial effectRankingInnovation performanceRanking
Beijing0.746410.373340.712520.54701
Tianjin0.374970.371550.720610.41753
Hebei0.2592160.1289140.2655160.124816
Liaoning0.342290.1407130.3183150.178814
Jilin0.3109130.1208150.489480.228512
Heilongjiang0.3172120.0932160.3747130.175015
Shanghai0.566130.446610.662730.50092
Jiangsu0.390850.329460.631340.37506
Zhejiang0.3108140.248590.574160.30098
Jiangxi0.3084150.1601120.3905120.200713
Hubei0.3183110.2332100.476790.265511
Hunan0.389060.2202110.4301110.269410
Guangdong0.576720.327670.534170.39954
Chongqing0.3421100.406320.618350.38695
Sichuan0.430640.316380.3657140.29869
Shaanxi0.342680.381230.4305100.32407
University subjects
Science and technology outputRankingEconomic outputRankingSocial effectRankingInnovation performanceRanking
Beijing0.601320.484120.661420.57762
Tianjin0.3332100.2148140.277480.249410
Hebei0.1059160.2256120.1498160.130915
Liaoning0.367680.2187130.340260.26767
Jilin0.1189150.1750160.1777150.117016
Heilongjiang0.428670.1998150.2514100.244111
Shanghai0.681810.405440.790210.61611
Jiangsu0.531150.480330.377150.42484
Zhejiang0.359290.336260.2346110.25758
Jiangxi0.2359130.2538100.2080120.186714
Hubei0.556340.323170.390240.37825
Hunan0.2715120.260490.1910140.195313
Guangdong0.2847110.369950.2069130.25229
Chongqing0.466160.2494110.266290.26966
Sichuan0.2075140.292180.307370.237112
Shaanxi0.565630.586910.508030.52333
Research institution subjects
Science and technology outputRankingEconomic outputRankingSocial effectRankingInnovation performanceRanking
Beijing0.862910.410510.684310.81121
Tianjin0.265280.095150.022760.21386
Hebei0.2371130.0096110.0039120.162213
Liaoning0.318250.164730.0018150.26384
Jilin0.349530.0001140.013880.23325
Heilongjiang0.1347150.0001130.0018140.091915
Shanghai0.384820.190520.060520.30472
Jiangsu0.269960.028970.024350.19297
Zhejiang0.255890.047960.018170.18808
Hubei0.2509110.0052120.0114100.166112
Hunan0.1981140.0156100.0021130.142814
Guangdong0.2557100.024780.026030.18459
Chongqing0.2443120.0000150.013690.174911
Sichuan0.265470.017890.0095110.183110
Shaanxi0.346340.142440.025840.26643
2015 Year
Enterprise subjects
Science and technology outputRankingEconomic outputRankingSocial effectRankingInnovation performanceRanking
Beijing0.798710.389150.725520.57331
Tianjin0.353890.425140.777610.45555
Hebei0.2405160.1776150.3522150.175916
Liaoning0.360880.1999130.2859160.202714
Jilin0.2618150.1778140.4812100.223813
Heilongjiang0.3189120.1463160.3762130.197415
Shanghai0.526230.451720.704730.49872
Jiangsu0.379270.379570.684240.41406
Zhejiang0.2841140.326990.622160.33558
Jiangxi0.2892130.2054120.4281120.229712
Hubei0.3346100.2996110.497080.305511
Hunan0.381360.3034100.495990.32259
Guangdong0.584320.380760.613270.45644
Chongqing0.448740.467610.669250.46353
Sichuan0.435250.347380.3742140.318910
Shaanxi0.3295110.448730.4579110.34697
University subjects
Science and technology outputRankingEconomic outputRankingSocial effectRankingInnovation performanceRanking
Beijing0.640330.670410.833110.77011
Tianjin0.387290.1838110.262280.22529
Hebei0.0924160.1495150.1363160.076016
Liaoning0.402370.1785120.306960.24687
Jilin0.1938150.1334160.1702130.111315
Heilongjiang0.441260.1600140.266870.23438
Shanghai0.692410.404350.736420.61822
Jiangsu0.582340.447940.394540.43274
Zhejiang0.3694100.246390.1632150.207111
Jiangxi0.2604120.2184100.2083110.204712
Hubei0.536250.350460.392550.39155
Hunan0.2599130.1682130.1781120.170014
Guangdong0.2762110.260070.1654140.182313
Chongqing0.394380.490730.254290.34616
Sichuan0.2576140.252880.2275100.212210
Shaanxi0.644120.516320.430830.48303
Research institution subjects
Science and technology outputRankingEconomic outputRankingSocial effectRankingInnovation performanceRanking
Beijing0.885410.409810.702010.81141
Tianjin0.263670.274930.016070.27693
Hebei0.2171120.0065120.0012150.169312
Liaoning0.268150.230840.0080100.26184
Jilin0.312530.0092110.0038120.22877
Heilongjiang0.1255150.0001150.0034130.113515
Shanghai0.336420.389420.049320.34572
Jiangsu0.254380.062070.025930.21008
Zhejiang0.2448100.173550.018760.23586
Hubei0.266960.033780.015980.20189
Hunan0.2028130.0063130.0041110.169213
Guangdong0.253090.016090.023950.195010
Chongqing0.1640140.0007140.0019140.142514
Sichuan0.2365110.0125100.024240.190511
Shaanxi0.311140.078560.009090.23685
2016 Year
Enterprise subjects
Science and technology outputRankingEconomic outputRankingSocial effectRankingInnovation performanceRanking
Beijing0.878710.357580.754320.65051
Tianjin0.386160.397940.797610.49294
Hebei0.2441160.1578150.4859110.244914
Liaoning0.385670.2255120.2862160.258013
Jilin0.2992130.1743140.4878100.267312
Heilongjiang0.3388120.1303160.3259150.212816
Shanghai0.559530.458120.709930.54782
Jiangsu0.389750.359570.669940.43066
Zhejiang0.2734140.3213100.582570.348310
Jiangxi0.2733150.2011130.3377140.223915
Hubei0.378080.329190.4739120.34849
Hunan0.367190.2641110.544980.345211
Guangdong0.638920.385550.591260.50183
Chongqing0.3484100.500210.650950.46405
Sichuan0.407740.381360.4004130.36298
Shaanxi0.3417110.456630.512090.40207
University subjects
Science and technology outputRankingEconomic outputRankingSocial effectRankingInnovation performanceRanking
Beijing0.675620.816110.848610.79631
Tianjin0.413070.1874140.246290.207311
Hebei0.1789160.1778160.0856160.079616
Liaoning0.406480.2572100.287260.26417
Jilin0.1927150.1836150.1461150.108615
Heilongjiang0.495960.2077130.281270.27516
Shanghai0.742910.654020.700720.66432
Jiangsu0.591740.459240.325950.40104
Zhejiang0.403690.319170.1523130.23799
Jiangxi0.2415140.2341120.1683110.171213
Hubei0.583150.352750.401230.38345
Hunan0.2659130.2532110.1554120.159714
Guangdong0.3354110.274090.1518140.183712
Chongqing0.3754100.284880.2337100.233610
Sichuan0.3191120.331660.280880.26248
Shaanxi0.619430.503430.383040.43733
Research institution subjects
Science and technology outputRankingEconomic outputRankingSocial effectRankingInnovation performanceRanking
Beijing0.926010.468710.621210.79891
Tianjin0.259680.104350.035430.20255
Hebei0.2284120.017980.0118100.149612
Liaoning0.285360.114440.0058130.21244
Jilin0.307340.0048110.0004150.19766
Heilongjiang0.1136150.0028130.012790.063715
Shanghai0.356920.174920.057120.28032
Jiangsu0.255190.066470.031640.18338
Zhejiang0.2348110.076960.027150.17409
Hubei0.287750.0037120.026260.18437
Hunan0.2251130.0000150.0083120.148613
Guangdong0.2438100.0098100.019880.161011
Chongqing0.1883140.0019140.0026140.120214
Sichuan0.261770.012890.0095110.172010
Shaanxi0.336330.119730.021670.24583
2017 Year
Enterprise subjects
Science and technology outputRankingEconomic outputRankingSocial effectRankingInnovation performanceRanking
Beijing0.974510.355050.666010.70151
Tianjin0.322970.692210.504350.52992
Hebei0.1965160.0859150.1546160.100816
Liaoning0.341850.1896120.3502140.264111
Jilin0.2059150.0878140.535530.217414
Heilongjiang0.2800120.0720160.2501150.161215
Shanghai0.541830.350360.4005100.44753
Jiangsu0.341660.274690.418790.32158
Zhejiang0.2314140.326770.3607120.289710
Jiangxi0.311680.1398130.430960.246513
Hubei0.2981110.440420.423080.38125
Hunan0.3083100.2049110.3913110.263512
Guangdong0.572420.359140.3530130.44664
Chongqing0.2717130.383130.511040.37026
Sichuan0.379540.2579100.619520.36957
Shaanxi0.310290.305980.426070.31779
University subjects
Science and technology outputRankingEconomic outputRankingSocial effectRankingInnovation performanceRanking
Beijing0.738220.738310.903910.87451
Tianjin0.422880.0865120.270380.242410
Hebei0.1649150.0481150.0805160.066516
Liaoning0.476270.469830.309460.42376
Jilin0.1617160.0221160.1602110.097715
Heilongjiang0.544060.0842130.301670.28478
Shanghai0.782610.522420.801120.74892
Jiangsu0.666050.459040.404330.50103
Zhejiang0.3748100.309680.1111150.24309
Jiangxi0.2414140.0687140.1434120.122014
Hubei0.671740.409650.380350.47454
Hunan0.3230120.1041110.1346130.155013
Guangdong0.3264110.1482100.1221140.169612
Chongqing0.390490.356070.1922100.31197
Sichuan0.2788130.239290.219590.239011
Shaanxi0.693330.382060.388440.46935
Research institution subjects
Science and technology outputRankingEconomic outputRankingSocial effectRankingInnovation performanceRanking
Beijing0.994611.000011.000010.99901
Tianjin0.258380.240730.232050.23783
Hebei0.2526110.0091130.0223130.093913
Liaoning0.289660.154150.0801110.18185
Jilin0.303040.053790.0000150.127410
Heilongjiang0.1069150.0264100.114590.051115
Shanghai0.357820.338120.425320.35862
Jiangsu0.269970.066980.268940.17106
Zhejiang0.254990.176040.214460.20194
Hubei0.289850.0054140.197270.13929
Hunan0.1955130.0000150.0131140.062114
Guangdong0.2162120.0201110.340230.14718
Chongqing0.1671140.082570.184080.116511
Sichuan0.2536100.0105120.1120100.109212
Shaanxi0.330030.088060.0616120.16587

References

  1. Yin, S.; Li, B.Z. Academic research institutes-construction enterprises linkages for the development of urban green building: Selecting management of green building technologies innovation partner. Sustain. Cities Soc. 2019, 48, 101555. [Google Scholar] [CrossRef]
  2. Matthies, A.L.; Stamm, I.; Hirvilammi, T.; Närhi, K. Ecosocial innovations and their capacity to integrate ecological, economic and social sustainability transition. Sustainability 2019, 11, 2107. [Google Scholar] [CrossRef]
  3. Liu, Q.; Hu, B. A Study on the Two-way Causal Relationship Between Industrial Structure Evolution and Economic Growth: Empirical Test Based on 40 Years of Reform and Opening-up in China. Glob. J. Emerg. Mark. Econ. 2019, 11, 98–118. [Google Scholar] [CrossRef]
  4. Woo, W.T. China’s soft budget constraint on the demand-side undermines its supply-side structural reforms. China Econ. Rev. 2019, 57, 101111. [Google Scholar] [CrossRef]
  5. Yin, S.; Li, B.Z.; Xing, Z.Y. The governance mechanism of the building material industry (BMI) in transformation to green BMI: The perspective of green building. Sci. Total Environ. 2019, 677, 19–33. [Google Scholar] [CrossRef]
  6. Huang, J.; Cai, X.; Huang, S.; Tian, S.; Lei, H. Technological factors and total factor productivity in China: Evidence based on a panel threshold model. China Econ. Rev. 2019, 54, 271–285. [Google Scholar] [CrossRef]
  7. Capello, R.; Lenzi, C. Regional innovation evolution and economic performance. Reg. Stud. 2019, 53, 1240–1251. [Google Scholar] [CrossRef]
  8. Zhang, J. The Influence of Supply-Side Reform on the Economic Development of Heilongjiang Province-A Residual Auto-Regressive Model Based on Time Series Analysis. In 2019 3rd International Conference on Education, Economics and Management Research (ICEEMR 2019); Atlantis Press: Paris, France, 2019; pp. 71–76. [Google Scholar]
  9. China Science and Technology Development Strategy Research Group, China Innovation and Entrepreneurship Management Research Center, University of Chinese Academy of Sciences. Evaluation Report on China’s Regional Innovation Capability 2018; Scientific and Technical Literature Publishing Press: Beijing, China, 2018. [Google Scholar]
  10. Zhang, L.; Li, C.; Phuong, N.H. Economic Development of Biomass Energy Industry in Heilongjiang Province Based on Analytic Hierarchy Process. Nat. Environ. Pollut. Technol. 2019, 18, 1487–1493. [Google Scholar]
  11. Deng, J.; Zhang, N.; Ahmad, F.; Draz, M.U. Local government competition, environmental regulation intensity and regional innovation performance: An empirical investigation of Chinese provinces. Int. J. Environ. Res. Public Health 2019, 16, 2130. [Google Scholar] [CrossRef]
  12. Riddle, M.; Schwer, R.K. Regional innovative capacity with endogenous employment: Empirical evidence from the U.S. Rev. Reg. Stud. 2003, 33, 73–84. [Google Scholar]
  13. Tura, T.; Harmaakorp, V. Social capital in building regional innovative capabilities: A theoretical and conceptual assessment. ERSA conference papers. Eur. Reg. Sci. Assoc. 2003, 3, 1111–1125. [Google Scholar]
  14. Li, B.Z.; Su, Y. Evaluation of regional scientific and technological innovation capability based on improved mutation series. China Soft Sci. 2012, 6, 90–101. [Google Scholar]
  15. Huang, D.S.; Yang, C. Convergence analysis of regional innovation ability based on spatial effect. Soft Sci. 2017, 31, 44–48. [Google Scholar]
  16. Jin, Q.H.; Yan, T.H. OFDI affects the dynamic threshold effect of regional innovation capacity. Sci. Res. Manag. 2019, 40, 57–66. [Google Scholar]
  17. Yang, R.Y. Market competition, government behavior and regional innovation performance -- an empirical study based on China’s provincial panel data. Res. Manag. 2016, 37, 73–81. [Google Scholar]
  18. Hu, Y.; Wang, X. Analysis on the influence of industrial structure optimization of the Yangtze river economic belt on regional innovation performance. Sci. Technol. Manag. Res. 2019, 39, 86–93. [Google Scholar]
  19. Söderlund, B.; Tingvall, P.G. Capital freedom, financial development and provincial economic growth in china. World Econ. 2017, 40, 764–787. [Google Scholar] [CrossRef]
  20. Barra, C.; Zotti, R. The contribution of university, private and public sector resources to Italian regional innovation system (in) efficiency. J. Technol. Transf. 2018, 43, 1–26. [Google Scholar] [CrossRef]
  21. Hauser, C.; Siller, M.; Schatzer, T.; Walde, J.; Tappeiner, G. Measuring regional innovation: A critical inspection of the ability of single indicators to shape technological change. Technol. Forecast. Soc. Chang. 2018, 1290, 43–55. [Google Scholar] [CrossRef]
  22. Li, B.Z.; Zhou, S. Research on the relationship between innovation behavior and regional innovation performance in research institutes. Sci. Sci. Manag. S T 2015, 36, 75–87. [Google Scholar]
  23. Wang, D.; Zhao, Z.H. Research on the effect of fintech development on regional innovation performance. Stud. Sci. Sci. 2019, 37, 45–56. [Google Scholar]
  24. Xiao, Z.H.; Fan, J.D. Research on the influence of human resources input in science and technology on regional innovation performance. Stud. Sci. Sci. 2019, 37, 1944–1954. [Google Scholar]
  25. Tan, J.T.; Zhang, P.Y.; Li, J. Pattern and development process of urban innovation capacity in Heilongjiang province from 2001 to 2010. Prog. Geogr. 2014, 33, 508–516. [Google Scholar]
  26. Li, N. Problems existing in technology innovation in Heilongjiang province and solutions. Sci. Technol. Innov. Her. 2015, 12, 226–228. [Google Scholar]
  27. Han, Z.L.; Sun, J.Z.; Liu, T.B.; Peng, F.; Zhong, J.Q. The spatial and temporal characteristics of innovative total factor productivity growth and its development trend forecast in the three provinces of northeast China. Sci. Geogr. Sin. 2017, 37, 161–171. [Google Scholar]
  28. Li, J.; Chan, H.L. The influence of R&D personnel flow on regional innovation performance from the perspective of spatial correlation. Chin. J. Manag. 2018, 15, 399–409. [Google Scholar]
  29. Li, X.T.; Zhang, X.Y. Research on the influence mechanism of regional innovation ecosystem on regional innovation performance. Forecasting 2018, 37, 22–28. [Google Scholar]
  30. Deng, R.B. Research on the influence of market distortion of R&D factors on regional innovation performance. Mod. Econ. Res. 2019, 10, 108–116. [Google Scholar]
  31. Liang, Y. Research on Technology Innovation System of Heilongjiang Province; Springer: Berlin, Germany, 2012. [Google Scholar]
  32. Wu, X.H.; Bian, J.L. Comprehensive evaluation of independent innovation capability of large and medium-sized industrial enterprises in Heilongjiang province. Sci. Technol. Manag. Res. 2014, 34, 58–61. [Google Scholar]
  33. Hong, Y. Analysis of regional technology innovation efficiency in Heilongjiang province based on DEA method. North. Econ. Trade 2015, 10, 74–79. [Google Scholar]
  34. Christoph, K. Market-based financing in the cap- ital markets union: The European commission’s proposals to foster financial innovation in the EU. Eur. Co. Financ. Law Rev. 2017, 14, 336–364. [Google Scholar]
  35. Corrado, C.A.; Haskel, J.; Jona-Lasinio, C.; Lommi, M. Intangible capital and growth in advanced economies: Measurement methods and comparative results. Soc. Sci. Electron. Publ. 2012, 7, 225. [Google Scholar]
  36. Vitola, A.; Senfelde, M. Evaluation of institutions in innovation-driven economies. Econ. Sci. Rural Dev. 2015, 17, 94–103. [Google Scholar]
  37. Wang, Z.J.; Mao, L.; Wang, Q. Evaluation and comparative analysis of regional innovation ability in central China. Technol. Econ. 2011, 30, 44–50. [Google Scholar]
  38. Xue, X.D.; Wang, X.Y. Evaluation of agricultural competitiveness in henan province based on principal component analysis. J. Shanxi Agric. Univ. (Soc. Sci. Ed.) 2014, 11, 1163–1167. [Google Scholar]
  39. Shi, J.W.; Wang, Y.Y. Isomorphism of industrial structure in western provinces of China and its determinants-analysis and empirical test based on SIP framework. China Ind. Econ. 2013, 3, 33–45. [Google Scholar]
  40. Yang, W.J. Environmental performance factors of Chinese provincial industries—Empirical analysis based on the inter-temporal DEA-Tobit model. J. Beijing Inst. Technol. (Soc. Sci. Ed.) 2015, 17, 40–48. [Google Scholar]
  41. Li, L.S.; Yang, H.C.; Liu, J. An evaluation study on the comprehensive development capability of China’s regional manufacturing industry-based on the empirical analysis of the manufacturing industry in the eastern, central and western regions. China Soft Sci. 2014, 2, 121–129. [Google Scholar] [CrossRef]
  42. Zhao, L.; Sun, L.Y.; Liu, J. Construction and application of the evaluation system for the sustainable development ability of regional manufacturing industry. Sci. Technol. Prog. Policy 2009, 26, 51–54. [Google Scholar]
  43. Li, L.; Wang, Z. Evaluation and dynamic comparison of green competitiveness of China’s regional manufacturing industry. Inq. Econ. Issues 2017, 1, 64–71. [Google Scholar]
  44. Yu, H.W.; Hu, D.Z. China regional manufacturing quality competitiveness evaluation and analysis of influencing factors. Chin. J. Manag. 2015, 12, 1703–1709. [Google Scholar]
  45. Cao, H.; Shi, B.F.; Zhao, K. Evaluation and demonstration of green innovation ability at provincial level in China. Chin. J. Manag. 2016, 13, 1215–1222. [Google Scholar]
  46. Feng, Z.J. A study on the efficiency of green innovation in Chinese industrial enterprises. Forum Sci. Technol. China 2013, 1, 82–88. [Google Scholar]
  47. Li, L.S.; Cheng, Z.H.; Liu, J. Research on the new type of Chinese manufacturing industry and its evaluation. China Ind. Econ. 2015, 2, 63–75. [Google Scholar]
  48. Rudskaya, I.A.; Dmitry, R. Comprehensive evaluation of Russian regional innovation system performance using a two-stage econometric model. Rev. Espac. 2018, 39, 40. [Google Scholar]
  49. Antonopoulos, I.S.; Zouboulis, A.; Samaras, P.; Karagiannidis, A. Indicators and options towards sustainability in industrial zones. Int. J. Innov. Sustain. Dev. 2013, 7, 215–232. [Google Scholar] [CrossRef]
  50. Brzezinski, D.; Stefanowski, J. Combining block-based and online methods in learning ensembles from concept drifting data streams. Inf. Sci. 2014, 265, 50–67. [Google Scholar] [CrossRef]
  51. Sahin, U. Forecasting of Turkey’s greenhouse gas emissions using linear and nonlinear rolling metabolic grey model based on optimization. J. Clean. Prod. 2019, 239, 118079. [Google Scholar] [CrossRef]
  52. Jiao, J.; Wei, M.; Yuan, Y.; Zhao, T. Risk quantification and analysis of coupled factors based on the DEMATEL model and a bayesian network. Appl. Sci. 2020, 10, 317. [Google Scholar] [CrossRef]
  53. Hansen, M.T.; Julian, B. The innovation value chain. Harv. Bus. Rev. 2017, 85, 121. [Google Scholar]
  54. Xing, X.; Wang, J.; Tou, L. The relationship between green organization identity and corporate environmental performance: The mediating role of sustainability exploration and exploitation innovation. Int. J. Environ. Res. Public Health 2019, 16, 921. [Google Scholar] [CrossRef]
  55. Ratti, R.; Bramanti, A.; Gordon, R. The Dynamics of Innovative Regions: The GREMI Approach; Routledge: Abingdon, UK, 2019. [Google Scholar]
  56. Yang, J.; Su, J.; Song, L. Selection of manufacturing enterprise innovation design project based on consumer’s green preferences. Sustainability 2019, 11, 1375. [Google Scholar] [CrossRef]
  57. Asheim, B.T.; Isaksen, A.; Trippl, M. Advanced Introduction to Regional Innovation Systems; Edward Elgar Publishing: Cheltenham, UK, 2019. [Google Scholar]
  58. Lim, S.; Kim, J. Technology Portfolio and Role of Public Research Institutions in Industry 4.0: A Case of South Korea. Appl. Sci. 2019, 9, 2632. [Google Scholar] [CrossRef]
Figure 1. The construction of a regional innovation performance evaluation model.
Sustainability 12 02739 g001
Figure 2. The framework of key factor selection process based on Grey-DEMATEL model.
Sustainability 12 02739 g002
Figure 3. Dynamic comprehensive evaluation of regional overall innovation performance in the six big triangles. (Note: Data from Appendix C). (a) The level of science and technology output in the six major triangle regions; (b) The level of regional economic output in the six major triangle regions; (c) The level of regional social effect in the six big triangles; (d) The performance level of regional innovation in the six big triangles.
Sustainability 12 02739 g003aSustainability 12 02739 g003b
Figure 4. Dynamic comprehensive evaluation of the science and technology output level of the subject in the six big triangles. (Note: Data from Appendix C). (a) The level of science and technology output of enterprises in the six major triangle regions; (b) The science and technology output level of regional universities in the six big triangles; (c) The level of science and technology output of regional research institutions in the six major triangle regions.
Sustainability 12 02739 g004aSustainability 12 02739 g004b
Figure 5. Dynamic comprehensive evaluation of economic output level of the subject in the six big triangles. (Note: Data from Appendix C). (a) The level of economic output of regional enterprises in the six major triangle regions; (b) The level of economic output of regional universities in the six big triangles; (c) The level of economic output of regional research institutions in the six major triangle regions.
Sustainability 12 02739 g005aSustainability 12 02739 g005b
Figure 6. Dynamic comprehensive evaluation of the social effect level of the subject in the six big triangles. (Note: Data from Appendix C). (a) The social effect level of enterprises in six big triangles; (b) The social effect level of universities in six big triangles; (c) The social effect level of regional research institutions in the six big triangles.
Sustainability 12 02739 g006
Figure 7. Dynamic comprehensive evaluation of innovation performance level of each subject in the six big triangles. (Note: Data from Appendix C). (a) The innovation performance of regional enterprises in the six big triangles; (b) The innovation performance level of regional universities in the six big triangles; (c) The innovation performance level of regional research institutions in the six big triangles.
Sustainability 12 02739 g007aSustainability 12 02739 g007b
Figure 8. The cause-center distribution of regional innovation performance. (Note: Data from Table 8).
Sustainability 12 02739 g008
Figure 9. The cause-center distribution of regional enterprise innovation performance. (Note: Data from Table 9).
Sustainability 12 02739 g009
Figure 10. The cause-center distribution of regional universities’ innovation performance. (Note: Data from Table 10).
Sustainability 12 02739 g010
Figure 11. The cause-center distribution of regional research institutions’ innovation performance. (Note: Data from Table 11).
Sustainability 12 02739 g011
Table 1. Experts evaluate semantic variables.
Semantic VariableGrey NumberEvaluation Value
No (N)[0.00, 0.00]1
Very Low (VL)(0.00, 0.25)2
Low (L)[0.25, 0.50)3
High (H)[0.50, 0.75)4
Very High (VH)[0.75, 1.00]5
Table 2. The weighted semantic variables.
Semantic VariableGrey Number
Not Important (NI)[0.0, 0.3]
Little Important (LI)[0.3, 0.5]
Important (I)[0.4, 0.7]
Much Important (MI)[0.5, 0.9]
Very Important (VI)[0.7, 1.0]
Table 3. The grey number weights of the six experts.
ExpertsWeighted Grey Numeral
University researcher 1[0.7, 1.0]
University researcher 2[0.3, 0.5]
Corporate executive 1[0.7, 1.0]
Corporate executive 2[0.4, 0.7]
Head of government department 1[0.5, 0.9]
Head of government department 2[0.3, 0.5]
Table 4. Comprehensive dynamic evaluation index system of regional overall innovation performance.
Main CriteriaSubcriteriaCriteria UnitCriteria Attribute
Science and technology outputNumber of invention patents authorized per 10,000 R&D personnelA/ten thousand+
Number of patents authorized per 10,000 R&D personnelA/ten thousand+
The proportion of the number of invention patent applications in the number of patent applications%+
The number of scientific and technological papers included in the main retrieval tools abroad per 10,000 R&D personnelArticle/ten thousand+
Trademark ownership per hundred enterprisesA/hundred+
Economic outputNew product sales revenue in the main business income proportion%+
Technology market turnover accounted for the proportion of gross domestic product%+
Income from patent ownership transfer and licensing per 10,000 R&D personnelTen thousand yuan/ten thousand yuan+
Technical achievement turnover per 10,000 R&D personnelHundred million yuan/ten thousand people+
High-tech exports accounted for the proportion of exports%+
Social effectEnergy consumption per unit GDPTen thousand tons of standard coal/hundred million yuan
Regional GDP per capitaHundred million yuan/ten thousand people+
Comprehensive utilization rate of industrial solid waste%+
The unemployment rate%+
Labor productivityHundred million yuan/ten thousand people+
Table 5. Dynamic evaluation index system of regional enterprise innovation performance.
Main CriteriaSubcriteriaCriteria UnitCriteria Attribute
Science and technology outputNumber of valid invention patents per 10,000 R&D personnelA/ten thousand+
Number of patent applications per 10,000 R&D personnelA/ten thousand+
The proportion of the number of invention patent applications in the number of patent applications%+
Trademark ownership per hundred enterprisesA/hundred+
Economic outputNew product sales revenue in the main business income proportion%+
Patent ownership transfer and licensing revenue per hundred enterprisesRMB 10,000/100+
High-tech exports accounted for the proportion of exports%+
Number of new product development projects per 100 enterprisesA/hundred+
Social effectComprehensive utilization rate of industrial solid waste%+
Labor productivity in high-tech industriesRMB ten thousand/person+
Energy consumption per unit GDPTen thousand tons of standard coal/hundred million yuan
The number of national or industry standards formed for each hundred enterprisesItem/hundred+
Table 6. Dynamic evaluation index system of regional universities’ innovation performance.
Main CriteriaSubcriteriaCriteria UnitCriteria Attribute
Science and technology outputThe number of scientific and technological papers per 10,000 R&D personnelArticle/ten thousand+
Number of scientific and technological publications per 10,000 R&D personnelA/ten thousand+
Number of effective invention patents per 10,000 R&D personnelA/ten thousand+
The proportion of the number of invention patent applications in the number of patent applications%+
Economic outputThe contract amount of technology transfer per 10,000 R&D personnelThousand yuan/ten thousand people+
Income from patent ownership transfer and licensing per 10,000 R&D personnelTen thousand yuan/ten thousand yuan+
The proportion of the transfer of patent ownership and license income in the contract value of technology transfer%+
The number of projects of R&D achievement application and technology service in each universityItem/home+
Social effectScientific and technological progress award for each department of the state council of each universityItem/home+
Each university attends international conferences and exchangesM/home+
The number of graduate students per 10,000 R&D personnelTen thousand+
Table 7. Dynamic evaluation index system of regional research institutions’ innovation performance.
Main CriteriaSubcriteriaCriteria UnitCriteria Attribute
Science and technology output The number of scientific and technological papers per 10,000 R&D personnelArticle/ten thousand+
Number of scientific and technological publications per 10,000 R&D personnelA/ten thousand+
Number of effective invention patents per 10,000 R&D personnelA/ten thousand+
The proportion of the number of invention patent applications in the number of patent applications%+
Economic outputIncome from patent ownership transfer and licensing per 10,000 R&D personnelTen thousand yuan/ten thousand yuan+
Social effectEach research institute forms a national or industry standard numberItem/home+
Table 8. The overall comprehensive influence of the region.
SymbolRow SumColumn SumCentralityCause DegreeFactors
C16.3256.36212.687−0.037Number of invention patents authorized per 10,000 R&D personnel
C25.6946.84312.537−1.149Number of patents authorized per 10,000 R&D personnel
C37.3547.41814.772−0.064The proportion of the number of invention patent applications in the number of patent applications
C46.9847.06514.049−0.081The number of scientific and technological papers in foreign countries is mainly included for each 10,000 R&D personnel
C57.3397.38114.720−0.042Trademark ownership per hundred enterprises
C67.7957.94715.742−0.152New product sales revenue in the main business income proportion
C77.8497.35315.2020.496Technology market turnover accounted for the proportion of gross domestic product
C86.8647.53414.398−0.670Income from patent ownership transfer and licensing per 10,000 R&D personnel
C97.8687.31815.1860.550Technical achievement turnover per 10,000 R&D personnel
C107.7947.11314.9070.681High-tech exports accounted for the proportion of exports
C117.1917.36214.553−0.171Energy consumption per unit GDP
C127.8327.23515.0670.597Regional GDP per capita
C137.6497.05614.7050.593Comprehensive utilization rate of industrial solid waste
C147.1417.55314.694−0.412The unemployment rate
C156.1576.96813.125−0.811Labor productivity
C167.8545.98113.8351.873Degree of marketization
C177.3655.67313.0381.692The financial environment
C187.1376.08613.2231.051Intellectual property system
C197.7346.69414.4281.040Transformation of scientific and technological achievements
C207.5656.49214.0571.073Human capital level
Note: Data from 2010–2018 yearbook of science and technology statistics.
Table 9. Comprehensive influence of regional enterprises.
SymbolRow SumColumn SumCentralityCause DegreeFactors
C16.1646.28612.450−0.122Number of valid invention patents per 10,000 R&D personnel
C26.8646.59413.4580.270Number of patent applications per 10,000 R&D personnel
C36.5316.67213.203−0.141The proportion of the number of invention patent applications in the number of patent applications
C46.9277.03613.963−0.109Trademark ownership per hundred enterprises
C57.4847.82315.307−0.339New product sales revenue in the main business income proportion
C67.6427.05414.6960.588Patent ownership transfer and licensing revenue per hundred enterprises
C76.0367.02213.058−0.986High-tech exports accounted for the proportion of exports
C87.8357.13614.9710.699Number of new product development projects per 100 enterprises
C96.8687.25214.120−0.384Comprehensive utilization rate of industrial solid waste
C107.8947.54515.4390.349Labor productivity in high-tech industries
C116.0387.03213.070−0.994Energy consumption per unit GDP
C126.7317.33114.062−0.600The number of national or industry standards formed for each hundred enterprises
C137.9846.25614.2401.728Enterprise research investment
C148.0236.84314.8661.180Enterprise human resources input
C157.6846.51814.2021.166Enterprise management system
C167.0516.11613.1670.935Organizational structure
C177.1136.25413.3670.859Enterprise R&D equipment
Note: Data from 2010–2018 yearbook of science and technology statistics.
Table 10. Comprehensive influence of regional universities.
SymbolRow SumColumn SumCentralityCause DegreeFactors
C17.2487.32814.576−0.080The number of scientific and technological papers per 10,000 R&D personnel
C26.2386.35912.597−0.121Number of scientific and technological publications per 10,000 R&D personnel
C37.4967.05414.5500.442Number of effective invention patents per 10,000 R&D personnel
C46.2646.28412.548−0.020The proportion of the number of invention patent applications in the number of patent applications
C56.5847.68414.268−1.100The contract amount of technology transfer per 10,000 R&D personnel
C67.3256.64813.9730.677Income from patent ownership transfer and licensing per 10,000 R&D personnel
C76.0237.01213.035−0.989The proportion of the transfer of patent ownership and license income in the amount of technology transfer
C86.9517.63414.585−0.683The number of projects of R&D achievement application and technology service in each university
C97.2067.51314.719−0.307Scientific and technological progress award for each department of the state council of each university
C107.3056.02613.3311.279Each university attends international conferences and exchanges
C117.7647.56415.3280.200The number of graduate students per 10,000 R&D personnel
C127.2986.16513.4631.133Including scientists and engineers in R&D full-time staff
C137.5356.24813.7831.287The number of senior titles in teaching and research personnel
C147.0356.03413.0691.001Total internal expenditure in the expenditure of science and technology funds
Note: Data from 2010–2018 yearbook of science and technology statistics.
Table 11. Comprehensive influence of regional research institutions.
SymbolRow SumColumn SumCentralityCause DegreeFactors
C16.0236.23412.257−0.211The number of scientific and technological papers per 10,000 R&D personnel
C27.3167.33514.651−0.019Number of scientific and technological publications per 10,000 R&D personnel
C37.2016.98414.1850.217Number of effective invention patents per 10,000 R&D personnel
C47.2467.46714.713−0.221The proportion of the number of invention patent applications in the number of patent applications
C56.9167.90414.820−0.988Income from patent ownership transfer and licensing per 10,000 R&D personnel
C66.9238.01714.940−1.094Each research institute forms a national or industry standard number
C77.8126.76714.5791.045Total number of personnel engaged in R&D activities (R&D)
C87.2346.05413.2881.180Scientific research instruments and equipment above 100,000 yuan
C97.0666.14313.2090.923Number of national or departmental recognized qualifications and institutions
Note: Data from 2010–2018 yearbook of science and technology statistics.