Abstract
Rapid urbanization has affected the eco-environment in China. A clear understanding of the coupling relationship between urbanization quality and eco-environment pressure is needed for sustainable urban development. This study focused on the relationship between urbanization quality and eco-environment pressure in the West Taiwan Strait Urban Agglomeration (WTSUA) with panel data collected from 2003 to 2017. An index system was established to measure urbanization quality from four urbanization subsystems: demographic urbanization, spatial urbanization, economic urbanization, and social urbanization. An index of eco-environment pressure was developed from resource availability, energy consumption, pollution emissions, and pressure response. The level of urbanization quality and eco-environment pressure was assessed using analytic hierarchy process (AHP) and entropy method (EM). The coupling process was described using a coupling coordination degree model. Results showed the following: (1) Economic urbanization contributed the most to urbanization quality. The contribution of the four subsystems to eco-environment pressure was similar. (2) Eco-environment pressure decreased with improving urbanization quality. The coupling coordination degree between urbanization quality and eco-environment pressure increased. Spatially, the coupling coordination degree of eastern cities was higher than that of western cities. The findings of this paper will help government in planning and implementing sustainable urban development and eco-environment conservation.
1. Introduction
Urbanization is one of the most important human activities to affect the earth [1]. At present, more than 50% of the population lives in cities in the world, and this proportion is growing rapidly [2]. Urbanization promotes global economic growth, affects regional resources, and changes the natural environment on several scales [3,4]. China has experienced high rates of economic prosperity and urban population growth, and the urbanization process has increased in speed significantly since ‘reform and opening-up’ of China in 1978 [5]. In 2018, the proportion of China’s urban population was 56.1%, with an increase of 38.2 percentage points compared with 1978 [6]. However, severe challenges have emerged during the process of urbanization, including regional economic disparity, environmental pollution intensification, excessive resource consumption, and increasing traffic congestion [7,8,9,10]. The conflict between urban growth and eco-environment sustainability has become increasingly obvious. Therefore, understanding how to coordinate urbanization and eco-environmental protection is crucial for promoting coordinated, stable and sustainable development that balances the regional economy, society, and eco-environment.
Assessment and analysis of the relationship between urbanization and the eco-environment have attracted attention from researchers and policymakers. Many studies have been conducted using different methods and models—both equalization and quantitation [11,12,13]. Previous studies on urbanization have concentrated on population. For example, the relationship between the urban population and ecological footprint was analyzed in the Middle East and North African region, and urbanization was considered a significant factor leading to environmental degradation [14]. In developing countries, Martínez-Zarzoso [15] examined the relationship between urbanization and carbon emissions and found that the relationship between urbanization and CO2 emissions followed an inverted-U shape. Urbanization reflects social and economic change closely, including extensive changes in land-use, demographic migration, lifestyle, and industrial structure [16]. Consequently, the phenomenon of urbanization should be treated with a more comprehensive view. Studying urbanization quality has become a focus, as this can reflect the essential characteristics of urbanization in relation to the economy, society, eco-environment, and other aspects. In recent years, a comprehensive index system has been introduced to measure urbanization quality [17,18]. In Guangdong province, an index system of urbanization quality was established that comprehensively considered the elements associated with urbanization quality in terms of population, economy, society, and space, and the coupling relationship between urbanization quality and energy-environment efficiency were quantified [2]. Zang and Su [19] proposed an indicator system of urbanization quality including economy, population, public services and ecology to analyze the spatiotemporal evolution of the internal coordination degree of urbanization in 283 prefecture-level cities in China. Existing research has focused on the effects of urbanization on eco-environment [20,21,22,23] and the relationship between urbanization and eco-environment [24,25,26], and the interaction mechanism between urbanization and the eco-environment has been explained. Zhao et al. used an improved environmental Kuznets curve (EKC) model to study the relationship between urbanization and the eco-environment in the Yangtze River Delta region, and the result showed that the coordination coupling relationship between urbanization and eco-environment conformed to the s-shaped curve [27]. In a study of the Beijing–Tianjin–Hebei region, the relationship between urbanization and eco-environment presented a double-exponential curve with an inverted u-shaped curve, which verified that there was an interactive coercing effect between them [16]. Additionally, studies on urbanization and eco-environment are mostly focused on developed areas in China, such as the Beijing–Tianjin–Hebei region [28,29], Shanghai [30] and Wuhan [31], with few studies on emerging urban agglomerations. There is an urgent need to analyze changes with respect to urbanization quality and eco-environment pressure in new and developing regions, and identify the interaction mechanism between the two. This will provide theoretical guidelines and suggestions for policymakers in the formulation of urban development and environmental conservation policy.
The West Taiwan Strait Urban Agglomeration (WTSUA) is one of the most dynamic growth areas in China. In recent years, the WTSUA has suffered from several eco-environment pressures. However, there is little research into the relationship between urbanization quality and eco-environment pressure. Therefore, the objectives of this study are to: (1) evaluate the urbanization quality and eco-environment pressure for the WTSUA from 2003 to 2017; (2) analyze the spatiotemporal dynamics of urbanization quality and eco-environment pressure; (3) reveal the characteristics of the coupling coordination relationship between urbanization quality and eco-environment pressure; and (4) propose more feasible urban development policies and environment protection proposals. To fulfill these objectives, a comprehensive evaluation method based on the analytic hierarchy process (AHP) and entropy method (EM) was applied to assess urbanization quality and eco-environment pressure. The dynamic coupling process between urbanization quality and eco-environment pressure was described using a coupling coordination degree model.
2. Materials and Methods
2.1. Study Area
The WTSUA is located on the southeast coast of China (Figure 1). The latitude ranges from 113.86° to 121.23° E and the longitude ranges from 22.82° to 29.57° N. It covers 0.27 million km2 and accounts for 2.8% of China’s territory. The urban agglomeration covers 20 cities across Fujian, Zhejiang, Guangdong, and Jiangxi provinces and five cities (Fuzhou, Quanzhou, Xiamen, Wenzhou, and Shantou) were taken as the core cities. Table 1 shows the basic information for each city of the WTSUA [32].
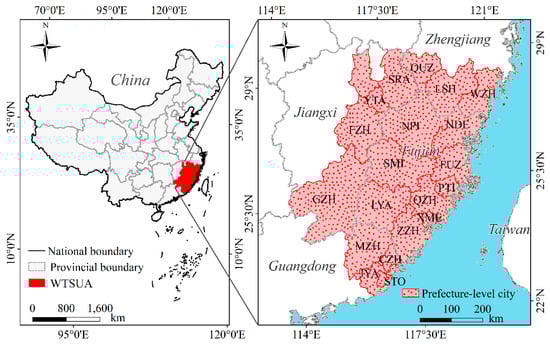
Figure 1.
Location of the study area (WTSUA represents the West Taiwan Strait Urban Agglomeration, FUZ represents Fuzhou, XME represents Xiamen, PTI represents Putian, SMI represents Sanming, QZH represents Quanzhou, ZZH represents Zhangzhou, NPI represents Nanping, LYA represents Longyan, NDE represents Ningde, STO represents Shantou, JYA represents Jieyang, CZH represents Chaozhou, MZH represents Meizhou, WZH represents Wenzhou, LSH represents Lishui, QUZ represents Quzhou, FZH represents Fuzhou, SRA represents Shangrao, YTA represents Yingtan, GZH represents Ganzhou).

Table 1.
Basic information description for each city of the WTSUA.
The WTSUA was first proposed in the “National Urban System Planning” in 2006 and became one of the eight major urban agglomerations supporting national development [33]. The WTSUA has undergone rapid urbanization by virtue of its geographical location and mild climate. The population increased from 85.14 million in 2003 to 96.06 million in 2018, with a growth rate of 12.8%. At the end of 2018, the urbanization rate of the urban agglomeration was 61.42%, which was higher than the average level of China. The GDP was 5.87 trillion Yuan, accounting for 6.5% of the national GDP. The ratio of the three industrial structures was 7:47:46, and light industry accounted for a larger proportion than heavy industry. About 80% of land is still covered by forests in the WTSUA, which carries a wealth of biodiversity resources and offers more ecological advantages than some other areas.
2.2. Evaluation Index System of Urbanization Quality and Eco-environment Pressure
To accurately evaluate the relationship between urbanization quality and eco-environment pressure for the WTSUA, comprehensive index systems of urbanization quality and eco-environment pressure were established based on objective scientific principles. The index system of urbanization quality was established from the four dimensions of population growth, spatial expansion, economic development and life improvement to evaluate the level of urbanization quality [34], which corresponded to the four subsystems of demographic urbanization, spatial urbanization, economic urbanization, and social urbanization, and 10 basic level indicators were selected (Table 2). A comprehensive index system of eco-environment pressure included four subsystems (resource availability, energy consumption, pollution emissions, and pressure response) and 12 basic level indicators [27,35] (Table 3).
Table 2.
Evaluation index system of urbanization quality.
Table 3.
Evaluation index system of eco-environment pressure.
2.3. Comprehensive Assessment Combining EM and AHP
A combination of EM and AHP was used in this study to determine the weight of each indicator in the urbanization quality system and the eco-environment pressure system. EM is an objective weighting method that is not disproportionally influenced by experts’ subjective opinion [37]. For the objective weighting method, the EM is far more widely used than any of the other techniques [38,39,40]. EM determines the indicator’s weight based on the information size of each indicator by fully mining the information of the original data [41]. The greater the relative change in the indicator, the higher the weight [42]. Thus, the results have a strong theoretical and mathematical basis [43]. The AHP method, as a multi-objective decision analysis approach, quantifies expert empirical judgments to determine the index weights by combining quantitative and qualitative analysis, which has higher rationality [43,44,45,46]. Thus, combining the EM and AHP methods to determine the weight of each index can improve the accuracy of the weight and the credibility of the evaluation results. The flowchart of comprehensive evaluation combining EM and AHP was illustrated as Figure 2.
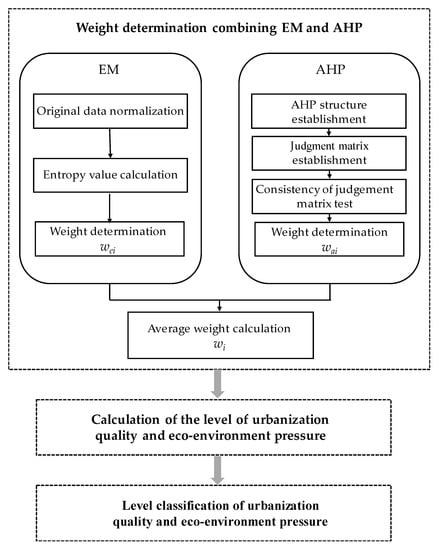
Figure 2.
Flowchart of comprehensive evaluation combining the entropy method (EM) and analytic hierarchy process (AHP).
Step 1: Weight determination using EM
To eliminate differences in each indicator in dimension, magnitude, and sign, the maximum–minimum method was adopted to normalize the original data, so that the data were limited to a range of [0, 1] [47]. The higher the value of indicator, the better the system efficiency. If a variable was a positive indicator, which showed that the indicator could contribute positively to the system, Equation (1) was selected to standardize the data. If the variable was a negative indicator, Equation (2) was chosen. After normalization of the original data, a matrix (H) of evaluation indicators (Equation (3)) was established. Then, the entropy value and weight of each indicator were calculated by Equations (4)–(6), in turn [48]:
where xij is the original value of the ith (i = 1, …, m) indicator for the jth year (j = 1, …, n), hij is the normalized value of ith indicator, minxi is the minimum of xi, maxxi is the maximum of xi, Xij represents the proportion of the ith indicator in the jth year, Si is the entropy value of the ith indicator, wei is the weight of the ith indicator.
Step 2: Weight determination using AHP
First, the established index systems of urbanization quality and the eco-environment pressure were regarded as an AHP structure. Second, the judgment matrix of the indicators for each hierarchy was established. Finally, the consistency index (CI), the corresponding average random consistency index (RI), and the consistency ratio (CR) were calculated to test the judgement matrix’s consistency and determine the weight of indicators at each level. When CR < 0.01, the ranking results based on AHP present a desirable consistency, that is, the allocation method of weight coefficient is feasible. Otherwise, the values of the matrix’s element need to be adjusted and the weight coefficients reassigned [42]. The different order of each judgment matrix determines the corresponding average random consistency index of RI. CI and CR can be calculated by Equations (7) and (8):
where λmax is the highest real eigenvalue, n is the number of factors, CR represents the consistency coefficient, RI is the average random consistency indicator, and CI is the consistency indicator.
Step 3: Calculation of the level of urbanization quality and eco-environment pressure
According to the normalized value and weight of each indicator, the level of urbanization quality and eco-environment pressure were calculated by weighted summation. The formula is as follows:
where wei is the weight of the ith indicator using EM, wai is the weight of the ith indicator using AHP, wi is the average weight of the ith indicator combined with AHP and EM, Fj represents comprehensive level in the jth year, hij is the normalized value of the ith indicator.
Step 4: Level classification of urbanization quality and eco-environment pressure
To clearly describe the spatial distribution characteristics of urbanization quality and eco-environment pressure within each dimension in the WTSUA, an equal interval method was adopted to analyze the level of urbanization quality and eco-environment pressure in 20 prefecture-level cities in this study. Specifically, the value of urbanization quality was divided into 0.118–0.280, 0.281–0.443, 0.444–0.606, and 0.607–0.770, which correspond to the level of very poor, poor, moderate, and good, respectively [49,50,51]. The value of eco-environment pressure was divided into 0.158–0.236, 0.237–0.315, 0.316–0.394, and 0.395–0.473, which correspond to the level of good, moderate, poor, and very poor, respectively.
2.4. Coupling Coordination Degree Model
A coupling coordination degree model was used in this study to accurately estimate the coordination level and relationship between the urbanization quality and eco-environment pressure. The coupling coordination degree model can be calculated by Equations (10)–(12):
where C defines the coupling degree of urbanization quality and eco-environment pressure, f(UQ) and g(EP) are the comprehensive level of urbanization quality and eco-environment pressure, respectively. D represents the coupling coordination degree, T shows the comprehensive coordination index of urbanization quality and eco-environment pressure, α and β stand for the contributions of urbanization quality and eco-environment pressure, respectively. The contributions of the two systems should be the same, thus the values of α and β are equal to 0.5 [52].
3. Results
3.1. Contribution of Each Variable to Urbanization Quality and Eco-Environment Pressure
The weight of each indicator in the urbanization quality system and eco-environment pressure system calculated by the AHP and EM methods are shown in Table 4. For the urbanization quality subsystem, economic urbanization accounted for the highest proportion (32.1%), which indicates that it had the biggest influence on urbanization quality. This was followed by social urbanization, demographic urbanization, and spatial urbanization, with weights of 26.1%, 25.8%, and 16.0%, respectively. In terms of the basic level index, the three factors of urban population density (16.7%), GDP per capita (12.2%), and proportion of the value of the secondary and tertiary industry to GDP (10.9%) accounted for 39.8% of the total impact. This indicated that they were important influences on the urbanization quality in the WTSUA. For the eco-environment pressure subsystem, the contribution of the four subsystems to eco-environment pressure was similar, which indicated that the roles of all four subsystems were equally important. In terms of the basic level index, green areas occupied the highest proportion, and other indicators accounted for 8.1‒8.5%, with little difference among them.
Table 4.
The indicator weight of urbanization quality and eco-environment pressure.
3.2. Spatiotemporal Pattern of Urbanization Quality and Eco-Environment Pressure
Figure 3 illustrates the dynamic changes of urbanization quality and eco-environment pressure and the level of their subsystem from 2003 to 2017. The level of urbanization quality of the study area showed an increase, with a change rate of 100% from 2003 to 2017 (Figure 3a). The four subsystems of urbanization quality exhibited the same trend with varying rates of growth. Economic urbanization grew the fastest, increasing by 207.77% from 2003 to 2017. This was followed by a significant trend of social urbanization, which increased by 96.73% from 2003 to 2017. Demographic urbanization also grew steadily. The level of demographic urbanization was higher than the other three subsystems from 2003 to 2010. The level of spatial urbanization was the lowest and the development trend was slow. In general, the level of eco-environment pressure from urban agglomeration showed a downward trend (Figure 3b). However, the four subsystems of eco-environment pressure showed different trends. The resource availability curve and pressure response curve showed a downward trend, and the downward trend of the response control curve was significant. This suggested that the pressure on the background resources has been reduced during the study period and environmental protection has been strengthened. Conversely, the energy consumption showed an upward trend, which indicates that the use of energy was increasing. The pollution emission curve first increased and then decreased, indicating that pollution emissions in the study area had been controlled to a certain extent since 2015.
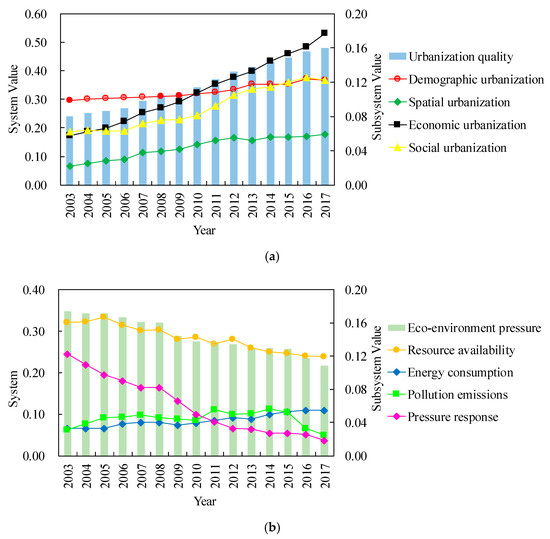
Figure 3.
The dynamic changes of urbanization quality and eco-environment pressure and the levels of their subsystems from 2003 to 2017. (a) The dynamic changes of the level of urbanization quality and four subsystems from 2003 to 2017; (b) The dynamic changes of the level of eco-environment pressure and four subsystems from 2003 to 2017.
The grading results and spatial differentiation of urbanization quality and eco-environment pressure in different periods in the WTSUA are displayed in Figure 4. The urbanization quality increased from east to west across the urban agglomeration (Figure 4a). Cities with high urbanization quality were concentrated in the eastern coastal region, while the urbanization quality was lower in the central and western inland cities. The urbanization quality in core cities was significantly higher. In 2017, for example, the four core cities except STO were all at the “good” level. Additionally, the number of cities with an eco-environment pressure at the “good” level increased from 0 to 15, accounting for 75% of all cities in 2017 (Figure 4b). The number of cities with an eco-environment pressure below the “moderate” level decreased from 14 to 1. The eco-environment pressure in the study area showed significant differences between 2003 and 2008. The cities with the highest eco-environment pressure were mostly distributed in the southwest of the urban agglomeration, that is, the cities of Jiangxi and Guangdong provinces. The core cities of WZH and STO also showed high pressure. In 2013, the eco-environment pressure of each city in the study area had gradually decreased. In 2017, there was a narrowing of the differences in eco-environment pressure among the cities. The eco-environment pressure of most cities in the study area was at the “good” level, while the eco-environment pressure of core cities was still relatively high.
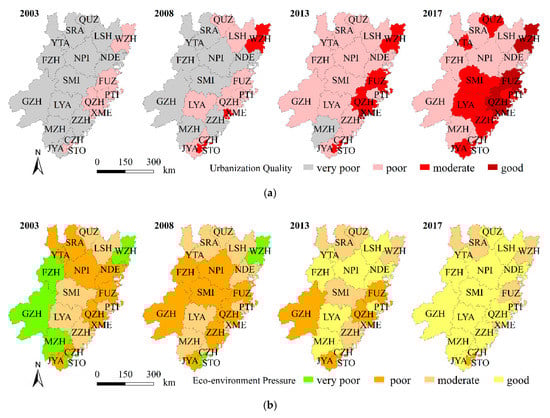
Figure 4.
Spatial distribution characteristics of urbanization quality and eco-environment pressure in different periods in the WTSUA. (a) Spatial distribution characteristics of urbanization quality in 2003, 2008, 2013, and 2017; (b) Spatial distribution characteristics of eco-environment pressure in 2003, 2008, 2013, and 2017.
3.3. Coupling Coordination Relationship between Urbanization Quality and Eco-Environment Pressure
Figure 5 illustrates the coupling coordination degree between urbanization quality and eco-environment pressure in spatial and temporal dimensions. It was found that the coupling coordination degree between urbanization quality and eco-environment pressure presented a general increase during the study period, which indicated that eco-environment pressure was decreasing with the continuous improvement urbanization quality.
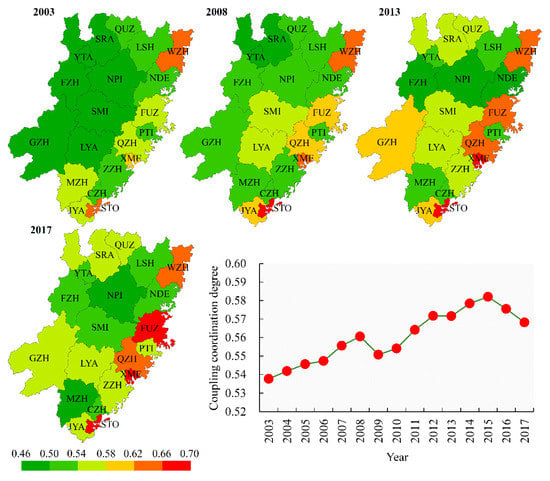
Figure 5.
Spatiotemporal dynamics of coupling coordination degree between urbanization quality and eco-environment pressure in the WTSUA from 2003 to 2017.
Despite some spatial disparities, as for each city, the coupling coordination degree between urbanization quality and eco-environment pressure mostly presented an increase between 2003 and 2017. The coupling coordination degree of the eastern cities was higher than that of the western cities, which was consistent with the distribution pattern of urbanization quality. Compared with non-core cities, the core cities had a higher coupling coordination degree.
4. Discussion
4.1. Interaction Coupling Mechanism between Urbanization Quality and Eco-Environment Pressure
The internal development law of urbanization quality is consistent with the conditions of synergetics [53]. Urbanization quality involves multidimensional meanings, including population growth, economic development, spatial expansion, and public services [41,54]. They are interrelated and interact, and ultimately affect the overall effect. Population is an underlying factor to promote the interaction of elements in the urbanization quality system [19]. Our results showed that the level of demographic urbanization was higher than the other three subsystems before 2010. The continuous influx of population from rural areas into urban areas greatly stimulated investment and consumption, as well as promoting economic development. At the same time, urban space was expanding and the spatial structure was changing to meet the space requirements brought about by population agglomeration. With the gradual development of the economy and the improvement of the people’s economic level, people had higher demand for the city’s development. Urban public services and infrastructure were gradually improved, which provided a good foundation for urban economic development, and thus drove more rural people to migrate to the cities. Because of the interactions between the urbanization quality subsystems, a benign development situation has formed, in general. In the WTSUA, our results suggested that the overall level of urbanization quality showed an increase tendency, with a change rate of 100% from 2003 to 2017 (Figure 3a).
In the early days of urban development, a series of associated issues arose by the weak awareness of eco-environment protection [55,56,57], which had a destructive effect on the eco-environment. Facing severe challenges brought about by eco-environmental problems from urban development, several national plans and policies have been promulgated to reduce the eco-environment pressure. Figure 6 illustrates China’s pivotal environment conservation plans and policies in different periods. The “Decision of the State Council on Several Issues Concerning Environmental Protection” was proposed in 1996, requiring “the control of total pollutant emissions to be implemented” [58]. The National “10th Five-Year Plan,” “11th Five-Year Plan,” and “12th Five-Year Plan” were subsequently implemented, which focused on adjusting the economic structure to reduce pollutant emissions [59]. Furthermore, the increase of investment in environmental protection is conducive to the construction of environmental infrastructure. Data show that, during the “11th Five-Year Plan” period, the national urban sewage treatment rate increased from 52% to 72%, and the hazard-free treatment rate of domestic garbage increased from 52% to 78% [58]. Driven by these policies, environmental protection has been continuously strengthened in the WTSUA. In 2012, the construction of ecological civilization was written into the “Party Constitution” and this accelerated environmental policy reform further [60]. An environmental protection tax levy has helped enterprises to focus on environmental governance issues, energy conservation, and emissions reduction during the process of production, which has reduced pollution emissions to some extent [61,62]. The progress of technology is another force to reduce eco-environment pressure [63,64]. On the one hand, technological progress is conducive to the governance of environmental pollution. As referenced by Grossman [65], the reform of production technology will reduce the intensity of pollution emissions. During the “11th Five-Year Plan” period, China’s technological progress contributed about 60% to the reduction of chemical oxygen demand (COD), and about 45% to the reduction of SO2 [66]. On the other hand, technological progress has promoted the upgrading of the industrial structure. The adjustment of industrial structure is conducive to improvements in energy efficiency [67]. Specifically, the structure of the energy industry has been changed. For example, the development of solar power, wind power, and hydropower technology could promote the efficient use of clean energy. Additionally, the improvement of industrial technologies for energy-saving, resource recycling, and environmental protection could promote the rapid development of the environmental protection industry [68]. As observed from our findings, the overall level of eco-environment pressure from the urban agglomeration has shown a downward trend from 2003 to 2017 (Figure 3b). Therefore, it can be inferred that the reduction of eco-environment pressure is driven to some degree by the implementation of protection policies and technological progress.
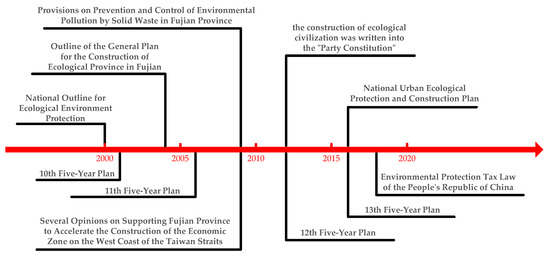
Figure 6.
The Plans and policies of government affecting eco-environment pressure in different periods.
Although policies and technologies have been improved and developed continuously, pollutant emissions have been effectively controlled, and environment pressure has also declined, air pollution is still a serious situation in China [69,70,71]. Nevertheless, due to the good resource endowment in the WTSUA, about 80% of the land is covered by forests and rich in biodiversity resources, there are more ecological advantages than some other areas [72]. Especially, Fujian province as the main component of the WTSUA, its number of days that the air met the standards accounted for 98.2%, which was 19.4% higher than the national average level in 2016. The annual average concentration of PM2.5 was 42.6% lower than the national average level. Moreover, the forest coverage rate of Fujian province reached 65.95%, ranking the first in the country [73]. This probably explains the reasons for the decreasing eco-environment pressure of WTSUA to some extent.
As referenced by Huang and Fang, Fang and Wang, and Liu et al. [74,75,76], a favorable eco-environment promotes and stimulates the sustainable and healthy urban development. The reduction of eco-environment pressure promotes the creation of a suitable living environment, attracting population agglomeration to the city. The concentration of the population is conducive to the improvement of socioeconomic efficiency and resource utilization efficiency, and thus urbanization quality is further improved. Furthermore, economic urbanization provides more investment for environmental protection. Policy interventions and up-to-date technology have allowed the pollution emissions to be controlled, and this also reduces eco-environment pressure. The mechanism of urbanization quality and eco-environment pressure is the interaction of two opposing forces, and once these are understood, coordinated development between urbanization quality and eco-environment pressure can be realized. Our results also suggested that the coupling coordination of urbanization quality and eco-environment pressures constantly increased (Figure 5).
4.2. Suggestions for Improving Sustainable Development between Urbanization Quality and Eco-Environment Pressure
Although the coupling relationship between urbanization quality and eco-environment pressure of the WTSUA has become more coordinated during the study period, there are still some issues that need to be addressed. Based on the above analysis, three suggestions are proposed that could be used as guidelines for achieving the coordinated development of urbanization quality and eco-environment pressure.
First, it is necessary to determine the development direction of each city. On the one hand, in order to give priority to the development of eco-environment protection, the eco-environment protection development model should be taken in coastal cities such as WZH and STO. Up-to-date technology should be introduced and investment increased to strengthen pollution control as well as improve resource utilization efficiency for the substantial development of a green economy in the future. On the other hand, a comprehensive development model should be adopted in inland cities such as GZH and SRA to jointly improve the urbanization quality and the eco-environment level. It is essential to take feasible measures to promote the development of a circular economy at the macro level, build ecological industrial chains at the meso level, and strengthen the use of cleaner production technologies at the micro level [77,78]. Second, it is advisable for urban planners and government policymakers to pay more attention to economic development and social security issues when formulating policies related to urban development. Third, the concept of eco-civilization should be cultivated and promoted. Eco-civilization education should be widely conducted, and eco-civilization concepts should be established across the whole of society. In order to provide more practical guidance to other regions, the optimal coupling coordination degree in the coupling process of urbanization quality and eco-environment pressure would be explored in further studies.
5. Conclusions
In this study, we assessed the level of urbanization quality, the trend of eco-environment pressure, and the coupling coordination relationship between urbanization quality and eco-environment pressure in the WTSUA, by combining AHP, EM, and a coupling coordination degree model. Our results showed that eco-environment pressure decreased with improving urbanization quality from 2003 to 2017. The coupling coordination level between urbanization quality and eco-environment pressure achieved stable and continuous improvement. Spatially, the coupling coordination level in the eastern region was generally higher than that in the western region. This study provides a scientific basis and effective measures for sustainable urban development.
Although a clear assessment of the spatiotemporal distribution and evolution of coupling coordination between urbanization quality and eco-environment pressure was examined in this paper, there was a lack of in-depth exploration of the interaction mechanism between the two systems. The next stage of this study will analyze the detailed relationships between the systems by using quantitative methods, such as material flows and information flows among various systems, as well as focus on the coupling process mechanism, to provide more practical guidance.
Author Contributions
Conceptualization, methodology, formal analysis, as well as writing—original draft preparation, review and editing, X.L. and C.L.; software and resources, Y.L.; validation, Y.S. and K.S.; investigation, L.Z.; data curation and visualization, X.L. and Y.G.; supervision, project administration and funding acquisition, C.L. All authors have read and agreed to the published version of the manuscript.
Funding
This research was jointly funded by the Social Science and Humanity on Young Fund of the Ministry of Education of China (No. 17YJCZH118), the Science and Technology Innovation Foundation of Fujian Agriculture and Forestry University (No. CXZX2016228), and the Science Foundation for Distinguished Young Scholar of Fujian Agriculture and Forestry University (No. XJQ201920).
Acknowledgments
We appreciate the satellite and geospatial data provided by the Northeast Branch of the National Earth System Science Data Center of China and also thank Leonie Seabrook, PhD, from Liwen Bianji, Edanz Group China (www.liwenbianji.cn/ac), for editing the English text of a draft of this manuscript.
Conflicts of Interest
The authors declare no conflict of interest.
References
- Cui, X.; Fang, C.; Liu, H.; Liu, X. Assessing sustainability of urbanization by a coordinated development index for an Urbanization-Resources-Environment complex system: A case study of Jing-Jin-Ji region, China. Ecol. Indic. 2019, 96, 383–391. [Google Scholar] [CrossRef]
- Wang, J.; Wang, S.; Li, S.; Feng, K. Coupling analysis of urbanization and energy-environment efficiency: Evidence from Guangdong province. Appl. Energy 2019, 254, 113650. [Google Scholar] [CrossRef]
- Tratalos, J.; Fuller, R.; Warren, P.; Davies, R.; Gaston, K. Urban form, biodiversity potential and ecosystem services. Landsc. Urban Plan. 2007, 83, 308–317. [Google Scholar] [CrossRef]
- Grimm, N.; Faeth, S.; Golubiewski, N.; Redman, C.; Wu, J.; Bai, X.; Briggs, J. Global change and the ecology of cities. Science 2008, 319, 756–760. [Google Scholar] [CrossRef] [PubMed]
- Wu, Y.; Shen, J.; Zhang, X.; Skitmore, M.; Lu, W. The impact of urbanization on carbon emissions in developing countries: A Chinese study based on the U-Kaya method. J. Clean. Prod. 2016, 135, 589–603. [Google Scholar] [CrossRef]
- National Bureau of Statistics of China. China Statistical Yearbook 2019; China Statistics Press: Beijing, China, 2019.
- Chen, J. Rapid urbanization in China: A real challenge to soil protection and food security. Catena 2007, 69, 1–15. [Google Scholar] [CrossRef]
- Liu, J.; Diamond, J. China’s environment in a globalizing world. Nature 2005, 435, 1179–1186. [Google Scholar] [CrossRef]
- Yang, X. China’s rapid urbanization. Science 2013, 342, 310. [Google Scholar] [CrossRef]
- Liu, Z.; Guan, D.; Moore, S.; Lee, H.; Su, J.; Zhang, Q. Climate policy: Steps to China’s carbon peak. Nature 2015, 522, 279–281. [Google Scholar] [CrossRef]
- Barbera, E.; Curro, C.; Valenti, G. A hyperbolic model for the effects of urbanization on air pollution. Appl. Math. Model. 2010, 34, 2192–2202. [Google Scholar] [CrossRef]
- Zhang, N.; Yu, K.; Chen, Z. How does urbanization affect carbon dioxide emissions? A cross-country panel data analysis. Energy Policy 2017, 107, 678–687. [Google Scholar] [CrossRef]
- Wang, Y.; Zhang, C.; Lu, A.; Li, L.; He, Y.; Tojo, J.; Zhu, X. A disaggregated analysis of the environmental Kuznets curve for industrial CO2 emissions in China. Appl. Energy 2017, 190, 172–180. [Google Scholar] [CrossRef]
- Almulali, U.; Ozturk, I. The effect of energy consumption, urbanization, trade openness, industrial output, and the political stability on the environmental degradation in the MENA (Middle East and North African) region. Energy 2015, 84, 382–389. [Google Scholar] [CrossRef]
- Martinez-Zarzoso, I. The impact of urbanization on CO2 emissions: Evidence from developing countries. Ecol. Econ. 2011, 70, 1344–1353. [Google Scholar] [CrossRef]
- Wang, S.; Ma, H.; Zhao, Y. Exploring the relationship between urbanization and the eco-environment—A case study of Beijing-Tianjin-Hebei region. Ecol. Indic. 2014, 45, 171–183. [Google Scholar] [CrossRef]
- Wang, Y.; Li, X.; Kang, Y.; Chen, W.; Zhao, M.; Li, W. Analyzing the impact of urbanization quality on CO2 emissions: What can geographically weighted regression tell us? Renew. Sust. Energy Rev. 2019, 104, 127–136. [Google Scholar] [CrossRef]
- Bao, C.; Zou, J. Exploring the coupling and decoupling relationships between urbanization quality and water resources constraint intensity: Spatiotemporal analysis for northwest China. Sustainability 2017, 9, 1960. [Google Scholar] [CrossRef]
- Zang, L.; Su, Y. Internal coordinated development of china’s urbanization and its spatiotemporal evolution. Sustainability 2019, 11, 626. [Google Scholar] [CrossRef]
- Shahbaz, M.; Loganathan, N.; Muzaffar, A.; Ahmed, K.; Jabran, M. How urbanization affects CO2 emissions in Malaysia? The application of STIRPAT model. Renew. Sust. Energy Rev. 2016, 57, 83–93. [Google Scholar] [CrossRef]
- Yurui, L.; Long, H.; Liu, Y. Industrial development and land use/cover change and their effects on local environment: A case study of Changshu in eastern coastal China. Front. Env. Sci. Eng. China 2010, 4, 438–448. [Google Scholar]
- Song, W.; Deng, X.; Yuan, Y.; Wang, Z.; Li, Z. Impacts of land-use change on valued ecosystem service in rapidly urbanized North China Plain. Ecol. Model. 2015, 318, 245–253. [Google Scholar] [CrossRef]
- Kalnay, E.; Cai, M. Impact of urbanization and land-use change on climate. Nature 2003, 423, 528–531. [Google Scholar] [CrossRef] [PubMed]
- Liu, N.; Liu, C.; Xia, Y.; Da, B. Examining the coordination between urbanization and eco-environment using coupling and spatial analyses: A case study in China. Ecol. Indic. 2018, 93, 1163–1175. [Google Scholar] [CrossRef]
- Zhao, Y.; Wang, S.; Ge, Y.; Liu, Q.; Liu, X. The spatial differentiation of the coupling relationship between urbanization and the eco-environment in countries globally: A comprehensive assessment. Ecol. Model. 2017, 360, 313–327. [Google Scholar] [CrossRef]
- Astaraie-Imani, M.; Kapelan, Z.; Fu, G.; Butler, D. Assessing the combined effects of urbanization and climate change on the river water quality in an integrated urban wastewater system in the UK. J. Environ. Manag. 2012, 112, 1–9. [Google Scholar] [CrossRef]
- Zhao, Y.W.; Wang, S.; Zhou, C. Understanding the relation between urbanization and the eco-environment in China’s Yangtze River Delta using an improved EKC model and coupling analysis. Sci. Total Environ. 2016, 571, 862–875. [Google Scholar] [CrossRef]
- Fang, C.; Cui, X.; Li, G.; Bao, C.; Wang, Z.; Ma, H.; Sun, S.; Liu, H.; Luo, K.; Ren, Y. Modeling regional sustainable development scenarios using the Urbanization and Eco-environment Coupler: Case study of Beijing-Tianjin-Hebei urban agglomeration, China. Sci. Total Environ. 2019, 689, 820–830. [Google Scholar] [CrossRef]
- Wang, Z.; Liang, L.; Sun, Z.; Wang, X. Spatiotemporal differentiation and the factors influencing urbanization and ecological environment synergistic effects within the Beijing-Tianjin-Hebei urban agglomeration. J. Environ. Manag. 2019, 243, 227–239. [Google Scholar] [CrossRef]
- He, J.; Wang, S.; Liu, Y.; Ma, H.; Liu, Q. Examining the relationship between urbanization and the eco-environment using a coupling analysis: Case study of Shanghai, China. Ecol. Indic. 2017, 77, 185–193. [Google Scholar] [CrossRef]
- Ding, L.; Zhao, W.; Huang, Y.; Cheng, S.; Liu, C. Research on the coupling coordination relationship between urbanization and the air environment: A case study of the area of Wuhan. Atmosphere 2015, 6, 1539–1558. [Google Scholar] [CrossRef]
- National Bureau of Statistics of China. China City Statistical Yearbook 2004–2019; China Statistics Press: Beijing, China, 2019.
- Jiang, A. Policy implications and development strategies for the planning in the West Taiwan Strait Urban Agglomeration. J. Fj. Par. Sch. 2012, 02, 71–77. [Google Scholar]
- Yu, Y.; Tong, Y.; Tang, W.; Yuan, Y.; Chen, Y. Identifying spatiotemporal interactions between urbanization and eco-environment in the urban agglomeration in the Middle Reaches of the Yangtze River, China. Sustainability 2018, 10, 290. [Google Scholar] [CrossRef]
- Yao, L.; Li, X.; Li, Q.; Wang, J. Temporal and spatial changes in coupling and coordinating degree of new urbanization and ecological-environmental stress in China. Sustainability 2019, 11, 1171. [Google Scholar] [CrossRef]
- National Aeronautics and Space Administration. MODIS ‘Vegetation Indices 16-Day L3 Global 250 m’ Product. Available online: https://ladsweb.modaps.eosdis.nasa.gov/search/ (accessed on 1 March 2018).
- Ma, Y.; Shi, T.; Zhang, W.; Hao, Y.; Huang, J.; Lin, Y. Comprehensive policy evaluation of NEV development in China, Japan, the United States, and Germany based on the AHP-EW model. J. Clean. Prod. 2019, 214, 389–402. [Google Scholar] [CrossRef]
- He, Y.X.; Jiao, Z.; Yang, J. Comprehensive evaluation of global clean energy development index based on the improved entropy method. Ecol. Indic. 2018, 88, 305–321. [Google Scholar] [CrossRef]
- Zhao, J.; Ji, G.; Tian, Y.; Chen, Y.; Wang, Z. Environmental vulnerability assessment for mainland China based on entropy method. Ecol. Indic. 2018, 91, 410–422. [Google Scholar] [CrossRef]
- Chen, W.; Shen, Y.; Wang, Y. Evaluation of economic transformation and upgrading of resource-based cities in Shaanxi Province based on an improved TOPSIS method. Sustain. Cities Soc. 2018, 37, 232–240. [Google Scholar] [CrossRef]
- Zhou, D.; Xu, J.; Wang, L.; Lin, Z. Assessing urbanization quality using structure and function analyses: A case study of the urban agglomeration around Hangzhou Bay (UAHB), China. Habitat Int. 2015, 49, 165–176. [Google Scholar] [CrossRef]
- Ma, F.; He, J.; Ma, J.; Xia, S. Evaluation of urban green transportation planning based on central point triangle whiten weight function and entropy-AHP. Transp. Res. Pro. 2017, 25, 3634–3644. [Google Scholar] [CrossRef]
- Duan, Y.; Mu, H.; Li, N.; Li, L.; Xue, Z. Research on comprehensive evaluation of low carbon economy development level based on AHP-Entropy method: A case study of Dalian. Energy Procedia 2016, 104, 468–474. [Google Scholar] [CrossRef]
- Chen, T.; Jin, Y.; Qiu, X.; Chen, X. A hybrid fuzzy evaluation method for safety assessment of food-waste feed based on entropy and the analytic hierarchy process methods. Expert Syst. Appl. 2014, 41, 7328–7337. [Google Scholar] [CrossRef]
- Cho, J.; Lee, J. Development of a new technology product evaluation model for assessing commercialization opportunities using Delphi method and fuzzy AHP approach. Expert Syst. Appl. 2013, 40, 5314–5330. [Google Scholar] [CrossRef]
- Gao, L.; Hailu, A. Identifying preferred management options: An integrated agent-based recreational fishing simulation model with an AHP-TOPSIS evaluation method. Ecol. Model. 2013, 249, 75–83. [Google Scholar] [CrossRef]
- Li, Y.; Li, Y.; Zhou, Y.; Shi, Y.; Zhu, X. Investigation of a coupling model of coordination between urbanization and the environment. J. Environ. Manag. 2012, 98, 127–133. [Google Scholar] [CrossRef]
- Cai, Z.; Li, Y.; Li, X. Coupling research on urbanization and ecological environment in Guiyang City. Ecol. Sci. 2017, 36, 196–203. [Google Scholar]
- Shi, L.; Yang, S. Assessment of eco-environmental stress in the Western Taiwan Straits Economic Zone. Sustainability 2015, 7, 2716–2729. [Google Scholar] [CrossRef]
- Yi, G.; Xu, J.; Zhao, J. Study on the synthetic measurement of the urbanization level in Anhui Province. Areal. Res. Dev. 2005, 24, 47–51. [Google Scholar]
- Lu, F.; Yu, B.; Liu, D. Urbanization development and spatial evolution of Jiangxi Province from 2000 to 2010. Resour. Environ. Yangtze Basin Dev. 2013, 22, 1257–1263. [Google Scholar]
- Wang, S.; Fang, C.; Wang, Y. Quantitative investigation of the interactive coupling relationship between urbanization and eco-environment. Acta. Ecol. Sin. 2015, 35, 2244–2254. [Google Scholar]
- Haken, H. Synergetics Introduction and Advanced Topics; Springer: Berlin/Heidelberg, Germany, 2004. [Google Scholar]
- Fang, C.; Wang, D. Comprehensive measures and improvement of Chinese urbanization development quality. Geogr. Res. 2011, 30, 1931–1946. [Google Scholar]
- Xu, S.; Miao, Y.; Gao, C.; Long, R.; Chen, H.; Zhao, B.; Wang, S. Regional differences in impacts of economic growth and urbanization on air pollutants in China based on provincial panel estimation. J. Clean. Prod. 2019, 208, 340–352. [Google Scholar] [CrossRef]
- Bai, Y.; Deng, X.; Gibson, J.; Zhao, Z.; Xu, H. How does urbanization affect residential CO2 emissions? An analysis on urban agglomerations of China. J. Clean. Prod. 2019, 209, 876–885. [Google Scholar] [CrossRef]
- Zhou, C.; Wang, S.; Wang, J. Examining the influences of urbanization on carbon dioxide emissions in the Yangtze River Delta, China: Kuznets curve relationship. Sci. Total Environ. 2019, 675, 472–482. [Google Scholar] [CrossRef] [PubMed]
- Wang, J.; Dong, Z.; Jiang, H.; Lu, J. Historical evolution and reform of China’ s environmental strategy and policy during the past seventy years (1949–2019). Res. Environ. Sci. 2019, 32, 1636–1644. [Google Scholar]
- Su, Y.; Lu, C.; Lin, X.; Zhong, L.; Gao, Y.; Lei, Y. Analysis of spatio-temporal characteristics and driving forces of air quality in the Northern Coastal Comprehensive Economic Zone, China. Sustainability 2020, 12, 536. [Google Scholar] [CrossRef]
- Hansen, M.; Li, H.; Svarverud, R. Ecological civilization: Interpreting the Chinese past, projecting the global future. Glob. Environ. Chang. 2018, 53, 195–203. [Google Scholar] [CrossRef]
- Gu, Y.; Wu, Y.; Liu, J.; Xu, M.; Zuo, T. Ecological civilization and government administrative system reform in China. Resour. Conserv. Recycl. 2020, 155, 104654. [Google Scholar] [CrossRef]
- Ma, T.; Duan, M. Research on the effect of environmental protection tax policy. Tim. Fort. 2019, 07, 149–151. [Google Scholar]
- Guo, Y.; Xia, X.; Zhang, S.; Zhang, D. Environmental regulation, government R&D funding and green technology innovation: Evidence from China provincial data. Sustainability 2018, 10, 940. [Google Scholar] [CrossRef]
- Zhai, X.; An, Y. Analyzing influencing factors of green transformation in China’s manufacturing industry under environmental regulation: A structural equation model. J. Clean. Prod. 2020, 251, 119760. [Google Scholar] [CrossRef]
- Grossman, G.; Krueger, A. Economic growth and the environment. Q. J. Econ. 1994, 110, 353–377. [Google Scholar] [CrossRef]
- Li, B.; Xie, P.; Li, X.; Tang, H. Technological progress and energy efficiency and environmental protection—The empirical research based on inter-provincial panel data in China. Sci. Technol. Econ. 2010, 23, 51–54. [Google Scholar]
- Newell, R.; Jaffe, A.; Stavins, R. The induced innovation hypothesis and energy-saving technological change. Q. J. Econ. 1998, 114, 941–975. [Google Scholar] [CrossRef]
- Zhang, W.; Jiang, H.; Wang, J.; Zeng, W.; Zhang, J. The role and contribution of science and technology innovation on the ecological civilization construction. Chin. J. Environ. Manag. 2015, 7, 52–56. [Google Scholar]
- Wang, H.; Xu, J.; Zhang, M.; Yang, Y.; Shen, X.; Wang, Y.; Chen, D.; Guo, J. A study of the meteorological causes of a prolonged and severe haze episode in January 2013 over central-eastern China. Atmos. Environ. 2014, 98, 146–157. [Google Scholar] [CrossRef]
- Wu, C.; Hu, W.; Zhou, M.; Li, S.; Jia, Y. Data-driven regionalization for analyzing the spatiotemporal characteristics of air quality in China. Atmos. Environ. 2019, 203, 172–182. [Google Scholar] [CrossRef]
- Feng, Y.; Ning, M.; Lei, Y.; Sun, Y.; Liu, W.; Wang, J. Defending blue sky in China: Effectiveness of the “Air Pollution Prevention and Control Action Plan” on air quality improvements from 2013 to 2017. J. Environ. Manag. 2019, 252, 109603. [Google Scholar] [CrossRef]
- Zhu, W.; Tang, L.; Xu, L.; Xiang, X. Eco-efficiency of the Western Taiwan Straits Economic Zone: An evaluation based on a novel eco-efficiency model and empirical analysis of influencing factors. J. Clean. Prod. 2019, 234, 638–652. [Google Scholar] [CrossRef]
- China Environment News. Party and Government Blame for New Environmental Protection in Fujian. Available online: http://epaper.cenews.com.cn/html/2017-03/02/content_56426.htm (accessed on 2 March 2017).
- Huang, J.; Fang, C. Analysis of coupling mechanism and rules between urbanization and eco-environment. Geogr. Res. 2003, 22, 79–88. [Google Scholar]
- Fang, C.; Wang, J. A theoretical analysis of interactive coercing effects between urbanization and eco-environment. Chin. Geogr. Sci. 2013, 23, 147–162. [Google Scholar] [CrossRef]
- Liu, J.; Dietz, T.; Carpenter, S.; Alberti, M.; Folke, C.; Moran, E.; Pell, A.; Deadman, P.; Kratz, T.; Lubchenco, J. Complexity of coupled human and natural systems. Science 2007, 317, 1513–1516. [Google Scholar] [CrossRef] [PubMed]
- Yuan, Z.; Bi, J.; Moriguichi, Y. The circular economy: A new development strategy in China. J. Ind. Ecol. 2008, 10, 4–8. [Google Scholar] [CrossRef]
- Fan, Y.; Fang, C.; Zhang, Q. Coupling coordinated development between social economy and ecological environment in Chinese provincial capital cities-assessment and policy implications. J. Clean. Prod. 2019, 229, 289–298. [Google Scholar] [CrossRef]
© 2020 by the authors. Licensee MDPI, Basel, Switzerland. This article is an open access article distributed under the terms and conditions of the Creative Commons Attribution (CC BY) license (http://creativecommons.org/licenses/by/4.0/).